Blog

  • The Hunt for RFI: Unjamming a Coast Harbor

    The Hunt for RFI: Unjamming a Coast Harbor

    By James R. Clynch, Andrrew A. Parker, Richard W. Adler, and Wilbur R. Vincent, Naval Postgraduate School; Paul McGill and George Badger, Monterey Bay Aquarium Research Institute

    “Mr. Holmes, they were the footprints of a giant hound!”

    Engineers-turned-sleuths in Moss Landing Harbor, California, had a similar clue to go on: the tracks of a GPS jammer across a spectrum analyzer. For months, the elusive culprit had jammed GPS signals in the harbor. The team of engineers roamed the waterfront with a spectrum analyzer and receiver. They identified and apprehended not one, but two distinct suspects, and unearthed evidence of the existence of a third — all readily available, commercial-grade television antennas.

    After interrogation in the laboratory, tahe guilty devices were turned over to the authorities for appropriate action.

    opener-W
    A view from the location of an unintentional GPS jammer across Moss Landing Harbor to the Monterey Bay Aquarium Research Institute. A GPS receiver with its antenna on the other side of the roof was continuously jammed for months.

    In April 2001, the captain of the research vessel PT SUR, based in Moss Landing, California, made a radio telephone call from at-sea to one of the authors, stating that signal reception of GPS in the whole of Moss Landing Harbor was jammed. He was advised to contact the U.S. Coast Guard (USCG) and the Federal Communication Commission (FCC). When the problem persisted for another month, we launched an effort at the local level to determine the cause of the jamming.

    Moss Landing is a moderate-sized harbor about 100 kilometers south of San Francisco, in the middle of Monterey Bay. It has a mixed fleet of working fishing boats, pleasure craft, and three large research vessels used by the local scientific community.

    The Naval Postgraduate School (NPS), with a large program in science and engineering, is located at the south end of Monterey Bay. The Monterey Bay Aquarium Research Institute (MBARI) has its headquarters in Moss Landing and two major research vessels berthed there. This organization supports the Monterey Bay Aquarium and also has a large engineering program, especially in underwater remotely operated vehicles.

    Photo-locations-W
    Locations of the RFI emitter and MBARI; power plant upper right.

    MBARI has used GPS for precision location of their vessels since the early 1990’s, before the U.S. Coast Guard set up their system of DGPS stations along the coast. MBARI, with assistance from NPS, set up a differential station at their location at Moss Landing, using a UHF data link to send the corrections to their vessels.

    After the April jamming report, NPS set up a monitor of the MBARI DGPS corrections to log the number of satellites being tracked. This clearly showed that the station was being heavily jammed. Reports of other GPS users in Moss Landing confirmed that it was a jamming issue and not a faulty receiver.

    The jamming had impacted MBARI in several ways, including causing it to loose its GPS-based high-accuracy time reference. It would have caused difficulty at the narrow harbor entrance in fog. In at least two cases it caused small-boat owners to buy new GPS receivers, only to find they still could not get GPS in and around Moss Landing. One of the major ships in the harbor paid for a technician and new equipment to fix the problem, but finally had to turn off GPS in the harbor area, give the alarm that GPS was off line, and use radar only for harbor entrances in bad weather.

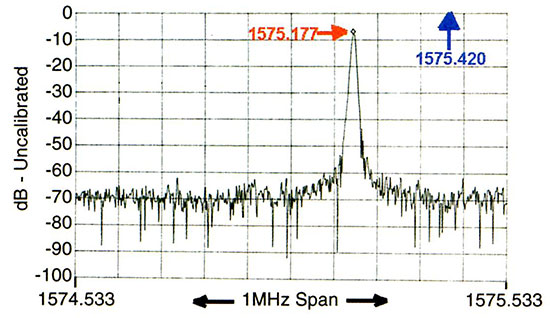
    The GPS signal that feeds the MBARI reference station was also distributed to several laboratories and offices in the MBARI headquarters building, through a series of splitters and inline amplifiers. In an office with one of these drops, we set up a high-quality spectrum analyzer to examine the energy in a wide band about the GPS L1 frequency. Because there were several long cables and amplifiers between the antenna and the spectrum analyzer, the signals were not calibrated at the time they were taken. Later the system was calibrated. Figure 1 shows an example of the data recorded with a clear peak from the radio frequency interference (RFI) source many dB above the level of the GPS signals.

    Figure 1. spectrum of Source-1 on a spectrum analyzer, VBW 3 KHz, RBW 3 KHz.
    Figure 1. spectrum of Source-1 on a spectrum analyzer, VBW 3 KHz, RBW 3 KHz.

    Identifying Source-1

    We began our search for the source of the jamming radiation in early May, 2001, spending several days looking for it. Two factors complicated the effort: the large number of metal objects that reflected the energy, and the shifting of the frequency of the emitter.

    George Badger fabricated a 17-element antenna with about a 30-degree beamwidth and used this with a portable communications receiver, a general purpose radio that fit in a shirt pocket. The initial search drove along the roads in the area and stopped at widely spaced locations to record the peaks of the RFI signal. We found multiple peaks in all locations, coming from the many reflecting structures in the area, including the largest conventional power plant in California.

    antenna-jam-W
    From its normal location inside the paint locker (see arrow), the antenna jammed all of Moss Landing Harbor and an area at least 1 kilometer out to sea.

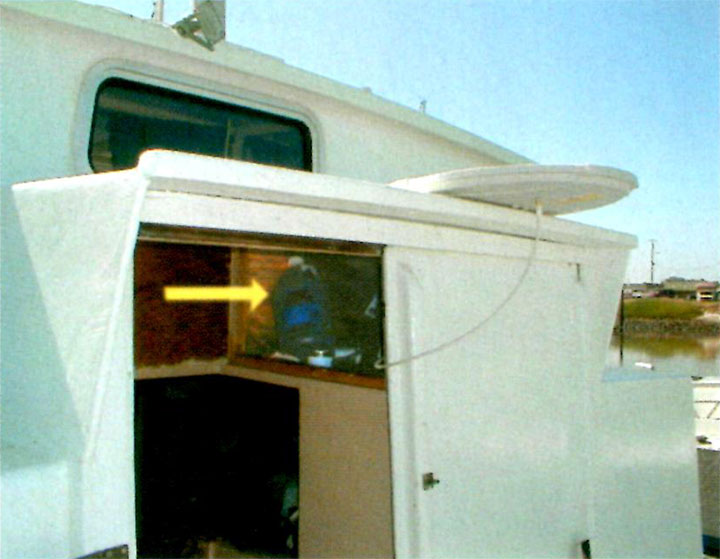
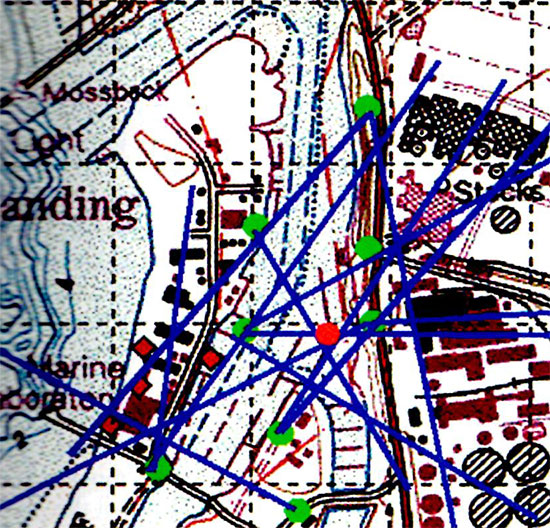
    Figure 2 shows the locations where bearings were taken as green circles, and the bearings in blue. The red circle shows the actual location of the emitter. Without the red dot, it is hard to define where the most likely position is. After ruling out the power plant, we decided to look where there were no building or other reflectors.

    Figure 2. Search for bearing for Source-1.
    Figure 2. Search for bearing for Source-1.

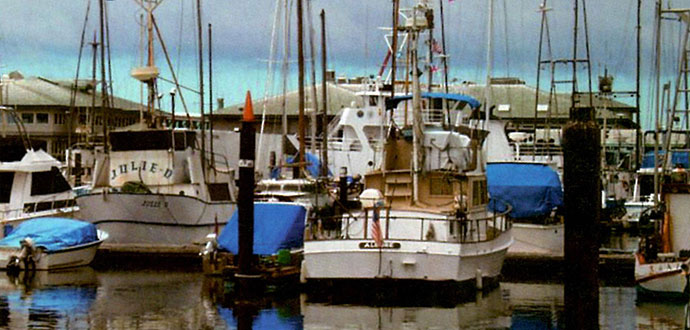
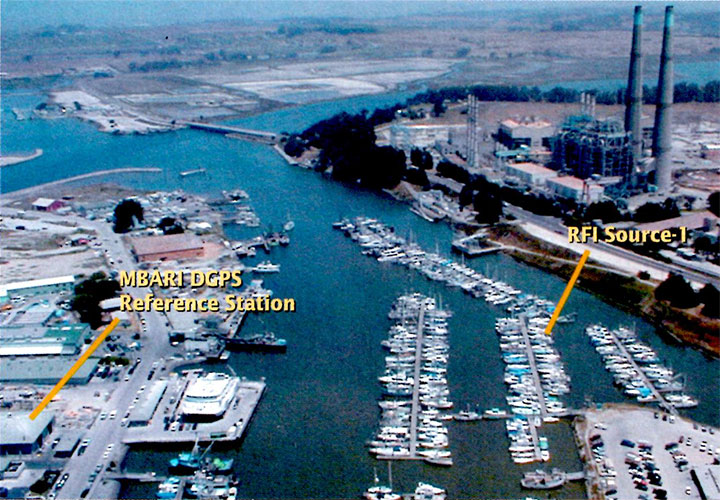
    Closing In. The team put the spectrum analyzer on a cart along with the small radio, and took them to the dock area. Even then it was confusing. Only by turning off shore power to individual boats could we determine the actual emitter location. The signal stopped and started again as we turned power to the vessel emitting the RFI signal off and on. The photograph, taken by a “kite camera” at about 200 meters, shows the locations of the RFI emitter, MBARI, and the power plant.

    Source-1 with cover open, showing the small preamplifier that jammed GPS.
    Source-1 with cover open, showing the small preamplifier that jammed GPS.

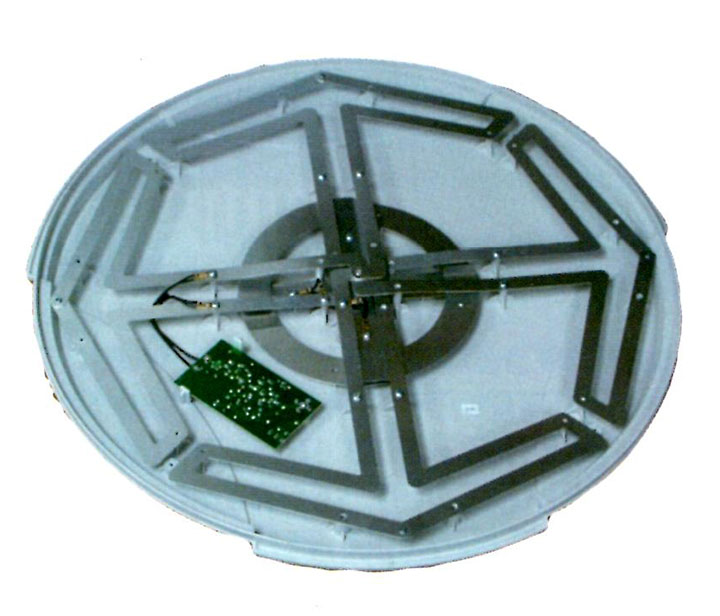
    We contacted the boat owner and gained access, quickly determining that the emitter was a commercially available VHF/UHF television antenna with built-in preamplifier. The antenna was powered by an AC/DC adapter plugged into boat AC power. The preamplifier was thus powered all the time, even when the TV was not on. In fact, the TV was seldom on, and most of the time the TV antenna was in a paint locker inside the locked boat. From this interior location, its emissions jammed all of Moss Landing Harbor and an area at least 1 kilometer out to sea.

    The day after we located the jamming antenna, we purchased it from the owner, took it to NPS for study, and informed the Federal Communications (FCC) San Francisco field office. We also distributed a memorandum describing the facts of the case to the U.S. Coast Guard and the GPS Joint Program Office (JPO).

    Characteristics of Source-1

    At the Naval Postgraduate School, we studied the antenna under controlled conditions and found it to have an internal preamplifier that exhibited unintended oscillations. The unit was normally powered from an inexpensive 12-volt AC/DC converter. In the tests it was powered from both this unit and a battery.

    We studied the characteristics of the emission using another spectrum analyzer with its output sent to a waterfall display.

    The unit proved extremely sensitive to the physical and electrical environment. We knew this from our search procedure, when modulation on the signal was recognized by its distinctive sound as a boat bilge pump. In an ad hoc experiment, we noted that the frequency varied over 3 MHz when one of us slowly moved his hand about 20 centimeters when it was 3 meters from the antenna. This is shown on the left in Figure 3. When the hand was held still, the frequency was much more stable, as seen by the section at the top of the traces.

    Figure 3. Frequency changes in Source-1 caused by environmental factors.
    Figure 3. Frequency changes in Source-1 caused by environmental factors.

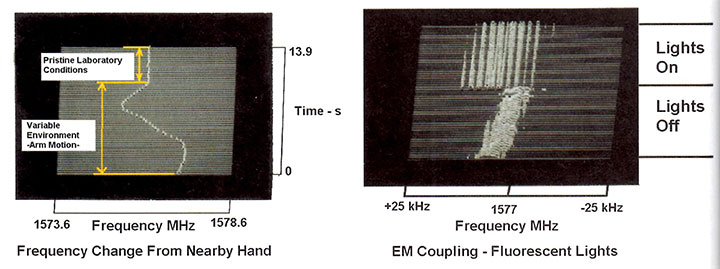
    In another case, when running on batteries, the spectral pattern changed considerably when the overhead fluorescent lights were turned on and off. This effect is shown on the right. In order to get the narrow lines in the “lights on” condition, the spectrum analyzer was synchronized to the AC line frequency. We also found that the operation of a low-powered, hand-held transceiver (100 mW) operation at 150 MHz and 450 MHz caused large shifts in the oscillation center frequency.

    To better investigate the electromagnetic coupling, we placed the unit in a good screen room. We were interested to see if you needed an external RF field from the lights, for example. It still oscillated, indicating that the oscillation would emit RFI energy just by being turned on. No special external conditions were required.

    We obtained several other tests results, but conclude principally that the oscillation was self-exciting and very sensitive to environmental conditions.

    The Suspects Multiply

    During the hunt for RFI Source-1, NPS monitored the DGPS corrections broadcast by MBARI, automatically recording and plotting the total number of satellites for which corrections were generated every few days. While Source-1 was active, there were no satellites being tracked.

    A few days after Source-1 was removed, we again plotted this log. Much to our surprise, there were still long periods when the MBARI GPS receiver was tracking few or no satellites. The MBARI GPS receiver was being jammed during most nights. Figure 4 shows a plot of the number of satellites tracked.

    Jamming of MBARI GPS after Source-1 was removed from harbor.
    Jamming of MBARI GPS after Source-1 was removed from harbor.

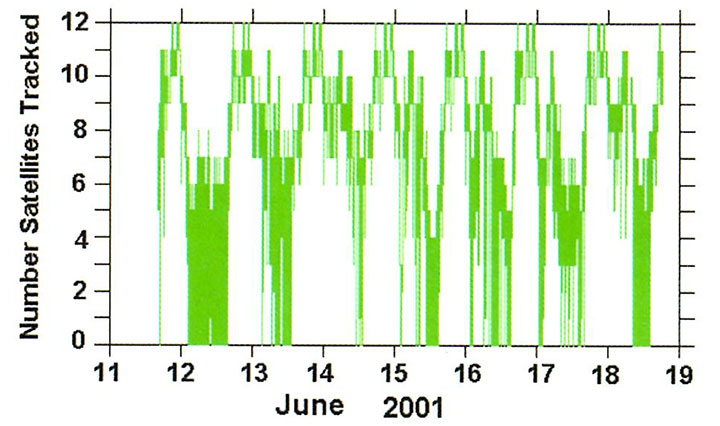
    We conjectured that the jamming’s diurnal pattern derived from the temperature sensitivity of the second jammer’s center frequency. This turned out to be correct. The jamming was correlated with temperature and ended most days before 11 am.

    This told us that we would have to hunt the source location at night and early morning.

    Field Operations. The San Francisco FCC field office sent a team several times to Moss Landing to hunt for Source-2, and on several days both MBARI and NPS assisted. The MBARI high-quality spectrum analyzer monitored the signal from the laboratory this time, showing that its frequency moved during the morning hours and its level decreased as the temperature rose. We sent this frequency via cell telephone to the mobile team in the harbor seeking the RFI source. Figure 5 shows a typical early morning spectrum taken after removal of Source-1. Again the hunt was not easy.

    Figure 5 shows a typical early morning spectrum taken after removal of Source-1. Several signals are visible in this spectrum, in addition to a broad peak in the middle from the GPS satellites. This was not seen in the spectra taken earlier because Source-1 masked it. The peak in the GPS band comes from Source-2.
    Figure 5 shows a typical early morning spectrum taken after removal of Source-1. Several signals are visible in this spectrum, in addition to a broad peak in the middle from the GPS satellites. This was not seen in the spectra taken earlier because Source-1 masked it. The peak in the GPS band comes from Source-2.

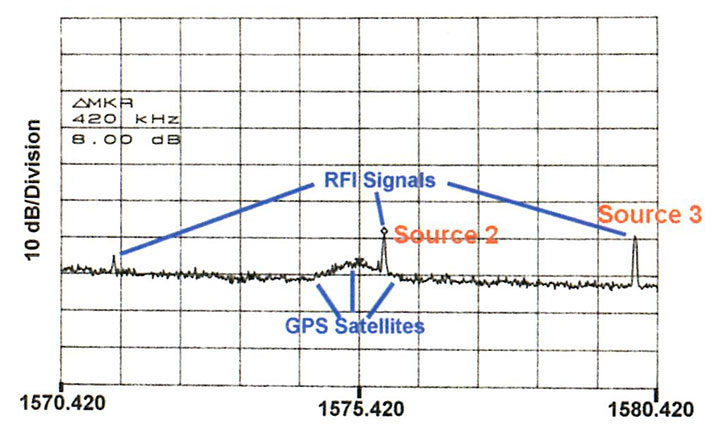
    On the second FCC trip to Moss Landing Harbor, the signal in the GPS band had dropped by 10 dB in the late morning. We decided to hunt for the source of of a higher-level signal just outside the GPS band. This is the line at about 1580 MHz shown in Figure 5. The combined group quickly located the source of this signal. Again the combined use of a spectrum analyzer and portable receivers with a narrow-beam antenna was important. We also monitored the frequency on the spectrum analyzer inside MBARI and relayed the current value to the field team by cell telephone.

    Authors Badger and McGill with a 13-element yagi antenna and communications receiver used in dockside search.
    Authors Badger and McGill with a 13-element yagi antenna and communications receiver used in dockside search.

    In the end, turning the power on and off to a few boats and correlating this with the RFI signal identified the culprit. It turned out to be a another commercially-available UHF/VHF television antenna on a boat, one dock over from Source-1. When it was turned off, only the line near 1580 MHz went away. Therefore we labeled this perpetrator as Source-3. This owner returned the unit to the place of purchase for a replacement.

    The FCC has determined that the preamplifiers in Source-3 and Source-1 came from the same factory, which sold units to at least four well-known U.S. brand names of consumer electronic equipment. The bad units apparently began with a design change in late 2000; the number of units sold is not known to the authors.

    Suspect Roundup. It is now clear that there were at least three signals capable of jamming GPS in the Moss Landing Harbor area. Two were located and removed by a coordinated effort of MBARI, NPS and the FCC.

    The FCC made a few more attempts to locate Source-2 during the summer, but its level was lower with the higher temperatures. In the fall of 2001, the FCC succeeded in locating Source-2. It again turned out to be a VHF/UHF television antenna with preamplifier.

    Calibration

    There were a large number of spectra taken in the MBARI office. The signal came in the DGPS reference station antenna and went through two splitters and one inline amplifiers in the approximately 80 meters of low loss cable before emerging in the engineering office. Rather than examining the individual elements, we decided to calibrate the entire system.

    A calibrated source was sent to a standard antenna about 2 meters from the antenna. The same analyzer used to acquire data on the RFI sources was configured as it had been for the experimental data. The antenna manufacturer supplied beam patterns for the antenna. In this way, the signals were now calibrated at the level outside of the antenna.

    There still is an uncertainty about the space loss and antenna beam pattern gain/loss for actual sources. The latter can be found for the signals located, but not unknown signals such as Source-2. Accordingly the data were calibrated as a power level at the outside of the MBARI antenna.

    Comparison to a RFI Specification

    The composite Figure 6 shows one spectra, now calibrated to dBm outside the antenna, and a specification for the RFI levels. This is the specification that aircraft GPS receivers used for GPS landing systems must meet. The values measured from several other spectra taken at MBARI have also been plotted on this figure. Clearly these signals were above the narrow band limits by amounts from 3 to 24 dB.

    Source-1 had the highest level at -96 dBm. Its location is known to have been 325 meters from the MBARI antenna. It was at an elevation angle of -2.5 degrees. While the beam pattern of Source-1 is unknown, if it were omni-directional, it would exceed this FAA specification at a range of 50 kilometers or more. It is known to have caused marine GPS receivers to lose lock out to 3 kilometers. The effective power of this source can only be bounded from the data available. It is at least a few milliwatts.

    Source-2 varied in frequency and level. While on top of the L1 frequency, it had a level of -106 dBm. Source-3 had a level at MBARI of -99 dBm. While it was about 12 MHz from the center of L1, the variation in manufacture is likely to have produced units with emissions much nearer L1.

    Conclusions

    In one small California harbor, at least three emitters capable of jamming commercial GPS receivers were present. Two were located and removed by the authors. They were active UHF/VHF TV antennas and appeared to have the same internal preamplifier. The FCC has located and removed the third.

    Locating these sources proved difficult. It required a spectrum analyzer with averaging capabilities on a broadband antenna to track the jammer frequency and a narrow-band portable receiver with a directional antenna to localize it. Even then, a power on/off test was needed to verify that the source had indeed been found.

    The existence of the jamming was well-known in Moss Landing Harbor, and reported at least once to appropriate agencies. However, the problem persisted until local engineers and scientist hunted down the worst offender. Clearly there was a system problem with reporting and removal of RFI sources. More education of harbor masters or some other change needs to be implemented to deal more quickly with this type of problem.

    Acknowledgement

    Gary Thurmond, a retired MBARI engineer, provided technical advice and participated in the location of Source-1 and took the aerial photograph of Moss Landing Harbor.


    James R. Clynch is a research professor at the Naval Postgraduate School in Monterey, California, and has worked for 30 years in the use of satellite navigation systems for precision positioning and to study propagation effects. He has a PhD from Brown University.

    Andrew A. Parker, Richard W. Adler, and Wilbur R. Vincent are research professors in the Department of Electrical and Computer Engineering at the Naval Postgraduate School. Their PhDs are from University of Maryland, Pennsylvania State University, and Michigan State University, respectively.

    Paul McGill is an electrical engineer and George Badger a microwave technician at the Monterey Bay Aquarium Research Institute.

    Manufacturers

    The MBARI differential station uses a Trimble RL 4000 GPS receiver. The waterfront search employed a Hewlett Packard 8562 spectrum analyzer and an An ICOM IC-R3 5 communications receiver. A Hewlett Packard 8562E spectrum analyzer was used at NPS to study the emissions. Trimble Navigation provided a beam pattern for the specific antenna used on the MBARI roof, and the antenna used for calibration.


  • Billions per Second

    “Remember that time is money.”

    —Advice to a Young Tradesman, 1748

    For those who take Benjamin Franklin’s admonition very, very seriously, there is now GPS. Network managers for financial institutions recognize that GPS provides the fastest, best, and cheapest source for exact time determination.

    In a white paper, “The Importance of Network Time Synchronization,” Paul Skoog of TrueTime, Inc highlights precise timing’s critical role in transaction processing (see ). Financial institutions from mortgage brokers to stock markets use millions of servers and workstations of all types and functions, networked together and executing a blinding rush of transactions, at rapid changes of value from second to second. In just one instance of everyday fluctuations, the chart above depicts the closing minutes of Intel trading on the New York Stock Exchange stock, November 14, 2001— at an average rate of six transactions/second, and up to 20 per second during intense trading.

    Frequently traders, both business and individual, call their brokering institution to dispute the recorded value of a transaction. In resolving these issues, the time of transaction is critical. Even more critical is the order of the transaction among thousands or millions of others.

    The National Association of Securities Dealers (NASD) now requires its 5,500 members in 82,000 U.S. branch offices to time-stamp all transactions within a 3-second accuracy or better.

    Brokers actually have a higher requirement than that, driven by the need to place transactions in a correct sequence of execution, particularly if there are many nearly simultaneous transactions. Since computer operations happen automatically and quickly, system clock resolution must be less than the minimum transaction composition and transmission time, leading to a need for 5–20 millisecond resolution.

    Computers compute. They do not keep time very well. Based on inexpensive oscillator circuits or quartz crystals, they can easily drift seconds or minutes per day. Many clocks continually drifting apart put network operations at risk.

    The use of GPS as a time-reference standard by financial houses from stock exchanges to offshore banks constitutes another reason the Heritage Foundation advises designating GPS as a critical infrastructure: it underpins the aggregate financial network — and, some might argue, Western society itself.

    Future Stock

    Gerard Lyons, Jim Duggan, and Paraic Quinn at Ireland’s University of Galway are investigating current and possible future applications of distributed time-synchronization to enable transaction timestamping in an agent-based system. They have set up a “Stratum-1” (defined as microsecond-accurate) Network Time Protocol (NTP) server, used by other NTP servers and clients in Europe for time synchronization.

    These researchers state that “tightly-coupled, vertically-integrated supply chains are giving way to more fluid ‘value constellations’ connecting suppliers, intermediaries and customers through real-time information conduits.” They predict the development of “virtual enterprises, temporary networks of companies that come together quickly to exploit fast changing opportunities. An intelligent electronic broker might create a virtual enterprise to execute a single transaction.”

    In this vision of future e-commerce, timing is everything .

    Manufacturers

    The New York Stock Exchange, the World Bank, and other financial institutions utilize TrueTime’s (now Symmetricom) TimeVault product line of NTP servers. Datum (also part of Symmetricom) and Spectracom Corporation, among other companies, also supply NTP servers to financial houses. The University of Galway’s timeserver uses Trimble’s Acutime 2000 GPS synchronization kit.

  • Innovation: Assisted GPS: A Low-Infrastructure Approach (PDF)

    Innovation: Assisted GPS: A Low-Infrastructure Approach (PDF)

    By Jimmy LaMance, Javier DeSalas, and Jani Järvinen

    Published: March 2002 GPS World

    Have you ever tried to use a GPS receiver indoors? Chances are, unless you were on the top floor of a wood-frame house and using a receiver with ample antenna gain, you couldn’t get a position fix. GPS is a marvelous positioning tool but it does have some weaknesses, one of which is low signal power. And unlike cellular telephones, conventional GPS receivers do not work well, if at all, unless their antennas have a clear view of the sky. Although future GPS satellites will transmit signals with higher power, it will be a decade or more before the current constellation of satellites is fully replaced. In the meantime, how can GPS be used in skyscraper canyons, inside office buildings, and even in underground parking garages? Assisted GPS comes to the rescue! In this month’s column, a team of researchers from the United States and Finland describe their approach for assisted GPS — one which does not require a huge infra- structure investment for service providers.

  • GPS Inside – March 2002

    NovAtel Names Ladd CEO

    NovAtel Inc. of Calgary, Alberta, Canada, appointed Jonathan W. Ladd as president and chief executive officer, effective February 19, 2002. Jim Close, chairman of NovAtel, named Ladd to succeed David Vaughn, who had filled the positions since February 2001. Vaughn will continue in a consulting capacity.

    Ladd recently served as senior vice president engineering and president at Magellan Corporation’s Russian subsidiary, Ashtech A/O, and has held other senior management positions at Magellan.

    NovAtel also appointed Charles R. Trimble to the company’s board of directors. Trimble co-founded Trimble Navigation Limited and served as its president and CEO from 1981 to 1998. He holds four patents in signal processing and several in GPS, and currently serves as chairman of the U.S. GPS Industry Council (USGIC). He has a masters degree in electrical engineering from the California Institute of Technology.

    Spirent’s PPS Simulator: U.S. Subsidiary Targets DoD

    Spirent Communications has announced the formation of a subsidiary, Global Secure Systems, to provide classified GPS simulation products to the U.S. Department of Defense. These will include equipment capable of generating the Precise Positioning Service (PPS) signal and the new military M-code.

    A wholly owned business group of UK-based Spirent plc, Spirent Communications has established Global Secure Systems under a proxy agreement with the U.S. Defense Security Service to enable the company to compete for U.S. government contracts that require classified security clearances.

    Global Secure Systems will be based in Yorba Linda, California, and led by a three-member team with extensive experience in U.S. security and defense operations. Ellen Hall, president and CEO, has more than 20 years experience in the aerospace industry, most recently as vice president of L-3 Communications’ Interstate Electronics Corporation. Former U.S. Secretary of the Navy Larry Garrett will serve as chairman of the board for the new company. Jack Devine, previously deputy director for technology and systems at the U.S. National Security Agency, will also sit on the company’s board.

    Steve Naylor, formerly Spirent Communications’ government sales manager, will serve as vice-president of business development for Global Secure Systems.

    Currently, Spirent Communications claims to hold about 65 percent of the GPS satellite simulator market on sales of products developed by its Global Simulation Systems division development team based in Paignton, Devonshire, UK, and headed by Peter Boulton.

    Spirent currently supplies unclassified simulators to the GPS Joint Program Office (JPO) and other U.S. defense agencies, which then enhance the equipment with classified hardware and software. The Global Secure proxy agreement will allow the company to build and deliver complete PPS-capable equipment, says Hall.

    Spirent Global Simulation already markets PPS-capable products to European members of NATO who have signed a memorandum of understanding with the JPO. Global Secure hopes to have a pseudo-M-code simulator available soon and a full M-code simulator on the market within the next year or so.

    GPS Rides Cable Cars, Olympic Trains

    The city of San Francisco has contracted with NextBus Information Systems of Emeryville, California, to provide real-time arrival information for its public transit system’s (MUNI) fleet of a thousand-plus buses and trains. Even San Francisco’s 19th-century cable cars will carry the GPS-based system. NextBus systems track selected routes in 20 U.S. public transit systems, but San Francisco now becomes the first city to equip its entire fleet. The $9.6 million contract calls for installation on all lines within five years, and includes 430 electronic information signs at transit stops across the city.

    Each bus or train will carry an AirLink Pinpoint unit combining a 12-channel Conexant Jupiter 11 GPS receiver with a cellular digital packet data (CDPD) modem to track and transmit location, vehicle ID, current route assignment, and other data to the NextBus information center. (SiRF Technology acquired Conexant’s GPS chipset business in July 2001 and now supports the Zodiac chipset within the Jupiter receiver. Conexant continues to make the Jupiter board.)

    NextBus estimates vehicle arrivals at stops along the line by factoring in actual position, intended stops, and typical traffic patterns.

    Passengers can view vehicle location and estimated arrival times on electronic signs at transit stops, on wireless devices such as PDAs and cell phones, and at the NextBus website. They can reduce waiting times and exposure to weather, and receive web alerts when their bus reaches a certain distance from home or office. A 2001 Delaware trial increased route ridership by 13.5 percent. The system also increases transit managers’ ability to respond to unexpected events in real time.
    NextBus operated a three-month trial run in San Francisco in summer 1999, along the #22 Fillmore route. After positive rider response, the city asked NextBus to extend the service to metro trains and to include transit information on the Internet as well as at the stops.

    Winter Olympics. The million-plus train riders at the 2002 Olympic Winter Games in Salt Lake City rode to their events informed by a tracking system from GeoFocus, of Boca Raton, Florida. Hardware installed by Utah Transit Authority on its light rail cars includes two Ashtech G8 receivers on each of 33 cars, plus 24 “rovers” aboard loaner cars borrowed for the Olympics. The system provides audio and text messaging at 20 stations, notifying passengers when the next train will arrive.

    Geofocus, a Sumitomo Corporation subsidiary, also installed its TrainTrac system on 264 trains serving 11 commuter lines in the Chicago METRA System in December 2001. These units incorporate Trimble Lassen SK2 receivers.

    Chinese GPS Group

    The International Association of Chinese Professionals in Global Positioning Systems (CPGPS) is a new non-profit professional organization whose members are Chinese and other interested professionals from academic institutions and industrial sectors in Asia, Australia, Europe and North America.

    The association’s electronic publication, the Journal of Global Positioning Systems, will deliver research findings, report progress, and exchange ideas. The CPGPS will also develop research programs and establish a newsletter for advice, consultation and debating of GPS issues. For further information see the organization’s web page www.cpgps.org.

    IEC SAASM, Missile Defense

    The Interstate Electronics Corporation (IEC) division of L-3 Communications has introduced its TruTrak 12-channel Selective Availability Anti-Spoofing Module (SAASM)-based GPS receiver for military applications. TruTrak meets high-G platform requirements but is also configurable for range, avionics, or handheld navigation platforms. The company states C/A and P(Y)-code signal acquisition of less than three seconds. Derived from IEC’s projectile receivers, it may be operated tightly coupled to an optional 6-DOF external inertial measurement unit, allowing very narrow bandwidth tracking in the presence of intentional or incidental interference.

    TruTrak will track up to 12 satellites simultaneously. (The GPS Receiver Survey in the January issue of GPS World erroneously identified it as a 6-channel receiver.)

    Meanwhile, IEC has also received a three-year, $6 million contract to support the Ground-based Midcourse Defense Segment (GMDS) under the U.S. Army Strategic Missile Defense Command. IEC will supply 30 digital GPS translators and two GPS translator processors, engineering, logistics, and field launch support. The GPS translator units will support GMDS by providing post-mission flight measurement and range safety tracking of simulated warhead and booster stages of interceptor kill vehicles.

    NEC Puts SiRF in Driver’s Seat

    SiRF Technology and NEC Electronics (Europe), based in Dusseldorf, Germany, have announced a licensing agreement to integrate SiRF’s GPS technology into NEC’s integrated circuits designed for the automotive marketplace. The partnership targets oncoming multimedia navigation systems in standard as well as luxury cars.

    NEC will integrate the SiRFstarII GPS baseband core to location-enable its automotive products, the first of them a low-cost navigation companion chip, incorporating an ARM7TDMI core with on-chip GPS and signal preprocessing capability for a host central processing unit. The companies plan sample chip availability in the third quarter, with volume production likely by the end of the year. NEC also plans to develop non-automotive applications based on the SiRFstar technology.

    Z/I, Applanix Units Score

    Aerial photography provider Simmons Aerofilms has selected the POS Z/I 510 position and orientation system with inertial measurement unit from Z/I Imaging, the joint venture of Intergraph Corporation and Carl Zeiss. The system is Z/I’s OEM version of the Applanix POS/AV-DG, with NovAtel’s Millennium GPScard.

    Integrating inertial sensors, GPS, and post-processing software, the system measures the camera’s absolute position and orientation angles of each image with stated accuracy of 5–10 centimeters and 20–30 arcsec respectively. The unit allows direct georeferencing of aerial photographs without aerial triangulation and with minimal ground control, reducing overall costs.

    Shaanxi Meihang Digital Surveying group, China’s largest surveying, remote sensing, and mapping enterprise, has chosen Z/I’s Digital Modular Camera (DMC) for urban construction, field archaeology, disaster investigation, and other applications. The differential GPS-equipped DMC uses eight synchronously operating cameras to mosaic converging panchromatic images for reported ground resolutions better than two inches. The DMC uses a NovAtel OEM4 receiver for position and a 12-channel Garmin receiver for navigation.

    CSI Ag, GIS Entry

    CSI Wireless has launched its SERES GPS receiver/antenna combination for precision agriculture, geographic information systems (GIS), and mapping applications. In addition to GPS, the unit uses dual-channel tracking to receive signals from the Wide Area Augmentation System (WAAS) and the European Geostationary Navigation Overlay System (EGNOS). The unit’s 12-channel Zarlink receiver reportedly delivers sub-meter horizontal accuracy with differential GPS (DGPS). Measuring 4.1 32.7531.1 inches, SERES can function as the positioning element of a precision guidance system or as a backpack-
    mounted unit providing data to a hand-held unit for GIS or mapping.

    Leica GeoMoS

    Leica Geosystems has introduced its Geodetic Monitoring System (GeoMoS), a software package for precise deformation monitoring and analysis. Designed to support single-sensor monitoring stations or multi-sensor networks for bridges, tunnels, dams, mines, volcanoes, and high-rise buildings, GeoMoS integrates data from GPS receivers, strain gauges, and meteorological sensors into a single network. It monitors real-time movements and issues alerts of any movements beyond pre-defined tolerances.

    The European Navigation Conference (GNSS 2002) takes place May 27-30 in Copenhagen, Denmark, hosted by the European Group of Institutes of Navigation and the Nordic Institute of Navigation. Conference themes include GNSS status, architecture, and implementation; Galileo; interoperability and standardization; navigation infrastructure and development; system applications and user experiences; political and institutional issues; and future developments. For details e-mail <[email protected]>, or see web site.

    The Ninth GNSS Workshop (2002 International Symposium) has issued a call for papers for a conference scheduled November 6-8 in Wuhan, China. Themes include GPS/GNSS status, modernization, and augmentations; navigational and positioning infrastructure; receiver and antenna technology; and applications in range of fields. Email abstracts to <[email protected]>, or fax them to +86-27-87876495-13, before April 30.

    Trimble, located in Sunnyvale, California, announced total revenue for 2001 of $475.3 million. Fleet and Asset management revenues were 12 percent, Components Technologies 12 percent, Agriculture 5 percent and Portfolio Technologies 7 percent. Trimble raised $46 million in a private equity placement in 2001, sold its airline operations, and acquired the Spectra Precision Group and software developer Tripod Data Systems.

  • The View From Here: Mapping Harmony

    By Glen Gibbons

    The Global Positioning System has provided more than a few ironies in its relatively short existence: A system so accurate that, until last year, government policy required operators to degrade the quality of the open C/A-code signal. A navigation instrument more accurate than the maps across which navigators plotted their courses. Early GPS-based car guidance systems that displayed vehicle location in the middle of buildings or lakes.

    But, as with so many other aspects of daily life, what may have seemed funny before September 11 is no longer a laughing matter..

    The need for a better correspondence of location information is underscored by the urgency being given to the Federal Communications Commission’s (FCC’s) five-year-old mandate for enhanced 911 (E911) services. E911 provides mobile telephone users with the same automatic location information (ALI) of emergency calls now en-joyed by users of wireline phones at fixed sites. The benefits of ALI for getting police, firefighters, and ambulances to an emergency quickly are obvious..

    The first phase of E911 implementation — identifying the nearest cell site from which a call comes — only covers less than half of the U.S. population. Implementation of Phase II, which requires much more accurate real-time positioning, was scheduled to begin October 1. Last month, however, the FCC granted extensions to five national wireless carriers for initiating their Phase II plans. The agency still expects carriers to provide all mobile phone users with E911 coverage by the end of 2005..

    Three wireless carriers will employ handset-based assisted-GPS techniques in providing ALI that must be twice as accurate (50 meters versus 100 meters) as the “network-based” positioning that the other carriers have selected. (This should prove interesting in the marketplace. Because the E911 capability imposes no direct cost on customers, why would consumers choose non-GPS equipment and carriers offering substantially less accurate service?).

    Little of the E911 delay stems from unavailability of GPS technology. Upgrading software at switching servers is the primary cause for postponements sought for handset-based systems. Even with the lower accuracy standards, however, carriers with network-based solutions pleaded for more time to get their positioning technology to work..

    After the communications and positioning kinks are worked out of the E911 systems, public safety and commercial location-based service providers will still face an operational dilemma. That is the mismatch between positioning techniques and mapbases and differences among maps discussed earlier. Cartographers have long understood that variations among coordinate systems and datums can make the same latitude/longitude mean different things to different people. But until GPS came along, navigation and tracking techniques were so much cruder that such cartographic variations disappeared inside the error ellipse of the positioning systems..

    Under Phase II, emergency call centers (public safety answering points or PSAPs, in FCC parlance), public safety agencies, and E911 callers need to be on the same page. Use of proprietary mapbases with incompatible grid designs in either paper or electronic format is a recipe for disaster. It will create coverage ambiguities near PSAP boundaries (Which agency should handle the call?) and lead rescuers tens or even hundreds of meters away from injured or imperiled callers. Yet a distinctive reference grid seems like a much less important proprietary feature for competing map vendors than the other information and cartographic design built into their products..

    The Public X-Y Mapping Project has proposed one solution to this mishmash of maps: adoption of a U.S. National Grid (USNG) for Spatial Addressing. The USNG would effectively match up with the Military Grid Reference System (MGRS), taking advantage of that public domain systemyy?s use of the Universal Transverse Mercator (UTM) grid. MGRS is one of the most common datums residing within GPS receivers and could be made the default mode for E911 calls, according to Jules McNeff, one of the mapping project’s principals and a well-known GPS advocate.

    Agreement between civilian and military mapping standards in these days of homeland security concerns probably wouldn’t be a bad idea. And the benefits, of course, would carry over into the commercial realm of value-added location-based services, too..

    The interagency Federal Geographic Data Committee’s standards working group recently recommended adoption of USNG as a preferred national standard. “Effective implementation of USNG on maps and in GPS receivers is the single most important thing [that we] can do to improve emergency response operations nationwide almost immediately,” says McNeff. Readers interested in exploring the USNG proposal can find more details on-line at and.

    Whether it’s USNG or another universal reference system, GPS manufacturers, public safety agencies, commercial service providers, mapmakers, and the general public have a common interest in achieving a GPS-friendly national spatial standard.

  • GPS and Aviation Safety


    U.S. federal agencies, aircraft and avionics manufacturers, airlines, and research centers are brainstorming ways to prevent a repeat of the tragic events of September 11, in which highjacked aircraft were used as missiles. Under these new circumstances, options previously dismissed out of hand suddenly are attracting renewed attention.

    One recurring proposal is to automate the landing of hijacked aircraft. In this scenario, a “dead-man switch” would allow the pilot to turn over navigational control to an on-board GPS-based autolanding system. The system would broadcast a mayday to air traffic control (ATC), search an on-board database for the nearest suitable airport, alert that airport, receive landing authorization, and land the aircraft there. During these operations, no one on board would be able to regain control of the aircraft. The pilot would be like an employee who, when confronted by a robber, does not have the combination to the company’s safe. No amount of violence on board would allow hijackers to use an aircraft as a missile against a target.

    Technologically feasible. The strong consensus of airline, industry, and academic experts interviewed for this article is that the above scenario is technologically feasible. In fact, the autolanding technique has been amply demonstrated and at least one major avionics manufacturer is actively working on producing an emergency landing system.

    The Federal Aviation Administration (FAA) is working on two GPS-based systems that could enable this sort of antihijacking capability: the Wide Area Augmentation System (WAAS) that will enable aircraft to reach the so-called Category 1 decision point in an approach to an airport, and the Local Area Augmentation System (LAAS) that would enable aircraft to reach the ground in zero visibility, known as a Category 3B landing. The agency plans for many airports to be equipped with LAAS transmitters eventually and will require WAAS/LAAS systems on commercial airliners.

    Although both systems still await final certification, testing, and installation at U.S. airports, commercial airliners and military aircraft have already demonstrated fully automatic instrument approach and landing under Category 3B conditions.

    Features

    Although technologically feasible, operational considerations pose obstacles for implementing an automated emergency landing system. The following scenarios address some of these issues as well as technical features of such a system:

    1. A “multiple key” arrangement could restore manual control with codes from the pilot, the co-pilot, and the ground-based ATC operators. Ground control would con- tribute its code only when absolute sure that the aircraft could not be used to attack a population center.
    2. To protect it from being disabled, the system would require a hardened compartment not accessible from the cabin and an autonomous power source not controlled from the cockpit circuit breaker panel.
    3. Prior to landing, the onboard system would notify ATC, which, in turn, would alert and re-route other aircraft as needed.
    4. If the highjackers jammed the GPS signal, the system would put the plane in a holding pattern until it reacquired a clear signal. By refusing to turn off the jammer, terrorists could force the aircraft to run out of fuel and crash – but could not guide it to a target.
    5. According to an industry source, the system should first put the aircraft in a holding pattern in any case, to give a chase plane time to reach it and visually monitor it. In the very unlikely case that the highjackers were able to regain control of the aircraft and aim it toward a target, the chase plane could challenge the aircraft, order it to land, and shoot it down if it did not comply.
    6. The airport database would need to include data on possible flight path obstructions – terrain or tall buildings – so that the system could select a clear approach path. Avionics systems coming onto the market that are designed to prevent controlled flight into terrain essentially have this capability now.
    7. The autolanding system would require permission from the ground to land on a particular runway. If permission were denied for any reason, the system would search its database for the next-best runway.

    Cockpit philosophy. An airline pilot who is now an aide for the operations chief of a major airline reacted very negatively to the idea of an emergency autolanding system that could not be disengaged by the pilot. Any system that restricts the crew’s options, he said, clashes with a key tenet of “cockpit philosophy”: to keep the pilot in charge and never relinquish control of an aircraft completely to automation.

    An emergency autoland system also conflicts with a basic principle of aeronautical engineering – namely, that an aircraft should have multiple, redundant ways to control it.

    However, in extreme emergencies, the alternative may warrant overriding such concerns, according to Bradford Parkinson, a professor emeritus at Stanford University’s School of Engineering who first proposed fully automated cargo planes years ago. He points out that, although an antihijacking system used routinely would have to be extremely reliable, when the alternative is a 100 percent probability of death for all aboard, “Boy, that sure changes the equation in a flash.”

    Further reading: “Soft Landings: Navy Proves Hands-Off Touchdown,” by Matteo Luccio and Glenn Colby, GPS World, August 2001.

  • Apocalypse 911

    By Glen Gibbons

    “Limited only by our imaginations.”

    People like to say that about uses of GPS, or what some-one would do if they won the lottery, or a child’s options when released from school into an endless summer.

    But sometimes it’s good for our imagination to have limits. Some things our hearts and minds are better off not being able to visualize.

    Consider our recent horrors. Nazi death camps. Hiroshima. Cambodia’s killing fields. Genocidal Tutsis and Hutus. And now the twin towers of the World Trade Center. The Pentagon in flames, for crying out loud!

    One moment, an idea was unimaginable; the next, it’s historical fact — indelible, inescapable, unforgettable. The world has changed, and we along with it. The new millennium has cut its teeth on the edge of a sword.

    Probably John of Patmos would have preferred not to have had his imagination stoked by revelation 2,000 years ago. Yet there it was: the fourth seal, a pale horse and rider, his companions loose in the world, wielding death by sword, famine, pestilence, and wild beasts. Four horsemen, but riding under a single banner of terror.

    Many must feel the apocalypse is bearing down on us now, like the planes bearing down on those three buildings in New York and Washington. Even the date has an ominous numerological coincidence: September 11, 9-11, the same numbers that were punched frantically into cell phones as events rushed toward their horrible destiny.

    So, we find ourselves as though on the edge of a precipice, crevasses opening ahead of and behind us: irrevocably separated from what now seems a sweetly peaceful past, the way forward blocked by an abyss of certain dangers and uncertain risks.

    The already stuttering economy has mimicked those tumbling structures in New York and Washington, although the collapse has been nowhere near as devastating or profound. We have gone down into a valley – emotionally, economically – and it may be a long way till we climb back out.

    In this long journey back to the light, however, I expect that we will find GPS has become more a part of the recovery than a victim of the decline. Why? Because it is such a fine tool.

    In the present circumstances, of course, the first uses of GPS that come to mind are the military ones. The guided missiles, the handheld and vehicle-mounted navigators, GPS/wireless locators for downed pilots, precision munitions like those discussed in an article elsewhere in this issue. Yet even as an aroused world tries to extricate the sources and agents of terror from a global body politic, we will find broader uses for GPS.

    The Volpe Transportation Systems Center report on the vulnerability of transportation infrastructures relying on GPS, released the day before the terrorist attacks, will evoke even stronger resonance now. Security has become the watchword not merely for a day, but for the foreseeable future.

    Consequently, we’ll see a lot more GPS surveying, mapping, and machine control systems at work in securing physical assets. We’ll see increased efforts to ensure the use of GPS timing that underlies the world’s synchronized telecommunications infrastructure, the Internet, power systems, local and wide area computing networks. We may even see some innovations in emergency automatic landing of aircraft seized by hijackers, as discussed in an essay in this issue.

    But I suspect that the biggest incentive that these tragic events will provoke in GPS applications will be in its use in tracking people and assets. Figuratively reaching out and touching someone, as the well-known wireless marketing slogan puts it, is no longer enough. To more completely assuage the anxious undercurrents that these events have set in motion, we’ll need to be able to reach out and locate someone, or let someone know our own location. So, too, our public modes of transportation, our material goods in transit, will demand even greater real-time knowledge of their location and status.

    Yes, a chasm has opened before us. And yet, to come safely across to the other side, it doesn’t matter how deep the abyss is, but rather how wide. Our actions in the months and years ahead can widen or narrow the gap separating the world from a better future. In that regard, we should consider the words of German philosopher Friedrich Nietzsche, “He who fights with monsters might take care so that he doesn’t thereby become a monster. If you gaze long into an abyss, the abyss gazes also into you.”

    The United States has been grievously injured, innocent people wrongfully killed. Yet every nation has some cause to cry out for justice; every human being has a right to be delivered. To navigate this perilous terrain, will require better guidance than even that available from GPS.

  • GPS accuracy: Lies, damn lies and statistics

    GPS accuracy: Lies, damn lies and statistics

    EDITOR’S NOTE: An updated version of this article appeared as our January 2007 cover story.

    Frank van Diggelen, Ashtech, Inc.

    “There are three kinds of lies: lies, damn lies, and statistics.” So reportedly said Benjamin Disraeli, prime minister of Great Britain from 1874 to 1880. And just as the notoriously wily statesman noted, the science of analyzing data, or statistics, sometimes yields results that one can interpret in a variety of ways, depending on politics or interests. Likewise, we in the satellite navigation field interpret results depending on the information we wish to produce: Using various statistical methods, we can create many different GPS and GLONASS position accuracy measures. It can seem confusing, even misleading, but as we’ll see in this month’s column, there’s some rhyme to our reason. We’ll examine some of the most commonly used accuracy measures, reveal their relationships to one another, and correct several common misconceptions about accuracy. Our author is Frank van Diggelen of Ashtech, Inc., in Sunnyvale, California. Van Diggelen is the OEM (original equipment manufacturer) and navigation products marketing manager.

    “Innovation” is a regular column featuring discussions about recent advances in GPS technology and its applications as well as the fundamentals of GPS positioning. The column is coordinated by Richard Langley of the Department of Geodesy and Geomatics Engineering at the University of New Brunswick, who appreciates receiving your comments as well as topic suggestions for future columns.

    Root mean square (rms), twice the distance root mean square (2drms), circular error probable (CEP), spherical error probable (SEP), so on, and so forth — Why do we have so many different position accuracy measures? The answer lies in the fact that the errors of position coordinates determined using a GPS or GLONASS unit are not constant — they vary statistically. If you observe the reported position of a stationary receiving system over time, you will notice it wanders. Graphing these moving points yields a “scatter plot”; how you analyze the scatter depends on the information you want to obtain. To complicate matters, the position is fundamentally three dimensional, but not everyone is interested in obtaining three-dimensional accuracy. One user might care about horizontal accuracy, another might want vertical. Thus, clearly, we must consider different accuracy measures.

    Before we take a look at some of the common accuracy evaluations and their relationships to one another, we must say a word about the meaning of accuracy itself. To ascertain how accurately a system has determined a point’s coordinates, you must know the point’s true coordinates. Typically, this comes from measurements made using a system with an inherently higher accuracy than the one being tested. Simply averaging a system’s reported positions will provide an indication of system precision or repeatability, but the measurements might contain a bias that could affect the results. So, when we talk about system accuracy, we must consider the possibility of such a mean error.

    POPULAR ACCURACY MEASURES

    Table 1 lists the most commonly used GPS position accuracy measures and their definitions. Note that the first two methods are explained in terms of average squared error, and the last three are defined directly from the position error distribution (the scatter). Thus, we can immediately associate these last three with error probabilities. If we assume that the error distribution along any axis (east, north, or up) is “normal” or Gaussian, then we can also derive probabilities associated with the rms and 2drms accuracy measures. [The normal or Gaussian distribution is the one to which the dispersion of the sum of a very large number of very small errors always converges. The famous German polymath Carl Friedrich Gauss used this distribution to develop his error theory in the early nineteenth century. To honor the importance of this and the scientist’s other accomplishments, Germany features a portrait of Gauss and his probability distribution on its 10-mark bank note. — R.B.L.]

    Table: Frank van Diggelen
    Data: Frank van Diggelen

    Table 2 shows how the accuracy measures are used and what probabilities can be associated with them. Note that the probability associated with rms depends on whether one is using rms in one, two, or three dimensions (1-D, 2-D, or 3-D). The later “Common Misconceptions” section discusses this further.

    Table: Frank van Diggelen
    Data: Frank van Diggelen

    Ascertaining Accuracy: An Example. Now, suppose you are comparing the specifications of two positioning systems. One unit has a quoted accuracy of 3 meters (3-D rms) and another has a quoted accuracy of 2 meters (CEP). Which system is more accurate?

    By making three assumptions about the ratio of east, north, and up errors, we can relate different accuracy determinations to each other, as shown in Table 3 (entitled “Theoretical Equivalent Accuracies”).To use that table, identify the desired measure in the top row and the original measure in the right hand column. Take the number in the cell at which the row and column intersect and multiply it by the original measure value to yield the desired number.

    Table: Frank van Diggelen
    Data: Frank van Diggelen

    The three assumptions, from which the conversion values derive, are true on average. First assumption, the error distribution is Gaussian. Second, the ratios of the position dilution of precision (PDOP) to the horizontal DOP (HDOP) and the vertical DOP (VDOP) to the HDOP are 2.1:1 and 1.9:1, respectively. Third, the horizontal error distribution is circular. These suppositions are based on simulations performed over a grid covering the entire globe between latitudes 66 degrees south and 66 degrees north. In general, horizontal distributions are elliptical, the ellipses are often very close to circular, and the circular Gaussian distribution model is very good at estimating the true distribution, as shown in Figure 1.

    To answer the question posed earlier (which is more accurate — a 2-meter [CEP] or a 3-meter [3-D rms] system?), follow these four steps:

    • Go down the “rms (3-D)” column to the “CEP” row.
    • The entry in this cell is 2.5.
    • According to the table, rms (3-D) =2.5 3 CEP.
    • So, CEP = rms (3-D)/2.5 = 3/2.5 =1.2 meters.

    Thus, a system with 3-D rms of 3 meters will have a CEP of 1.2 meters and is, therefore, more accurate than a system with a CEP of 2 meters.

    For specific details about how we created Table 3, see the “Deriving the Equivalent Accuracies Table” sidebar on the last page of this article.

    Making Valid Assumptions. To understand the table in more general terms, one must realize that the three assumptions and the table are valid for the average measurement. This means that if someone takes measurements all day, then, on average, the different accuracies are related by the numbers in the table. At any instant, however, the satellite geometry may produce a different relationship between various accuracies (for example, between vertical and horizontal). But the best way to make a comparison, seemingly, is to use average relationships.

    Starting a Small Test. In any specific example, the table entries are apparently good to within 620 percent. That is, if the table says 2drms = 1.2 3 horizontal 95 percent, then a particular experiment may show 2drms to be anywhere from 0.96 to 1.44 3 horizontal 95 percent.

    To evaluate Table 3’s efficacy, we used data from more than 550 hours (2 million data points) of differential GPS positions (DGPS), obtained with a U.S. Coast Guard reference station providing the differential corrections. Our results were 42 centimeters CEP, 91 centimeters horizontal 95 percent, and 104 centimeters 2drms. Table 4 shows how these results compare with Table 3’s theoretical values.

    Table: Frank van Diggelen
    Data: Frank van Diggelen

    Closing the Circle. The circular Gaussian distribution model for horizontal errors is surprisingly good. Figure 1 portrays a histogram (in green) generated from the DGPS data. These data have a horizontal rms value of 0.52 meter. Overlaid on the green histogram is a bar graph, showing the theoretical histogram that would be obtained from data that truly were circularly distributed and Gaussian and that had the same horizontal rms as the measured data. As the figure shows, the measured and theoretical distributions agree extremely well. We can obtain similarly good fits for vertical error distributions modeled as 1-D Gaussian.

    Figure 1. Measured and theoretical horizontal error distribution. The vertical axis indicates the relative frequency of errors occurring in each error interval. Horizontal axis values are rounded. (Image: Frank van Diggelen)
    Figure 1. Measured and theoretical horizontal error distribution. The vertical axis indicates the relative frequency of errors occurring in each error interval. Horizontal axis values are rounded. (Data: Frank van Diggelen)

    COMMON MISCONCEPTIONS

    By now, one may feel that accuracy measures are rather simple to understand. Still, general discussions about GPS and GLONASS position accuracies frequently contain several misconceptions. Here’s our attempt to set the record straight.

    Misconception Number 1 — rms precisely equals one sigma (1s or 1 standard deviation). Well, actually this is true, as long as the mean error is zero. With most GPS or GPS/GLONASS systems, the mean errors (over a sufficiently long time interval) are zero, or close to zero, and so rms may be considered essentially equivalent to one sigma.

    Misconception Number 2 — 2drms means “two-dimensional rms.”In fact, 2drms usually stands for “twice distance rms,” in which the “distance” is measured in a 2-D space, the horizontal plane. Thus, 2drms is a very confusing abbreviation: It is a two-dimensional measure, but the “2d” usually stands for twice distance. (Some publications about navigation accuracies, notably those issued by the North Atlantic Treaty Organization, use the alternative meaning of “2d.” Thus, their “2drms” is exactly one-half of the usual measure.)

    Misconception Number 3 — 2drms is exactly equivalent to a 95 percent probability level. This untrue belief stems from the fact that, for a 1-D Gaussian distribution, 95 percent of it lies inside an interval from ­2s to +2s. However, 2drms is a measure for a 2-D distribution. The percentage of scatter lying within a circle with radius equal to 2drms depends on the distribution shape. For a circular distribution, the percentage of scatter inside a 2drms circle is 98 percent. The “Deriving the Equivalent Accuracies Table” sidebar shows this. As the scatter becomes more elliptical (with different error distributions for the two horizontal coordinates), it also becomes more one-dimensional, causing the percentage of elliptical distribution values inside a 2drms circle to tend toward 95 percent.

    For GPS units, when the whole sky is visible above a 10-degree mask angle, scatter is approximately circular. Typically, distributions become very elliptical when HDOP gets large (much greater than 1). Thus, for any GPS receiver in any environment, the circle with a radius equal to 2drms contains between 95 and 98 percent of the scatter. When HDOP is low, the percentage is closer to 98 percent; when HDOP is high, it is closer to 95 percent.

    Misconception Number 4 — rms is perfectly comparable with a 68 percent probability level. This is true for only 1-D Gaussian distributions. For 2-D or 3-D Gaussian distributions, the percentage of the values distributed inside a circle (or sphere), with a radius equal to the rms value, depends on distribution shape.

    Misconception Number 5 — The error distribution really is Gaussian.We use the assumption that the error distribution is Gaussian for analytical purposes, and over time, one can show that a circular Gaussian distribution can model the errors very well (see Figure 1). However, certain errors may not have a Gaussian distribution:

    • Stand-alone GPS errors are dominated by selective availability. Because this is an artificial error source, the errors it contributes are not always Gaussian.
    • Stand-alone GPS/GLONASS errors show distributions that match Gaussian distributions quite well (to about 10 percent) over a time period of, say, several hours.
    • Differential errors over a long time
      display distributions that match Gaussian patterns to within a few percent. This is true for both code differential and carrier-phase differential (commonly referred to as real-time kinematic, or RTK). Differential errors over a short time produce scatter dominated by multipath, which is fairly constant over a few minutes, and, hence, the distribution is distinctly non-Gaussian.

    IN CONCLUSION

    As Disraeli also noted, “An investment in knowledge pays the best interest.” We hope that this brief note has proven to be a worthwhile “investment” to readers, shedding light on the sometimes murky subject of accuracy measures used in GPS and GLONASS positioning. With the simple information provided, you should be able to compute the positioning accuracy of a system in a variety of measures and also, contrary to the old adage, be able to compare “apple A” with “orange B.”

    Further Reading
    For an introduction to the statistics of GPS accuracy measures, see
    • “The Mathematics of GPS,” by R.B. Langley in GPS World, Vol. 2, No. 7, July/August 1991, pp. 45­50.
    For an extended mathematical description of position errors, see
    • “Navigation Errors,” Appendix Q of American Practical Navigator: An Epitome of Navigation, originally by N. Bowditch, Vol. I, published by the former Defense Mapping Agency Hydrographic Center, Washington, D.C., 1977 or 1984 editions.
    For positional error discussions from the war fighter’s perspective (but also relevant to noncombat applications), see
    • “Accuracy and Positional Error,” Appendix D of Naval Aviation Systems Team Mapping, Charting, and Geodesy Handbook, Version 2.0, by J.H. Harden, Jr., and Z.S. Willis, published by the Avionics Systems Engineering Department, Naval Air Systems Command, Arlington, Virginia, 1995. Available on the Internet at <http://www.nima.mil/publications/pub.html>.
    • ‘Method of Expressing Navigation Accuracies,” NATO Standardization Agreement (STANAG) 4278, Edition 2, Military Agency for Standardization, North Atlantic Treaty Organization Headquarters, Brussells, 1986.
    For an advanced discussion about the statistics of GPS positioning errors, see
    • “Random Variables and Covariance Matrices,” Chapter 9 of Linear Algebra, Geodesy, and GPS, by G. Strang and K. Borre, Wellesley-Cambridge Press, Wellesley, Massachusetts, 1997.
    Deriving the Equivalent Accuracies Table
    The function invchisq (p,2) computes the square of a circle’s radius such that the sum of squares of two random variables, each with rms = 1s = 1, has a probability p of falling inside the circle. This function allows users to relate rms to probability for a two-dimensional circular distribution.Comments are shown in curly brackets “{}.” Table 3 (about equivalent accuracy) contains entries with resolution of only two digits. It is impossible, in general, to provide more precise ratios, because the three initial assumptions are averages over the whole world, and, thus, are good only to within a few percent of error in any particular region.rms (vertical) = 1.9 3 rms (horizontal) {using VDOP/HDOP = 1.9}
    (1,3) entry = 1/1.9 = 0.53
    (1,5) entry = 2 3 0.53 = 1.1
    CEP = 50 percent circle {first solve for CEP = x 3 rms (horizontal), then use that result to derive other ratios}
    rms (horizontal) = (check)2 3 rms (linear) {assuming a circular distribution}
    R = sqrt(invchisq ( 0.5,2)) = 0.83 3 (check)2 => CEP = 0.83 3 (check)2 3 rms (linear) = 0.83 3 rms (horizontal)
    (2,3) entry = 1/0.83 = 1.2
    CEP = x 3 rms (vertical) = x 3 rms (horizontal) 3 1.9 = 0.83 3 rms (horizontal) => x = 0.83/1.9 = 0.44
    (1,2) entry = 0.44
    R95 = 95 percent circle {first solve for R95 = x 3 rms (horizontal), then use that result to derive other ratios]
    R = sqrt(invchisq (0.95,2)) = 1.73 3 (check)2 =>
    R95 = 1.73 3 (check)2 3 rms (linear) = 1.73 3
    rms (horizontal)
    (3,4) entry = 1.7R95 = x 3 rms (vertical) = x 3 rms (horizontal) 3 1.9 = 1.73 3 rms (horizontal) => x = 1.73/1.9 = 0.91
    (1,4) entry = 0.91
    R95 = 1.73 3 rms (horizontal) = 1.73 3 CEP/0.83
    (2,4) entry = 1.73/0.83 = 2.1
    2drms = 2 3 rms (horizontal) {by definition}
    (3,5) entry = 2
    2drms = x 3 CEP = x 3 0.83 3 rms (horizontal) =
    x 3 0.83 3 2drms/2 => x = 2/0.83 = 2.4
    (2,5) entry = 2.4
    2drms = x 3 R95 = x 3 1.73 3 rms (horizontal) = x 3 1.73 3 2drms/2 => x = 2/1.73 = 1.16
    (4,5) entry = 1.2

    rms (3-D) = 2.1 3 rms (horizontal) {using PDOP/HDOP = 2.1} = 2.1 3 2drms/2 = 2.1 3 rms (vertical)/1.9
    (3,6) entry = 2.1
    (4,6) entry = 2.1/2 = 1.1
    (1,6) entry = 2.1/1.9 = 1.1

    rms (3-D) = x 3 CEP = x 3 0.83 3
    rms (horizontal) = x 3 0.83 3 rms (3-D)/2.1, =>
    x = 2.1/0.83 = 2.53

    (2,6) entry = 2.5

    rms (3-D) = x 3 R95 = x 3 1.73 3
    rms (horizontal) = x 3 1.73 3 rms (3-D)/2.1 =>
    x = 2.1/1.73 = 1.21

    (4,6) entry = 1.2

    SEP based on simulation: rms (horizontal) = (check)2; rms (vertical) = rms (horizontal) 3 1.9; SEP = 2.38 = 1.68 3 rms (horizontal)
    (3,7) entry = 1.7

    Other SEP ratios derived from the aforementioned ratios.


  • Innovation Catalog

    A catalog of all Innovation columns published in GPS World from Vol. 1, No. 1 (1990) to Vol. 21, No. 12 (2010). Download the PDF.