Blog

  • ITT Exelis Awarded Payload Contract for GPS III Satellites

    ITT Exelis has been awarded a $32 million contract by Lockheed Martin to build the navigation payloads for the Global Positioning System III space vehicles three and four. Exelis announced in December 2011 that it had successfully integrated and performed the initial power up of the full-size payload prototype known as GPS III Non-Flight Satellite Testbed (GNST) Navigation Payload Element.

    “Exelis payloads have been on board every GPS spacecraft — a period spanning nearly 40 years. We are tremendously proud to be a part of the next generation of GPS satellites,” said Mark Pisani, vice president and general manager, Precision Instruments and Positioning, Navigation and Timing Systems, ITT Exelis Geospatial Systems. “Together with Lockheed Martin, Exelis is committed to providing our warfighters and commercial and civilian users more accurate and reliable capabilities that improve interoperability and jam-resistance.”

    Exelis was selected along with Lockheed Martin in 2008 by the U.S. Air Force to build the next-generation GPS III program. The GPS III team is led by the Global Positioning Systems Directorate at the U.S. Air Force Space and Missile Systems Center.

    “The GPS III satellites and their superior navigation payloads are critical to sustaining and modernizing the GPS constellation and we are focused on delivering these spacecraft affordably and efficiently to meet the needs of more than one billion users worldwide,” said Keoki Jackson, Lockheed Martin’s GPS III program director.

    Scheduled for first launch in 2014, GPS III satellites will deliver significant improvements compared with current GPS space vehicles. The GPS III program will affordably replace aging GPS satellites while improving capability to meet the evolving needs of military, commercial and civilian users worldwide. GPS III satellites will deliver better accuracy and improved anti-jamming power while enhancing the spacecraft’s design life and adding a new civil signal designed to be interoperable with international global navigation satellite systems.

    For more than 37 years, Exelis payloads and payload components have been on board every GPS satellite. They have accumulated more than 500 years of on-orbit life without a single mission-related failure.

    ITT Exelis Geospatial Systems, headquartered in Rochester, N.Y., is a global supplier of innovative  night vision, remote sensing, and navigation solutions that provide sight and situational awareness at the space, airborne, ground, and soldier levels. Key applications include image intensification and thermal imaging; advanced power supplies; multi-spectral image systems; weather and climate monitoring; space science; intelligence, surveillance and reconnaissance; GPS-based positioning, navigation and timing systems; and image exploitation software.

  • Leica Geosystems Announces Leica MissionPro Software

    Leica Geosystems Geospatial Solutions Division is pleased to announce the release of its new mission planning software, Leica MissionPro. The software provides mission planning capability for all airborne sensors including LiDAR, line and frame sensors and is fully integrated into existing Z/I Imaging and Leica Geosystems workflows.


    The company reported that in addition to the core planning functionality, Leica MissionPro includes an exciting range of new features such 3D virtual Globe View and tools for project management and evaluating missions.

    “Leica MissionPro combines the best features from Z/I Mission and Leica FPES into a comprehensive and highly productive planning software”, says Jacques Markram, Product Manager for Leica MissionPro. “Leica MissionPro represents an exciting first step in our combined product roadmap and is truly the result of synergies across the new division. Leica MissionPro simplifies planning for any type of airborne sensor mission and allows our combined customer base to further enhance their productivity.”

    According to Leica, MissionPro supports integrated multi-sensor and LiDAR planning in a true 3D mission planning environment and exports flight plans for both Z/I Inflight and Leica FCMS. In addition, Leica MissionPro provides access to Web Map Services and uses worldwide SRTM data.

    Leica MissionPro replaces Z/I Mission and Leica FPES software. A free upgrade is provided to all Leica FPES and Z/I Mission maintenance customers.

    For more information about Leica MissionPro please visit: http://www.leica-geosystems.com/missionpro

  • Fabric Engine Launches; Solves GIS Imaging Challenges with Dynamic Languages

    Fabric Engine Inc announced that it has officially launched v1.0 of its high-performance computing platform, Fabric Engine. Having recently earned Judge’s Choice at January 2012’s NodeJam, the server- and client-side Fabric Engine technology is now available to programmers under the AGPL license.


    According to the announcement, Fabric Engine taps into the power of modern, multi-core hardware to bring multi-threaded, compiled performance to dynamic languages such as JavaScript and Python. The benefits of dynamic languages are well-known – they’re easy to use and fast to work with. However, they are slow when compared to compiled languages. Until now, dynamic language applications have to be re-built using compiled languages in order to provide performance, which introduces significant costs. Fabric Engine gives the same performance as multi-threaded C++, yet retains the ease of use and speed of iteration of dynamic languages.

    “With Fabric Engine’s technology, it’s possible to take current backend infrastructure and redeploy it to scale and gain impressive performance increases,” said Guido Vieira, General Manager at Nexalogy Environics, a company focused on social media analytics and an early user of Fabric Engine. “Fabric Engine has other advantages too. In addition to using a language very similar to JavaScript for the high-performance operators (vanilla JavaScript/node.js for everything else), which reduces the need to use C++, you can avoid the whole code-compile-run cycle with its sometimes long delays, and use a more immediate execute model.”

    The company reported that on the desktop, Fabric Engine is ideal for high-performance applications, such as those used in game development, animation, film production, GIS, medicine, and other industries that are greedy for performance. Fabric Engine currently runs as a browser plug-in, and is currently in beta for a Python/QT desktop framework. On the server and in the cloud, Fabric Engine is ideal for addressing compute-bound problems that require raw execution performance. With node.js, Fabric Engine provides an asynchronous compute model that works well alongside the other services that node provides.

    The company listed proven uses of Fabric Engine include:

    –       3D animation

    –       Facial recognition

    –       Image/video processing

    –       Remote collaboration on 3D data

    –       GIS visualization

    –       Medical visualization

    –       Semantic analysis (Nexalogy Use Case)

    –       Statistical analysis

    –       And any other compute-bound challenge.

    “This launch marks the culmination of more than two years of hard work,” said Paul Doyle, CEO and co-founder of Fabric Engine. “We have many ideas of what can be achieved with our technology, but we also look forward to seeing all of the creative directions in which developers push Fabric. With our open-source licensing model, it is easy for developers to get started with Fabric Engine and start building high-performance applications.”

  • Intergraph Introduces SmartPlant FreeView

    Intergraph released SmartPlant FreeView, a free .VUE viewer that allows users to display and navigate Intergraph 3D models and view associated plant properties.


    According to the announcement, SmartPlant FreeView will open any Intergraph SmartPlant 3D and SmartMarine 3D projects published as a .VUE file. A user then may walk through the plant, ship or offshore model and select any object in the view to see its associated plant properties via the MDB2 package. Intergraph’s SmartPlant Review Publisher can convert and combine SmartPlant 3D and SmartMarine 3D, as well as other project types, into .VUE and MDB2 formats for viewing with SmartPlant FreeView or Intergraph’s full-capability visualization solution, SmartPlant Review.

    Intergraph reports that the free .VUE viewer has a complete set of on-screen navigation controls for easy use, allowing even the most casual user to walk through complex 3D models with no training. Keyboard navigation is equally simple. An orientation axis is displayed in the view to help the user maintain direction. SmartPlant FreeView also has a surface measure command to display accurate distances between objects.

    Vlad Savulian, engineering systems lead for AMEC Natural Resources and one of the many industry experts who worked with Intergraph on the requirements for a free .VUE viewer, said access to SmartPlant FreeView will benefit companies of all sizes, especially those collaborating on mega-projects.

    “On the oil sands projects in Canada, AMEC works with a large number of clients, partners and subcontractors who could benefit from viewing the 3D model,” Savulian said. “With SmartPlant FreeView, they will be able to easily navigate the plant model, view properties, make comments on what they see or ask questions about what they don’t understand. With the introduction of SmartPlant FreeView, we will be able to extend model review capabilities to a much broader audience.”

    Gerhard Sallinger, Intergraph Process, Power & Marine president, agreed: “SmartPlant FreeView enables our customers and their suppliers to increase productivity and competiveness without increasing costs. The use of SmartPlant 3D and SmartMarine 3D has doubled in the last two years. With that tremendous growth comes the need for a variety of users, including design, engineering, construction, operations and maintenance, to view these complex 3D models.

    “Now, for example, an engineering company can provide a 3D model to a potential subcontractor who can use SmartPlant FreeView for a preliminary review and bid based on the actual model rather than a collection of drawings – without having to purchase viewing software,” Sallinger said. “Then once the work is awarded, the subcontractor can upgrade to SmartPlant Review for more in-depth review and analysis capabilities.”

  • GIS Meets March Madness: Using Spatial Data to Analyze Basketball Team and Player Performance

    Even if you aren’t a basketball fan, you’ve likely heard the term “March Madness” over the years. It refers to a time when the best U.S. college basketball teams compete for the championship title. Demonstrating the diversity of GIS, a Harvard University professor has introduced an interesting method of analyzing basketball team and player performance using GIS spatial analysis techniques.

    At the MIT (Massachussets Insitute of Technology) Sloan Sports Analytics Conference 2012 (March 2-3, 2012), Harvard Professor Dr. Kirk Goldsberry presented Court Vision, “a new esemble of analytical techniques designed to quantify, visualize, and communicate spatial aspects of NBA performance and unprecedented precision and clarity.”

    Dr. Goldsberry argues that conventional performance metrics, such as shooting percentage, ignore spatial information. This is odd, Dr. Goldsberry explains, because basketball is a spatial sport. For example, the NBA players with the top shooting percentages are all forwards or centers, who typically shoot from shorter distances than players in the guard position. Without analyzing the spatial shooting tendencies, key scoring phenenom remain misunderstood and coaches and players are missing out on an opportunity to accurately analyze and refine their strategies.

    Who’s the Best NBA Shooter?

    “Data: Using game data sets for every NBA game played between 2006 and 2011, we compiled a spatial field goal database that included Cartesian coordinates (x,y) for every field goal attempted in this 5-year period. This data set includes player name, shot location, and shot outcome for over 700,000 field goal attempts. We mapped the shot data atop a base map of a NBA basketball court (Figure 1). Although a regulation NBA court is 4,700 ft2, (50ft x 94ft), almost all (>98%) field goal attempts occur within a 1,284 ft2 area in between the baseline and a relatively thin buffer around the 3-point arc; we call this area the “scoring area.” We divided the scoring area into a grid consisting of 1,284 unique “shooting cells,” each 1 ft2 (Figure 1). To quantify shooting range, we applied spatial analyses to evaluate shooting performance across the grid and within each shooting cell.”

    NBA field goal attempts 2006-2011 (Source: Dr. Kirk Goldsberry).
    NBA field goal attempts 2006-2011 (Source: Dr. Kirk Goldsberry).
    NBA field goal attempts (Source: Dr. Kirk Goldsberry)
    NBA field goal attempts (Source: Dr. Kirk Goldsberry)

    “Our composite shot maps from 2006-2011 NBA game data. The first map summarizes the density of all field goal attempts during the study period. The second map reveals league-wide tendencies in both shot attempts and points per attempt. Larger squares indicate areas where many field goals were attempted; smaller squares indicate fewer attempts. The color of the squares is determined by a spectral color scheme and indicates the average points per attempt for each location. Orange areas indicate areas where more points result from an average attempt, and blue areas indicate fewer points per attempt.”

    “We derived metrics that described spatial aspects of shooting performance throughout the scoring area. The most basic metric is called “Spread,” which is simply a count of the unique shooting cells in which a player has attempted at least one field goal. The raw result is a number between 0 and 1,284 and summarizes the spatial diversity of a player’s shooting attempts. By dividing this count by 1,284 and multiplying by 100, we generated Spread%, which indicates the percentage of the scoring area in which a player has attempted at least one field goal.”

    “Spread describes the overall size of a player’s shooting territory. League leaders in FG% generally have a small Spread value since they tend to only shoot near the basket. For example, since centers generally thrive in limited areas near the hoop they tend to have lower Spread values than shooting guards. Kobe Bryant has the highest spread value in the NBA (table 1); Bryant’s value of 1,071 indicates he has attempted field goals in 1,071 of the 1,284 shooting cells or 83.4% of the scoring area. In contrast, Dwight Howard has attempted field goals in only 23.8% of the shooting cells. Although Spread% favors players who simply shoot frequently, it also reveals that some players like Dwight Howard who do shoot a lot, only do so in limited court spaces. For example, Al Jefferson attempted 400 more field goals than Ray Allen during the study period, yet his Spread value is only 595 (46.3%), while Ray Allen’s is 952 (74.1%). Visual depictions of the spread variable expose the stark differences in individual players’ spatial shooting behaviors. Via the graduated symbol cartographic technique, figure 2 reveals the spatial structure of Al Jefferson and Ray Allen’s field goal attempts during the study period. Jefferson is highly active in the central areas near the basket, and clearly favors posting up defenders on the right side of the court. Meanwhile, Ray Allen is highly active behind the 3-point arc; he attempts many 3-point field goals, but is relatively inactive from mid-range areas.”

    Spread variable for Al Jefferson (Source: Dr. Kirk Goldsberry)
    Spread variable for Al Jefferson (Source: Dr. Kirk Goldsberry)
    Spread variable for Ray Allen (Source: Dr. Kirk Goldsberry)
    Spread variable for Ray Allen (Source: Dr. Kirk Goldsberry)

    “These Spread visualizations reveal a player’s basic shooting tendencies, but tell us nothing about potency. Shooting skill requires more than just attempts; the best shooters in the league are able to make baskets at effective rates from many court locations. To describe the spatial potency of players we created a metric called “Range,” which is a count of the number of unique shooting cells in which a player averages at least 1 point per attempt (PPA). PPA varies considerably around the court. As anyone who has ever shot a basketball knows, the probability of a shot attempt resulting in a made basket is spatially dependent; some shots are easier than others, and some players are unable to shot effectively from most court locations. Range accounts for spatial influences on shooting effectiveness. It is essentially a count of the number of shooting cells in which a player averages more than 1 PPA; we chose PPA over FG% because it inherently accounts for the differences between 2-point and 3-point field goal attempts.”

    “By dividing this count by 1,284 and multiplying by 100, we generated Range%, which indicates the percentage of the scoring area in which a player averages more than 1 PPA. Steve Nash is ranked first. He has a Range value of 406, indicating that he averages over 1 PPA from 406 unique shooting cells, or 31.6% of the scoring area. Ray Allen was ranked second (30.1%), Kobe Bryant (29.8%) was third, and Dirk Nowitzki (29.0%) was fourth (table 2). Figure 3 visualizes the shooting range of these four players.”

    “Steve Nash has the highest Range% in our case study, but does this mean he is the best shooter in the NBA? That obviously remains debatable; however it is certain that over the last few NBA seasons, Nash and Ray Allen are the most effective shooters from the most diverse court locations. The average shooter in the NBA has a Range% of 18.5, meaning they score efficiently from 18.5% of the scoring area. Nash and Allen are the only two players in the league whose Range% values exceed 30%; only a handful of players in the league average more than 1 PPA from at least 25% of the scoring zone (table 2), and unsurprisingly, despite being among the leaders in FG%, Dwight Howard (Range% = 6.5) and Nene Hilario (Range% = 3.7) are not on that list. Whether the Range% metric is the best way of quantifying shooting range or not, it seems to capture pure shooting ability better than FG% or eFG%.”

    The following images depict the shooting ranges of Steve Nash, Ray Allen, Dirk Nowitzki, and Kobe Bryant. According to Dr. Goldsbery, “these four players had the highest range values, but these graphics reveal that they achieve them in much different ways. For example, when compared to the three others, Dirk Nowitzki shoots relatively few 3-point shots and performs much better in the mid-range areas on the left side of the court, while Ray Allen excels in the corners of the court where Steve Nash rarely shoots.”

    Steve Nash shooting range (Source: Dr. Kirk Goldsberry)
    Steve Nash shooting range (Source: Dr. Kirk Goldsberry)
    Ray Allen shooting range (Source: Dr. Kirk Goldsberry)
    Ray Allen shooting range (Source: Dr. Kirk Goldsberry)
    Dirk Nowitzky shooting range (Source: Dr. Kirk Goldsberry)
    Dirk Nowitzky shooting range (Source: Dr. Kirk Goldsberry)
    Kobe Bryant shooting range (Source: Dr. Kirk Goldsberry)
    Kobe Bryant shooting range (Source: Dr. Kirk Goldsberry)

    “Steve Nash has the highest Range% in our case study, but does this mean he is the best shooter in the NBA? That obviously remains debatable; however it is certain that over the last few NBA seasons, Nash and Ray Allen are the most effective shooters from the most diverse court locations. The average shooter in the NBA has a Range% of 18.5, meaning they score efficiently from 18.5% of the scoring area. Nash and Allen are the only two players in the league whose Range% values exceed 30%; only a handful of players in the league average more than 1 PPA from at least 25% of the scoring zone (table 2), and unsurprisingly, despite being among the leaders in FG%, Dwight Howard (Range% = 6.5) and Nene Hilario (Range% = 3.7) are not on that list. Whether the Range% metric is the best way of quantifying shooting range or not, it seems to capture pure shooting ability better than FG% or eFG%.”

    To view Dr. Goldsberry’s complete paper, click here.

    Thanks, and see you next week.

    Follow me on Twitter at http://twitter.com/GPSGIS_Eric

  • eLoran and UrsaNav: Timing Is Everything

    The first part of the recent UrsaNav press release says it best:

    This week for the first time since August 2010 advanced low frequency (LF) signals, including a new eLORAN, are on the air in North America! As a result of a Cooperative Research and Development Agreement (CRADA) between the United States Coast Guard (USCG) and UrsaNav, Inc. live testing of a wide-area precise timing solution has begun. These initial tests include a comprehensive pallet of signals, including eLoran, that are being evaluated for their ability to provide a robust, wide-area, wireless precise timing alternative that can operate cooperatively with GPS, or during periods of GPS unavailability.

    Why eLORAN

    Global government, industry, and academic experts recognize that advanced LF signals, of which eLORAN is just one example, can provide alternative timing — either as a stand-a-lone service, or as a component of an existing PNT service. The high power, virtually jam proof and spoof proof LF signals operate independently of GPS and GNSS, and provide a Universal Coordinated Time (UTC) time reference in the order of tens of nanoseconds. The recognition of the criticality of time to many aspects of our national critical infrastructure has led to establishment of the CRADA to evaluate the benefits of an LF wide-area timing system.

    UrsaNav on-air eLORAN tests continue at various sites throughout the United States (CONUS and Alaska). Broadcast demonstrations will test several different frequencies, waveforms, and modulation techniques using evolutionary state-of-the-art technology.

    Reception demonstrations of the eLORAN broadcasts are planned at both on- and offshore locations, and will include advanced LF data delivery techniques. Trial results will be presented at national and international conferences. Anyone interested in any part of the testing or interested in making their own measurements are invited to contact UrsaNav.


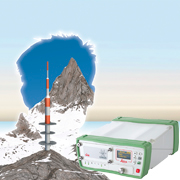
    UrsaNav eLORAN system. Arthur Helwig (UrsaNav) and
    Aaron Grant (Nautel) prepare the LF transmitter for the next
    set of on-air tests.

    Partnered with Symmetricom and Nautel, UrsaNav says it has the world’s most advanced LF alternate PNT and data solutions to include the world’s best high-performance eLORAN timing receivers. UrsaNav has partnered with two of the best in the business for timing and transmitters, and this alliance of expertise provides the foundation technology for the best wide-area terrestrial-based alternative to GNSS such as GPS, GLONASS, and Galileo.

    That being said, I would add that you should not only consider the UrsaNav LF system as an alternative, but during normal GPS operations as a complimentary and/or augmentation to GPS, and then as a back-up and integrity system when the situation warrants.

    As one of my professional colleagues, who is a retired USCG officer and once ran the USCG Navigation Center, stated, “This is a big deal! It is in fact the first and biggest piece of good news about a true PNT (position, navigation, and timing) backup for GPS since Loran-C was killed in the FY2010 budget.

    “Not only is this an independent timing backup, but the LF signals can also be used as pseudoranges mixed in with GPS, or if enough transmitters are available, as a fully independent PNT network. In other words, a true backup PNT capability for safety-of-life navigation, for dispatching first responders, and for supporting critical national infrastructures.”

    This is a pretty enthusiastic response, even from a LORAN aficionado, and it is indicative of the responses I received whenever I reached out for comments from knowledgeable PNT SMEs (subject matter experts) around the globe.

    The response nationally and internationally has been extremely positive as well — especially in light of the recent LightSquared debacle and the now better-understood vulnerabilities of the very low-power GPS signals.

    I hoped I would never have to type or have you read that word again, as a noun or a verb, but the whole LightSquared scenario did serve to point out a dire need and shortcoming in the U.S. PNT infrastructure. Fortunately, the proposed UrsaNav eLORAN system appears to be on track to fill that need perfectly.

    For the first 32 years that GPS signals were broadcast, LORAN-C served as a critical backup for timing and a less accurate but viable alternative for navigation. In fact, Loran-C, along with GPS and cesium clocks synchronized to UTC, were the only accepted Stratum 1 frequency sources at the time (Stratum 1 frequency sources provide a minimum frequency stability of 1 x 10-11 per day.). Then in 2010 the current U.S. administration was looking for government programs to cut and for some unknown reason they latched onto LORAN-C, which was in a critical state of transition at the time.

    LORAN-C has been around since World War II. I among many other aviators used it extensively in Vietnam, and frankly for many countries and users today it is still a totally adequate service. With USCG expertise and support for 52 years, LORAN-C provided unparalleled timing and navigation services around the United States and Canada until the pretender known as GPS came along and dethroned the aging monarch.

    Now, that may sound like a natural sequence of events, except that LORAN-C was in metamorphosis, 80% of the way through the process actually, of morphing into a new digital (1990s era technology) LORAN know as eLORAN or enhanced LORAN with better, more reliable transmitters, smaller receivers, and a virtually jam-proof signal structure. Many likened the legacy eLORAN to a strong ground-based GPS with coded signals for security. All that was in place and 80% complete when the whole process was killed by an administration with a strong Luddite orientation and subsequently the bean counters pulled the plug in 2010, despite recommendations to complete eLoran from both the Department of Transportation’s Positioning and Navigation (PosNav) Committee and the Department of Homeland Security Geospatial Committee and the strong personal support of the DOT Undersecretary for Policy and the DHS Deputy Undersecretary for Preparedness and National Protection and Programs. My sources tell me the Office of Management and Budget (OMB) was determined to do away with Loran-C and facilitated its ultimate demise. An unfortunate theme we have seen played out much too often: Non-technical people forcing ill-advised technical decisions. In a country whose greatness has always been its technical acumen, willingness to take risks, and self-assurance, OMB stands as a chilling element of focus today…but, that’s a subject for a future article.

    Since that time the U.S. Coast Guard spent more money dismantling the legacy LORAN-C infrastructure and antennas than it would have taken to complete the 20% upgrade for a full transition to eLORAN. Taking down the Port Clarence, Alaska, tower, the video of which was a YouTube favorite for many weeks, cost an estimated $8 million. The destruction of the towers in Attu (right), Shoal Cove and St. Paul were probably on average $5 million each. With the tower removal in Baudette, Minnesota, the cost of removing Loran towers to date cost close to $25 million. One could argue that the administration created some jobs in these “shovel-ready” tower tear downs, but I have no doubt that a better use of the funding would have been to deliver a robust positioning, navigation, and timing backup for the nation. But alas that is ancient history in the technology world, a whole 18 months to be exact.

    Then along comes the Lone Rang… I mean Chuck Schue, the CEO and president of UrsaNav, which is a small company originally founded by Charles “Chuck” Schue, because frankly he has always been interested in navigation. Chuck is a former ION (Institute of Navigation) Washington, D.C., Section Chair and is a current member of the ION Council. Chuck is also a retired USCG officer and his last job in the USCG was as Commanding Officer of the Loran Support Unit, providing direct support to a large portion of the functions supported by the USCG Navigation Center (NAVCEN). So it is no accident that Chuck and UrsaNav saw the gaping hole for GPS support that was created when LORAN-C and the legacy eLORAN programs were unceremoniously put on the chopping block. Now UrsaNav with their new 2012 version of eLORAN and the help of the USCG, through a CRADA, have stepped in to fill a very real need.

    In my opinion (pun intended) their timing could not have been better. LightSquared is hopefully behind us along with the threat of losing GPS capabilities and all GPS P&T (positioning and timing) enables without a viable backup. This is definitely not a scenario any sane person wants to see happen again and fortunately UrsaNav LF timing and eLORAN can provide a critical back-up, augmentation and integrity check while simultaneously providing the USG with a security blanket, as Linus would say.

    The USCG-UrsaNav CRADA

    Before considering reactions from other USG agencies and then international reactions to the UrsaNav program, maybe it would be best, in case any of you are wondering, to describe the function of the subject CRADA since it has been mentioned several times.

    In February 2012 the U.S. Coast Guard Research & Development Center (R&DCEN) announced it had entered into a Cooperative Research and Development Agreement (CRADA) with UrsaNav to research, evaluate, and document at least one alternative to the Global Positioning System (GPS) as a means of providing precise time. The alternative under consideration is a wireless technical approach for providing precise time using U.S. government facilities and frequency authorizations.

    While this is a very general statement and does not give much away, it is meant to be that way since it is, after all, an R&D effort and general statements give you the most leeway when considering options and trade space.

    CRADAs are authorized by the Federal Technology Transfer Act to promote the transfer of technology to the private sector for commercial use as well as specified research and/or development efforts that are consistent with the mission of the federal parties to the CRADA. The federal party or parties (USCG) agree with one or more non-federal parties (UrsaNav) to share research resources, but the federal party does not contribute funding.

    This means that the USCG and UrsaNav are sharing R&D efforts, data, and even non-monetary resources, but the USG is not providing any funding to UrsaNav for the project. So UrsaNav is footing the bill; at the same time, it has access to USG data and resources, to include buildings and transmitting towers, for example, and UrsaNav knows it has at least generated interest among government and commercial users for LF timing signals.

    DOT/FAA Reactions

    When I first saw the UrsaNav announcement, I immediately thought of the DOT and FAA, since they have been trying to think of ways to provide a common, non-GNSS, distributed timing backup for all their facilities and customers as part of their efforts to develop an alternate PNT (APNT) capability. One of the APNT alternatives is considering distributing time to air traffic control facilities and aircraft through their ground-based DME (distance measuring equipment) facilities. For the non-aviators among you, DME signals allow aircraft to determine their distance from a DME location. Properly equipped aircraft (primarily commercial and high-end general aviation) can use ranging from multiple DMEs to actually determine their position and follow area navigation (RNAV) procedures for more effective routing and flexibility. In order to utilize the DMEs as a ground-based, high-power (1000 W) equivalent of a satellite constellation will require each DME facility to be synchronized in time to around 30 nanoseconds or better. Now, with the possibility of an eLORAN time standard with a huge booming, virtually jam-proof and spoof-proof signal, across the CONUS and Alaska, this FAA alternative solution could be greatly facilitated. While the FAA also has the option to use GPS time, or time from its own WAAS ground-based clock ensemble, or WAAS retransmitted time combined with GPS time for remote locations and to back it all up and provide an integrity check, the availability of an eLoran alternative is certainly worthy of FAA APNT consideration. The FAA’s distribution problems would be solved, and since both GPS and eLORAN have the capability for encoded signals, the integrity (information assurance) and security problems are solved as well. Comparison of the vulnerable GNSS signal with the robust eLoran timing signal could alert an operator to possible spoofing or even a less sinister loss of integrity event. So this is a win/win for the FAA and several other critical national agencies and infrastructures that must remain nameless for security purposes.

    International Partners

    What makes the UrsaNav solution so promising and frankly exciting is that they are not conducting these experiments and demonstrations in isolation. For the past few months UrsaNav has been working with the Lighthouse Authorities of the United Kingdom and Northern Ireland as well as Chronos Technology, a world leader in GNSS jamming and interference detection, in Great Britain. To determine how the UrsaNav eLORAN program is progressing internationally, who are you going to call? Personally, if it concerns GPS, time, and the UK, there are two people who immediately come to mind: Dr. David Last and Martin Bransby.

    Professor David Last is a consultant engineer and internationally renowned expert witness specializing in radio navigation and communications systems. David is a Professor Emeritus (that means he is at least as old as I am) at the University of Bangor, Wales, and Past-President of the Royal Institute of Navigation (RIN), the equivalent of the U.S. ION, but RIN has only been around since 1947. David acts as a consultant on radionavigation and communications to companies and to governmental and international organizations worldwide and is active as an expert witness, especially in forensic matters concerning GPS.

    Both David and Martin are highly qualified SMEs and BLUF, or bottom line up front; their praise for the UrsaNav initiative could not be higher.

    According to Professor Last, “…a ‘sky-free’ timing service like the one UrsaNav will hopefully soon be radiating in the United States is already available across the British Isles and adjacent parts of Europe. The eLORAN system uses the GLAs’ prototype eLoran system plus GPS/eLoran timing receivers from UrsaNav and Chronos Technology.

    “The prototype eLoran service has been running 24/7 since January 2008, serving the eastern half of Britain and the North Sea. It now delivers 10-meter (~30 feet) navigation accuracy in the approaches to Harwich and Felixstowe, the UK’s major container ports, where a prototype full differential service has been in place since mid-2010.

    “In addition, the UK transmissions support a prototype robust, nationwide data channel that will benefit in future from the techniques currently being developed by UrsaNav to expand the data capacity of eLoran-compatible LF transmissions.

    “This is all part of the resurgence of terrestrial LF services in response to the vulnerability of GPS and all other GNSS (read LightSquared). The GLAs are leading this movement to adopt eLoran as the terrestrial complement at sea and supporting the use of the new eLoran transmissions for sky-free complementary navigation, timing, data, and tracking of land vehicles. And the neat thing about LF timing and data is that a single station serves a large area. So the UK station delivers data across the UK and timing even more widely. This appeals to all sorts of folks who aren’t interested in navigation. But once enough timing and data stations are on the air, you get back navigation!”

    Now, Martin Bransby is the R&RNAV (Research and Radionavigation) manager for the General Lighthouse Authorities (GLAs) of the UK & Ireland. Which simply means he is a senior engineering manager and program manager with extensive experience in R&D of highly technical assets, such as maritime aids to navigation, radar, C4ISTAR, and tactical data links, and he is the official GLA POC working the eLORAN program in the UK and Ireland, which he indicates is progressing extremely well. So well, in fact, the GLAs awarded a 15-year contract to provide a state-of-the-art eLORAN service to improve the safety of mariners in the UK and Western Europe. The service contract includes R&D work and the operation of an eLORAN service through 2022.

    Support: The Good News

    Back on this side of the pond, my sources at the USNO (U.S. Naval Observatory) our resource for Coordinated Universal Time or UTC are supportive of the UrsaNav eLORAN effort. A senior source, who prefers to remain anonymous, stated that the USNO will support any USG terrestrial time distribution system that may emerge from the UrsaNav eLORAN effort by providing the underlying timing reference “UTC (USNO).” However, to achieve true GPS independence, my source would like to see either fiber-optic or two-way satellite time transfer (TWSTT) utilized to sync the eLORAN ground transmitters. And in the end higher power, GPS independence, and good indoor reception are probably the greatest advantages. My source is looking forward to the results of this initial demonstration by UrsaNav and the USCG.

    According to Chuck Schue, UrsaNav, anticipated this USNO preference and is working with Symmetricom on a TWSTT while also developing a TWLFTT, or two-way low-frequency time transfer capability, which allows for time transfer from a UTC source such as USNO or NIST that is completely sky-free.

    The Bad News

    We’ve all heard the Biblical phrase that originated in Matthew concerning “the right hand not knowing what the left hand is doing.” In this instance, where eLORAN is concerned, the USCG may have adopted that as a program motto.

    Note: The real motto of course is Semper Paratus, and the brave men and women of the USCG live up to it everyday.

    Originally in the Unites States, CONUS, and Alaska, there were 24 LORAN-C transmitters with towers between 600 and 1350 feet tall; add the towers supporting the Joint U.S.-Canadian LORAN-C system plus the LORAN-C Support Unit tower, and there were a total of 30 huge LORAN-C towers with all the accompanying support structures for the transmitters, support crews, etc. Today, there are only 25 towers remaining — as the USCG engineers are in the process of dismantling the LORAN-C infrastructure — five towers in the last 18 months.

    As often happens in a large distributed organization, though Headquarters (CG-5) supports the eLORAN CRADA with UrsaNav and fully realizes that future eLORAN deployment depends on reuse of existing infrastructure, the civil engineering support organization gets its money and develops its project lists separately. Consequently the antenna towers at Attu (located at the end of the Aleutian chain) and Port Clarence (situated well north of Nome) have come down, as have the towers in St. Paul (in the Pribilof Islands, northern Bering Sea) and Shoal Cove (located in SE Alaska, near Ketchikan). Only two towers remain in Alaska; one in Kodiak (adjacent to the USAF-Alaska launch facility) and one at Tok Junction (on the ALCAN Highway, southeast of Fairbanks). Within CONUS, the USCG engineers are in the process of dismantling the facilities in Baudette — which is just about as isolated as some of the sites in Alaska.

    Operational Issues

    The operational problem is that while the much more powerful and economical energy-scavenging transmitters from UrsaNav’s partner Nautel, and new wave forms being produced by UrsaNav, probably only need to utilize 8-10 towers — the system is that much better and more powerful — no one knows where they need to be located until more tests are conducted. So how do the USCG engineers know which ones to dismantle? Obviously they don’t and there’s the rub, plus if the system is really successful and the data portion is a success, there could be a need for even more towers. Solution — the R&D guys (RH) need to coordinate with the engineering crews (LH) and put a hiatus on dismantling LORAN-C towers and the associated infrastructure, unless they pose a safety hazard, until the outcome of the CRADA and subsequent acquisition decisions have been made.

    Seriously, the USCG and UrsaNav are heroes for initiating the CRADA, and my hat is off to them for realizing the critical need for eLORAN, but seriously, somebody pick up a phone and call the engineers, call the Commandant, call somebody that can put the tower demolitions on hold.

    The bottom line is UrsaNav and the USCG are to be congratulated for their foresight and planning. Let’s hope the eLORAN demonstrations continue to be successful and that a contract is forthcoming quickly before we, and the powers that be, forget the LightSquared lessons learned…like we would ever let that happen.

    All in all, this is a win/win proposition for the USCG, the USG, and for GPS users everywhere. Stay tuned for more on this topic.

    While you are reading this I will be attending the Munich Satellite Summit in Germany, so guess what my topic will be next month?

    Until next time, happy navigating.

  • The Kinematic GPS Challenge: First Gravity Comparison Results

    By Theresa Diehl

    The National Geodetic Survey (NGS) has issued a “Kinematic GPS Challenge” to the community in support of NGS’ airborne gravity data collection program, called Gravity for the Redefinition of the American Vertical Datum (GRAV-D). The “Challenge” is meant to provide a unique benchmarking opportunity for the kinematic GPS community by making available two flights of data from GRAV-D’s airborne program for their processing. By comparing the gravity products that are derived from a wide variety of kinematic GPS processing products, a unique quality assessment is possible.

    GRAV-D has made available two flights over three data lines (one line was flown twice) from the Louisiana 2008 survey. For more information on the announcement of the Challenge and descriptions of the data provided, see Gerald Mader’s blog on November 29, 2011. The GRAV-D program routinely operates at long-baselines (up to 600 km), high altitudes (20,000 to 35,000 ft), and high speeds (up to 280 knots), a challenging data set from a GPS perspective. As of December 2011, ten groups of kinematic GPS processors have provided a total of sixteen position solutions for each flight. At two data lines per flight, this yielded 64 total position solutions. Only a portion of the December 2011 data is discussed here, but all test results will soon be available on when the Challenge website is completed.

    Why use the application of airborne gravity to investigate the quality of kinematic GPS processing solutions? Because the gravity measurement itself is an acceleration, which is being recorded with a sensor on a moving platform, inside a moving aircraft, in a rotating reference frame (the Earth). The gravity results are completely reliant on our ability to calculate the motion of the aircraft— position, velocity, and acceleration. These values are used in several corrections that must be applied to the raw gravimeter measurement in order to recover a gravity value (Table 1). The corrections in Table 1 are simplified to assume that the GPS antenna and gravimeter sensor are co-located horizontally and offset vertically by a constant, known distance.


    Table 1. GPS-Derived Values that are used in the Calculation of Free-Air Gravity Disturbances

    All Challenge solutions are presented anonymously here, with f## designations. For each flight of data, the software that made the f01 solution is the same as for f16, f02 the same as f17, and so on.

    Test #1: Are the solutions precise and accurate?

    The first Challenge test compares each free-air gravity result versus the unweighted average of all the results, here called the ensemble average solution (Figure 1). This comparison highlights any GPS solutions whose gravity result is significantly different from the others, and will group together solutions that are similar to each other (precise). Precision is easy to test this way, but in order to tell which gravity results are accurate calculations of the gravity field, a “truth” solution is necessary. So, the Challenge data are also plotted alongside data from a global gravity model (EGM08) that is reliable, though not perfect, in this area.

    Figure 1 shows two of the four data lines processed for the Challenge; these two data lines are actually the same planned data line, which was reflown (F15 L206, flight 15 Line 206) due to poor quality on the first pass (F06 L106, flight 6 Line 106). The 5-10 mGal amplitude spikes of medium frequency along L106 are due to turbulence experienced by the aircraft, turbulence that the GPS and gravity processing could not remove from the gravity signal.


    Figure 1.


    Figure 2.

    Data from Flight 6, Line 106 (F06 L106, top) and Flight 15, Line 206 (F15, L206, bottom) for all Challenge solutions (anonymously labeled with f## designators). Figures 1 and 2. Comparison of Challenge free-air gravity disturbances (FAD) to the ensemble average gravity disturbance (dotted black line) and comparison to a reliable global gravity model, EGM08 (dotted red line).


    Figure 3.


    Figure 4.

    Figures 3 and 4. Difference between the individual Challenge gravity disturbances and the ensemble average. The thin black lines mark the 2-standard deviation levels for the differences. For F15 L206, one solution (f23) was removed from the difference plot and statistics because it was an outlier. For both lines, the ensemble’s difference with EGM08 is not plotted because it is too large to fit easily on the plot.


    The results of test #1 are surprising in several ways:

    • The data using the PPP technique (precise point positioning, which uses no base station data) and the data using the differential technique (which uses base stations) produce equivalent gravity data results, where any differences between the methods are virtually indistinguishable.
    • There was one outlier solution (f23) that was removed from the difference plots and is still under investigation. Also, on F15 L206, solution f28 had an unusually large difference from the average though it performed predictably on the other lines. Of the remaining solutions, four solutions stand out as the most different from all the others: f03/f18, f04/f19, f05/f20, and f07/f22.
    • The solutions on the difference plots (right panels) cluster closely together, with 2-standard deviation values shown as thin horizontal lines on the plots. The Challenge solutions meet the precision requirements for the GRAV-D program: +/- 1 mGal for 2-standard deviations.
    • However, the large differences between the Challenge gravity solutions and the EGM08 “truth” gravity (left panels) mean that none of the solutions come close to meeting the GRAV-D accuracy requirement, which is the more important criterion for this exercise.

    Test #2: Does adding inertial measurements to the position solution improve results?

    NGS operates an inertial measurement unit (IMU) on the aircraft for all survey flights. The IMU records the aircraft’s orientation (pitch, roll, yaw, and heading). Including the orientation information in the calculation of the position solution should yield a better position solution than GPS-only calculations, but it was not expected to be significantly better. Figure 2 shows the NGS best loosely-coupled GPS/IMU free-air gravity result versus the Challenge GPS-only results and Table 2 shows the related statistics.


    Figure 5.


    Figure 6.

    Figures 5 and 6. F06 L105. (Figure 5) Comparison of Challenge FAD gravity solutions (ensemble=black dotted line) with EGM08 (red dotted line); (Figure 6) comparison of Challenge gravity solutions (all GPS-only; ensemble=black dotted line) with NGS’ coupled GPS/IMU gravity solution (red dotted line).


    Table 2. Statistics for Comparison of GPS-only Challenge Ensemble Gravity and NGS GPS/IMU Gravity.


    For all data lines, the GPS/IMU solution matches the EGM08 “truth” gravity solution more closely than any of the Challenge GPS-only solutions. In fact, the more motion that is experienced by the aircraft, the more that adding IMU information improves the solution. One conclusion from this test is that IMU data coupled with GPS data is a requirement, not optional, in order to obtain the best free-air gravity solutions.

    Additional Testing and Future Research

    Other testing has already been completed on the Challenge data and the results will be available on the Challenge website soon. Important results are:

    • Two Challenge participants’ solutions perform better than the rest, two perform worse, and one is a low quality outlier. The reasons for these differences are still under investigation.
    • A very small magnitude sawtooth pattern in the latitude-based gravity correction (normal gravity correction) is the result of a periodic clock reset for the Trimble GPS unit in the aircraft. This clock reset is uncorrected in the majority of Challenge solutions. The clock reset causes an instantaneous small change in apparent position, which results in a 1-2 mGal magnitude unreal spike in the gravity tilt correction at each epoch with a clock reset.
    • There are significant differences, as noted by Gerry Mader, in the ellipsoidal heights of the Challenge solutions and the differences result in unusual patterns and magnitude differences in the free-air gravity correction.

    In order to further explore these Challenge results, IMU data will be released to the GPS Challenge participants in the spring of 2012 and GPS/IMU coupled solutions solicited in return. Additionally, basic information about the Challenge participants’ software and calculation methodologies will be collected and will form the basis of the benchmarking study.

    We will still accept new Challenge participants through the end of February, when we will close participation in order to complete final analyses. Please contact Theresa Diehl and visit the Challenge website for data if you’re interested in participating.

  • Geospatial Mapping Enhances Arlington National Cemetery Management

    Officials at Arlington National Cemetery will use an Army-designed geospatial mapping system to manage cemetery operations, said the executive director of the Army National Cemeteries Program.


    Kathryn A. Condon testified before the House Veterans Affairs Committee's disability assistance and memorial affairs subcommitee to provide an update on the progress made in rectifying long-standing management problems at Arlington National Cemetery.

    Source: Arlington National Cemetary

    "Arlington is no longer a paper-based operation. By producing a single electronic map of Arlington, the staff will assign, manage and track gravesites with an authoritative digital map," Condon said. "It will allow us to synchronize in real time our burial operations at Arlington."

    The geospatial mapping system allows officials to synchronize burial operations with other daily operations, such as public ceremonies, infrastructure repair, grounds upkeep and public safety activities, Condon explained. The system is linked to Arlington's interment scheduling system, which allows schedulers to assign gravesites and assign procession routes. It also alerts Arlington staff of other activities in the area, she said.

    Arlington is the first national cemetery to use this technology, Condon told the panel.

    The geospatial mapping system will use the information collected and validated as part of the Army's gravesite accountability study. The gravesite accountability effort resulted in the first review, analysis and coordination of records kept in various ways at Arlington over the cemetery's history, Condon said.

    The Gravesite Accountability Task Force physically examined and photographed 259,978 gravesites, niches and markers using a custom-built smartphone application and matched each photo with records in a database. Arlington officials are 84 percent complete in validating records, officials said, and are on track to finish this summer.

    Once complete, Arlington's accountability effort will create a single, verifiable and authoritative database of all those laid to rest at Arlington, officials added, and it will be linked with Arlington's geospatial mapping system.

  • Continued Growth of Connected Vehicle and M2M Highlighted at MWC

    The Mobile World Congress in Barcelona is getting bigger every year — so much that it’s almost a mini CES that is hard to navigate and find companies…much less big location-based services news. While there were no big jaw-dropping mergers and acquisitions, big product roll-outs and partnerships, this conference will continue to be the main showcase for location companies wishing to establish a presence in Europe.


    BARCELONA — It was tough to find out what might be the big deal for the location industry here at the Mobile World Congress, among 67,000 attendees and more than 1,500 exhibitors. Two areas continued to stand out, as they had at the January Consumer Electronics Show: the rise of the connected vehicle and machine-to-machine connections.

    An MWC keynote was given by Ford Motor Co.’s chairman Bill Ford (right), who gave long-term strategies for the company, which includes big connected car components. Ford’s Sync, which is already on 4 million cars in the United States since it was launched in 2007, now is available in Europe. The company hopes to have 13 million cars equipped with the connected service by 2015 — 3.5 million of those in Europe.

    One of the more significant deals at MWC was Sprint Nextel’s announcement that it will be the strategic wireless partner for Chrysler Group’s Uconnect voice-activated vehicle communications system.

    In keeping with the connected theme, GSMA’s Connected House featured such companies as AT&T and Airbiquity that showcased the transfer of connected lifestyle from car to house. Airbiquity demonstrated its products for cloud-based services, mobile phones and application integration into vehicles. The company launched its Application Developer Program at MWC.

    TCS Offers Family Locator to Auto Makers for Connected Car Initiatives

    TeleCommunication Systems announced at the MWC that it’s incorporating the TCS Family Locator into connected vehicles and is offering it on the iPhone and Android platforms. TCS Family Locator allows users to locate family members’ vehicles through aerial photos or maps to monitor when they arrive or leave specific areas.

    TCS was a pioneer in enhanced 911 roll outs, which was the basis of today’s location-based services, said Jay Whitehurst, TCS senior vice president, commercial software group.

    The cloud-based Family Locator product is being offered to vehicle manufacturers, telematics service providers, and wireless carriers for connected car initiatives, the company said.

    Currently, Family Locator supports BlackBerry and other phones.

    For the enterprise market, TCS said its Workforce Locator mobile resource management product now has extended coverage to data cards and any device with a SIM card, which includes mobile Wi-Fi hotspots and tablets.

    Also at MWC, TomTom said it partnered with HTC to provide the maps, points of interest, and turn-by-turn directions for a line of HTC smartphones in India. TomTom views India as a growing market, citing a study that forecasts more than 5.2 million smartphones will ship to the country this year.

    The HTC deal is TomTom’s first major partnership in India, said Nuno Campos, the company’s vice president of sales and marketing for its licensing division. Campos said that Jocelyn Vigreux, formerly president of TomTom USA, has been consolidating all business units in India to steward the company’s HTC partnership there.


    TomTom also announced a partnership with NDrive to deliver maps and other content to its location-based applications. The three-year deal is big for TomTom as NDrive has millions of users worldwide, Campos said.

    When asked how TomTom is competing against the Googles of the world, Campos said that the market is big enough to run a profitable mapping business. His only crack at Google was that “they are finding that making maps isn’t easy.”

    TomTom, through its joint venture partner AutoNavi Holdings Limited, also announced a seven-year agreement with Qoros Auto, an international automotive corporation. TomTom and AutoNavi will deliver HD Traffic, marking the first real-time traffic customer for the newly expanded joint venture. In 2013 the first cars — aimed at young metropolitan users — will hit the streets in China equipped with HD Traffic, providing drivers with the most accurate, comprehensive, and up-to-date traffic information available.

    In other Mobile World Congress news:

    • Urban Airship said its new Unique Opt-In Report allows users to gain insight in to the numbers of distinct users opting in or out of push notifications. This enables companies to hone mobile messaging strategy based on users’ behavior.
    • Locaaid rolled out its Global Cell-ID at MWC. This new feature, accessible via Locaid’s Location-as-a-Service (LaaS) platform, allows enterprise mobile developers to acquire carrier-certified, permission-based location on their devices in more than 165 countries around the globe.
    • American Roamer changed its name to Mosaik Solutions at MWC. Through its partnership with Europa, the company’s Global Coverage Analyzer and CellMaps are marketed in Europe. Mosaik Solutions’ customers include AT&T International, OnStar, and Comcast.
    • ALK Technologies Inc., which previously charged for its navigation applications, now said its CoPilot GPS is a free app for iPhone, iPad, and Android devices. The company contends that CoPilot is a lot more than Google’s free map service and allows users to search millions of pre-installed points of interest for nearby restaurants, hotels, and gas stations. The company had a booth at MWC and exhibited at Showstoppers, as did Poynt.

    Indoor positioning continued to be a big topic to enable LBS markets at the Mobile World Congress. Richard Najarian, Broadcom senior director, business development, said that market is shaping up. The company also showed off its Bluetooth Low Energy modules that enable indoor location positioning.


    Some other MWC observations:

    1. Qualcomm had an off-site reception for its indoor positioning partners that included Cisco and others.
    2. The Android room at MWC was huge…with such companies as Glympse participating.
    3. Telmap, now owned by Intel, which has recently said it will invest millions into connected vehicle initiatives, has a strong presence in Europe with many LBS applications.

    The company says it’s the No. 1 local content aggregator in Europe, according to Motti Kushner, Telmap’s chief marketing officer.

    Neustar, which is partnering with TELUS and other major operators in North America to create mobile services, had a large presence at MWC. The company’s intelligent cloud helps operators to integrate location and messaging, said Gary Zimmerman, Neustar’s director of product marketing.

    Some of these applications include geofence, which Neustar works with partner ZOS, to create opt-in mobile campaigns that send offers to subscribers based on their location. The company also offers enhanced location that shows how a brand can personalize location information once a consumer gives consent to participate.

    GPS World Partnering with GPS-Wireless

    GPS World is the GPS-Wireless (www.gps-wireless.com) conference’s exclusive media partner. GPS World’s Chris Litton will be on site at GPS-Wireless 2012, which is March 21-22 at the Hyatt Regency San Francisco Airport, to discuss why location companies should advertise in the magazine and LBS Insider, which has more than 10,000 worldwide subscribers.

  • Septentrio, QinetiQ Partnership Delivers Galileo PRS Signal Reception

    Another major milestone in the Galileo system’s development and deployment program has been achieved. Septentrio and QinetiQ, working in close partnership with the European Space Agency (ESA) and their industrial partners, achieved the world’s first successful reception of the encrypted Galileo Public Regulated Service (PRS) signal from the first Galileo satellites, launched in November 2011.

    The signal was received on the Galileo PRS Test User Receiver (PRS-TUR) jointly developed by Septentrio and QinetiQ under an ESA contract. For the reception test, the receiver was installed in the Galileo Control Centre in Fucino, Italy and operated by technical experts from ESA. This milestone builds on a number of previous major Septentrio/QinetiQ achievements including:

    • First ever laboratory demonstration of the PRS signal acquisition and tracking in QinetiQ (Malvern, UK, 2006).
    • Successful RF compatibility test between a Galileo payload and the PRS-TUR (Portsmouth, UK, 2010).
    • Successful Galileo end-to-end system test including the Galileo Ground Mission Segment (GMS) and its key management facilities, satellite and PRS-TUR (Rome, Italy, 2011).

    Septentrio and QinetiQ are long-term contributors to the Galileo Programme, working closely with ESA, the European GNSS Agency (GSA), and European industrial partners since 2003.

    “Septentrio is extremely proud of this historic milestone for the Galileo programme," said Peter Grognard, founder and CEO of Septentrio Satellite Navigation. "This is the most important milestone for Septentrio since the reception of the world’s first Galileo signal from space on January 12, 2006, with a Septentrio receiver. We are honoured and grateful for the excellent collaboration with ESA. Septentrio is marking another industry-first on the Galileo programme, and will continue playing a key role in this exciting and ambitious European project. Today, together with our partners, we take a decisive step in the early availability of commercial PRS receivers to foster user acceptance and market success of this Galileo service.”

    "This achievement, together with Europe’s recent commitment to a full Galileo constellation, has been a necessary step in giving European industry confidence to start investing in developing commercial PRS receiver products ready for the launch of Galileo navigation services in a few years time,” Leo Quinn, CEO of QinetiQ, said.

  • Septentrio, QinetiQ Partnership Delivers Galileo PRS Signal Reception

    Another major milestone in the Galileo system’s development and deployment program has been achieved. Septentrio and QinetiQ, working in close partnership with the European Space Agency (ESA) and their industrial partners, achieved the world’s first successful reception of the encrypted Galileo Public Regulated Service (PRS) signal from the first Galileo satellites, launched in November 2011.

    The signal was received on the Galileo PRS Test User Receiver (PRS-TUR) jointly developed by Septentrio and QinetiQ under an ESA contract. For the reception test, the receiver was installed in the Galileo Control Centre in Fucino, Italy and operated by technical experts from ESA. This milestone builds on a number of previous major Septentrio/QinetiQ achievements including:

    • First ever laboratory demonstration of the PRS signal acquisition and tracking in QinetiQ (Malvern, UK, 2006).
    • Successful RF compatibility test between a Galileo payload and the PRS-TUR (Portsmouth, UK, 2010).
    • Successful Galileo end-to-end system test including the Galileo Ground Mission Segment (GMS) and its key management facilities, satellite and PRS-TUR (Rome, Italy, 2011).

    Septentrio and QinetiQ are long-term contributors to the Galileo Programme, working closely with ESA, the European GNSS Agency (GSA), and European industrial partners since 2003.

    “Septentrio is extremely proud of this historic milestone for the Galileo programme,” said Peter Grognard, founder and CEO of Septentrio Satellite Navigation. “This is the most important milestone for Septentrio since the reception of the world’s first Galileo signal from space on January 12, 2006, with a Septentrio receiver. We are honoured and grateful for the excellent collaboration with ESA. Septentrio is marking another industry-first on the Galileo programme, and will continue playing a key role in this exciting and ambitious European project. Today, together with our partners, we take a decisive step in the early availability of commercial PRS receivers to foster user acceptance and market success of this Galileo service.”

    “This achievement, together with Europe’s recent commitment to a full Galileo constellation, has been a necessary step in giving European industry confidence to start investing in developing commercial PRS receiver products ready for the launch of Galileo navigation services in a few years time,” Leo Quinn, CEO of QinetiQ, said.