My last column described how the U.S. National Geodetic Survey (NGS) used the detailed analysis of the latest GPS on Bench Marks dataset to:
- generate a prototype hybrid geoid model to evaluate the residuals at stations not used in the hybrid geoid model,
- confirm that the stations recommended for re-observations should be observed again, and
- identify void areas that need additional observations.
Since GEOID12B was created, users have been instrumental in providing OPUS with results on benchmarks in areas where NGS said that additional stations were needed. It showed how NGS used the detailed analysis to prepare material to assist users on strategically occupying stations to help support the GPS on Bench Marks Program and create a hybrid geoid model that accurately represents a current NAVD 88.
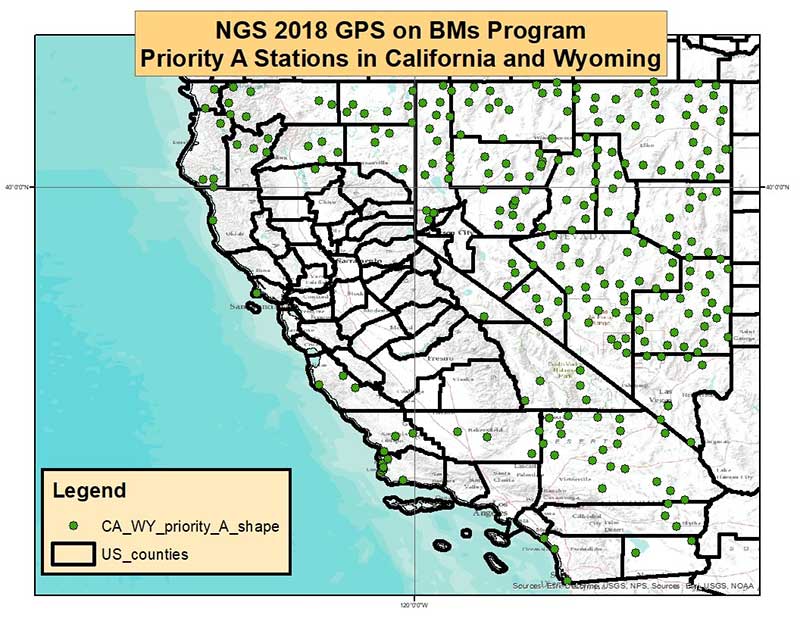
To eliminate confusion of where NGS would like new observations, NGS’ material contains a specific list of stations that it would like occupied with GNSS during the 2018 GPS on BMs program. My previous column provided a summary of the latest details of NGS’ 2018 GPS on BMs campaign, which will be used to create the next hybrid geoid model in 2019.
The analysis described in my column was the first cut at identifying stations that should not be used in a hybrid geoid model, and providing a list of specific stations that could help improve the hybrid geoid model. All new data received by the cut-off date of Aug.31, 2018, will be analyzed by NGS and, if appropriate, the results will be included in the next hybrid geoid model.
This is a great opportunity to provide data that will help to improve the hybrid geoid model in your region.
This column will describe NGS’ GPS on BMs 2018 interactive web map and provide an update and status report on stations observed in support of the 2018 GPS on BMs Program.
First, NGS has a web page dedicated to the 2018 GPS on BMs program. See the box titled “GPS on Bench Marks Web Page.”
GPS on Bench Marks Web Page
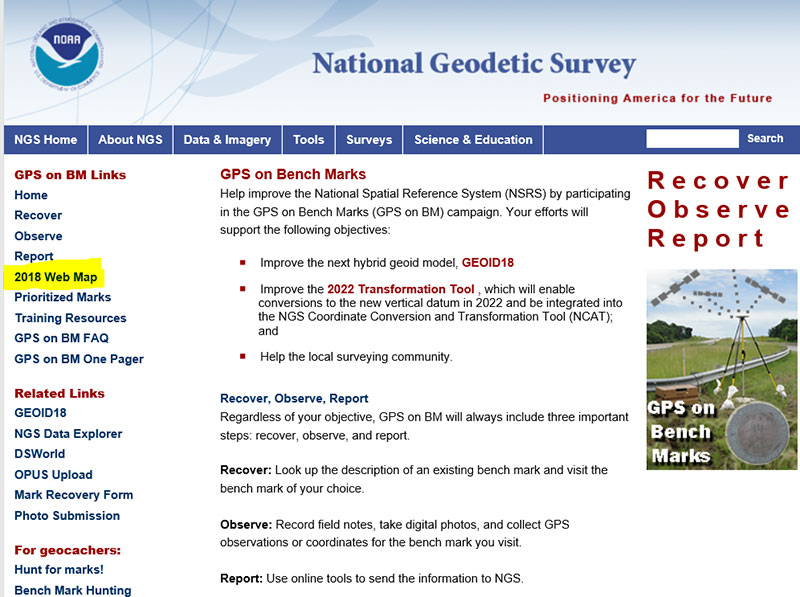
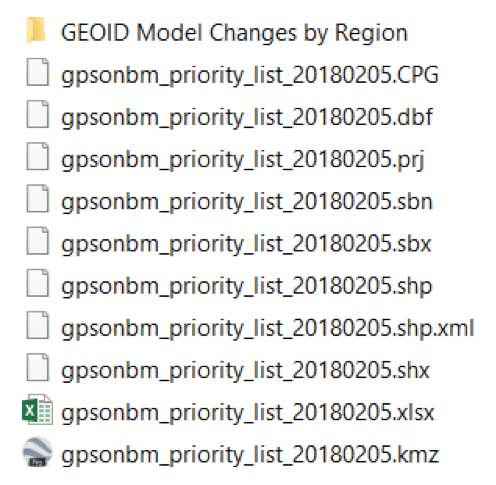
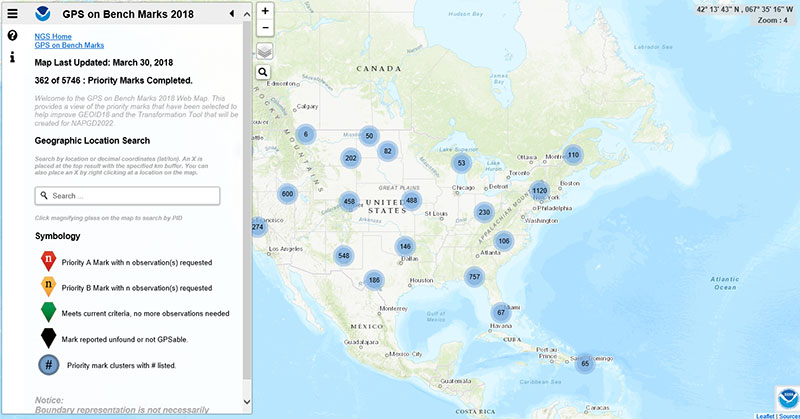
The GPS on BMs 2018 web page contains a link to a web map where users can determine which bench marks NGS would like users to occupy before the Aug.31 deadline. On the left-hand side of the web page there is a link titled “2018 Web Map” (see highlighted section of box titled “GPS on Bench Marks Web Page”). The next few boxes demonstrate how a user can use the web map tool to locate bench marks in their local area of interest. The box titled “2018 Web Map” depicts what the user will see when the link “2018 Web Map” is clicked.
2018 Web Map
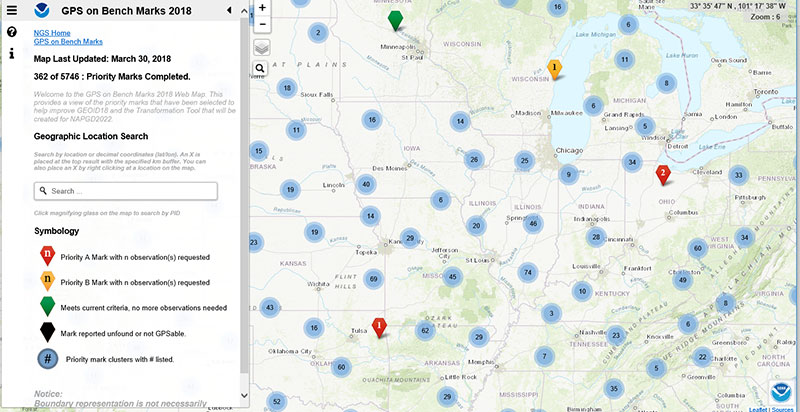
The user can then click on the map and the tool will provide more details. The box titled “Map After Clicking on Priority Mark Cluster #488 in the Great Plains Region“ is a depiction of the map after clicking on a priority mark cluster.
Map After Clicking on Priority Mark Cluster #488 in the Great Plains Region
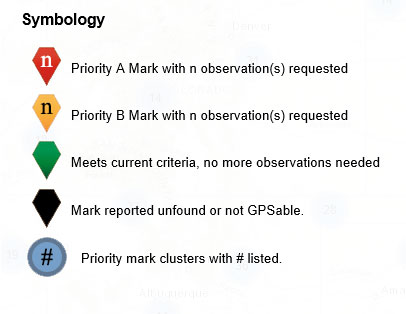
The user can continue to check on the map until the map depicts individual bench marks where the symbology indicates the status of the monuments. The symbology labels are fairly straightforward. The box titled “The Web Map Symbology” provides the five different categories of monuments.
The Web Map Symbology
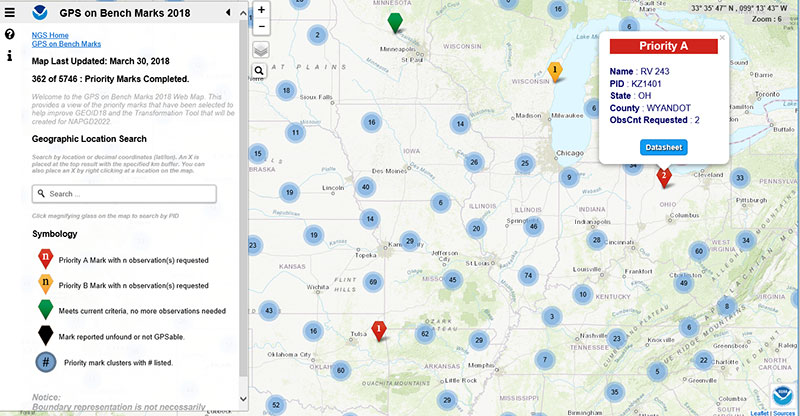
NGS is updating the map weekly to reduce users occupying stations that already have enough redundant observations. Clicking on a station provides the status of the station. The box titled “An Example of a Priority A Station” depicts station (PID KZ1401) that is labeled as a Priority A station and requires two observations.
An Example of a Priority A Station
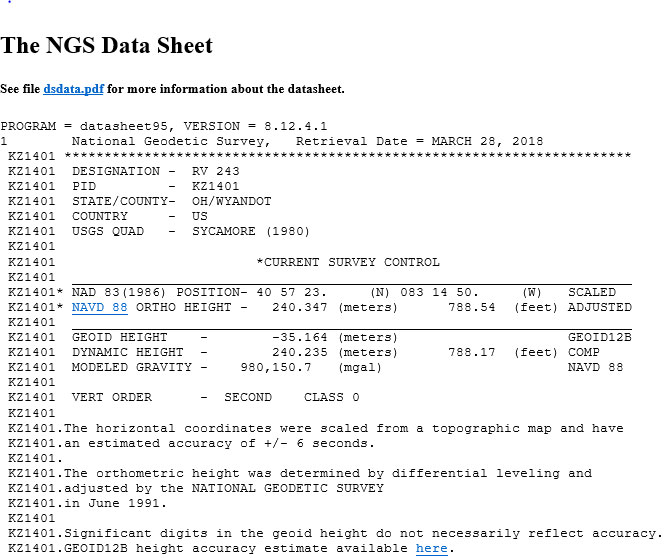
The user can obtain the datasheet for the station by clicking on the Datasheet button in the box (see box titled “Excerpt from the Datasheet for PID KZ1401”).
Excerpt from the Datasheet for PID KZ1401
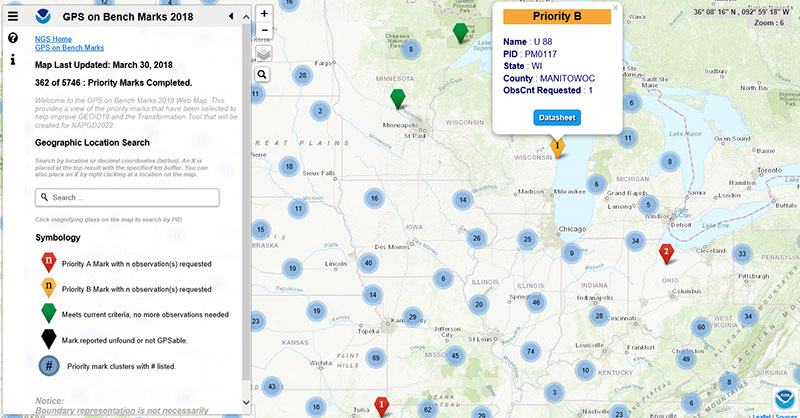
The box titled “An Example of a Priority B Station” depicts a priority B station (PID PM0117) that NGS would like one more observation. Users should remember that priority A stations are more important than priority B stations but B stations are still important for the development and analysis of the hybrid geoid model.
An Example of a Priority B Station
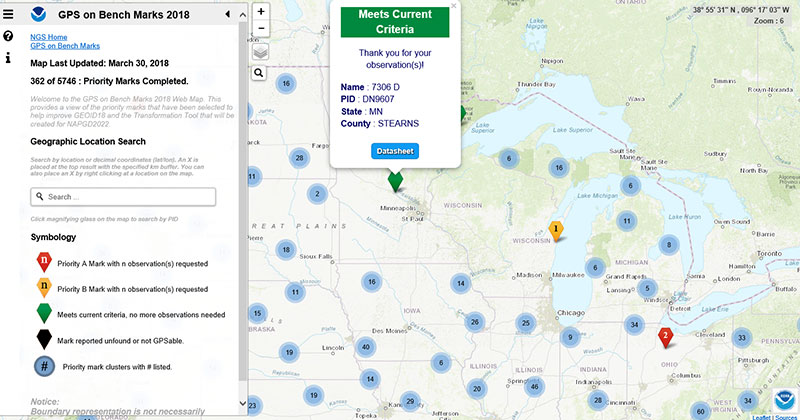
The box titled “An Example of a Station that Meets Current Criteria” provides an example of a station that does not need any more observations. As previously stated, NGS will be updating this web map on a regular basis so users will not waste their time and resources.
An Example of a Station that Meets Current Criteria
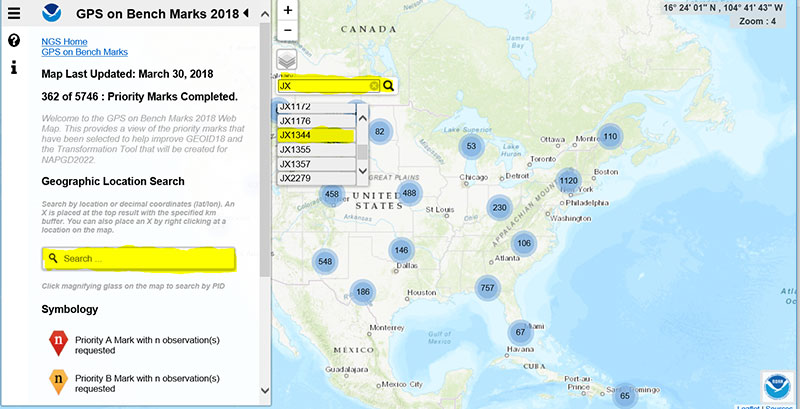
The web map has a search feature, so if the user knew a priority A or B station’s PID, they could locate the station on the map. The box titled “An Example of Using the Web Map Search Feature“ demonstrates the search feature using PID JX1344 (see highlighted section in the box).
An Example of Using the Web Map Search Feature
The box titled “Output from Search Feature for PID JX1344“ is a depiction of the output using the search feature.
Output from Search Feature for PID JX1344
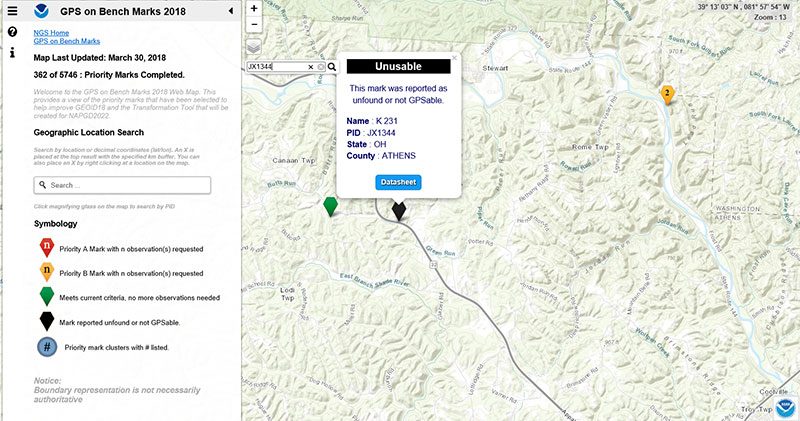
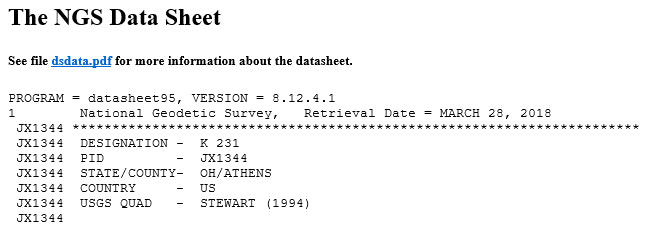
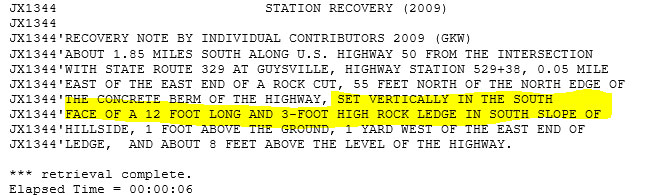
The last category of stations that are shown on the web map are monuments that are reported as unfounded or not GPSable. This is very useful information for NGS and others to have on datasheets. The box titled ” Output from Search Feature for PID JX1344 “ depicts bench mark PID JX1344 that is labeled as unfound or not GPSable. The datasheet for JX1344 indicates that the bench mark is set vertically in a rock ledge (see highlighted section in the box titled “Excerpt from the Datasheet for PID JX1344.”
Excerpt from the Datasheet for PID JX1344
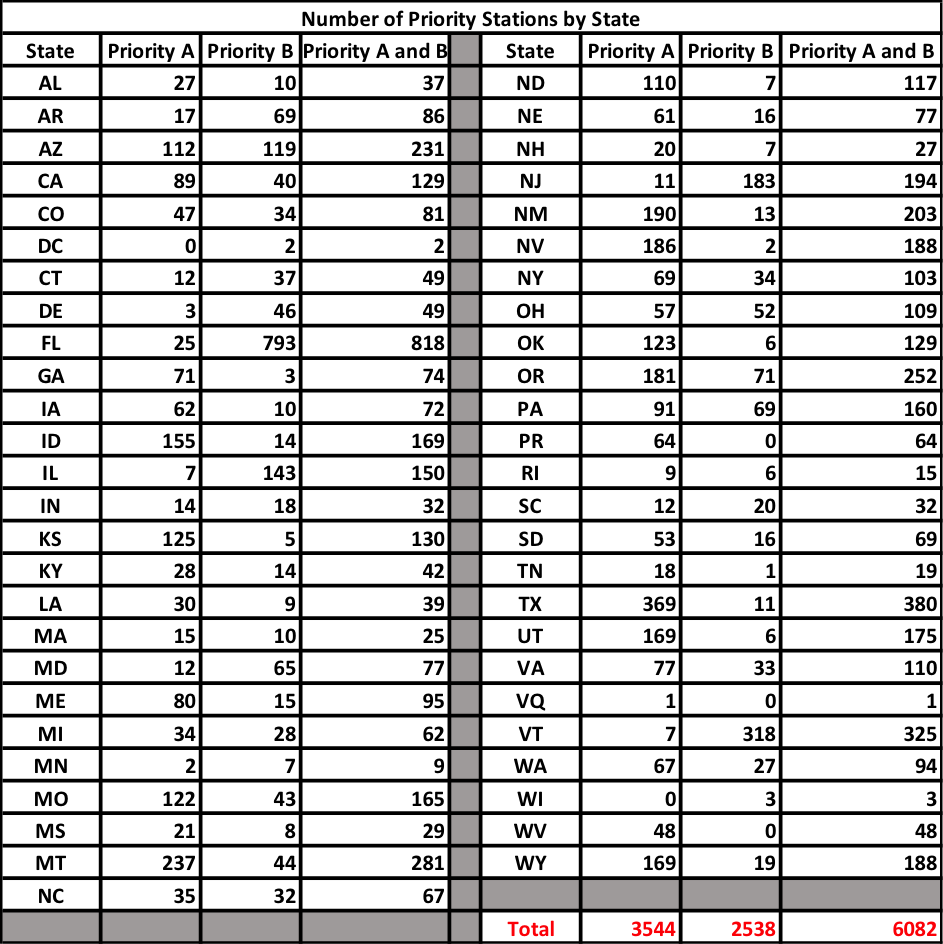
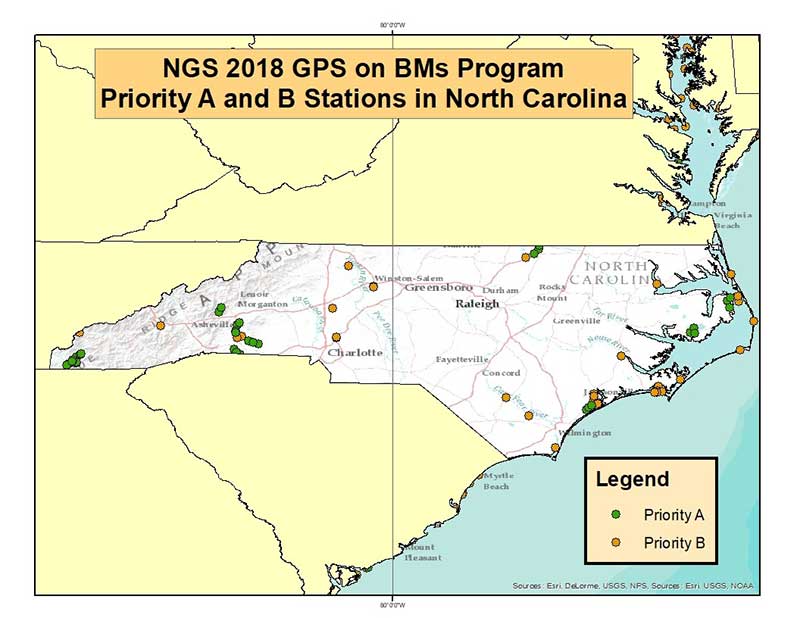
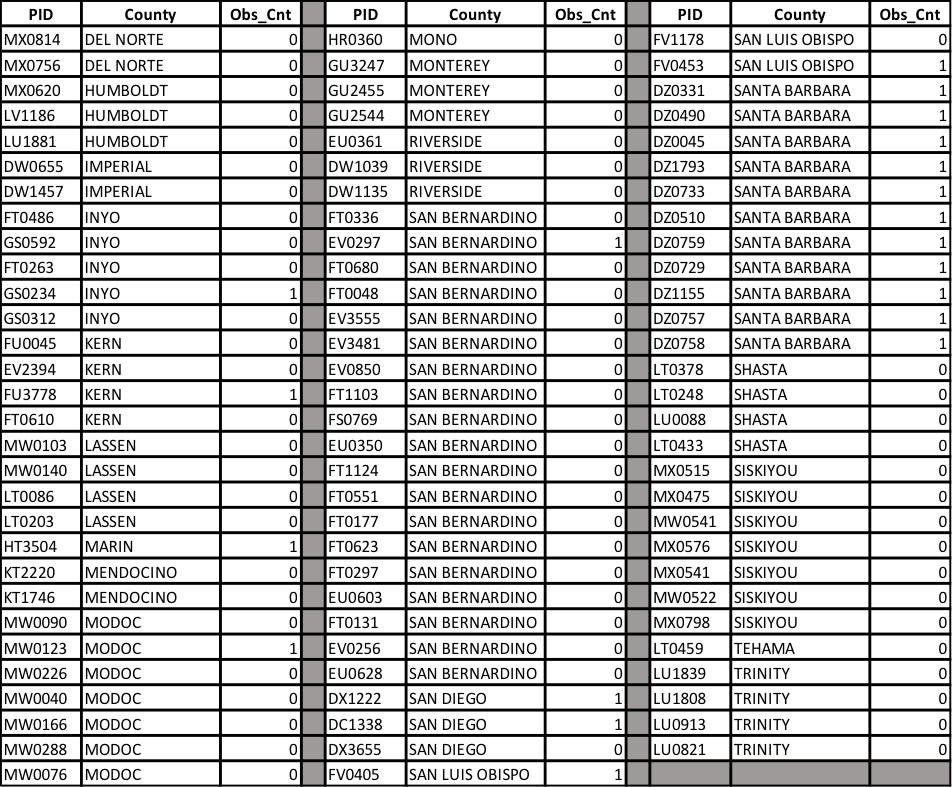
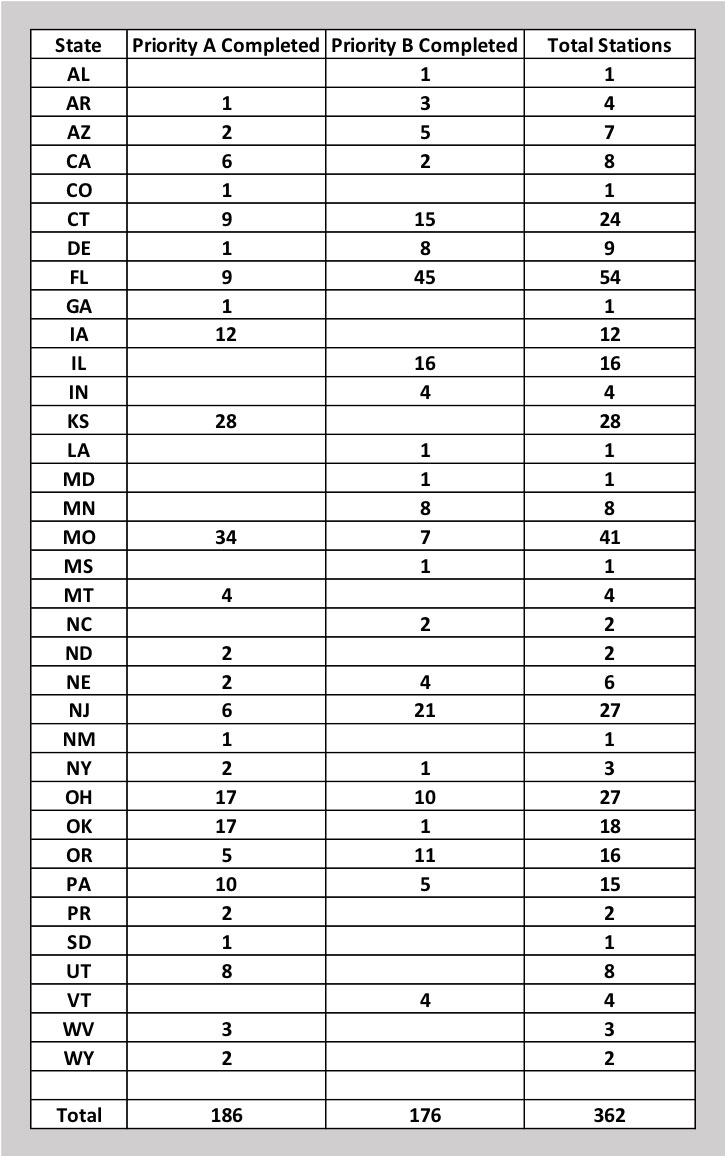
As of March 30, 362 of the 5745 priority marks have been completed. The box titled “Status of NGS 2018 GPS on BMs Program as of March 30, 2018“ is a plot of the stations that are completed, and the box titled “Count of Stations Completed by State “ provides the number of stations completed by state. The red triangles are priority A stations completed and the blue “X” are priority B stations labeled as completed.
It appears that the central portion of the country has been very active. For example, there are 34 priority A stations completed in Missouri and 28 completed in Kansas. The State of Florida has completed 45 priority B and nine priority A stations for a total of 54 stations (see box titled “Count of Stations Completed by State “).
Status of NGS 2018 GPS on BMs Program as of March 30, 2018
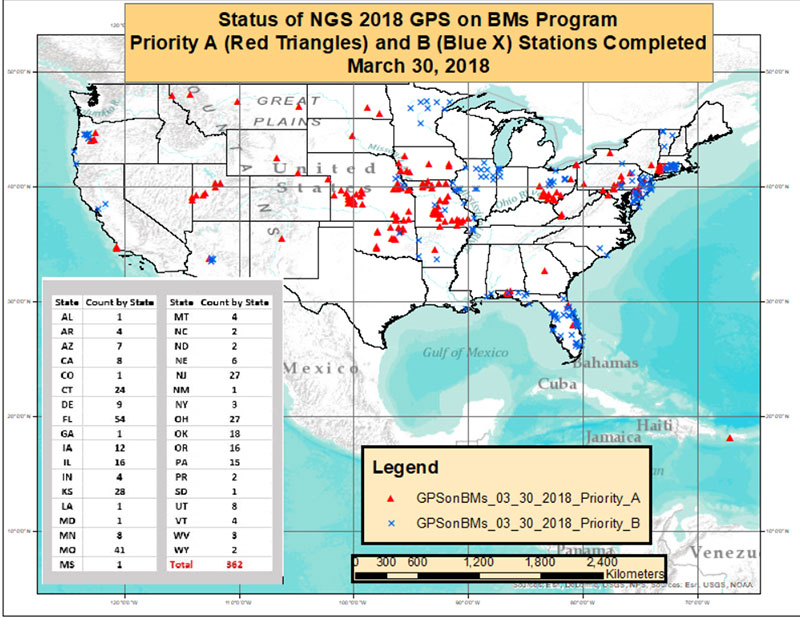
Count of Stations Completed by State
March 30, 2018
The number of stations completed to date represents about 6 percent of the total number of stations that need to be observed. Aug. 31 is only five months away. Hopefully, the number of completed stations will significantly increase during the next several months.
If you have a GNSS receiver, please identify a priority monument nearby and occupy it. As I have explained in previous columns, there are many invalid GPS on BMs stations that may be used in the next hybrid geoid model unless more benchmarks with valid NAVD 88 heights are observed with GNSS.
Please encourage your fellow surveyors and friends to occupy a benchmark to support the next NGS hybrid geoid model. This is your opportunity to help develop a current, valid hybrid geoid model in your area.