Many of us have had to call for emergency services, whether as a bystander, for a loved one, or ourselves.
In that moment, you are focused on being able to communicate with someone who can send emergency personnel to your exact location. As fast as possible. GPS plays a part in all three – communicating with someone, defining your exact location, and reaching you as fast as possible.
Timing signals from GPS satellites are critical to our communications networks, allowing callers to communicate with emergency services. This is because cell phone networks rely on GPS timing receivers to keep all their base stations perfectly synchronized, which allows mobile handsets to share limited radio spectrum more efficiently.
Location is one of the most important pieces of information on which first responders depend to provide timely emergency services. “Every minute counts” encapsulates the benefits accrued from integrating information derived from GPS signals into the emergency services infrastructure. To illustrate the importance of this information, the Federal Communications Commission’s (FCC’s) January 2024 Report and Order on location-based routing for wireless 911 calls estimates this technology will improve call time responses by up to a minute, saving nearly 14,000 lives annually. Outdated systems — still operating in many areas — use cell towers, which can be as far as 10 miles away, as a reference point
for the caller’s location to dispatch emergency services. These systems misroute more than 20 million calls annually, wasting precious minutes in locating those in need. Updating these systems will enable first responders to efficiently locate and navigate to the person in need.
It is critical that federal, state and local governments continue to fund the adoption and operation of innovative, timesaving and accurate solutions to better serve the public. Your loved ones deserve nothing less.
Coming Soon: Next Generation 911
One of the ways in which GPS is being used in emergency response systems is through Next Generation 911 (NG911), a service that makes more precise location information widely available to first responders. Once fully implemented, NG911 will provide dispatchers real-time locations derived from callers’ phones and accept text messages, videos, and photos. Why is this important? NENA: The 9-1-1 Association, estimates 80% or more calls are placed from GNSS-enabled cell phones.
More than 40 states have begun to adopt NG911, according to an April 2024 Congressional Research Service report. Most of these states are still in the early stages of implementation. Many call centers continue to use legacy systems that do not use technology optimized to save lives.
A GPS III satellite model provided by GPSIA member Lockheed Martin was on display at the NG911 Institute’s Technology Showcase this spring, reminding attendees of the important role GPS satellites play today and in future NG911-enabled emergency services.
Accessible Emergency Services Serve Everyone
To bridge this gap between adoption and full implementation of NG911, third-party groups and regulators are jumping in to make vital improvements. Organizations such as accesSOS, a non- profit started by Gabriella Wong, shed light on the need for more accessible emergency services. Wong was inspired to develop the accesSOS app after her deaf father was left unable to call for help in two emergency situations. Today, approximately 50% of 911 call centers in the United States cannot accept text messages. accesSOS allows deaf and hard of hearing individuals to quickly describe their situation through an easily navigable user interface, which is then translated into a phone call made to 911 on behalf of the person in need. accesSOS uses GPS location data collected from phones to bridge the accessibility gap between areas that are using outdated systems and individuals who are left unattended by those systems.
accesSOS’ solution, along with many other ones, were on display at NG911 Institute’s Technology Showcase, including GPSIA member Garmin’s inReach-enabled devices. This service supports more than 210 dialects and languages and is available in more than 200 countries and territories. By supporting a vast array of languages, Garmin’s inReach technology exemplifies another aspect of accessibility where regulators can take additional action — overcoming language barriers.
In the United States, it is estimated that non-English speakers face wait times of 5-10 minutes when trying to connect with emergency services in their native languages. In some emergency situations, those minutes can be the difference between life and death. Industry is leading the way by ensuring personnel at their call centers can communicate in multiple languages with people who need help, regardless of the language they may be speaking.
By continuing to promote GPS- enabled solutions such as accesSOS, NG911, and inReach, we are ensuring the safety of our communities and our loved ones. The GPS Innovation Alliance (GPSIA) is proud to support the further integration of GPS into the emergency services infrastructure by uplifting innovative research and design efforts and promoting new ideas that provide lifesaving services to users across the globe.
When Highly Accurate Location Information is Not Appropriate
While providing a highly accurate location for a caller is essential to certain types of emergency response services, such accuracy is not warranted when calls are made to 988, the Suicide and Crisis Lifeline. Since its nationwide rollout in July 2022, the Lifeline service has routed more than 9.6 million calls, texts and chats to crisis centers.
Preserving the caller’s privacy while quickly routing the call to the nearest crisis center is of the utmost importance. To preserve privacy, the caller’s precise location should not be shared. However, routing a call to a crisis center associated with the caller’s
area code — not disclosing the caller’s location — is not the answer either because the portability of mobile phone area codes has decoupled area codes from caller location. To address these shortcomings while preserving the caller’s privacy, the FCC has adopted a Second Further Notice of Proposed Rulemaking suggesting that wireless carriers route 988 calls to nearby crisis support centers using the location of the nearest cell tower, which can be located within 10 miles of the caller, rather than using a device’s location or the caller’s address.
GPS is still integral to communications between the caller and Lifeline. This case illustrates how diverse GPS-enabled technologies and solutions support a wide range of emergency response services.
If you or a loved one is experiencing a mental health crisis, please dial or text 988 to reach a crisis counselor.
Describing a dangerous “asymmetric vulnerability to navigation warfare” a recent paper from the National Security Space Association (NSSA) calls for a wide variety of actions to mitigate the threat. The most important, “Focused leadership, properly empowered and resourced…”
The nineteen-page paper, in some ways, reads like a primer on GPS and positioning, navigation and timing (PNT), providing background and context for policymakers unfamiliar with the technology and the United States’ broad dependence upon it.
“Long-standing lack of progress on issues important to U.S. national, homeland, and economic security.”
The lack of focused leadership, according to the paper, is evidenced by long-standing failures to follow through on a variety of mandates from senior leadership over the course of the last 20 years. Quoting from the Federal Radio Navigation Plan, it cites persistent shortfalls in national capability as including:
Sufficient accuracy and integrity in electromagnetically impeded environments — including operations during spoofing, jamming, and natural and unintentional interference.
Higher accuracy with high integrity; timely notification/alarming when PNT performance is degraded or misleading, especially for safety-of-life applications or to avoid collateral damage.
Ensuring PNT services, including supporting information technology (IT) infrastructure and supply chain are protected from cyber threats
Ability to accurately locate sources of intentional and unintentional interference in a timely manner.
Insufficient resilience and survivability when GPS services are unavailable or untrusted.
“American society has been transformed by the availability of GPS.”
The paper describes four decades of GPS being incorporated into virtually every technology and used by every critical infrastructure. It calls the harm to society should it be lost “incalculable.” It also notes that the operation of many space systems that support critical infrastructure and/or critical national applications is itself dependent upon GPS for proper operation.
The military utility and advantages brought by GPS are also discussed. These include:
Its role as the lynchpin for precision strike.
Enabling “… the maneuver, synchronization, and massing of effects from dispersed forces.”
PNT to achieve information and decision superiority over an adversary.
“Merely the threat of disrupting GPS services might be enough to impact U.S. national security and foreign policy.”
The paper says recent actions by and ongoing threats from adversaries of the United States are a critical concern.
Electronic warfare (EW) and cyber attacks by Russia, China, Iran, and North Korea demonstrate the ease and effectiveness of such vectors, as well as the seriousness of the threat.
As one example, Russia’s impending launch of a nuclear-armed anti-satellite weapon has the potential to both destroy or damage GPS satellites nearby and interfere with radio communications. NSSA recently published a paper on the Russian nuclear ASAT threat.
A potentially even more serious threat would be if Russia should deploy a nuclear-powered directed energy or electronic warfare weapon. Such a device would be “reusable” and could threaten an even larger number of space platforms or, in the case of an EW device, both space-based and terrestrial receivers.
“GPS blackmail”
The paper posits that the United States’ overdependence on GPS is so great that it could be subject to “GPS blackmail.” It suggests that this may already have occurred.
Prior to Russia’s invasion of Ukraine, it destroyed a defunct satellite with a ground-based missile, creating thousands of pieces of debris. Shortly thereafter, state-sponsored TV announced that Russia would destroy all 32 GPS satellites if NATO “crossed its red line.” Despite 90,000 Russian troops massing along the border, “U.S. officials decided against sending certain military equipment to Ukraine to avoid provoking Russia.”
“…could have cascading effects which unravel America’s socioeconomic fabric…”
NSSA warns that U.S. “critical infrastructures, national essential functions, and military forces could be at grave risk.” Among the impacts of a major GPS disruption, it counts:
Loss of U.S. political prestige and influence.
Degradation of the informational element of national power (IT and telecommunications).
Severe socioeconomic implications. “given the integration of GPS into critical infrastructures and their interdependencies, lengthy disruption just of the power grid, for example, could have cascading effects which [would] unravel America’s socioeconomic fabric…”
Harm to national and homeland defense. Leadership is needed to perform national essential functions.
While the paper makes several specific recommendations for actions by various departments, it also identifies national-level leadership as key:
“The United States must rapidly develop and implement a comprehensive, whole of nation, strategy to redress its asymmetric vulnerability to Navwar and restore U.S. leadership in space-based and terrestrial PNT. … Focused leadership, properly empowered and resourced, is essential to the national PNT strategy’s success.”
The NSSA paper “America’s Asymmetric Vulnerability to Navigation Warfare: Leadership and Strategic Direction Needed to Mitigate Significant Threats” was sponsored by the Resilient Navigation and Timing Foundation and can be accessed here.
In October 2023, the United Kingdom’s government announced a 10-point “policy framework” to greatly increase the nation’s resilience to disruption of vital positioning, navigation and timing (PNT) services.
Two months later, Vladimir Putin began regularly jamming and spoofing GPS for aircraft and ships across a broad swath of the Baltic and northern Europe. It was the world’s first instance of such extensive activity in the absence of armed combat.
Properly executed, Britain’s policy framework will position it as a global leader in sovereign and resilient PNT. It will also provide ample new business opportunities for British businesses to fill this growing need.
The product of years of effort under both Coalition and Conservative governments, the PNT policy framework addresses challenges that have been extensively documented and studied.
The nation’s over-reliance on space- based PNT has long been recognized. Its National Risk Register listed solar activity as a threat to PNT in 2012. When, despite extensive lobbying by the UK, the rest of Europe shut down its Loran transmitters in 2015 to prevent competition with Galileo, Britain kept its single transmitter on air as a national precise time reference. In 2018 a “Blackett Report” documented the nation’s over-dependence, estimated the consequences of service outages and made a series of recommendations. A 2021 economic report further estimated the scale of the problem.
All this well before Russia’s demonstrations of the fragility of GNSS with its attacks on Ukraine and recent aggression in the Baltic.
Yet action on Britain’s way forward was repeatedly deferred.
The sticking point seems to have been deciding upon the mechanics of how the government would deal with the invisible PNT utility, which is a capability essential to every government department and every sector of the economy and society. Should it be in the Department for Transport? Perhaps in Business and Trade or Defence? Some suggested the Cabinet Office should lead addressing the PNT challenge.
The final decision was a cross- government office hosted by the Department for Science, Innovation and Technology. The office includes members from the Ministry of Defence and is tasked with leading and coordinating a whole-of-government approach.
Moving Forward
It is easy to be skeptical about the success of this new enterprise. Regardless of the nation, government policy frameworks, strategies and the like often can be a way for politicians and bureaucrats to create the impression of action without having to ever really do anything. Documents are often published and then go on a shelf, never to be seen again.
That does not seem to be the case here, though.
The very first action item in the PNT policy framework is to “[e]stablish a National PNT Office …to improve resilience and drive growth with responsibility for PNT policy, coordination, and delivery.”
While several of the 10 items begin with “develop a proposal for…,” the projects are both considered and specific, such as a timing system “of last resort” for the Ministry of Defence and the expansion of eLoran.
Britain’s integrated governance and system-of-systems approach to PNT can make the nation virtually immune to the kinds of disruptions and infrastructure challenges being seen in the Baltic and conflict zones around the world.
Achieving that goal will involve the development of new user equipment, systems to prioritize and integrate different PNT sources, new interfaces for various infrastructures, improvements to existing technologies (e.g., an encrypted component for eLoran to make it even more secure and reliable), and new policies for responsible PNT use in critical applications.
When complete, the UK will have the sovereign and resilient PNT it needs to support national, homeland and economic security.
Global Leadership and Profit
Yet Great Britain is not the only nation over-dependent on fragile PNT signals from space provided by others. Most of the world is in the same situation.
By actively promoting and sharing its developing expertise and tech stack, the UK will become a global thought leader and technology provider for sovereign and resilient PNT. A capability that will be in greater and greater demand as malicious actors, both large and small, continue to exploit the weaknesses of satellite-based navigation and timing.
Yet, to realize these benefits, the UK must act swiftly and seize the moment.
At present there is a leadership vacuum in this field. While China has its own extremely robust and integrated PNT system based on a combination of clocks, fiber, terrestrial broadcast eLoran, and space, it does not seem eager to export that to others. China may prefer to woo nations into dependence on its BeiDou satellite PNT system, rather than enabling others’ sovereignty.
Additionally, while entrepreneurial South Korea has implemented its own space-based, eLoran and fiber PNT, it is unclear how integrated the various sources are. We have also seen no evidence that they have plans to share, or sell, their success to others.
As disruptions to GPS and other GNSS continue to increase around the globe, so, too, do calls for and moves toward solutions that include alternatives.
Last year the European Union issued a tender for an integrated GNSS/eLoran receiver. Türkiye has implemented its own local terrestrial PNT systems in several port and urban areas. India envisions expanding its regional navigation satellite system to cover the globe.
Britain has the plans, capability, and resources to become the world leader in this essential and growing technology sector — and the government is working with the Royal Institute of Navigation and other learned bodies to make it a reality.
Yet its window of opportunity may already be closing.
Rather than regarding its PNT policy framework as a routine item of work, we hope the UK government seizes this opportunity for international leadership and reaps all the inherent diplomatic, security and economic benefits.
In my last newsletter, I highlighted the release of a beta version of a new NOAA CORS Network (NCN) Station Web Page. As demonstrated in my newsletter, each CORS in the NCN has its own page with data, metadata, maps and photos for that station displayed in a modular layout so information is easily found all in one location. This past month, I had the privilege of participating in a meeting with representatives from the American Association for Geodetic Surveying (AAGS), the National Society of Professional Surveyors (NSPS) and the National Geodetic Survey (NGS). As a Past President of AAGS and the current Chair of the AAGS Membership Committee, I participate in these quarterly meetings.
AAGS aims to lead the community of geodetic, surveying, and land information data users through the 21st century. AAGS members develop new educational programs, including presentations, seminars, and workshops on topics related to geodetic surveying; and articles and papers that inform the membership of the latest scientific and technological developments and how to implement them in the most cost-effective and efficient manner.
In my previous newsletters, I have reminded everyone that time is running out to obtain a working knowledge of the new, modernized National Spatial Reference System (NSRS). The release of the new, modernized NSRS is only about a year away. As of July 2024, NGS plans to have a beta version of the new, modernized NSRS available around the summer of 2025 for users to test and evaluate new products and services. After enough testing has been performed, the new, modernized NSRS will be officially published – probably in early to mid-2026.
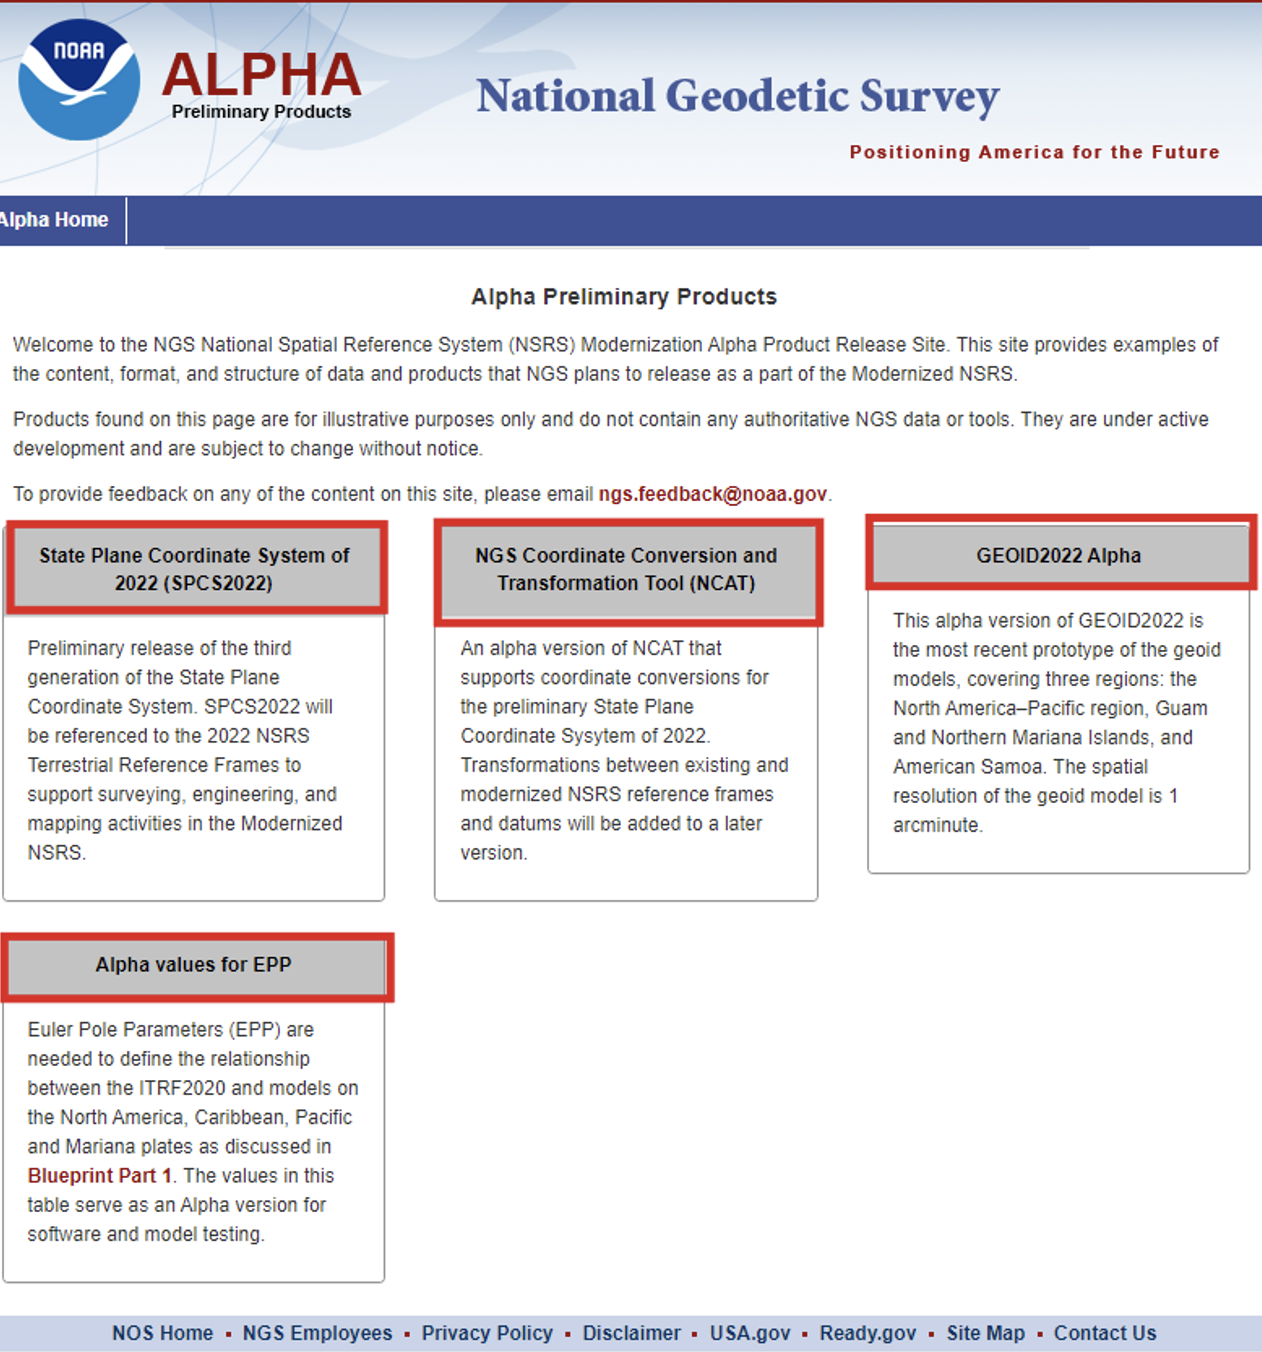
At the meeting, NGS highlighted some new products on its Alpha Preliminary Products site. The alpha site provides products that are useful for individuals who want to obtain a better understanding of the products that will be distributed as part of the new, modernized NSRS.
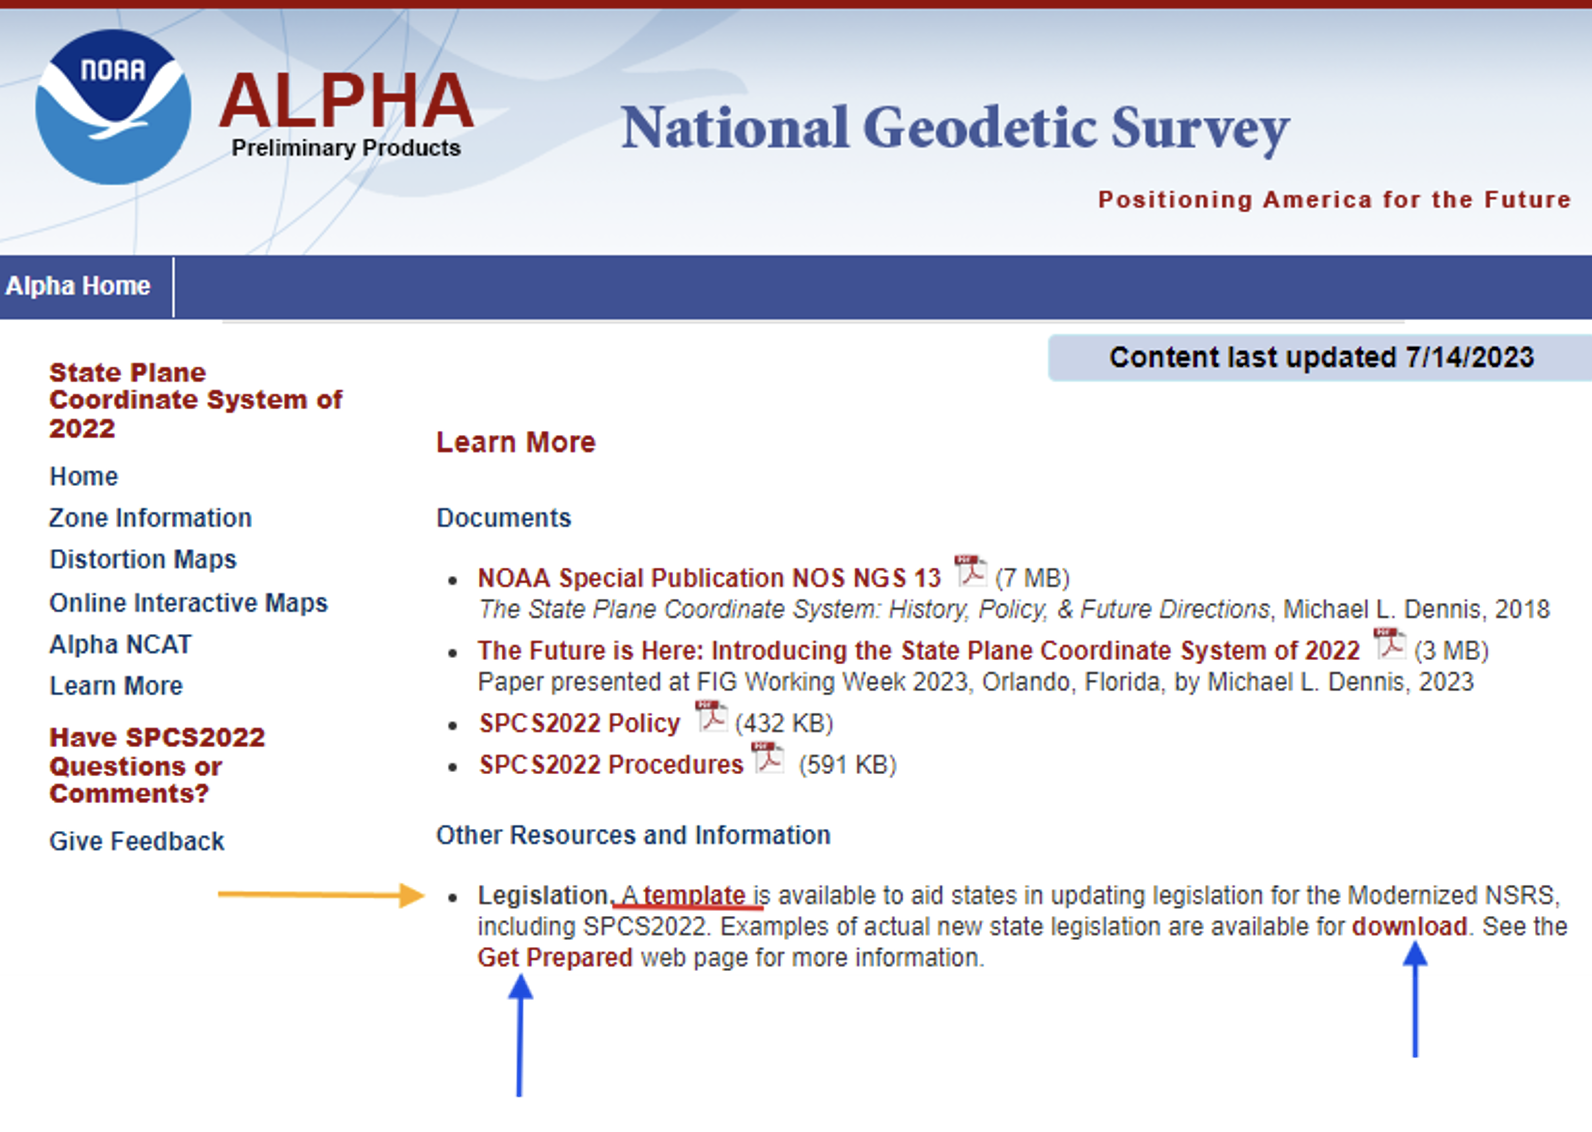
First, I want to bring attention to the importance of ensuring that the state’s legislation is modified or rewritten, if required, to include that the current horizontal and vertical datums are being replaced with the new, modernized NSRS. The “Learn More” button on the SPCS2022 Alpha site provides information about legislation.
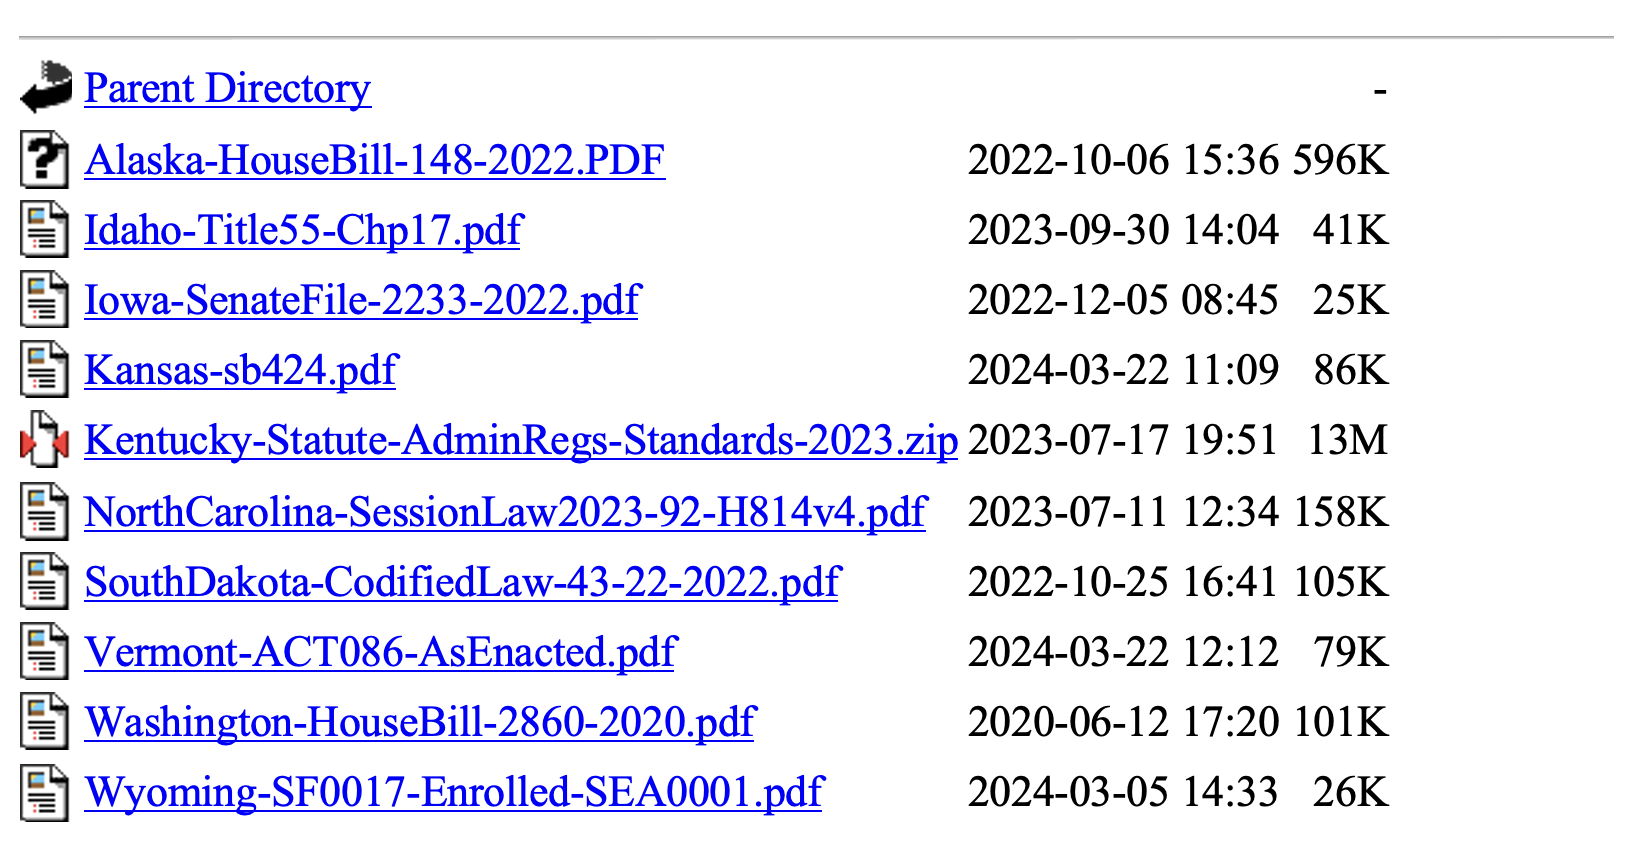
Per personal communication with Michael Dennis, Ph.D., NGS SPCS2022 Manager, as of June 26, 2024, the following 12 states have have enacted into law NSRS modernization: Alaska, Idaho, Iowa, Kansas, Kentucky, Louisiana, Nebraska, North Carolina, South Dakota, Vermont, Washington, and Wyoming.
Users can download examples of actual new state legislation here.
Examples of legislation.
During the joint AAGS/NSPS/NGS meeting, Tim Birch, the executive director of NSPS, said that anyone who has questions about updating legislation for the new, modernized NSRS, including SPCS2022, can contact him directly.NSPS has experience working with agencies and individuals to develop legislation as indicated in the following statement on the NSPS website.
“We are the voice of the professional surveying community in the US and its territories. Through its affiliation agreements with the respective state surveying societies, NSPS has a strong constituency base through which it communicates directly with lawmakers, agencies, & regulators at both the national and state level. NSPS monitors and comments on legislation, regulation, & policies that have potential impact on the activities of its members and their clients, and collaborates with a multitude of other organizations within the geospatial community on issues of mutual interest.”
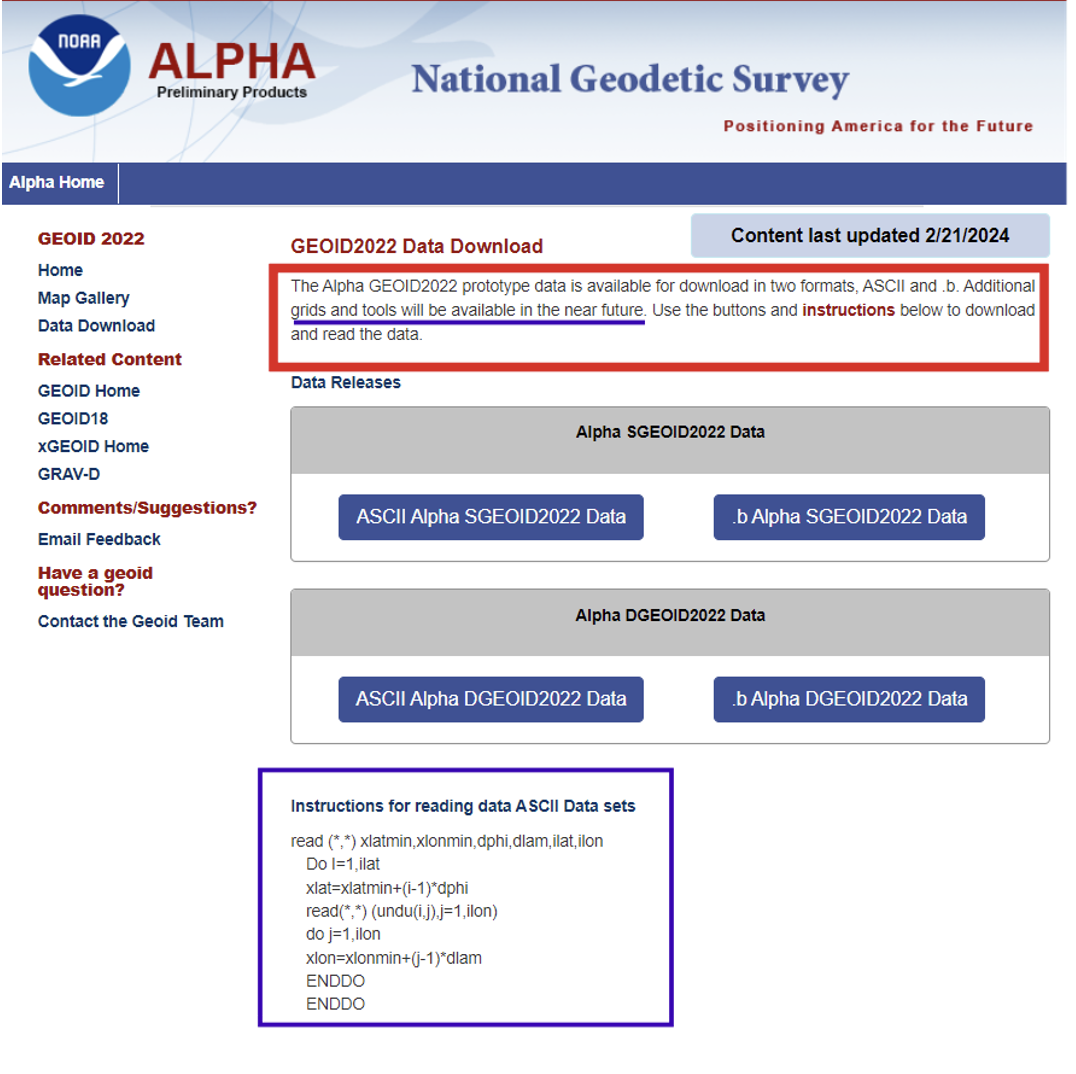
As previously stated, the two latest alpha products are the “GEOID2022 Alpha” and “Alpha Values for EPP.” My December 2017 newsletter discussed GEOID 2022 and the North American-Pacific Geopotential Datum of 2022 (NAPGD2022), and my February 2022 newsletter discussed the Euler Pole Parameters process and use in the new, modernized NSRS.
The GEOID2022 Alpha page provides a version of GEOID2022, which is the most recent prototype of the geoid models. The reference ellipsoid is Geodetic Reference System 1980 (GRS 80, but the geometric reference frame is ITRF2020). The Alpha GEOID2022 prototype data is available for download in two formats, “ASCII” and “.b.” There is a static component (SGEOID2022) and a dynamic component (DGEOID2022). These grids will be useful to programmers who want to develop and test their systems. Additional grids and tools will be available in the future.
Technical Details of the Alpha prototype of GEOID2022
GEOID2022 alpha is the last prototype of GEOID2022. It covers three regions: the North America–Pacific region, Guam and Northern Mariana Islands, and American Samoa. The spatial resolution of the geoid model is 1 arcminute. The geoid heights, which are in the tide-free system, are with respect to the reference ellipsoid of the Geodetic Reference System 1980 (GRS80) in the ITRF2020 geometric reference frame. GEOID2022 alpha includes static and dynamic components for the geoid heights. For detailed fundamental parameters of the geoid model, refer to NOAA Technical Report 78.
GEOID2022 Alpha
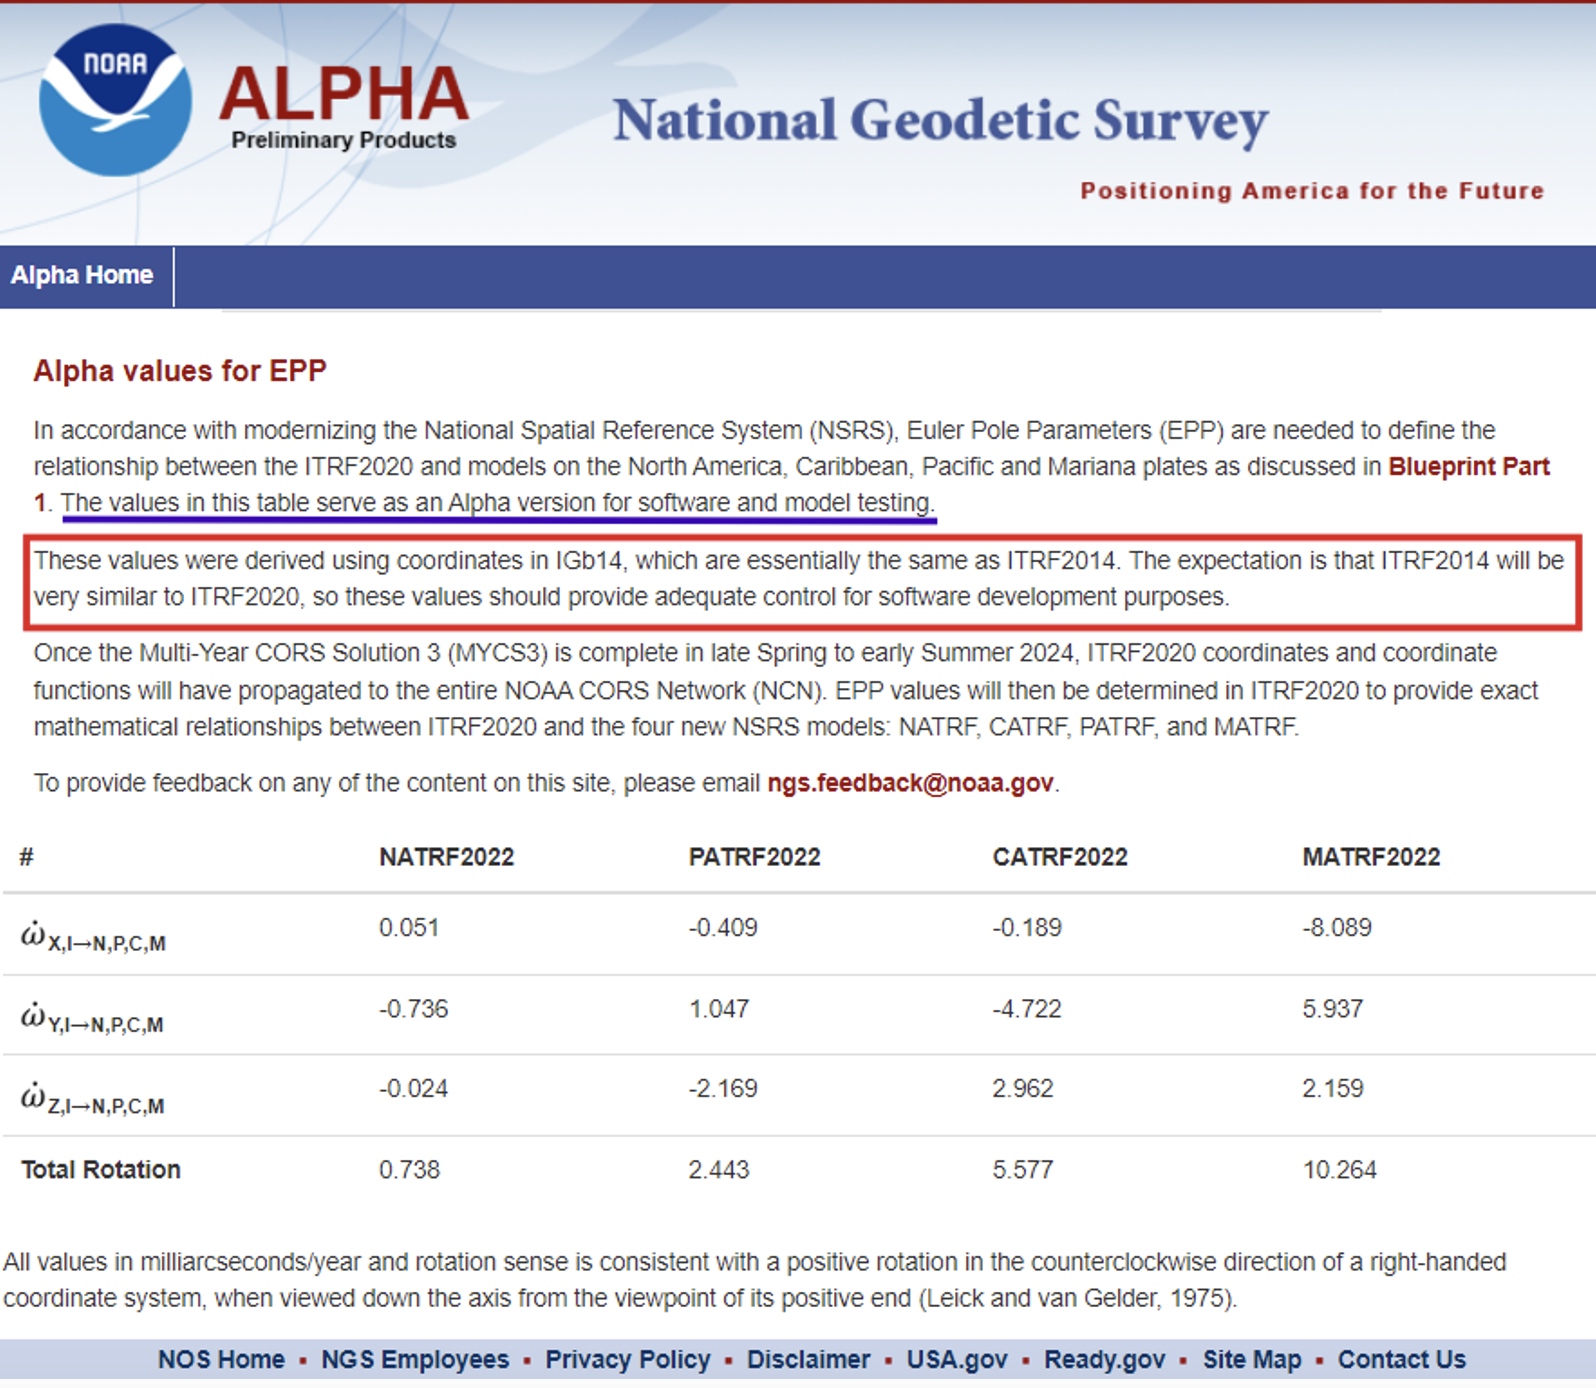
The Alpha EPP site provides the Euler Pole Parameters (EPP) that are needed to define the relationship between the ITRF2020 and models on the North America, Caribbean, Pacific and Mariana plates as discussed in NGS’s Blueprint Part 1 document.
Alpha Values for EPP
As stated in Blueprint Part 1, NGS will define the official relationship between ITRF2020 and the four NSRS TRFs through equation 59, using the rotation matrix in equation 58 resulting in equation 60.
I programmed this using a simple Excel spreadsheet to compute some of the potential changes between epochs for North Carolina. They were very similar to the ones that I depicted in my February 2022 newsletter that discussed the Euler Pole Parameters process and provided plots depicting the movement.
I would like to highlight the latest information available on the State Plane Coordinate System of 2022 alpha site. As previously stated, in about a year, the new, modernized NSRS will be available as a beta product. Users must get prepared by accessing NGS’s alpha products as well as taking the opportunity to provide feedback to NGS to improve their products and services. The Online Interactive Maps page provides information about the zones for every U.S. state and territory.
Clicking on the Online Interactive Maps link opens a NOAA ArcGIS online website that provides information about the Alpha State Plane Coordinate System 2022 preliminary zone designs. I have highlighted a few items that may be of interest to users.
The site provides a description of the site, links to various types of zones, links to data sources and information about distortion.
SPCS2022 online interactive maps.
Clicking on the link for zone definitions provides a list of zones and their parameters. This same information is also provided when users click on a zone on the map. I will demonstrate this later in this newsletter.
Per personal communication with Dennis, as of June 26, 2024, seven states have some or all their SPCS2022 zone definitions formally finalized, consisting of 205 out of the 965 zones (the total number of zones is still preliminary):
Alaska (partial coverage multizone layer)
Arizona (both multizone layers)
Idaho (both multizone and statewide)
Kentucky (both multizone and statewide)
North Carolina (statewide zone; it has no other zones)
South Dakota (both multizone and statewide)
Wisconsin (multizone)
Dennis informed me that the information on the alpha SPCS2022 Experience has been updated. He told me that the total number of zones decreased from 967 to 965, but based on coordination with the International Association of Oil & Gas Producers (IOGP) Geodesy Subcommittee the number may eventually increase to 972 (more about that in a future newsletter).
He stated that his goal is to finalize the zone definitions by the end of this calendar year or early 2025. Users should keep checking the alpha site.
Dennis mentioned that the website now offers a new feature that provides the distortion value when users click on the map. A nice thing about that is the site can be used on a smartphone, allowing users to obtain real-time distortion information from their location.
Clicking on the link titled “View” in the upper right corner of the box brings up a map that depicts the SPCS2022 zones.
View of ALPHA (preliminary) SPCS2022 zone designs.
When you click on the note about the ALPHA being preliminary, the map underneath appears where the user can select the type of maps they wish to review.
The following options are available: All Zone Layers, Statewide Zone Layers, Multizone Complete Layers, Multizone Partial Layers, and Special Use Zone Layers.
Users can use their mouses or the “+” button on the left-hand side” to zoom to a particular region, or use the search button on the right-hand side to select a State or zone.
Using the search box.
Information about a particular zone pops up by clicking on a point on the map.
Detailed information provided for a zone.
Each zone provides links to other features based on the location of the point selected on the map.
The image below provides the distortion in ppm for the point selected on the map.
The Alpha NCAT site can be used to obtain an estimate of the changes between SPCS83 and SPCS2022. It should be noted that all values will be in meters (m) and international feet (ft).
International feet may be new to some surveyors who were previously using the U.S. survey feet in SPCS83. The U.S. survey foot will not be used with the NSRS, including SPCS2022 coordinates. NGS and the National Institute of Standards and Technology (NIST) have taken action to deprecate the U.S. survey foot. What does that mean?. NIST has the following statement on its website: “Beginning on January 1, 2023, the U.S. survey foot should be avoided, except for historic and legacy applications, and has been superseded by the international foot.” This means that NGS will not be publishing SPCS2022 in U.S. survey feet but all historic products and services such as SPCS83 will still be provided in U.S. survey feet (sft) and international feet (ift).
More information and resources about the deprecation of the sft are listed below (personal communication from Dennis):
The official announcement is the final determinationFederal Register Notice (FRN) on deprecation of the sft issued on 10/5/2020. It was jointly issued by the National Institute of Standards and Technology (NIST) and NGS. I encourage everyone concerned about this topic to read it closely and in its entirety; it can likely answer most questions. The FRN includes information on the continued use of sft for legacy applications (such as SPCS 83). That is stated in the last paragraph of the “Notice of Final Determination” section; in items #1 and #2 in the “Counterpoints to Feedback Expressing Opposition”section; and in the second paragraph of the “Implementation Summary and Actions” section.
The legacy issue is also addressed in the 10th FAQon the NIST website and in the 11th FAQon our “new datums” FAQs web page.
The 40 states that officially adopted the sft for SPCS 83 are listed in Table C.1 of Appendix C of NOAA Special Publication NOS NGS 13, “The State Plane Coordinate System History, Policy, and Future Directions.”
Although the final determination FRN is itself not a law, Congress has passed several laws giving NIST the authority to maintain national standards of measurement. These and other related federal laws are given in the initial sft FRNissued on 10/17/2019.
An NGS webinar given on 11/10/2022 addresses the deprecation of the sft in the context of state plane. Two previous NGS webinars also provide additional background and historical information on the sft, one given on 4/25/2019 and the other on 12/12/2019.
Input to Alpha NCAT.Photo:Output from Alpha NCAT.
This newsletter highlighted the products on NGS’s Alpha Preliminary Products site. The alpha site provides products that can be useful for individuals to obtain a better understanding of the products that will be distributed as part of the new, modernized National Spatial Reference System (NSRS). NGS is providing these products on an alpha site so that they can get feedback from users. I would encourage all users to access the alpha sites and provide comments to NGS so that their products and services better meet the needs of the surveying and mapping community.
Welcome to the NGS National Spatial Reference System (NSRS) Modernization Alpha Product Release Site. This site provides examples of the content, format, and structure of data and products that NGS plans to release as a part of the Modernized NSRS.
Products found on this page are for illustrative purposes only and do not contain any authoritative NGS data or tools. They are under active development and are subject to change without notice.
To provide feedback on any of the content on this site, please email [email protected].
In a recently released paper, the respected analytics firm London Economics determined that the presence of backup systems at the Denver and Dallas Fort Worth airports prevented any noticeable impacts on air travel despite each having experienced a disruption of GPS signals for 24 hours or more. By contrast, recent GPS interference at an airport without a backup system caused scheduled air service to be canceled until an alternative to GPS was established.
Also important to the lack of impact at Denver and Dallas was that the signals interfering with GPS, with a few minor exceptions, only impacted aircraft in the air.
GPS is essential for the safe and efficient movement of aircraft and support vehicles on the ground at airports, as well as the transport of crews, passengers, supplies, and cargo to and from airports, communication systems, and numerous other services.
Backups needed for both air and ground
Previous work by London Economics has shown that disruption of GPS for these ground functions would likely cause numerous flight delays and cancellations. Delays in the arrival of flight crews, passengers and supplies, for example, would quickly upset flight schedules. If this happened at a major airport, such as Denver or Dallas Fort Worth, disruptions could ripple through the entire air transport system. Wide-spread delays, cancellations and schedule adjustments would bog down air travel across the nation, if not the world.
The incident in Denver was caused by an accidental transmission from a government installation on Jan. 21. 2022. It impacted aircraft within approximately 50 nautical miles of the airport and lasted 33 hours before the source was identified and turned off.
The Dallas incident began on Oct. 17, 2022, and affected aircraft within about 110 nautical miles. It continued for 24 hours before ending on its own. The source has never been identified.
Reducing aviation backups may be a bad idea
In addition to recognizing the value of terrestrial navigation systems for aviation, the London Economics paper cautions about moves in the United States and Europe to “rationalize” these systems by reducing their number. In the event of longer or widespread GPS disruptions, the impact of an insufficient number of terrestrial systems could be significant. The cancellation of air service to an airport in Estonia because of chronic GPS jamming is used in the paper as a cautionary tale.
Instead of reducing the number of old backup systems, London Economics suggests policymakers consider establishing more widely available sources of terrestrial PNT. Taking a fresh look might identify alternative PNT sources for aviation that could also be used by other critical infrastructures. Perhaps even in consumer applications as well.
U.S. government representatives were approached for consultation and comment for this paper and expressed their willingness to participate. Unfortunately, they were unable to obtain permission to do so.
London Economics’ work on this effort was commissioned by the Resilient Navigation and Timing Foundation.
The paper “Aviation GPS Incidents Show Importance of Backup Systems. Policy Makers Take Note.” can be accessed from the foundation’s online library here.
Point cloud and 360-degree image collected with the Leica Pegasus: Two Ultimate. (Photo: Leica Geosystems )
The latest mobile mapping innovations are transforming how we manage, design and monitor our critical infrastructure — in particular, reshaping road maintenance. Through the advance of mobile mapping and reality capture imagery, our ability to map, proactively survey and even design roads, from simulating the vibration of a vehicle on a road to mapping out city routes, is drastically improving through the symbiosis of the digital and physical worlds.
Leveraging data: Traditional vs autonomous mapping
Traditional methods for assessing damage to road surfaces are highly manual, field-based, labor-intensive and time-consuming. Visual inspection, for example, comes with resourcing challenges, data exhaustivity and inaccurate assessments, making quality assessment and control a challenge. There is limited accurate analysis of how the road changes over time, and the work involves significant safety issues, with surveyors required to work in the field near live traffic and often requiring the traffic to be interrupted to allow measurements to be taken.
By contrast, automated laser scanning solutions provide spatial geometry for precise measurements that imagery-only methods cannot capture when assessing damage to road surfaces. They overcome any inaccuracies or lack of detail regarding location and circumstances. This technology also allows professionals to study the surrounding context of the road and measure the depth of a hole or the size of a crack with spatial data, which visual methods cannot capture. Hexagon’s mobile mapping systems, used for virtual road management and maintenance, enable access to a completely virtual environment to unlock the insights this data provides, transforming how we manage our infrastructures. With spatial data collected over time, asset degradation and other factors foundational to maintaining road infrastructure can be predicted by the more effective leveraging of data.
With geospatial data allowing the accurate mapping of potholes, rutting and depressions alongside accurate location mapping using GIS, asset managers can map the data onto real-world imagery to create an interactive, 3D model integrating the physical world and geospatial data. Combined, this unlocks insights and overhauls efficiency for asset managers performing road maintenance, allowing them to prioritize and make decisions based on data live in the field.
Veris deploys Hexagon’s solutions for road mapping
Recently, Hexagon’s technology was used by Veris, a provider of spatial data services to deliver end-to-end solutions for road management and maintenance in Australia. It combined a Leica Geosystems mobile mapping system, the Leica Pegasus:Two Ultimate, with Hexagon M.App Enterprise to create a high-quality, configurable solution and designed its own bespoke software platform RoadSiDe.
Veris used the mobile mapping system on the Hume and Melba Highways to identify and assess road defects and ground penetrating radar (GPR) to rapidly perform data capture of the road corridor. Then, RoadSiDe analytics and machine learning enabled the delivery of the data and insights using M.App Enterprise and Luciad Fusion, integrating 3D visualizations and 2D dashboards to identify, assess and quantify the road condition as part of the only full 3D road condition and corridor platform. The in-house solution for scripts and automation Veris developed made it simple for their clients to visualize and interact with the data, providing analytics and value-added services on demand that offered valuable insights for its clients.
As part of the surface defects workflow they use for analysis, Veris takes the raw point cloud data and compares it with the ideal road exterior to create a surface difference model, followed by contours and improved defect definition. This cross-comparison and integration allows them to use and visualize the data they acquired by precisely measuring the gaps and holes. Veris efficiently captured road cracking in detail with its additional 12MP/20MP camera system. These are then mapped into the RoadSiDe dashboard, and cracking width and length are captured within the geodatabase. Machine learning is used to detect cracks in the road surface before pixels are classified into clusters and projected onto the original images for verification and quality assurance. This can then be integrated with location coordinates, allowing clients to see precisely where each cracking is located. With this georeferenced data digitized and visualized, Veris can leverage as much of its data as possible into the most effective platform for its users.
Expanding the scope of mobile mapping
The data captured by mobile mapping solutions is just as helpful in designing roads as in maintaining them and can be incorporated into the construction of future roads and city planning. The data even can be used to simulate, for example, the movement of a heavy truck through city streets to examine whether it will impact potholes or damage any road signs, allowing asset managers to predict and prevent damage and maintain road infrastructure for years to come.
Photo: richard johnson / iStock / Getty Images Plus / Getty Images
GNSS technology has become integral to construction work. In particular, firms rely on GNSS signals in four critical areas.
Site surveys
Surveying always has been a foundational aspect of construction planning. Mapping and staking the construction site is essential in preparing to break ground and build on site. Surveyors begin the task of bringing engineering plans from vision to reality.
This work may take place from the air and on the ground, and it now typically involves a vast array of tools to ensure accuracy, including drones, cameras, lasers, sensors, and GNSS signals. The data from GNSS are critical in helping surveyors and engineers create “digital twins” — virtual representations of the physical site they can update in real time to ensure the site matches the plan.
Robotics
Robotics have further transformed the work of construction, both in terms of site surveying and the work of building. Rovers, drones and construction robots can execute various tasks to improve project efficiency and save money.
Once again, GNSS signals play a critical role in ensuring robots carry out their tasks effectively and accurately. Land surveying rovers, for instance, rely on real-time satellite data to navigate construction sites and mark spots for construction with pinpoint precision.
Damage prevention
Construction work is highly invasive, penetrating the ground where hidden power, gas and water lines lie. Misfires during this process can have substantial cost implications or even be life-threatening for construction crews.
Construction firms can use GNSS receivers and other complex instruments to prepare for excavation. These tools provide detailed location information for underground pipes and wires and ensure contractors don’t damage critical underground infrastructure and cause costly delays or dangerous work conditions.
Engineers also can use GNSS data to pinpoint where future utility lines will be, ensuring construction does not get in the way of laying pipelines to bring the constructed building online.
Site inspections
GNSS data continue to play a critical role while construction work unfolds. As builders lay foundations, frame buildings and add finishes, engineers and inspectors can collect site reports and use satellite data to update digital twins and verify the work is on track.
With updated and accurate digital twins, planners have a real-time view of the work in progress, which they can use to inform plans, budgets and timelines as the project unfolds.
The Baltic, Ukraine, and the Middle East may be hotbeds of GPS interference that can hamper UAV operations, but these are not the only places in the world where it is happening.
It also happened in San Diego at the premier event for UAV operators— the XPOTENTIAL 2024 conference of the Association for Uncrewed Vehicle Systems International (AUVSI).
AUVSI is the world’s largest nonprofit organization dedicated to the advancement of uncrewed systems and robotics. Members present included corporations and professionals from more than 60 countries involved in industry, government and academia and work in the defense, civil and commercial markets.
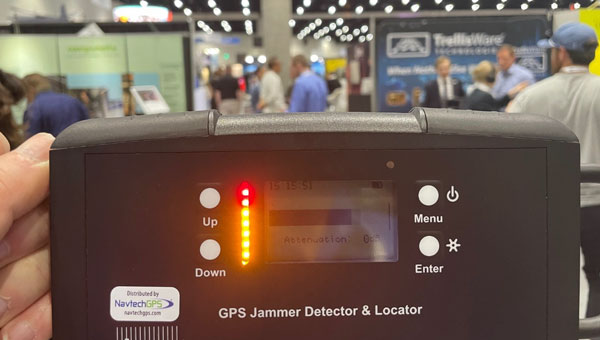
One of NavtechGPS’ directional finder identifies the source of interference at AUVSI’s Xpotential 2024 in San Diego. (Image: Dana Goward)
Among conference attendees were Franck and Trevor Boynton of NavtechGPS, a small Northern Virginia company specializing in GPS products and related services. One of their services is locating devices that are interfering with GPS reception.
“In our work around the country we have found a wide variety of devices interfering with GPS,” said Franck Boynton. “It’s a lot more common than you think. We found truckers with jammers interfering with port operations, for example,” he said. “But accidental interference is an even bigger problem. Most of the time we find it is just some malfunctioning equipment making the radio noise.”
Boynton’s experience is consistent with the 2019 European Union STIKE3 sampling project that detected more than 450,000 signals with the potential to interfere with GPS and other satnav signals. Experts determined that only about 10% of those were intentional. The rest seemed to be a byproduct of mechanical and electrical equipment not functioning quite properly.
Of course, intentional or accidental, interference with GPS signals can be a problem for both manned and unmanned aircraft, vessels and vehicles.
Intentional interference in conflict areas has turned UAVs and missiles away from their targets, and in some cases, back on attackers. It has impacted the safety and efficiency of aviation and maritime traffic nearby. As one example, regular jamming in the Baltic region recently resulted in the cancellation of scheduled commercial air service to a city in Estonia.
Accidental interference has caused survey UAVs to crash and created multi-day problems at the Denver and Dallas-Fort Worth major airports.
In at least one instance accidental interference almost ended in tragedy. In 2019 a commercial passenger aircraft near Sun Valley, Idaho nearly crashed into a mountain. Fortunately, a sharp-eyed radar controller hundreds of miles away intervened and directed the aircraft back on course.
Nearly 600 vendors filled the AUVSI XPOTENTIAL exhibit hall this year. While perusing the displays, the Boyntons detected a strong signal interfering with GPS frequencies. Thinking it was coming from one of the exhibits, they were surprised to find that not only did it turn off and on but it seemed to be moving around.
Using one of the direction finders that NavtechGPS sells, they were able to track the source to a film crew roaming the hall and speaking with exhibitors and attendees. The wireless microphone being used for interviews turned out to be the culprit. Since the film crew was unable to repair or replace the mic, the interference continued intermittently inside the hall for the rest of the event.
“Interference of all kinds with GPS and other satnav signals is a growing problem,” according to Franck Boynton. “As we continue to implement more autonomous systems, it will be increasingly important to ensure they have resilient navigation, and we eliminate as many sources of interference as possible.”
AUVSI did not respond to requests for comment for this story.
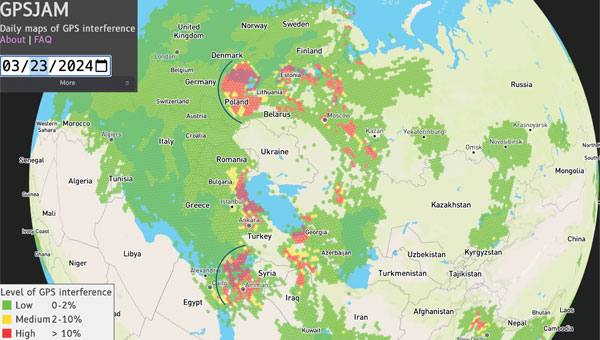
Figure 1: GPSJAM map on March 23, 2024. The map is based on GPS accuracy reports fron aircraft broadcast digital radio messages (ADS-B) over a 24-h period. A vast (uncolored) area on the globe is not covered because of no ADS-B report. Arcs are drawn over part of Europe and the eastern Mediterranean to help visualize the cone of the interference coming from potential jamming power sources. (Photo: GPSJAM.org)
GPS services are critical for real-time information on positioning, navigation and time (PNT). Because of the highly accurate and continuous PNT solution provided by GPS in all weather conditions, this multi-use technology has been adopted for civil applications including some for transportation, agriculture, aviation and emergency services. The increasing societal dependence on GPS has also created a set of security vulnerabilities for these applications.
GPS applications are vulnerable to signal interference, spoofing and degraded or denied services. Both intentional — jamming — and unintentional signal interference can cause inaccurate PNT and poor navigation performance. In addition, GPS service may be intentionally degraded or disrupted during military operations and system testing. Environments in which the GPS service is unavailable or severely degraded require alternative solutions for PNT.
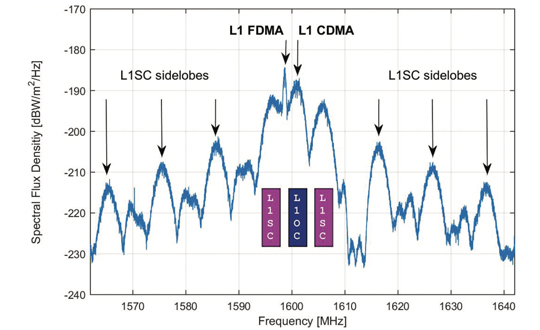
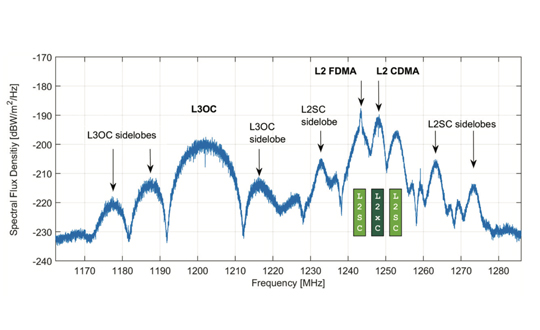
Several countermeasures have been implemented to mitigate the vulnerabilities of GPS receiving systems including flex power operation and signal encryption/authorization initiated by the service provider and signal filters and adaptive antennas implemented by a user. For example, a new military signal, M-code, from GPS III satellites has an improved anti-jamming capability in both the L1 and L2 frequency bands. GPS III can broadcast signals using a high-gain directional antenna, in addition to a wide-angle, full Earth antenna, which produces a restricted area spot service by manipulating signal strength. Such flex power operations help improve GPS performance in the presence of jamming. The flex power operation is different from the so-called Selective Availability (SA), which was an intentional degradation of civilian GPS signal accuracy globally. SA operation was discontinued in May 2000, so GPS services are always available for civil applications worldwide.
However, the transparency and openness of GPS services for peaceful uses is facing a hard reality, as the balance between peacetime and wartime applications can quickly change due to geopolitical conflicts. Attacking and overcoming GPS vulnerabilities has become a fast-evolving battlefield in modern electronic warfare. Jamming and spoofing of GPS — and other GNSS — have increased substantially in the eastern Mediterranean, Baltic Sea, and Arctic regions since Russia’s invasion of Ukraine. This was officially documented by the European Union Aviation Safety Agency in Safety Information Bulletin 2022-02R1 issued in November 2023.
For example, on March 23 to 24, 2024, widespread GPS jamming occurred in Eastern Europe that impacted more than 1,600 aircraft over a period of two days and was widely reported by mass media. The source of this massive jamming event was thought to be in Russia’s Kaliningrad exclave between Lithuania and Poland. As shown in FIGURE 1, the panoramic cone in the jammed region appears to support this speculation. Similar events with large-scale jamming occurred on December 25 to 26, 2023; January 19, February 2, 12 and 14; and March 1 to 3, 13, 15 to 16 and 18, 2024, according to GPSJAM.org. In addition, Figure 1 reveals a wide area of jamming in the eastern Mediterranean where the Israel-Hamas and Israel-Hezbollah conflicts are taking place.
The increased level of GPS jamming has had a significant impact on global science observations over the conflict regions, including low-quality measurements for soil moisture, and atmospheric and ionospheric soundings, as reported in the March issue of GPS World. In addition, NASA has observed many more dropouts from in-orbit GPS receivers in recent years, which degraded the ephemeris information used for scientific data. As the pattern of apparent GPS jamming continues, alternative filtering of the spaceflight GPS data would be required to safeguard continuous science operations.
The study reported in this article aims to provide a global perspective on recent GPS jamming and degraded services. Since late 2019, commercial CubeSat constellations such as Spire have provided atmospheric measurements with much-needed global coverage and spatiotemporal sampling. The amount of GNSS data increased from about 7,000 observations per day in 2020 to about 20,000 per day in 2022 thanks to the observation demand from weather and climate research.
Table 1: Spire satellite groups and GPS satellites observed.
SPIRE CUBESAT CONSTELLATION
Spire Global has flown more than 100 Low Earth Multi-Use Receiver (LEMUR) CubeSats since 2014. These cost-effective CubeSats are used to track maritime, aviation and weather activity from space, and can be replenished at a relatively fast pace for a low-Earth orbit (LEO) constellation. TABLE 1 lists the Spire CubeSats used in this study, showing their orbital inclination, flight model ID and the tracked GPS pseudorandom noise (PRN) code ID. Spire receivers track GPS L1C/A and L2 signals for precise orbit determination (POD) and radio occultation (RO) measurements with 1-Hz and 50-Hz sampling respectively. These Spire POD and RO data collections — from November 2019 to the present — are part of a contract under NASA’s Commercial Smallsat Data Acquisition Program.
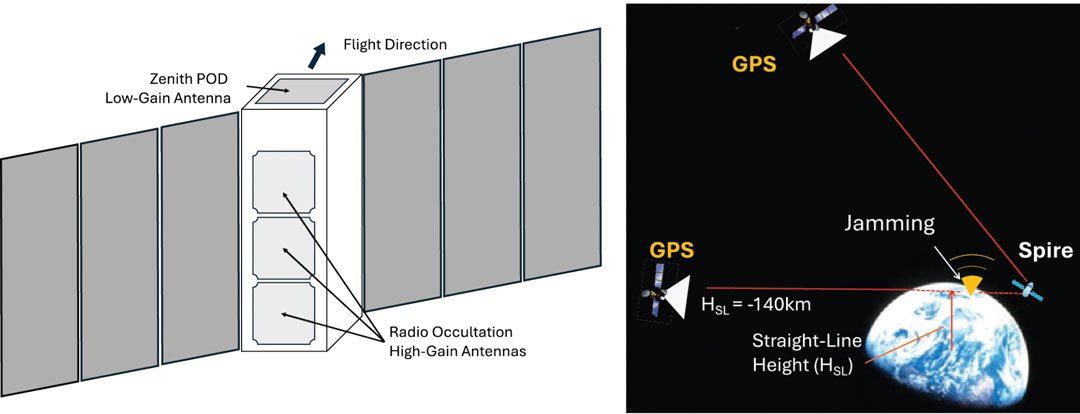
Figure 2: A schematic of the Spire 3-unit (10 x 10 x 34 cm) LEMUR CubeSat showing a zenith-view POD (precise orbit determination) and a limb-view RO (radio occultation) antenna for GPS measurements. There are usually two RO antennas on the fore-and-aft line with respect to the flight velocity, but only one POD antenna is mounted at the top. (Photo: Dong L. Wu)
The Spire LEMUR spacecraft have gone through several generations and expanded capabilities from atmospheric sounding with GPS radio occultation (GPS-RO) to GPS reflectometry (GPS-R) for soil moisture and ocean winds, grazing-angle reflectometry (GPS-GR) for sea ice and GPS-POD ionospheric sounding for space weather. In essence, however, as illustrated in FIGURE 2, these measurements are made available from two types of antennas on the satellites: a low-gain POD antenna and a high-gain RO antenna. As the measurement capability and performance improved, these antenna designs have become increasingly sophisticated and may differ substantially from satellite to satellite. Thus, it is imperative to characterize these antenna patterns carefully before comparing their signal amplitude or signal-to-noise ratio (SNR).
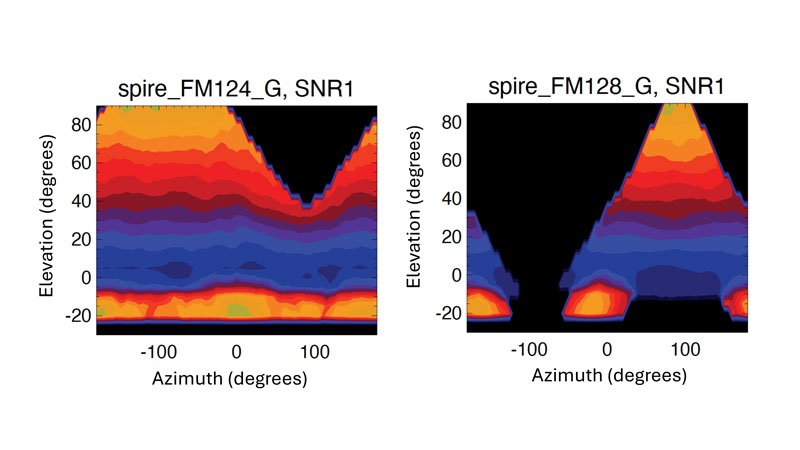
Figure 3: POD antenna patterns derived empirically from Spire FM124 and FM128 data as a function of elevation and azimuth angles. The elevation angle is defined as the angle of GPS line-of-sight (LOS) above the spacecraft horizon. The azimuth angle is defined as the difference between GPS LOS and spacecraft velocity azimuth angles with respect to the north. A 5° x 5° bin size was used in the averaging. Colors are the mean L1 SNR in arbitrary unit from two-month data aggregation. The antenna patterns of L1 and L2 signals are assumed to be same.
Instead of using ground calibration data, we employed an empirical method using the flight data to derive Spire’s POD antenna patterns. For each CubeSat, we aggregated a few months of POD data according to the GPS-POD link direction, in terms of elevation angle and azimuth angle with respect to the satellite flight direction. The averaging of such a large ensemble of measurements allows us to smooth out the fluctuations due to ionospheric scintillations and GPS service power variations. Two examples illustrated in FIGURE 3 show drastically different antenna patterns and designs between Spire FM124 and FM128. The larger antenna gain values at high positive elevation angles are expected for the commercial off-the-shelf (COTS) planar POD antenna pointing at zenith, whereas the gain at the bottom of negative elevation angle range is an added feature in this antenna design to enable a limb sounding of ionospheric electron density. To monitor the GPS service power, we use only the SNR measurements at positive elevation angles greater than 30° using the antenna pattern normalized by the mean values in this angular range.
We analyzed both Spire POD and RO SNR data. The POD SNR data are used to determine the GPS service power, while the RO SNR data are used to estimate the jamming power or jammer-to-noise ratio (JNR) from the surface. The POD SNR data at high elevation angles are mostly from free space but need to be corrected for the antenna pattern effect to measure the GPS signal strength accurately. Depending on the GPS-POD link direction, the antenna pattern can cause a large variation in the observed SNR (see Figure 3). For JNR detection, we use the RO SNR data from very low elevation angles (lower than 0°) with a straight-line height (HSL) of less than -140 kilometers. At this height, a tracked GPS satellite is completely obscured by Earth and the RO receiver is essentially measuring the receiver system’s noise. Thus, any enhanced “noise” would be considered as a jamming signal. The RO antenna pattern is less critical in this case because the locations of ground jamming sources are unknown and their signals are weak at spacecraft altitudes. Roughly speaking, the RO antennas tend to acquire signals within a horizontal field of view (FOV) of 60°, corresponding roughly to a swath of about 1,800 kilometers at the surface. Therefore, the RO JNR has a coarse spatial resolution and represents a collective emission from the ground sources.
DEGRADED SERVICE AND JAMMING
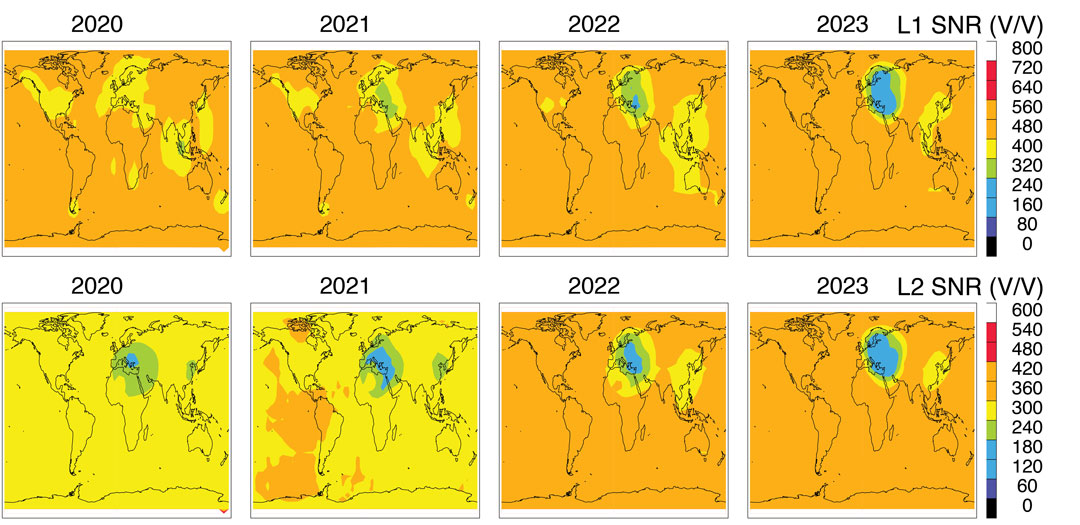
To monitor GPS service power, we normalized the Spire POD SNR with the empirically calculated antenna pattern for each CubeSat. The normalized SNR data are averaged to produce a global monthly map and then annual maps (see FIGURE 4). The L1 and L2 SNRs from Spire represent an average GPS power at an orbital altitude of about 530 kilometers. The normalized SNRs are geo-registered using the CubeSat location where the measurement was made.
Variations between different GPS satellites as well as between different Spire CubeSat altitudes are neglected in this study. Broadcasting powers from the GPS satellites may differ by a small (about 10%) amount between PRNs, which manifest themselves as a slightly inhomogeneous distribution in the maps (see Figure 4). The impacts of the Spire orbital altitude on the estimated GPS power are small, compared to the regional GPS power reduction seen over Europe.
Further improvements can be made to produce a more accurate estimate of the GPS power as well as a time series of power changes from individual PRNs.
There is a clear GPS power reduction in the L1 and L2 signals over several targeted regions. The reduction appears to differ between L1 and L2 bands during the 2020 to 2023 interval. The most prominent power reduction regions are Europe and the Middle East, where the L2 reduction started as early as 2020. Although the L1 reduction is present in this region, it deepened after 2021 and perhaps widened more in 2022 and 2023. The degraded services for a targeted region are consistent with the new capability of GPS III in operation.
Figure 4: Annual mean GPS L1 (top panel) and L2 (bottom panel) SNR distributions observed by Spire POD receivers for 2020-2023. (Photo: Dong L. Wu)
A relatively small GPS power reduction can be found in East China and Southeast Asia in the 2020 to 2023 period. The L1 power reduction in this region reveals a shift from Southeast Asia in 2019 to East China in 2023, whereas the L2 reduction appears to be concentrated in East China during these years. While geopolitical tensions in this region did not escalate to any wars, electronic warfare operations have been widely reported over the South China Sea, the East China Sea, and the Philippines since 2017.
Jamming detection from space is a more challenging task because of the generally weak JNR at the height of orbiting receivers. In addition, a wide antenna FOV of GPS receivers could yield less accurate geolocation of jamming sources. However, jamming detection has been made from several LEO satellites by various teams of scientists and engineers. By tracking the front-end noise of an RO receiver on the MetOp satellite, researchers were able to detect the elevated noise power originating from ground-based sources. Also, using the radio frequency spectra recorded with a nadir-viewing receiver on the International Space Station, investigators demonstrated the feasibility of detecting jamming and spoofing signals from the ground. It has been shown that the location of jamming/spoofing sources can be pinned down accurately with observations from two satellites. This technique laid the foundation for a new class of space intelligence missions such as the DEEP prototype, STRATOS and HawkEye-360. Studying the SNR perturbations in POD data from GRACE and COSMIC-1/2, it was possible to generate global maps of jamming hotspots from 2007 to 2016. Investigators have made use of the enhanced noise in delay Doppler maps of down-looking GPS-R receivers for jamming detection. Recently, we analyzed GPS-RO SNR measurements at the tangent heights obscured by Earth and reported the increased level of jamming in northern Africa, the Middle East and the eastern Mediterranean after 2018.
Compared to nadir-view techniques, jamming detection from limb views has some advantages and disadvantages. Disadvantages have been associated with the long path length between the source and the receiver, resulting in a potentially weak JNR and poor geolocation of jamming sources. On the other hand, if jammers chose to radiate the power horizontally for a wide areal impact, it would allow limb-view sensors to pick up the jamming power and identify the directionality of jamming sources by comparing the JNR observed from opposite look angles.
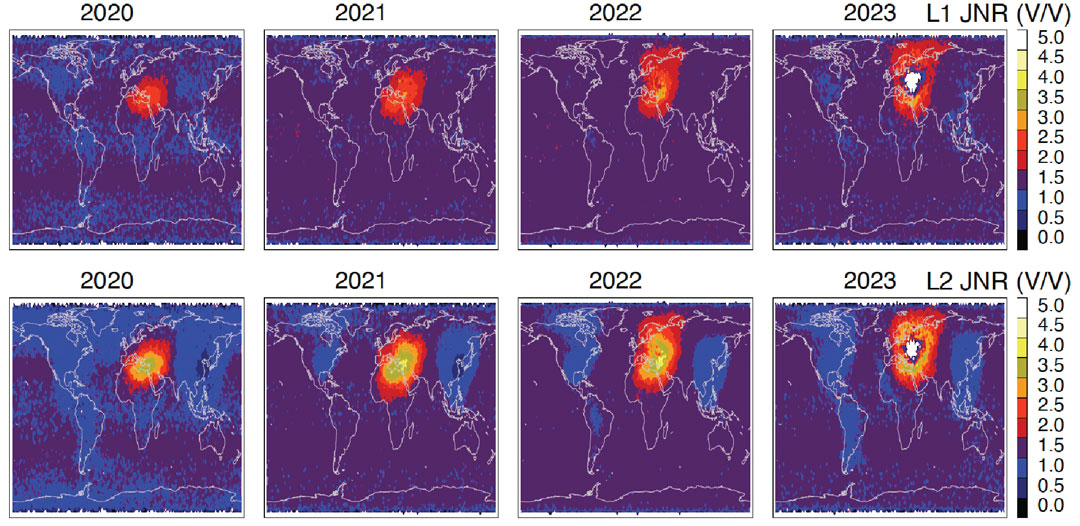
FIGURE 5 As in Fig. 4 but the L1 and L2 JNR are derived from the Spire RO SNR measurements at HSL < -140 km. A 3 V/V background noise is subtracted from the SNR measurements to obtain the JNR. In 2023 the white region inside the enhanced jamming is caused by the quality control (QC) of Spire data processing that excluded the RO data with a low free-space SNR. (Photo: Dong L. Wu)
Without any sophisticated data processing, in the study for this article, we simply averaged all the RO L1 SNR data at HSL less than 140 kilometers to extract the JNR power by subtracting a 3 V/V (volts per volt) noise from the average (see FIGURE 5). This approach is slightly different from our previous study, which normalized the JNR by the free-space SNR. Because the JNR signals were so strong in 2020 to 2023, no normalization is needed to enhance the jamming detection.
It is not surprising to see in Figure 5 that the worst GPS-jammed region appears in the Middle East and the surrounding area where geopolitical conflicts have broken out frequently in recent years. In the Syria and Libya civil wars, as well as in the Russia-Ukraine and Israel-Hamas conflicts, low-cost UAVs (commonly referred to as drones) and precision-guided munitions were widely used in attacks, which was a major incentive to deploy electronic warfare to jam GPS-guided weapons and operations.
As shown in Figure 5, the JNR power was mostly concentrated in the eastern Mediterranean, the Middle East and northern Africa in 2020 and 2021 but spread to northern Europe after Russia invaded Ukraine in 2022. More JNR power appears to be in the GPS L2 band compared to L1, likely because L2 is a weaker signal and easier to jam and degrade GPS performance in navigation applications.
The regions of GPS signal reduction and enhanced jamming are highly correlated in the Spire observations. The high correlation is expected for the increased use of militarized commercial drones and GPS-guided munitions in the conflict zones. In the Russia-Ukraine war, low-cost GPS-based commercial drones have been imported to the battlefield, as have jamming capabilities. Their modifications and tactical use are evolving rapidly as the conflict continues. A precursor of such massive use of low-cost drones was in the Libya civil war (2014 – 2020), in which thousands of airstrikes were reported. Most of these commercial-grade drones relied on GPS civilian signals for navigation. Therefore, denying or reducing the GPS civilian signal power can help degrade the performance of militarized commercial drones. On the other hand, jamming and spoofing GPS signals remains a cost-effective electronic warfare technique in these conflicts.
CONCLUSIONS
This article has provided an overview of global GPS jamming and service reduction between 2020 and 2023 using recent observations from the Spire constellation. The service power reduction and jamming power increases are highly correlated on a regional scale, showing that Europe and the Middle East have been most impacted by the ongoing geopolitical conflicts. The area of the impacted regions has widened significantly from 2021 to 2023 and spread to Northern Europe. The dual-use civil and military GPS technology and services are currently experiencing an unprecedented scale of electronic warfare attacks.
ACKNOWLEDGMENT
The work reported in this article was supported by NASA’s Commercial Smallsat Data Acquisition program.
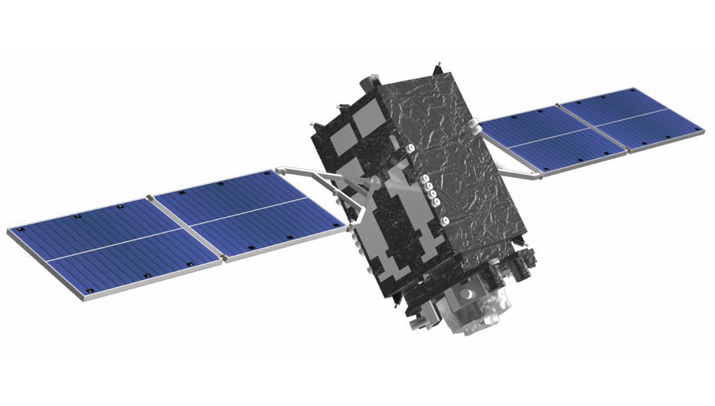
In early 2015, the Navigation Support Office of the European Space Agency (ESA) and the Japan Aerospace Exploration Agency (JAXA) began a collaboration. At its core, the ESA-JAXA collaboration is designed to cross-validate Japan’s Quasi-Zenith Satellite System (QZSS) Precise Orbit Determination (POD) results and share expertise to improve the POD accuracy of QZSS.
The cross-validation of the QZSS POD performance was implemented by jointly analyzing QZSS observations and validating the POD results of the QZSS satellites. As a result of this joint activity, ESA and JAXA have significantly improved the robustness and accuracy of their respective POD products. This collaborative approach not only ensures the continuous improvement of QZSS force modeling and precise orbit determination performance but also demonstrates the effectiveness of international cooperation in advancing the field of space navigation, especially as the benefits of GNSS interoperability become very evident.
An important milestone in this collaboration was ESA’s role in supporting the In-Orbit Testing (IOT) activities for QZS-1R towards the end of 2021. The successful execution of these tests demonstrated the practical results of the ESA-JAXA partnership and further solidified the commitment of both agencies to enhance their capabilities for QZSS POD and associated products.
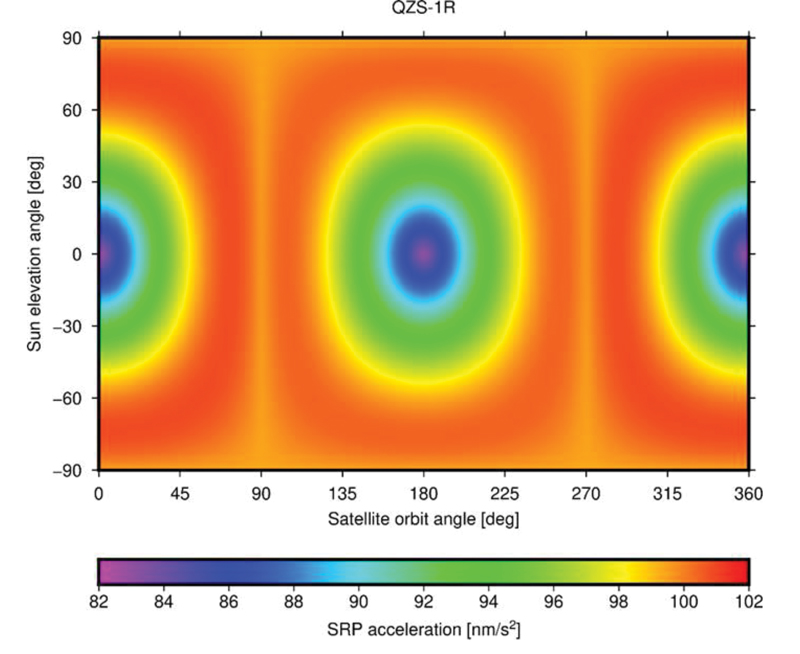
FIGURE 1 ESA’s Solar Radiation Pressure (SRP) model output in satellite-Sun frame.
The benefits of this collaboration extend beyond the agencies to the entire scientific community. Notable achievements include the revision of metadata for the QZSS constellation, such as the optical properties of the QZS-1 solar arrays, which have been refined and improved through shared expertise, while simultaneously releasing the satellite mass and attitude mode history in a machine-readable file format for easy access and adoption by the users.
To evaluate the spacecraft models and metadata for QZS-1R prior to their public release, ESA and JAXA conducted several comparative tests. Since both organizations use different software packages for satellite POD — ESA uses NAPEOS (Dow, Springer 2009, Enderle et al., 2019 and 2022) and JAXA uses MADOCA (Kawate et al., 2023) — their results can be considered as largely independent. One comparison involved the Solar Radiation Pressure (SRP) model results produced by both organizations. FIGURE 1 shows the accelerations in satellite-Sun frame computed by ESA’s SRP model. The comparison of the computed SRP accelerations in different reference frames, spacecraft-fixed and inertial, showed excellent agreement with differences of less than 0.1 nm/s².
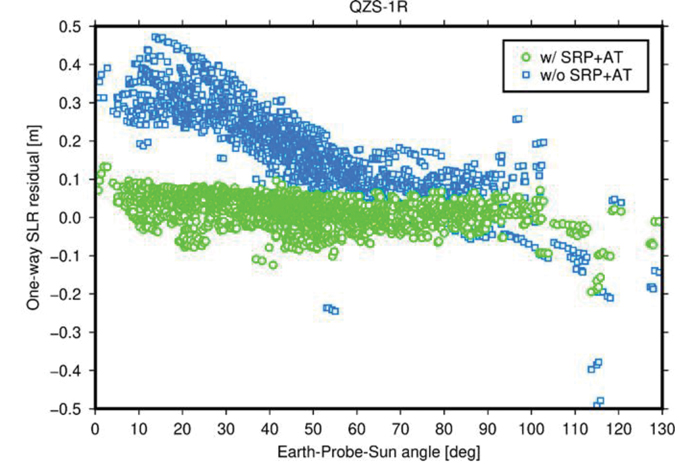
FIGURE 2 One-way Satellite Laser Ranging (SLR) range residuals calculated with respect to QZS- 1R orbits generated with (green) and without (blue) a-priori radiation force models and displayed as function of the Earth-Probe-Sun angle.
In addition, pseudo-range and carrier phase dual-frequency measurement data from 200 tracking stations of the International GNSS Service (IGS) network were used to generate precise QZS-1R satellite orbits and clock offsets on a day-to-day basis over a 12-month period spanning from January to December 2022. Comparison between ESA and JAXA solutions yielded a root-mean-square (RMS) agreement of 8.6 centimeters (orbit) and 0.21 nanoseconds (clock), respectively. Analysis of Satellite Laser Ranging (SLR) data from seven stations of the International Laser Ranging Service (ILRS) suggests a radial RMS accuracy of the generated orbital trajectories of about 4 cm. Without applying the analytical models for SRP and other non-gravitational perturbation forces, such as antenna thrust (AT), the RMS accuracy decreases by a factor of five (FIGURE 2).
In conclusion, the ESA-JAXA collaboration on Japanese Quasi-Zenith Satellite System POD has been a resounding success. Through this continuous and mutual support, performance cross-validation and knowledge sharing, significant improvements related to modeling and subsequently to POD accuracy could be achieved for ESA as well as for JAXA. Additionally, the global scientific community benefitted from this ESA/JAXA collaboration via improved QZSS POD products and validated metadata.
In my November 2023 GPS World newsletter, I highlighted the announcement made by the National Geodetic Survey (NGS) of the recipients of the National Oceanic and Atmospheric Administration (NOAA) FY 23 Geospatial Modeling Competition awards. The primary objectives of these projects are to modernize geodetic tools and models and to develop a geodetic workforce for the future. My last three GPS World newsletters — February 2024, March 2024 and April 2024 — highlighted three of the grantees, Scripps Institution of Oceanography, The Ohio State University, and Oregon State University that included developing models to address what NGS denotes as the Intra-Frame Deformation Model (IFDM) and creating geodesy curriculums that will help address the geodesy crisis. Changes in these geomatic programs will provide students with the skills in geospatial systems that will make available opportunities for employment in the public and private sectors. This newsletter will address the proposal by the fourth NGS geospatial modeling grant awardee, Michigan State University (MSU).
First, it should be noted that this award is denoted as the MSU geospatial modeling award; that said, the execution of the project will be led by MSU, along with two sub-awardees — University of Alaska Fairbanks (UAF) and Michigan Tech University (MTU). Jeffrey Freymueller and Julie Elliott are the MSU grant’s principal investigators (PI). They provided me with information about the goals and objectives of their grant proposal.
The MSU proposal includes enhancing software and monitoring capabilities for NGS, enhancing graduate-level geodetic education and providing opportunities for graduate and undergraduate students to be exposed to geodetic science. Again, focusing on geodesy curriculums will help address the geodesy crisis and will provide students with the skills in geospatial systems that will increase their opportunities for employment in the public and private sectors. The proposal has two main goals and objectives.
Goals and objectives
CORS Dashboard
Build an online, web-based CORS dashboard that will support monitoring of the continuously operating reference station (CORS) network.
Making it easier to continually validate the current position of CORS sites to the existing motion models (IFDM).
To validate and correct the motion models themselves in the presence of time-dependent tectonic and volcanic activity.
Education
Work with partner universities toward developing and establishing a consortium model for future distributed geodetic degree programs that leverage the capabilities and capacity of multiple universities.
Develop new course material for graduate level geodetic education that is intended for hybrid or asynchronous remote delivery and the establishment of a formal degree program.
Host summer undergraduate interns who will work on a variety of geodetic projects including the CORS dashboard.
Two graduate students will be supported to work on various aspects of the proposed work at MSU and MTU.
Anyone using NGS’s “user-friendly” software knows that they are working on improving their web-based services. However, NGS still needs help from outside users.
I want to emphasize that I am not criticizing NGS’s products and services. I worked for NGS for over three decades, and I personally know that NGS has limited resources to accomplish too many tasks. NGS needs to focus on the science and get help with the development of models, tools and the dissemination of results and data. That is one of the reasons that these geospatial modeling grants are important to all users of the National Spatial Reference System (NSRS).
The proposed CORS Dashboard will be very useful to NGS employees monitoring the CORS and evaluating the IFDM. The proposal highlights that users of NGS products and services have various precision and accuracy requirements and that all users expect that NGS products will be sufficiently precise and accurate to meet their positioning needs. Their design of the CORS Dashboard will provide a tool for effectively monitoring and assessing a CORS site status and the validity of its coordinates. The first phase of this tool is being developed for internal use at NGS. However, in my opinion, after all the bugs have been identified and dealt with, NGS will release a version for the user.
Not all CORS are created equal. So, having a CORS Dashboard that quickly identifies and notifies CORS users of a systematic deviation at a site, regardless of cause, will avoid promulgating erroneous positions to users. In addition, providing statistical information about a CORS site such as short- and long-term plots and their residuals would provide users with helpful information for planning a GNSS project. The metadata of CORS is extremely important since most of the CORS included in the NOAA CORS Network are not maintained by NGS.
CORS managers are supposed to notify NGS when they make any change to their CORS site such as an antenna change and any changes surrounding the CORS site, including new vegetation or construction that could cause potential obstructions. The CORS Dashboard will help identify issues with CORS before users include them in their projects.
NGS’s OPUS Project online user guide provides information on selecting the best CORS. The following is from the user guide:
Using the centered time-series plots, select the candidates with RMS (in northing, easting, and up) less than 2 cm. Candidates with large spikes, data gaps or discontinuities should be rejected. Selecting candidates in this manner will provide some assurance that the published coordinates and velocities at the CORS agree with the daily solutions for the CORS.
The best CORSs should have “consistent” data depicted in 90-day short-term time-series plots. NGS processes each day of GNSS data collected at each CORS and plots the differences between the resulting coordinates and the published coordinates on short-term time-series plots (in terms of delta northing, easting, and up). These plots can be accessed for every CORS at https://geodesy.noaa.gov/corsdata/Plots/. CORS with plots that depict significant biases from the published coordinates (more than 2 cm in northing, easting, or more than 4 cm), spikes or data gaps should be avoided.
NGS has developed a Beta CORS Time Series Tool that provides information that assists users in the selection of appropriate CORS for a project. The tool computes and displays the residual differences from the daily NGS OPUS-NET solutions with the coordinates from the official CORS’ coordinate functions. The tool also generates a summary table with the mean, standard deviation, and root-mean-square error of the residuals. On April 24, 2024, NGS announced the release of a beta version of a new NOAA CORS Network (NCN) Station Web Page. According to the announcement, each CORS in the NCN will have its own page with data, metadata, maps and photos for that station displayed in a modular layout so information is easily found all in one location. I will describe this new beta site in a future newsletter.
The new, modernized NSRS will offer time-dependent coordinates based on an IFDM. This has been described in previous GPS World newsletters (February 2022 and August 2022). The MSU proposal includes developing a model that accounts for crustal movements — such as earthquakes, slow slip events, and volcanic eruptions, — as well as slower, cumulative growth of error due to post-seismic deformation, surface loading (ice or water changes) and changes in rates of human-induced subsidence due to fluid withdrawal. Like any model, the IFDM model will have uncertainties. Being able to provide a realistic estimate of the uncertainties of the IFDM is very important. The PIs of the proposal have extensive knowledge and experience in generating models and uncertainties. As noted in their proposal, the “problem” may not be an issue with the site or the equipment but with the model. See the box titled “Excerpt from the MSU Proposal.” I have highlighted several sections that I believe are important to the users of the new, modernized NSRS.
As anyone who has been following my newsletters knows, I have been highlighting the geodesy crisis and programs that advance the science of geodesy — July 2020, November 2022, and December 2022. The proposal includes developing geodetic science courses that will be optimized for hybrid or asynchronous online courses that address advanced technical topics on GNSS, InSAR, map projections, reference frames, and adjustment theory. This will build on existing programs at MSU, UAF and MTU that will provide an online graduate degree in geodesy. MSU envisions this to be a step toward a consortium-based enhanced graduate-level education that provides a range of course options and flexibility. The university believes that there will be opportunities to expand the consortium in the future. The courses have not been finalized yet, but below are some of the topics and concepts that are being considered for the program.
Topics and Concepts
Map Projections
Map projections, geodetic datums, grid systems and transformations. Use of mapping software including GMT.
Geodetic Models
Course provides solid geospatial background in geodetic reference frames, datums, geoids and reference ellipsoids. 2D and 3D geodetic network adjustments are considered based on 3D spherical models.
Modern Geodesy and Applications
Modern geodetic methods including GPS, measuring steady or time-variable motions, the physical models that are used to interpret these observations and applications to active geological processes, the cryosphere and hydrology.
Geodetic Methods and Applications
Theory and application of modern geodetic tools to measure Earth’s surface deformation with emphasis on GPS and InSAR. Basics of data processing; evaluation of signals and modeling of their sources; applications include magma systems, earthquake cycle and hydro- and cryosphere. Labs in Python require programming experience
Geodetic Data Processing and Analysis
Course provides students hands-on experience in the selection, processing and analysis of geodetic data sets, particularly InSAR and GNSS. Selection of data from diverse sources, evaluation of data strengths and weaknesses, processing and analysis of data and application to the investigation of geological problems.
Solid Earth Geophysics and Geodynamics
Theory and applications of solid-Earth geophysics including geochronology, geothermics, geomagnetism and paleomagnetism, geodesy and gravity, rheology and seismology.
Foundations of Geophysics
Applications of continuum mechanics, heat flow theory and potential theory to geophysical, geologic and glaciological problems. Topics such as postglacial rebound, non-Newtonian fluid flow, thermal convection, stress-relaxation, rheology of Earth materials, gravity and magnetics will be discussed. Emphasis will be placed on methods and tools for solving a variety of problems in global and regional geophysics and the geophysical interpretation of solutions.
Positioning with GNSS
In-depth study of GPS, GLONASS, Galileo, COMPASS satellite systems; theory and processing of global positioning measurements.
Intro Numerical Tools for Earth and Environmental Sciences
Introduction to Linux and C including numerical methods, integration, curve-fitting and differential equations with an emphasis on applications to the geological sciences.
Programming and Automation for Geoscientists
Basic concepts of computer programming and effective task automation for computers, with an emphasis on tools and problems common to the geosciences and other physical sciences. Use of Python, Jupyter Notebooks, shell scripting and command line tools, making scientific figures, maps and visualizations.
Data Analysis and Adjustments
Course explores fundamentals of mathematical error propagation theory, including various observation equations, least squares adjustment and Kalman filter methods. Blunder detection, decorrelation and inversion of patterned large matrices processes are considered. Involves analysis of position estimation deploying geospatial measurements.
Inverse Problems and Parameter Estimation
An inverse problem uses observations to infer properties of an unknown physical model. This course covers methods for solving inverse problems, including numerous examples arising in the natural sciences. Topics include linear regression, method of least squares, estimation of uncertainties, iterative optimization and probabilistic (Bayesian) and sampling approaches.
Numerical Analysis
Direct and iterative solutions of systems of equations, interpolation, numerical differentiation and integration, numerical solutions of ordinary differential equations and error analysis.
3D Surveying and Modeling with Laser Scanning Data
Theory and application of terrestrial lidar scanning. Typical application scenarios are also included. Intensive lab component provides hands-on experience in lidar point cloud processing and visualization.
Fundamentals of spaceborne imaging systems relevant to topographic mapping. Imagery products —preprocessing levels and metadata. Specific methods of space photogrammetry. Review of contemporary spaceborne imaging systems and imagery products available. Airborne non-frame sensors and photogrammetric processing of the imagery.
Microwave Remote Sensing
The principles and applications of active and passive microwave remote sensing with emphasis on spaceborne remote sensing of the Earth’s atmosphere, land and oceans. The laboratory section will provide hands-on experience on special processing techniques and the possibility of using these techniques for a student-defined term project in areas of geology, volcanology, glaciology, hydrology and environmental sciences
InSAR and its Applications
Introduction to the concepts of repeat-pass spaceborne SAR interferometry. Practical use of the technique to derive displacements of the solid Earth, glaciers and ice sheets to a precision of a few centimeters and accurate digital elevation models of the Earth’s surface.
As previously stated, these courses have not been finalized. An important aspect of the courses is that they contain content that will provide students with the skills and knowledge in geodetic concepts to help address the geodesy crisis in the United States.
I first mentioned the need for more trained geodesists in my July 2020 article for the “First Fix” column of GPS World, where I stated that the shortage of U.S.-trained geodesists poses a significant economic risk for the United States. In that column, I mentioned how geodetic science and technology now underpin many sciences, large areas of engineering such as driverless vehicles, UAVs, navigation, precision agriculture, smart cities and location-based services.
My November 2022 GPS World Newsletter highlighted “The inverted geospatial pyramid” graphic, which depicts how the entire $1 trillion geospatial economy is supported and dependent on geodesy. A lack of geodetic expertise in the United States presents a significant challenge, with future impacts on positioning, navigation, mapping and dependent geospatial technologies. These changes in the geomatic programs at the universities being funded by NGS’s geospatial modeling grants will provide students with the skills in geodetic concepts that will provide opportunities for employment in the public and private sectors involved with geospatial technology.
This newsletter and my past three GPS World newsletters highlighted the four NGS Geospatial Modeling grantees, which included creating geodesy curriculums that will help address the geodesy crisis. The MSU proposal describes a consortium-based enhanced graduate-level education program that will provide a range of course options and flexibility. I believe their proposed hybrid or asynchronous online program will provide more opportunities for individuals to study geodesy and advance the science of geodesy.
One final note about the NGS Geospatial Modeling Grants. On June 4, 2024, Brad Kearse, director of NGS, will moderate a session at the UESI Surveying and Geomatics 2024 Conference held in Corvallis, Oregon, on June 4 to 5, 2024. This will be a good opportunity for participants to obtain a better understanding of the geospatial modeling grants.
The NGS Geospatial Modeling grant program is focused on modernizing and improving the National Spatial Reference System (NSRS) and address emerging research problems in the field of geodesy. A secondary objective of this funding opportunity is to support a geodesy community of practice in collaboration with federal and nonfederal stakeholders to address the nationwide deficiency of geodesists and improve the coordination and use of geospatial data. This panel session will explore the research and other activities underway from recipients of the most recent round of the NGS Geospatial Modeling Grant Program.
GLONASS satellites traditionally use L1 and L2 frequency division multiple access (FDMA) signals. FDMA is characterized by a different transmit frequency for each satellite. Newer satellite generations also transmit an L3 code division multiple access (CDMA) signal. CDMA uses the same frequency but different ranging codes for individual satellites. The first GLONASS K2 satellite, with the space vehicle number R803, was launched in August 2023. It extends the range of CDMA signals to the L1 and L2 bands.
Figure 1. GLONASS K2 spectrum of the L1 frequency band. The different components of the L1 CDMA signal are indicated by colored boxes. L1SC: secured signal. L1OC: open service signal. (All figures provided by the authors)
Frequency spectra of R803, including these new signals, are shown in Figures 1 and 2. They were measured with the 30 m high-gain antenna of the German Space Operations Center (GSOC) in Weilheim, Germany, on Jan. 17, 2024. The largest and sharpest peak in the L1 band at 1,598.625 MHz originates from the 0.5 MHz binary phase-shift keying (BPSK) FDMA signal. The center peak of the L1 CDMA signal is located at 1,600.995 MHz. It is related to the L1 open service signal consisting of a data component (L1OCd) and a pilot component (L1OCp). L1OCd and L1OCp are combined by time-division multiplexing. The peaks that are ±5 MHz away from the L1 CDMA center frequency are introduced by the binary offset carrier (BOC) modulation of the secured L1SC signal. Prominent L1SC side lobes are visible ±15, ±25 and ±35 MHz offset from the center frequency. A quadrature phase-shift keying (QPSK) modulation is used to combine the L1OC and L1SC signals. The local minimum between 1,610 MHz and 1,614 MHz is caused by a notch filter onboard the satellite to protect radio astronomical observations of the Hydroxyl spectral line at 1,612 MHz.
Figure 2. GLONASS K2 spectrum of the L2 and L3 frequency bands. The different components of the L2 CDMA signal are indicated by colored boxes. L2SC: secured signal. L2xC stands for the time multiplexed L2OCp and L2 CSI signal. (All figures provided by the authors)
The L2 CDMA signal is composed of a signal for service information (L2 CSI) and the pilot open service navigation signal (L2OCp). As for L1, these two signals are time-division multiplexed and combined with the secured L2SC signal by QPSK. The left main lobe of the L2SC signals coincides with the L2 FDMA center frequency of 1,243.375 MHz. Both, the L2 CSI, as well as the L2OCp signal, contribute to the peak at the L2 CDMA center frequency at 1,248.06 MHz. The L3 CDMA signal is composed of 10 MHz BPSK data (L3OCd) and pilot (L3OCp) components resulting in a broad peak at 1,202.025 MHz.
FDMA and CDMA signals of GLONASS R803 were tracked with a JAVAD TRE_3S receiver with a prototype firmware located at GSOC in Oberpfaffenhofen, Germany. Figure 3 shows the differences between pseudo range and carrier phase observations for the FDMA and CDMA signals in the L1 and L2 frequency bands. Long-term ionospheric effects were removed by a second-order polynomial. Thus, remaining effects include short-term ionospheric variations, multipath, and observation noise. The standard deviation of the code–carrier combination is, in general, at the half-meter level. Due to their advanced design, the CDMA signals show an improved performance by 18% for L1 and even 31% for L2 compared to the legacy FDMA signals.
Figure 3. Code – carrier for GLONASS R803 FDMA and CDMA signals: L1 (left) and L2 (right). A second order polynomial has been removed and the CDMA signals are shifted by 4 m. (All figures provided by the authors)
Further launches of L1 and L2 CDMA-capable GLONASS K2 satellites are planned for the upcoming years. A constellation of at least 12 satellites is expected for 2030. To guarantee backwards compatibility, these satellites will also transmit the L1 and L2 FDMA signals. Further improvements in positioning accuracy are expected due to improved satellite clocks and inter-satellite laser ranging.
Russian Space Systems (2016), GLONASS Interface Control Document: Code Division Multiple Access Open Service Navigation Signal in L1 frequency band. Russian Rocket and Space Engineering and Information Systems Corporation, Joint Stock Company.
Russian Space Systems (2016), GLONASS Interface Control Document: Code Division Multiple Access Open Service Navigation Signal in L2 frequency band. Russian Rocket and Space Engineering and Information Systems Corporation, Joint Stock Company.
Manufacturers
GNSS data used in this article were collected with a JAVAD TRE_3S receiver. The spectral overviews were captured with a Rohde & Schwarz FSQ26 signal analyzer.