Author: GPS World Staff

  • Challenged Positions: Dynamic Sensor Network, Distributed GPS Aperture, and Inter-nodal Ranging Signals

    A performance assessment demonstrates the ability of a networked group of users to locate themselves and each other, navigate, and operate under adverse conditions in which an individual user would be impaired. The technique for robust GPS positioning in a dynamic sensor network uses a distributed GPS aperture and RF ranging signals among the network nodes.

    By Dorota A. Grejner-Brzezinska, Charles Toth, Inder Jeet Gupta, Leilei Li, and Xiankun Wang

    In situations where GPS signals are subject to potential degradations, users may operate together, using partial satellite signal information combined from multiple users. Thus, collectively, a network of GPS users (hereafter referred to as network nodes) may be able to receive sufficient satellite signals, augmented by inter-nodal ranging measurements and other sensors, such as inertial measurement unit (IMU), in order to form a joint position solution.

    This methodology applies to numerous U.S. Department of Defense and civilian applications, including navigation of dismounted soldiers, emergency crews, on-the-fly formation of robots, or unmanned aerial vehicle (UAV) swarms collecting intelligence, disaster or environmental information, and so on, which heavily depend on availability of GPS signals. That availability may be degraded by a variety of factors such as loss of lock (for example, urban canyons and other confined and indoor environments), multipath, and interference/jamming. In such environments, using the traditional GPS receiver approach, individual or all users in the area may be denied the ability to navigate.

    A network of GPS receivers can in these instances represent a spatially diverse distributed aperture, which may be capable of obtaining gain and interference mitigation. Further mitigation is possible if selected users (nodes) use an antenna array rather than a single-element antenna. In addition to the problem of distributed GPS aperture, RF ranging among network nodes and node geometry/connectivity forms another topic relevant to collaborative navigation. The challenge here is to select nodes, which can receive GPS signals reliably, further enhanced by the distributed GPS aperture, to serve as pseudo-satellites for the purpose of positioning the remaining nodes in the network.

    Collaborative navigation follows from the multi-sensor navigation approach, developed over the past several years, where GPS augmentation was provided for each user individually by such sensors as IMUs, barometers, magnetometers, odometers, digital compasses, and so on, for applications ranging from pedestrian navigation to georegistration of remote sensing sensors in land-based and airborne platforms.

    Collaborative Navigation

    The key components of a collaborative network system are

    • inter-nodal ranging sub-system (each user can be considered as a node of a dynamic network);
    • optimization of dynamic network configuration;
    • time synchronization;
    • optimum distributed GPS aperture size for a given number of nodes;
    • communication sub-system; and
    • selection of master or anchor nodes.

    Figure 1 illustrates the concept of collaborative navigation in a dynamic network environment. Sub-networks of users navigating jointly can be created ad hoc, as indicated by the circles. Some nodes (users) may be parts of different sub-networks.

    FIGURE 1. Collaborative navigation concept.
    FIGURE 1. Collaborative navigation concept.

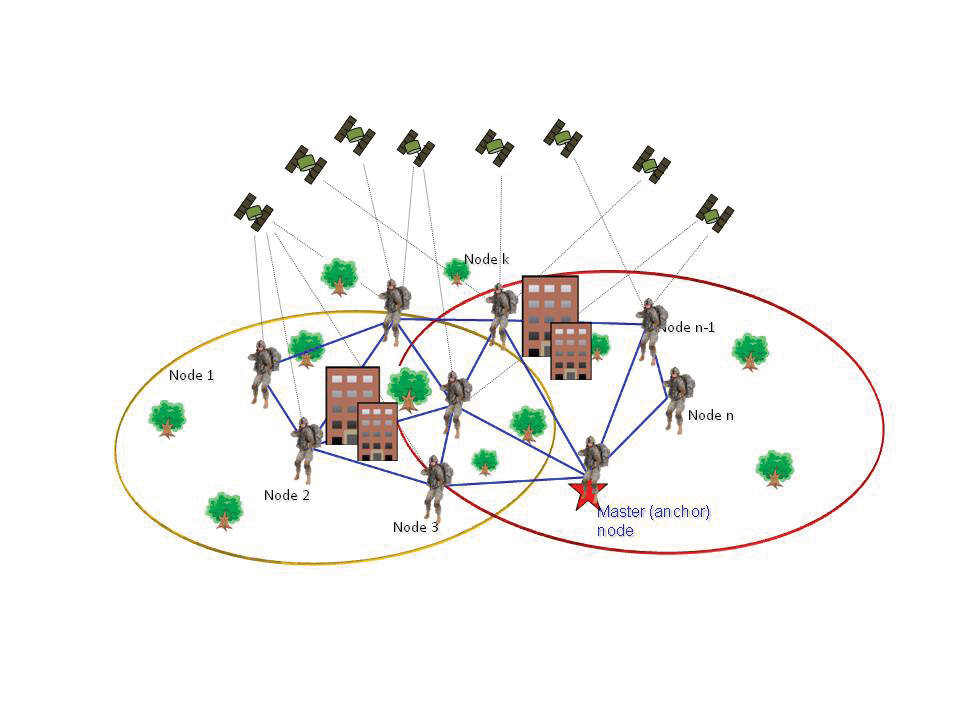
    In a larger network, the selection of a sub-network of nodes is an important issue, as in case of a large number of users in the entire network, computational and communication loads may not allow for the entire network to be treated as one entity. Still, information exchange among the sub-networks must be assured.

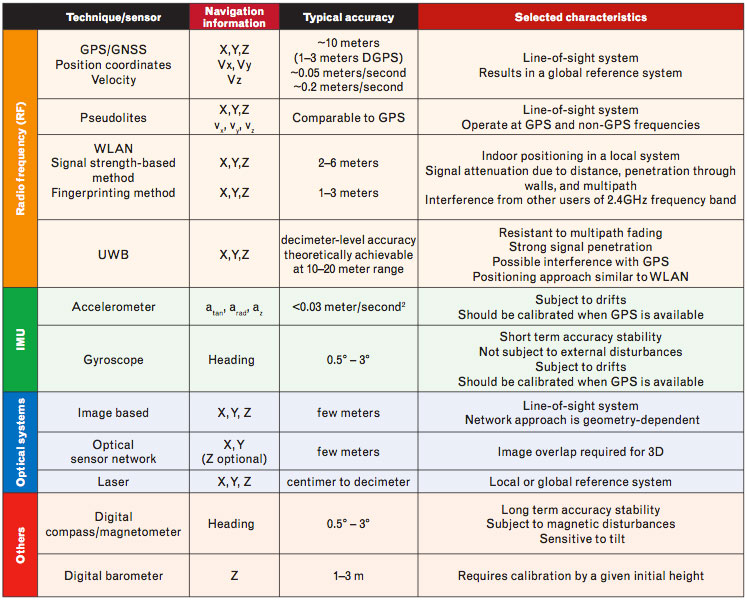
    Conceptually, the sub-networks can consist of nodes of equal hierarchy or may contain master (anchor) nodes that normally have a better set of sensors and collect measurements from all client nodes to perform a collaborative navigation solution. Table 1 lists example sensors and techniques that can be used in collaborative navigation.

    TABLE 1. Typical sensors for multi-sensor integration: observables and their characteristics, where X,Y,Z are the 3D coordinates, vx, vy, vz are the 3D velocities,
    TABLE 1. Typical sensors for multi-sensor integration: observables and their characteristics, where X,Y,Z are the 3D coordinates, vx, vy, vz are the 3D velocities,

    The concept of a master node is also crucial from the stand point of distributed GPS aperture, where it is mandatory to have master nodes responsible for combining the available GPS signals.

    Master nodes or some selected nodes will need anti-jamming protection to be effective in challenged electromagnetic (EM) environments. These nodes may have stand-alone anti-jamming protection systems, or can use the signals received by antennas at various nodes for nulling the interfering signals.

    Research Challenges

    Finding a solution that renders navigation for every GPS user within the network is challenging. For example, within the network, some GPS nodes may have no access to any of the satellite signals, and others may have access to one or more satellite signals. Also, the satellite signals received collectively within the network of users may or may not have enough information to determine uniquely the configuration of the network.

    A methodology to integrate sensory data for various nodes to find a joint navigation solution should take into account:

    • acquisition of reliable range measurements between nodes (including longer inter-nodal distances);
    • limitation of inter-nodal communication (RF signal strength);
    • assuring time synchronization between sensors and nodes; and
    • limiting computational burden for real time applications.

    Distributed GPS Apertures

    In the case of GPS signal degradation due to increased path loss and radio frequency interference (RFI), one can use an antenna array at the receiver site to increase the gain in the satellite signal direction as well as steer spatial nulls in the interfering signal directions. For a network of GPS users, one may be able to combine the signals received at various receivers (nodes) to achieve these goals (beam pointing and null steering); see Figure 2.

    Figure 2.Distributed antenna array.
    Figure 2. Distributed antenna array.

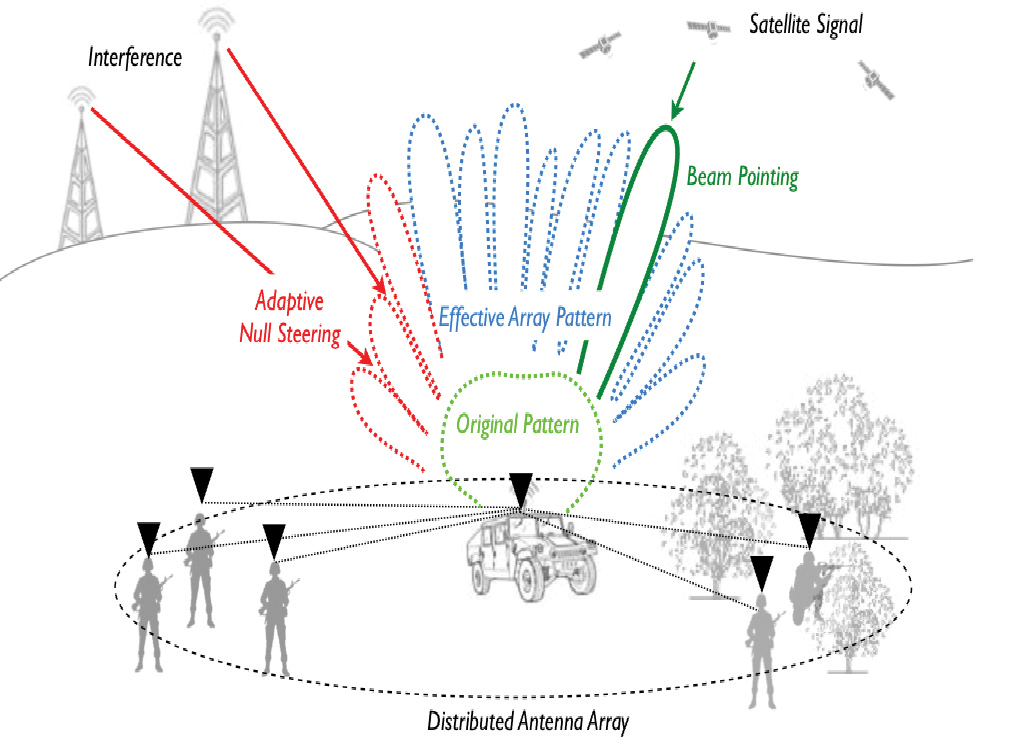
    However, a network of GPS users represents a distributed antenna aperture with large (hundreds of wavelengths) inter-element spacing. This large thinned antenna aperture has some advantage and many drawbacks. The main advantage is increased spatial resolution which allows one to discriminate between signals sources with small angular separations. The main drawback is very high sidelobes (in fact, grating lobes) which manifest as grating nulls (sympathetic nulls) in null steering. The increased inter-element spacing will also lead to the loss of correlation between the signals received at various nodes. Thus, space-only processing will not be sufficient to increase SNR by combining the satellite signals received at various nodes. One has to account for the large delay between the signals received at various nodes.

    Similarly, for adaptive null steering, one has to use space-time adaptive processing (STAP) for proper operation. These research challenges must be solved for distributed GPS aperture to become a reality:

    • Investigate the increase in SNR that can be obtained by employing distributed GPS apertures (accounting for inaccuracies in the inter-nodal ranging measurements).
    • Investigate the improvement in the signal-to-interference-plus-noise ratio (SINR) that can be obtained over the upper hemisphere when a distributed GPS aperture is used for adaptive null steering to suppress RFI in GPS receivers. Obtain an upper bound for inter-node distances.
    • Based on the results of the above two investigations, develop approaches for combined beam pointing and null steering using distributed GPS apertures.

    Inter-Nodal Ranging Techniques

    In a wireless sensor network, an RF signal can be used to measure ranges between the nodes in various modes. For example, WLAN observes the RF signal strength, and UWB measures the time of arrival, time difference of arrival, or the angle of arrival. There are known challenges, for example, signal fading, interference or multipath, to address for a RF-based technique to reliably serve as internodal ranging method.

    Ranging Based on Optical Sensing. Inter-nodal range measurements can be also acquired by active and passive imaging sensors, such as laser and optical imaging sensors. Laser range finders that operate in the eye-safe spectrum range can provide direct range measurements, but the identification of the object is difficult. Thus, laser scanners are preferred, delivering 3D data at the sensor level. Using passive imagery, such as digital cameras, provides a 2D observation of the object space; more information is needed to recover 3D information; the most typical techniques is the use of stereo pairs or, more generally, multiple-image coverage. The laser has advantages over optical imagery as it preserves the 3D object shapes, though laser data is more subject to artifacts due to non-instantaneous image formation.

    In general, regardless whether 2D or 3D imagery is used, the challenge is to recognize the landmark under various conditions, such as occlusions and rotation of the objects, when the appearance of the landmark alternates and the reference point on the landmark needs to be accurately identified, to compute the range to the reference point with sufficient accuracy.

    Network Configuration

    Nodes in the ad hoc network must be localized and ordered considering conditions, such as type of sensors on the node (grade of the IMU), anti-jamming capability, positional accuracy, accuracy of inter-nodal ranging technique, geometric configuration, computational cost requirements, and so on. There are two primary types of network configurations used in collaborative navigation: centralized and distributed.

    • Centralized configuration is based on the concept of server/master and client nodes.
    • Distributed configuration refers to the case where nodes in the network can be configured without a master node, that is, each node can be considered equal with respect to other nodes.

    Sensor Integration

    The selection of data integration method is an important task; it should focus on arriving at an optimal solution not only in terms of the accuracy but also taking the computational burden into account. The two primary options are centralized and decentralized extended Kalman filter (EKF).

    • Centralized filter (CF) represents globally optimal estimation accuracy for the implemented system models.
    • Decentralized filter (DF) is based on a collection of local filters whose solutions can be combined by a single master filter. DFs can be further categorized based on information-sharing principles and implementation modes.

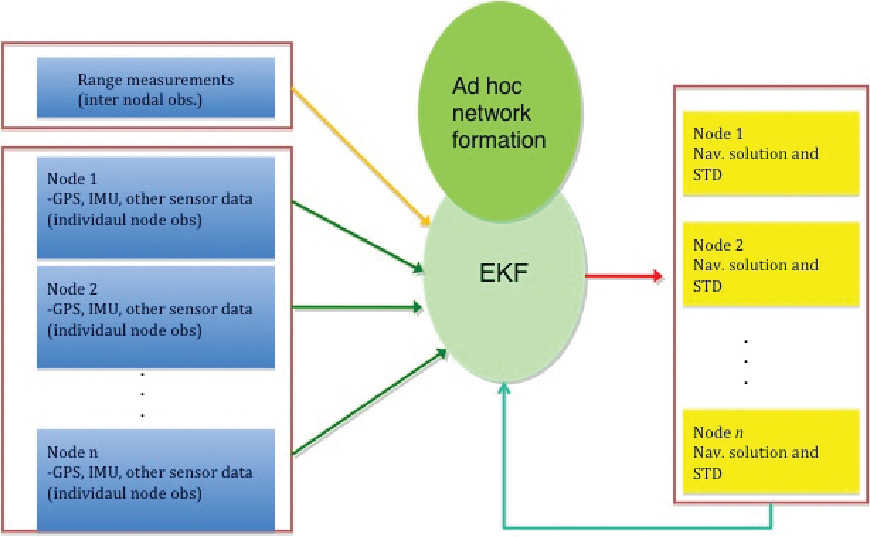
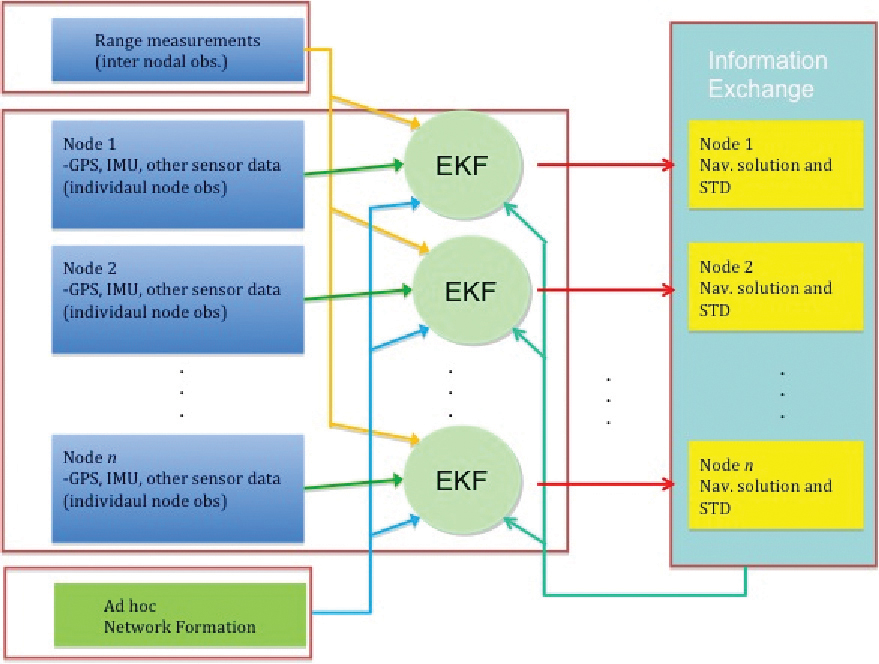
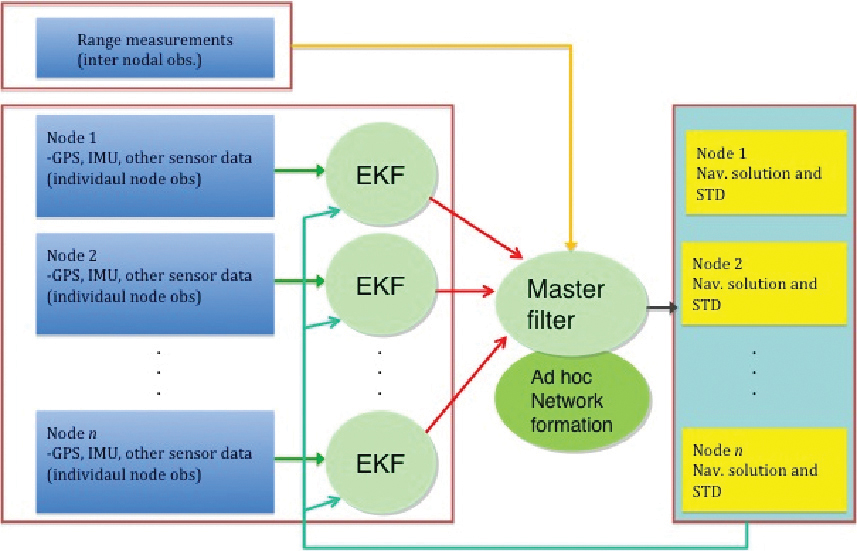
    Centralized, Decentralized EKF. These two methods can provide comparable results, with similar computational costs for networks up to 30 nodes. Figures 3–5 describe example architectures of centralized/decentralized EKF algorithms.

    In Figure 3, all measurements collected at the nodes and the inter-nodal range measurements are processed by a single centralized EKF. Figures 4 and 5 illustrate the decentralized EKF with the primary difference between them being in the methods of applying the inter-nodal range measurements. The range measurements are integrated with the observations of each node by separate EKF per node in Figure 4, while Figure 5 applies the master filter to integrate the range measurements with the EKF results of all participating nodes.

    FIGURE 3. Centralized extended Kalman filter.
    FIGURE 3. Centralized extended Kalman filter.
     FIGURE 4. Decentralized EKF, option 1.
    FIGURE 4. Decentralized EKF, option 1.
     FIGURE 5. Decentralized EKF, option 2.
    FIGURE 5. Decentralized EKF, option 2.

    Performance Evaluation

    To provide a preliminary performance evaluation of an example network operating in collaborative mode, simulated data sets and actual field data were used. Figure 6 illustrates the field test configuration, showing three types of nodes, whose trajectories were generated and analyzed.

     FIGURE 6. Collaborative navigation field test configuration.
    FIGURE 6. Collaborative navigation field test configuration.

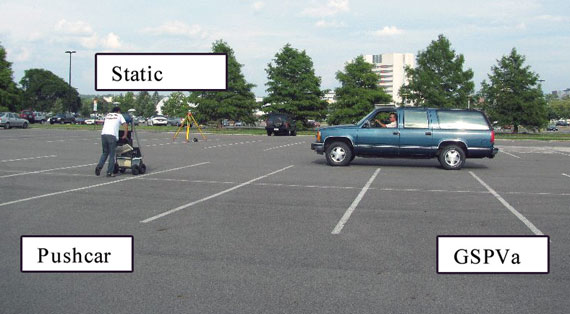
    Nodes A1, A2, and A3 were equipped with GPS and tactical grade IMU, node B1 was equipped with GPS and a consumer grade IMU, and node C1 was equipped with a consumer grade IMU only. The following assumptions were used: all nodes were able to communicate; all sensor nodes were time-synchronized; nodal range measurements were simulated from GPS coordinates of all nodes; and the accuracy of GPS position solution was 1–2 meters/coordinate (1s); the accuracy of inter-nodal range measurements was 0.1meters (1s); all measurements were available at 1 Hz rate; the distances between nodes varied from 7 to 70 meters.

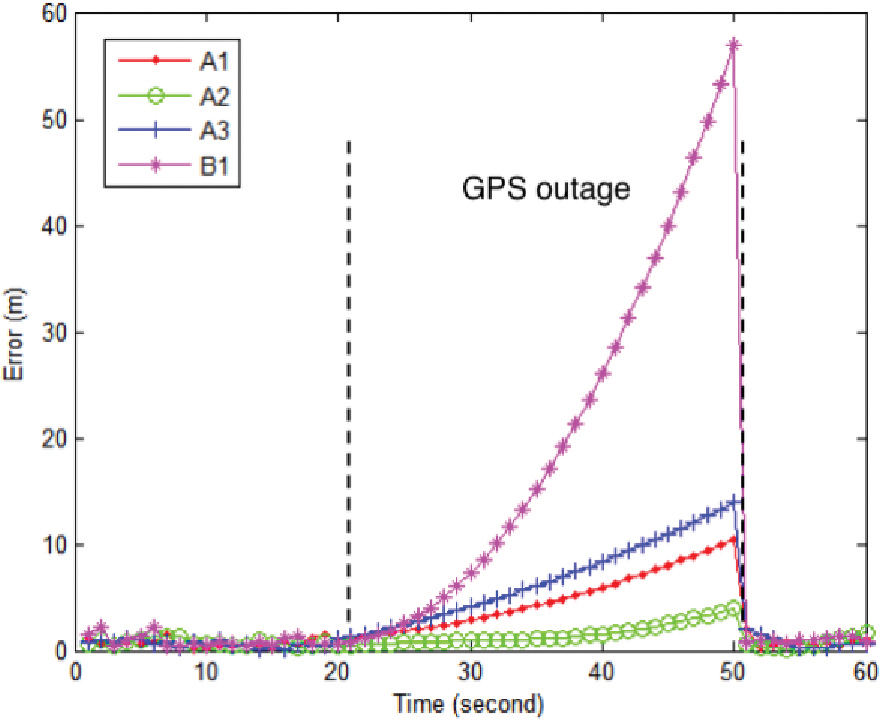
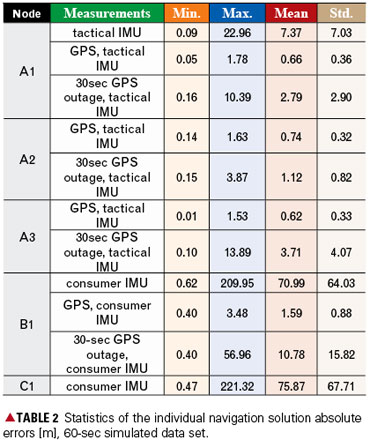
    Individual Navigation Solution. To generate the navigation solution for specific nodes, either IMU or GPS measurements or both were used. Since the reference trajectory was known, the absolute value of the differences between the navigation solution (trajectory) and the reference trajectory (ground truth) were considered as the navigation solution error. Figure 7 illustrates the absolute position error for the sample of 60 seconds of simulated data, with a 30-second GPS outage for nodes A1, A2, A3 and B1 (node C1 is not shown, as its error in the end of the test period was substantially bigger than that of the remaining nodes. Table 2 shows the statistics of the errors of each individual node’s trajectory for different sensor configurations.

     FIGURE 7. GPS/IMU positioning error for A1, A2, A3, B1 (includes a 30-second GPS outage.)
    FIGURE 7. GPS/IMU positioning error for A1, A2, A3, B1 (includes a 30-second GPS outage.)

    Table-2

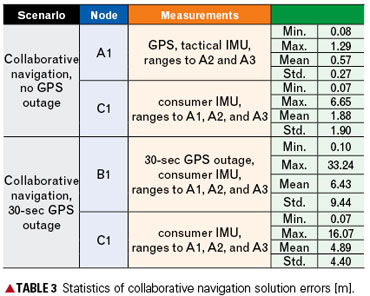
    Collaborative Solution. In this example, collaborative navigation is implemented after acquiring the individual navigation solution of each node, which was estimated with the local sensor measurements. The collaborative navigation solution is formed by integrating the inter-nodal range measurements to other nodes in a decentralized Kalman filter, which is referred to as “loose coupling of inter-nodal range measurements.” The test results of different scenarios are listed in Table 3. For cases labeled “30-sec GPS outage,” the GPS outage is assumed at all nodes that are equipped with GPS. The results listed in Table 3 indicate a clear advantage of collaborative navigation for nodes with tactical and consumer grade IMUs, particularly during GPS outages. When GPS is available (see, for example, node A1) the individual and collaborative solutions are of comparable accuracy.

    Table-3

    The next experiment used tight coupling of inter-nodal range measurements at each node’s EKF in order to calibrate observable  IMU errors even during GPS outages. In addition, varying numbers of master nodes are considered in this example. The tested data set was 600 seconds long, with repeated simulated 60-second GPS gaps, separated by 10-second periods of signal availability. The inter-nodal ranges were ~20 meters.

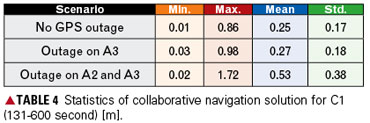
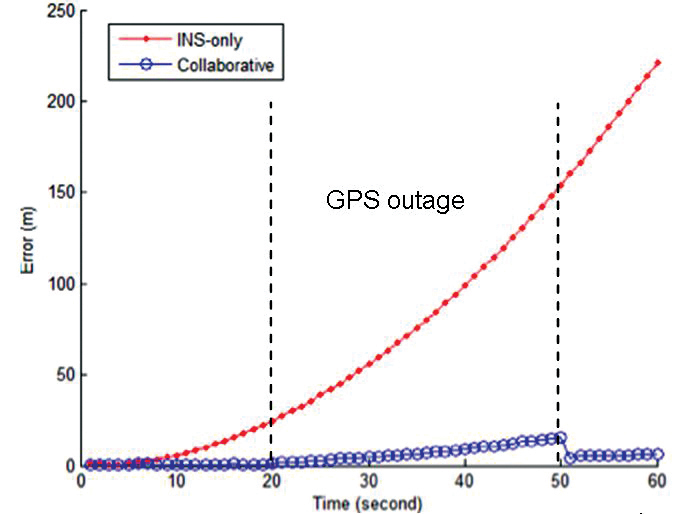
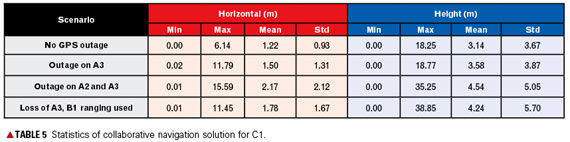
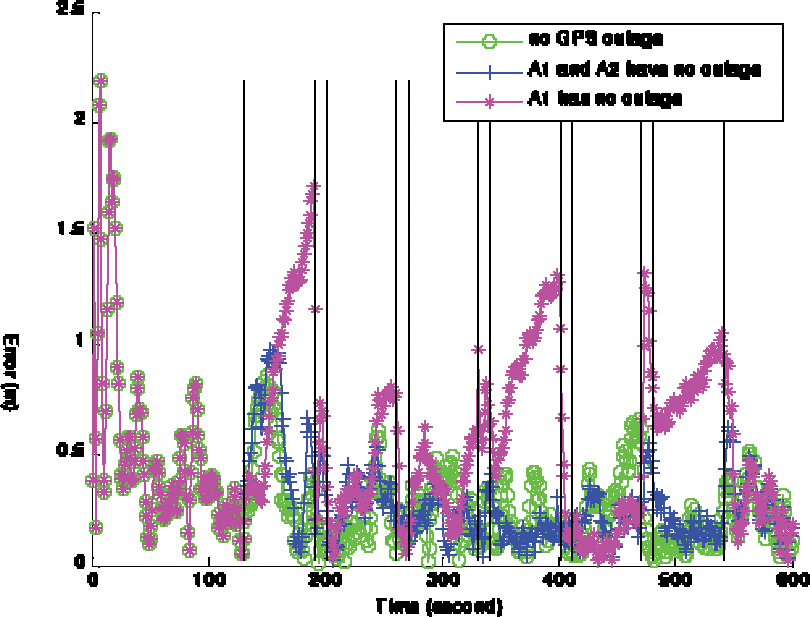
    Table 4 and Figure 8 summarize the navigation solution errors for collaborative solution of node C1 equipped with consumer grade IMU only, supported by varying quality other nodes. The error of the individual solution for this node in the end of the 600-second period reach nearly 250 kilometers (2D). Even for the case with a single anchor node (A1), the accuracy of the 2D solution is always better than 2 meters. Another 900-second experimental data with repeated GPS 60-second gaps on B1 node was analyzed with inter-nodal ranging up to 150 meters. Table 5 summarizes the results for C1 node.

    Table-4

     FIGURE 8. Absolute error for IMU-only and collaborative navigation solutions of C1 (GPS outage.)
    FIGURE 8. Absolute error for IMU-only and collaborative navigation solutions of C1 (GPS outage.)

    Table-5

    Future Work

    Collaborative navigation in decentralized loose integration mode improves the accuracy of a user with consumer grade IMU from several hundreds of meters (2D) to ~16 m (max) for a 30-s GPS gap, depending on the number of inter-nodal ranges and availability of GPS on other nodes. For a platform with GPS and consumer grade IMU (node B1) the improvement is from a few tens of meters to below 10 m.

    Better results were obtained when tight integration mode was applied, that is, inter-nodal range measurements were included directly in each EKF that handles measurement data collected by each individual node (architecture shown in Figure 4). For repeated 60-second GPS gaps, separated by 10-second signal availability, collaborative navigation maintains the accuracy at ~1–2 meter level for entire 600 s tested for nodes C1 and B1.

    Even though the preliminary simulation results are promising, more extended dynamic models and operational scenarios should be tested. Moreover, it is necessary to test the decentralized scenarios 1 and 2 (Figures 4–5) and then compare them with the centralized integration model shown in Figure 3. Ad hoc network formation algorithm should be further investigated.

     FIGURE 9. Absolute errors in collaborative navigation solutions of C1.
    FIGURE 9. Absolute errors in collaborative navigation solutions of C1.

    The primary challenges for future research are:

    • Assure anti-jamming protection for master nodes to be effective in challenged EM environments. These nodes can have stand alone anti-jamming protection system, or can use the signals received by antennas at various nodes for nulling the interfering signals.
    • Since network of GPS users, represents a distributed antenna aperture with large inter-element spacing, it can be used for nulling the interfering signals. However, the main challenge is to develop approaches for combined beam pointing and null steering using distributed GPS apertures.
    • Formulate a methodology to integrate sensory data for various nodes to obtain a joint navigation solution.
    • Obtain reliable range measurements between nodes (including longer inter-nodal distances).
    • Assess limitations of inter-nodal communication (RF signal strength).
    • Assure time synchronization between sensors and nodes.
    • Assess computational burden for the real time application.

    Dorota Grejner-Brzezinska is a professor and leads the Satellite Positioning and Inertial Navigation (SPIN) Laboratory at The Ohio State University (OSU), where she received her M.S. and Ph.D. in geodetic science. 
Charles Toth is a senior research scientist at OSU’s Center for Mapping. He received a Ph.D. in electrical engineering and geoinformation sciences from the Technical University of Budapest, Hungary.
Inder Jeet Gupta is a research professor in the Electrical and Computer Engineering Department of OSU. He received a Ph.D. in electrical engineering from OSU.
Leilei Li is a visiting graduate student at SPIN Lab at OSU.
Xiankun Wang is a Ph.D. candidate in geodetic science at OSU


  • Are You a Professional? Follow-up Letters and Using GIS for Commercial Real Estate Market Research

    I’m happy that last week’s article titled “Are You a Professional?” evoked responses from readers. I thought I’d share a couple of the responses I received. Also, I’ve included a good piece on using GIS for commercial real estate market research.


    "Are You a Professional?" letter to the editor from an independent GIS consultant:


    A comment on your piece on professional. I have generally thought of professional as a simple English word that contrasts with unprofessional, and that’s what I think you were saying, too. Only when I started working with people who have to be registered and licensed did I come to understand that some people associate being professional with being registered and/or licensed.

    Part of the confusion may be the English language: the words profession and professional sound very related. I grew up with the idea that a profession is something requiring special education and training, and the examples were always doctors and lawyers and teachers and ministers. By this definition, house painting could be a profession for someone who applies effort to learning about all of the different products and their uses and when they will fail and so on.

    Wikipedia gives this: "A profession is a vocation founded upon specialised educational training, the purpose of which is to supply disinterested counsel and service to others, for a direct and definite compensation, wholly apart from expectation of other business gain."

    That part about disinterested counsel could be an important piece of the confusion/distinction/pride?


    "Are You a Professional?" letter to the editor from a state government GIS Specialist:


    In response to your article "Are You a Professional?" I would like to note that I work in state government.  In civil service we have "professional" working titles and "secretarial" working titles. So, by default, I am considered a professional because of my particular title — which is a GIS Specialist.  But personally, I feel that there is a difference between conducting oneself as "professional", and actually being a "professional." If you conduct yourself as a professional, using the word as an adverb, you could be considered as such, in any job you hold. There is a professional manner of dress and conduct required to elicit respect from both your colleagues, and your clientele. However, when using the word as a noun, a professional used to imply, though perhaps not by official definition, that a person had an advanced education, or extensive experience, to some degree. They may not hold a PhD, but they would probably hold some type of degree, or possess extensive years of service in a particular field. I have both a degree in Graphic Design and almost 20 years of experience in the mapping industry, so I feel I am a professional for a multitude of reasons (none of which involve salary, as that is really negligible at best).
     
    Also, I can completely understand where Gretchen Peterson is coming from in terms of her issues with map design, because I have had similar moments of exasperation at the poor design aspects in maps containing very complex datasets.   Having experience in both the design and the analytical aspects of mapping, I have a better understanding of both areas.  And although I consider myself a professional, I would not consider myself an expert of either.  I have created maps since the days of scribe coat and Leroy lettering guides. I have remained in the field through the various computerized incarnations of digital mapping, including command line driven Sun Microstations, to the current Windows driven applications we have today. One thing that did remain consistent through it all, was the aspect of map composition and design, which is very often overlooked. I feel some type of graphic design courses should be part of a required curriculum for a Cartography, or GIS major, at any university. Or, at the very least, as an elective listed along with the course of study.  Another frustration I have with the industry is the lack of understanding, of both the technology and map design, on the part of the clients that require the work.  There are those that only worry about the "eye candy" factors without understanding the work involved in the actual data.  And there are those that don’t care if a map is almost illegible, because their main concern is the content of the data, as opposed to its visual interpretation.   A person working in this industry should really be able to wear a variety of hats in order to completely convey their intentions to an audience with any type of data.  It is necessary to understand both your medium, and your audience, to achieve the most understandable and artistically rendered presentation of such scientific information.  It’s a true mix of science and art, and quite often grossly misunderstood.


    Following is a short piece from Esri writer Karen Richardson. I first met Karen at Esri’s Redlands office in the mid-90’s. When discussing the issue of position accuracy with land surveyors, I often use the commercial real estate example to illustrate how GIS can be a powerful tool even if the spatial accuracy is not within a centimeter, or even a meter, or even five meters.

    Using GIS to Improve Market Research in Commercial Real Estate

    Edens & Avant owns, operates, and develops community-oriented shopping centers in primary markets throughout the East Coast. More than 130 centers in 14 states make up its portfolio. The company’s clients include regional and national retailers such as Fresh Market, Whole Foods, Publix, Starbucks, and Target. The success of the company’s shopping centers is based on generating the best mix of retailers and creating high-profile developments that are optimally aligned with neighborhood need and market opportunity. Edens & Avant is headquartered in Columbia, South Carolina, and has regional headquarters in Boston, Massachusetts; Washington, D.C.; Atlanta, Georgia; and Miami, Florida.

    Seeing a Place through Data

    Edens & Avant required a system to research markets and locations as well as a platform to quickly market that information to prospective retailers. Whether a retailer is looking to open a new store, add a second store, or move from across town, the company has to be ready with a strong case for the retailer to move into an existing shopping center or a new development. Purchasing one-off reports to research each shopping center becomes inefficient when dealing with hundreds of locations that have rapidly changing information like demographic data.

    In addition, instead of banking on the promise of growth driven by the housing boom—the standard model a few years ago—developers must now develop projections based on less robust growth and more conservative economic projections. "Healthy shopping centers are the ones that are located in markets with a diverse workforce and good balance of daytime-to-household population," says David Beitz, director of geographic information systems (GIS), Edens & Avant. As a result, the company needs to analyze, aggregate, and display accurate demographic information on a daily basis.

    Use the Find Similar feature to identify new markets
    that are similar to markets in which retailers are already successfully operating

    Better Decisions through Mapping

    Edens & Avant uses Esri Business Analyst software on the desktop and online to help its clients make the most informed decisions. Clients can see and understand all information available for each shopping center location, including address, major roads, competition, population density, and growth. Business Analyst Online (BAO) is used to generate a customized six-page report annually for each shopping center that is then used by investment leasing and development group agents so they can better visualize and understand their markets. The software helps identify new markets that are similar to those in which the retailers are already successfully operating. If staff members need customized reports or maps, they can request them from the GIS group.

    Integration with Bing Maps provides monthly updates to aerial, road, and hybrid (aerial with labels) maps. "Using Business Analyst and Bing Maps, we are able to find locations fast," says Beitz. "Being able to view aerial images allows us to give a better context to our clients about location. This is particularly helpful when looking at larger areas."

    The company looks carefully at optimizing its shopping center portfolio by selling properties in secondary and tertiary markets and buying properties in primary markets with dense populations in core-based statistical areas (CBSAs). Business Analyst is used to look at daytime population, income changes, and population changes, among other information. "It is very important to know the demographics in order to find areas that will perform best in this new economic climate," says Beitz.

    Imagery combined with GIS software and other data make it easier to find the best store placement for retailers

    Combining city data with updated demographic data ensures Edens & Avant has the most current information for their clients

    Results

    Edens & Avant can now serve its clients’ needs internally without outsourcing to third parties. They can research markets and assist in quickly leasing space by providing spatial information via maps and reports that uniquely characterize neighborhoods and are specific to each retailer. The ability to combine city building permit data ensures that Edens & Avant has the most current information for its clients. As a result, two planned grocery-anchored shopping centers are going forward in areas where population doubled even though residential construction recently slowed down. Being able to find and track this growth with Business Analyst allowed the company to minimize the carry time of the land and provide the shopping center sites based on the retailers’ timelines. Concludes Beitz, "Without the information to support these decisions and an accurate and appropriate way to communicate it, these projects wouldn’t have been as successful."

    Karen Richardson of Redlands, California, is a writer for Esri.


    Thanks, and see you next week.

    Follow me on Twitter at http://twitter.com/GPSGIS_Eric

  • GPS World: 20 Years Young, 1990-2010

    1990cv  1994cv  1998cv
    Covers from 1990, 1994, and 1998.

    Two Decades of GNSS Products

    Question: How has your product and services mix changed, with the evolution of GNSS technology and users, since 1990 (or since your company was founded, or entered the GNSS market)?

    Hemisphere GPS replies:

    Like GPS World, Hemisphere GPS is proud to be celebrating our 20th anniversary in 2010. Over the past 20 years, our products have evolved, and continue to evolve, from a focus on providing positioning hardware to providing complete machine-control solutions as well as related services and applications. The evolution of GNSS technology has allowed us to create a more sophisticated and more accurate product line. We have been fortunate over this period to expand our market share in a variety of new industries. As GNSS technology matures, we are expanding our sales globally by servicing existing markets and finding new markets for our products.

    Spirent Federal replies:

    Spirent’s first simulator contracts were for GPS L1/L2 systems. During the 1990s, most customers were interested in these two GPS frequencies, often including classified P(Y) code simulation capability. GPS modernization is a major change that continues to shape the industry today. Spirent was first to launch GPS L2C, GPS L5, and M-code test systems into the market and developed SAASM-capable simulation systems for Precise Positioning Service (PPS) receiver testing. Growing concerns about RF interference and anti-jamming have led to Spirent GPS/inertial test interfaces and the development of CRPA test systems for comprehensive wavefront testing.

    To enable testing of consumer GPS, Spirent developed a range of GPS L1 C/A code simulators which went on to sell widely to a whole new group of customers. Spirent delivered GPS plus GLONASS simulation during the 1990s. Today, with a nearly full GLONASS constellation and confidence building in Galileo again, many companies are looking to improve performance through multi-GNSS-capable receivers.

    Rakon replies:

    Rakon started supplying the GPS market back in 1990 with 1 ppm TCXOs that were about 11.7 2 18.3 mm in size. At the time they were the smallest on the market, hand assembled, and orders were for 100,000 units per year. These larger discrete products sold between US$30- $50 per unit. In 2002 Rakon introduced the first 0.5 ppm TCXO in a 5 2 3.2 mm surface-mount package, and since then the market for PND and mobile phones has really taken off. Today the market is 100s of millions of units a year — and this is still growing fast. The products are down to 2 2 1.6 mm in size, five times the performance and a fraction of the cost they were back in 1990 (now under US$1 each).

    At Rakon we’ve realized that GPS needs more than just headline frequency stability and have built an entire bespoke manufacturing process that targets the parameters that GPS is sensitive to. The mobile phone environment GPS needs to operate in today is extremely challenging. Rakon has been developing new designs in high-stability TCXO technology, to continue to develop cost-reducing solutions with unmatched performance.


    Special Section Sponsors

    Sponsors of this special section commemorating the 20th anniversary of GPS World publication also include CAST Navigation and ITT. The magazine thanks all advertisers over the years for their support in relaying the latest technical, system, and business news to the marketplace. GPS World reaches 133,152 core buyers across the GPS World brand: print magazine, e-mail newsletters, website, webinars, and social media.


    2002cv  2004cv  2008cv
    Covers from 2002, 2004, and 2008.

    Two Decades of Innovation

    Question: What is the most significant innovation your company has made over the last 20 years, and how does it relate to a development in GNSS technology or market?

    Rakon replies:

    Rakon was the first to develop the smallest 1 ppm TCXO in 1990 and led the way again in 2002 with the first 0.5 ppm TCXO. Rakon convinced the GPS chipset companies on the advantages of this level of stability while still remaining cost competitive. Today 0.5 ppm is now industry standard.

    Spirent Federal replies:

    Spirent has always been engaged in research and development to meet the growing user demand and provide new solutions for the latest requirements. The last five years alone have seen many significant innovations. In 2006, Spirent was awarded a contract to support the in orbit validation phase of the Galileo project. Test signals were needed to exercise the receivers for the Galileo Ground Sensor Stations and the initial “Test User Segment” receivers. Spirent developed Galileo simulators that could accurately simulate GPS with Galileo in a wide range of conditions, including error states.

    In 2007, Spirent Federal won a contract to supply SDS M-code simulation systems to Rockwell Collins in support of its MUE contract with the GPS Wing. In 2008, for NASA’s Orion project, Honeywell selected a Spirent GPS/inertial simulator to emulate inertial sensor output while concurrently simulating GPS RF signals. Additionally, Spirent brought the first GPS/GLONASS/Galileo/QZSS simulator to the market and developed a CRPA test system recently selected by Rockwell Collins for comprehensive wavefront testing.

    Hemisphere GPS replies:

    In 2000, we launched the Outback S guidance system for agriculture. Outback S provided farmers visual guidance through a light-bar style system. At the time, GPS guidance in agriculture was in the infancy stage and due to its high cost was only accessible to a small number of users. Outback S brought GPS-based guidance to the agriculture market at a new price point and with a simple, intuitive user experience that appealed to the mainstream farmer. By the end of 2001, Outback was the number-one selling GPS guidance system for agriculture. We have since expanded on this innovation to include affordable auto-steering and continue to take pride in being “The leader in performance and value.” Today, we continue this value for performance legacy with our newest product, Outback eDriveX, which provides the highest accuracy steering available in the market at very compelling value.

    Two Decades of Eager Users

    Question: How have your customers/users developed or adapted over the last 20 years, as GNSS technology has developed? Or, have you changed what customers/users you sell to?

    Spirent Federal replies:

    Traditional users of GPS have developed to take advantage of new opportunities offered by improved and new signals, evolving technology, and research findings. The focus has shifted from getting receivers to navigate, to improving performance, systems integration, and user experience. Resilience has been a key focus for many users, who want to have not only high availability but also position information that they can trust.

    In 1990 there were very few users of GNSS. Today GNSS is close to “the fifth utility,” with near ubiquitous deployment in vehicles in some countries and also increasingly in mobile phones. GNSS is used in many ways, including in innovative and unforeseen applications. Just one example is the possible use of GNSS to determine driving dynamics so that insurance premiums for more careful drivers can be set lowest!

    Rakon replies:

    Initially Rakon’s customers were involved mainly in marine, military, surveying, and agriculture. GNSS is increasingly becoming part of our modern-day infrastructure and services. Positioning capability is constantly being designed into an extending range of mass marketed consumer applications. Today we have many PND customers and those making products with GPS capability such as in mobile and smartphones and telecommunications. Customers have disappeared and many have changed significantly as the market has evolved; however, a core group has been with us since they started.

    Hemisphere GPS replies:

    In the past, the majority of our customers and users were very technically sophisticated. They were often educated in the field and demanded products solely based on position accuracy. Over time, our users have come to demand much more from our products and GNSS technology in general. Advancements in technology have also created a new category of customer who may be less technically sophisticated with the technology but who are looking for simplified solutions to complex problems. This has led us to focus our product development on more complete solutions that meet specific applications.

    About This Magazine

    Question: In your view, how has GPS World changed to reflect developments in the marketplace, the technology, customers’ needs, and your marketing needs?

    Spirent Federal replies:

    GPS World has been a valued companion for those involved in GNSS technology development. Many in the industry are deeply involved in a particular aspect of GNSS technology and find the broad, accessible perspective offered by GPS World very valuable. Many will remember reading about new signal performance first in GPS World — the first GIOVE Galileo signals from space and new Compass signals, for example. Key themes have also included vulnerability of the GNSS signals, from the Volpe Report through to analysis of the recent SVN-49 issues.

    Hemisphere GPS replies:

    GPS World has done a fantastic job in highlighting the evolution from GNSS technology to the myriad of both consumer and industrial applications the technology now enables. The publications are timely and consistently produce a credible resource for industry professionals. From a marketing perspective, GPS World’s expansion into online media has broadened its scope and circulation.

    Rakon replies:

    Originally the publication focused on the U.S. Global Positioning System. With the advent of others such as Galileo, GLONASS, and Compass, the publication has evolved to cover all GNSS systems.

  • The System: Three’s the Challenge

    A Close Look at GPS SVN62 Triple-Frequency Signal Combinations Finds Carrier-Phase Variations on the New L5

    By Oliver Montenbruck, André Hauschild (DLR/German Space Operations Center), Peter Steigenberger (Technische Universität München), and Richard B. Langley (University of New Brunswick)

    The recently launched Block IIF satellite (SVN62/PRN25) is the first of a new generation of GPS satellites designed to transmit ranging signals for civil users on three frequencies: the C/A-code on L1 at 1575.42 MHz, the L2C-code on L2 at 1227.60 MHz, and the I5/IQ codes on L5 at 1176.45 MHz. Unlike L2, the L5 signal is located inside the protected Aeronautical Radionavigation Services (ARNS) band, which makes it specifically useful for safety critical aviation applications. In combination with the legacy L1 signal, civil aviation users can now perform ionospheric corrections without referring to the L2C signal. Compared to L2C, the new L5 signal offers a much higher chipping rate (the same as the encrypted P-code signal) of 10.23 MHz, which promises a lower ranging noise and better multipath resistance. L5 signals have already been transmitted for some time by the geostationary satellites of the United States’ Wide Area Augmentation System (WAAS) and are now about to become an integral part of the GPS constellation.

    Following a short test transmission on June 17, 2010, the L5 signal was continuously activated on the morning of June 28. According to GPS officials, the checkout of the satellite is proceeding nominally and all signals have been found to fully comply with specifications. This will allow the satellite to be set healthy as soon as all commissioning tasks have been completed.

    Scientists have long discussed the potential of new signals for multi-frequency, multi-GNSS applications, and expresed a great interest in signal combinations, particularly those of carrier-phase measurements, involving all three frequencies simultaneously. The use of triple-frequency combinations has, for example, been demonstrated to be of great interest for ambiguity resolution in precise carrier-phase-based positioning, for receiver autonomous integrity monitoring, and for ionospheric research (see the articles in Further Reading).

    In consideration of the multitude of proposed applications for triple-frequency combinations, we took a close look at the quality of the new GPS L5 carrier-phase signal. For this purpose, we made use of measurements from the COoperative Network for GIOVE Observation (CONGO), jointly established by the German Federal Agency for Cartography and Geodesy (BKG) and the German Aerospace Center (DLR). CONGO is the first network of multi-constellation, multi-frequency GNSS receivers offering worldwide tracking of the SVN62 space vehicle on all frequencies (see Table 1).

    Table 1. Subset of CONGO stations used for triple-frequency tracking of the new Block IIF satellite.
    Table 1. Subset of CONGO stations used for triple-frequency tracking of the new Block IIF satellite.

    As suggested by Andrew Simsky (see Further Reading), the availability of carrier-phase measurements on three frequencies offers a particularly simple way to assess carrier-phase quality and multipath effects. By forming a linear combination

    E1a   (1)
    of the L1, L2, and L5 carrier-phase ranges with the additional conditions
    E2,
    a geometry- and ionosphere-free measurement is obtained, which reflects a weighted sum of the carrier-phase multipath and measurement noise on the individual frequencies. Here λ i with i = 1, 2, and 5, denotes the wavelength of the L1, L2, and L5 signals, respectively. Since the above conditions determine the factors α, β, and γ only up to an arbitrary scaling factor, we furthermore impose the normalizing conditionsE1.

    The latter condition ensures that the noise of the tri-carrier combination will match that of the individual carrier phases if the measurement noise is equal on all frequencies. As a result, we obtain the coefficients

    E3

    with
    E4    .
    Introducing the carrier wavelengths of the L1, L2, and L5 signals, the coefficients attain the valuesE5      (2)
    It can be recognized that the tri-carrier combination is dominated by the L2 and L5 signals due to the proximity of their respective frequencies. Noise and multipath errors of L2 and L5 measurements are thus most prominently seen in the resulting combination, whereas any L1 phase errors are strongly attenuated.

    A long pass of L1, L2, and L5 code and phase measurements from the new Block IIF satellite was recorded by the O’Higgins station of the CONGO network shortly after the activation of the L5 signal generator on June 28. The SVN62 satellite was tracked for more than 6 hours and achieved a peak elevation angle of more than 75° on this date.

    Figure 1 shows the resulting multipath combination computed from carrier-phase measurements of L1 C/A-code tracking, semi-codeless L2 P(Y) tracking (rather than L2C), and L5 I/Q tracking. The data have been leveled to a zero mean over the entire pass to remove the impact of the unknown carrier-phase ambiguities. Except at low elevation angles, near rise and set of the satellite where signal strengths are low, the tri-carrier combination shows a very low noise level that is consistent with the expected carrier-phase noise on all three frequencies. However, a pronounced long-term variation with a peak-to-peak amplitude of almost 20 centimeters may be recognized, which certainly comes as a big surprise and cannot be explained by local multipath. Frequency-dependent differences of the effective phase centers of the receiving or transmitting antennas can likewise be excluded, since these would result in a purely elevation-angle-dependent variation.

    FIGURE 1. Triple-frequency (M=0.142·L1-0.767·L2+0.626·L5) carrier-phase multipath combination for SVN62/PRN25 tracking from the OHIX0 station on June 28.
    FIGURE 1. Triple-frequency (M=0.142·L1-0.767·L2+0.626·L5) carrier-phase multipath combination for SVN62/PRN25 tracking from the OHIX0 station on June 28.

    Looking at the entire set of measurements from all available CONGO stations, we could rapidly recognize that the variation of the tri-carrier combination with time is essentially the same for all stations with a common visibility of the SVN62 space vehicle, irrespective of the employed receiver and antenna. This suggests the presence of time-varying inter-frequency biases in the L1, L2, and L5 carriers transmitted by SVN62.

    Thanks to the global distribution of the CONGO stations, the SVN62 space vehicle is always tracked by one or more stations, which enables a continuous monitoring of the L1/L2/L5 carrier-phase consistency. By adjusting the unknown offset of the tri-carrier combination for individual tracking arcs in such a way as to obtain a best match of consecutive and overlapping arcs, the variation can be traced over multiple days as shown in Figure 2. The graph shows a distinct orbital (that is, 12-hour) periodicity with a superimposed twice-per-revolution harmonic. In addition, a pronounced drift can be recognized for up to one day after activation of the L5 signal generator. Both observations suggest a temperature-dependent line bias in one or more carriers as a likely cause of the observed variation in the tri-carrier combination. (A line bias is a circuitry delay common in all observed satellites and is usually absorbed in the estimated clock offset.) However, an independent analysis of SVN62 temperature data from the onboard telemetry will be required to confirm the validity of this assumption. The space vehicle is in a deep eclipse orbit right now and therefore experiences substantial changes in its thermal conditions. However, the extreme points of the carrier-phase variation in Figure 2 are slightly shifted with respect to the local space vehicle noon (at 01:30 and 13:30 UTC) and the eclipse intervals (07:00–08:00 and 19:00–20:00 UTC).

    FIGURE 2. Triple-frequency carrier-phase combination (M=0.142·L1-0.767·L2+0.626·L5) for the first five days of L5 activation on SVN62. The curve has arbitrarily been shifted to obtain a near-zero mean during the final days of the entire arc.
    FIGURE 2. Triple-frequency carrier-phase combination (M=0.142·L1-0.767·L2+0.626·L5) for the first five days of L5 activation on SVN62. The curve has arbitrarily been shifted to obtain a near-zero mean during the final days of the entire arc.

    While the tri-carrier combination provides a very sensitive measurement for the analysis of differential delays between the individual carriers, it does not allow us to uniquely attribute the observed variations to one of the three signals. We therefore made use of code measurements (pseudoranges) to further investigate the consistency of specific sets of measurements. Since the observed variation of the tri-carrier combination exhibits an amplitude comparable to the noise level of the code measurements, a suitably chosen code-carrier combination can indeed help to identify which signal or signals are affected by line-bias variations. To this end, we consider a generalized form

    E6

    of the well-known code-multipath combination, in which we difference the code measurement Pi at frequency i with an ionosphere-corrected combination of carrier-phase ranges Lj and Lk at frequencies j and k. In so doing, we remove geometric contributions along with clock and atmospheric variations, leaving primarily code multipath, receiver noise, and any signal perturbation that is not coherent on the involved frequencies. In the traditional case of dual-frequency tracking, the frequency of one of the involved carrier-phase measurements is necessarily identical to that of the code measurements. With triple-frequency tracking, in contrast, we are free to consider a larger variety of combinations. For the analysis of the SVN62 signals, we have specifically evaluated the L5 code-multipath combination using (a) the L5 and L1 carrier phases

    E7

    and (b) the L2 and L1 carrier-phase measurements

    E8

    The results shown in FIGURE 3 reveal a dramatic difference, which clearly hints at the L5 carrier as the main source of the observed carrier-phase variations.

    FIGURE 3. L5 code-multipath combination formed with L1/L5 carrier-phase measurements (top) and with L1/L2 carrier-phase measurements (bottom). The figure is based on SVN62 tracking from the O’Higgins station and covers the same arc as considered in FIGURE 1.
    FIGURE 3. L5 code-multipath combination formed with L1/L5 carrier-phase measurements (top) and with L1/L2 carrier-phase measurements (bottom). The figure is based on SVN62 tracking from the O’Higgins station and covers the same arc as considered in FIGURE 1.

    In the first case, a variation close to that of Figure 1 is obtained, albeit with a 5–6 times larger amplitude that reflects the different weighting of the L5 carrier phase in the corresponding measurement combinations. A good consistency, in contrast, is obtained for the L5 code measurements when differenced against the ionosphere-corrected combination of L1 and L2 carrier-phase measurements.

    Overall, we may conclude that the L5 carrier of the SVN62 space vehicle exhibits quasi-periodic line-bias variations with an amplitude of about 10 centimeters in relation to the L1 and L2 carriers. The L5 code measurements, in contrast, appear to be consistent with both the code and phase measurements on L1 and L2 at the respective noise levels. Further observations at a later time will be required to see whether the observed amplitude of the L5 phase variation is specific to the current eclipse orbit and whether it will possibly become lower when a higher angle of the Sun with respect to the orbital plane (the so-called beta-angle) is achieved.

    What are the possible consequences of the L5 phase-bias variations for users of the new L5 signal? Evidently, new positioning services building on the L5 code measurements (and possible combinations) will not at all be affected! Even in the case of carrier-phase smoothing, the smoothing time scale will be much shorter than the periodicity of the carrier-phase bias variation. The L5 code measurement quality itself is well within the system specification and no concerns exist that would prevent the satellite from soon being declared healthy.

    With respect to carrier-phase-based positioning applications, it is important to note that the L5 line bias acts like an additional frequency-specific satellite-clock offset. This has, for example, been confirmed in preliminary tests of SVN62 orbit determination conducted by the Technische Universität München. Orbit solutions using L1 and L5 measurements from the CONGO network differed by typically 15 centimeters (3D root-mean-square error) from reference orbits obtained by the Center for Orbit Determination in Europe analysis center using the IGS L1/L2 receiver network. At the same time, however, the L1/L5-based clock solutions showed a periodic offset from the L1/L2-based values that reflects the same variations as the tri-carrier combination discussed above.

    As a common error for all receivers, the L5 line bias fully cancels in differential processing. Care must be taken though, that satellite clock offsets derived from L1/L2 carrier-phase observations cannot be employed for precise point positioning using L1/L5 measurements without explicit consideration of the inter-frequency carrier-phase bias. Likewise, efforts to correct second order ionospheric effects through the use of triple-frequency measurements are likely to suffer from an imperfect knowledge of the L5 bias and its variation with time.

    Whereas some of the proposed ideas for triple-frequency processing may be difficult to materialize at present, a better characterization of the SVN62 L5 signal will certainly help to exploit the available benefits of the new signal and to establish refined processing schemes for scientific and other demanding applications. A continued monitoring of the L5 line bias and its variation with time is therefore deemed necessary and should be supported by a large number of suitably equipped tri-band GNSS monitoring stations.

    — Oliver Montenbruck, Andre Hauschild (DLR/German Space Operations Center),
    Peter Steigenberger (Technische Universität München)
    Richard B. Langley (University of New Brunswick)

    Acknowledgment

    The authors are grateful to Tom Stansell and Col. David Goldstein from the GPS Wing for early discussions and their independent assessment and interpretation of the SVN62 triple-frequency carrier-phase data.

    Equipment

    The CONGO network makes use of Javad Triumph Delta-G2T/G3TH and Leica GRX1200+GNSS GNSS receivers for tracking GPS signals on the L1, L2, and L5 frequencies. The stations are equipped with Trimble Zephyr Geodetic II or Leica AX1203+GNSS and AR25R3 antennas.

    Further Reading

    “The WAAS L5 Signal: An Assessment of Its Behavior and Potential End Use,” by H. Rho and R.B. Langley in GPS World, Vol. 20, No. 5, May 2009, pp. 42–50.

    “Using Multi-Frequency for GPS Positioning and Receiver Autonomous Integrity Monitoring” by Y.-H. Tsai, F.-R. Chang, W.-C. Yang, and C.-L. Ma in Proceedings of the 2004 IEEE International Conference on Control Applications, Taipei, Taiwan, September 2–4, 2004, pp. 205–210.

    “Triple Frequency Ambiguity Resolution Using GPS/Galileo” by O. Julien, M.E. Cannon, P. Alves, and G. Lachapelle in European Journal of Navigation, Vol. 2, No. 2, May 2004, pp. 51–57.

    “Three’s the Charm — Triple Frequency Combinations in Future GNSS” by A. Simsky in Inside GNSS, Vol. 1, No. 5, July/August 2006, pp. 38–41.

    “Total Electron Content Monitoring Using Triple Frequency GNSS Data: A Three-Step Approach” by J. Spits and R. Warnant in Journal of Atmospheric and Solar-Terrestrial Physics, Vo. 70, No. 15, December 2008, pp. 1885–1893, doi:10.1016/j.jastp.2008.03.007.


  • How Flat Can You Incline?

    The field at Commonwealth Stadium in Edmonton, Alberta, recently received a CDN $2 million renovation. The old natural-grass field had become expensive to maintain properly, and the Grey Cup game, Canada’s Super Bowl, will be played at Commonwealth Stadium this year. The stage needed to be re-set.

    Renovation required total removal of the existing medium and subgrade materials to a 1.2-meter depth. Wilco Contractors Northwest replaced the subgrade to a planarity or flatness tolerance of 3 millimeters over a 3-meter length. To achieve this precision, Wilco used a machine automation system on a Volvo G-960 motor grader fitted with a GPS receiver, and base station nearby. A second grader carried a robotic total station.

    “We probably have a quarter-million dollars invested in this,” said Wilco President Art Maat. “The machine-control equipment pays for itself on an annual basis. It enables us to construct projects to tolerances that other contractors cannot match, even though they have the same big iron capabilities we do.”

    Work began with removal of existing soil mixes, drainage rock, and subgrade clay. A bulldozer and the two motorgraders graded the subgrade to a 0.5 percent slope on both sides of the field’s center spine. The work included the D-shaped zone behind each goal post, created by a running track encircling the field. In all areas, the slope must be constant. “The problem is, how do you grade that half-circle?” said Maat. “Grader operators and surveyors want to work in straight lines or on rectangular grids. We use the geo-tracker, or robotic total station, to control the grader blade three-dimensionally. It is one step more accurate than a GPS system.”

    Using the robotic total station involves entering a digital terrain model, called a TIN-file, into the grader’s onboard computer. The grader is fitted with a mast and prism, which has a fixed relation to the grader blade. The robotic total station can see the prism, read its 3D location, and communicate it back to the grader. The computer processes the differences between the actual blade location and the digital terrain model to control the blade.

    The GPS-equipped grader did the rough grading at 20-millimeter accuracy, and the prism-equipped grader handled the fine grading at sub-centimeter accuracy. With final subgrade complete, Wilco dug trenches to install a drainage system, covered with a geotextile. Working in four lifts of 300 millimeters each, Wilco filled the excavation with coal bottom ash, a gritty product like playground sand. “We took the TIN file and offset the elevation by 300 millimeters at a time.”

    Savings. The machine-control equipment saved Wilco $15,000–$20,000 on surveying, for 100 hours or more at $150 an hour for a crew. “The systems make our equipment 25 percent more efficient on low-tolerance sites such as fields and running tracks where grades are critical,” Maat added.

    To test planarity, Wilco stretched a stringline over a 3-meter distance at many points on the field and measured with a Canadian dollar coin, a looney. If they could fit a couple of loonies under the string, they had found a low spot. If they could fit only one, the 3-millimeter tolerance had been met. “Our feedback from the consultants was that they had never seen a field prepared this well, with very little adjustment required. The slope of the field had to be 0.25 percent from the centerline spine to the sides. And the slope of the D-shaped areas behind the goal posts was exactly the same.”

    Manufacturers

    Wilco uses a Leica PowerGrade GPS/GNSS receiver, Leica Redline base station, Redline Power Tracker robotic total station, and Geo-Tracker.


    Dan Brown is a freelance technical journalist.


  • Handling at the Limits: Robotic Racer Offers Help for Ordinary Drivers

    By Tyler Brown

    Learning how to control a car as a race driver does, at its very limits of handling, can ultimately assist ordinary drivers who enter a turn too quickly or are driving on a wet road and don’t realize when they need to brake. DGPS and inertial sensors drive feedback and feedforward speed controllers on a twisting test track to the top of Pikes Peak.

    Stanford professor Chris Gerdes and his Dynamic Design Lab have outfitted and trained a white Audi to roar up the Pikes Peak International Hill Climb, a 12.5-mile racecourse to the top of the 14,110-foot Rocky Mountain summit.

    Without a driver.

    Officially known as the Autonomous Audi TTS Pikes Peak, the car has been nicknamed Shelley by its crew, in honor of Michele Mouton, the first woman to win the Hill Climb, in 1984, also in an Audi.

    The team of graduate and Ph.D. students and Volkswagen’s Palo Alto research lab have spent two years conceptualizing and modifying the car to make the solo climb. They have just returned from tests of the car’s DGPS and other sensors on the course. International [human] racers competed on June 30, with the fastest just missing the course record of 10 minutes, 1.408 seconds, established in 2007, by a mere 10.082 seconds. That’s an average speed of 75 miles per hour over a course with 156 turns, many of them hairpins, an elevation gain of 4,721 feet, and both paved and gravel surfaces. Speeds at the Pikes Peak Hill Climb, often described by drivers as racing against the mountain more than other vehicles, top out around 165 miles per hour.

    Shelley, not specifically built as a racecar, does not have the horsepower to hit that speed, but she aims for respectable rates all the same. “We are ultimately going for the fastest time we can get in a TTS and hope to establish that range in September and shoot for it in 2011,” wrote Gerdes from the mountain.

    Safety the Goal. The team’s work is a variation on one theme: make Shelley drive faster, smarter — and safer.

    “We believe that if we can learn how to control a car at its very limits of handling,” Gerdes said, “then we can also help ordinary drivers who enter a turn too quickly or are driving on a wet road and don’t realize when they need to brake. That’s ultimately where we hope this goes: safety systems.”

    “Average drivers sometimes end up involved in road accidents due to their inability to control a vehicle at its limits,” Gerdes and Krisada “Mick” Kritayakirana wrote in a 2009 paper, from which the following results and figures are drawn, “yet racecar drivers routinely operate a vehicle at its limits without losing control. The difference could come from two key characteristics that racecar drivers have acquired.

    “First, a racecar driver has the ability to estimate the friction between the tire and the road surface. Second, a racecar driver can utilize all of the actuators to control the vehicle at its limits, such as using the throttle and brakes to steer the vehicle, which could be counterintuitive to a typical driver. If a controller could imitate a racecar driver, perhaps this same concept could be applied to a vehicle safety system to assist drivers when they are on the verge of losing control. The controller could utilize every actuator to assist the driver, and real-time friction estimation could help predict the control authority that each actuator has. The goal of this research is to create a controller that captures these two key characteristics of a racecar driver.”

    Feedforward, Feedback. Before entering a corner, a racecar driver anticipates the speed and steering angle that he or she would use. Similarly, in the Gerdes/Kritayakirana research, a feedforward controller is used to predict the speed and steering commands. While cornering, a racecar driver adjusts actuator commands (steering, throttle, and brake) to cope with any disturbances or driver’s perception mismatches (modeling errors). A feedback controller is designed to imitate a racecar driver making corrections during cornering. As a consequence, the desired steering and speed commands are calculated from the sum of feedforward and feedback controllers.


    Robustness Tests. At Stanford, preliminary testing of Shelley’s control systems on the student-built P1 by-wire research vehicle provided a proof of concept. As with Shelley, P1’s DGPS and inertial sensors determine path-tracking errors that can be used to implement the steering feedback controller. A large parking lot with gravel over asphalt provided the ideal proving grounds for these tests. The inconsistent surface provided varying friction in the range of 0.4 to 0.6 and therefore presented a control challenge. The steering control had to be robust enough to ensure that this variation did not result in instability and the vehicle spinning.

    The vehicle trajectory in Figure 1 shows performance of the steering feedback tested in isolation with an arbitrarily chosen constant accelerator input. Because the vehicle enters the curve much faster than the friction between the tire and the road can support, large deviations from the desired path (in this particular case, a maximum lateral error of 10.7 meters, and maximum heading error of 18.73 degrees) occur.

     Figure 1. Vehicle trajectory with feedback steering only.
    Figure 1. Vehicle trajectory with feedback steering only.

    Although it swings wide of the desired path, P1 remains stable and does not spin out. The ability to maintain control of the car even when there is a misjudgment in the friction conditions is vitally important to both the Pikes Peak climb and future safety systems.

    Demonstrating the robustness of the steering control both analytically and experimentally on P1 gave the team confidence to use it as a central part of Shelley’s control logic.

    Combined Controllers. The current control scheme running on Shelley adds the feedforward steering and both feedforward and feedback speed control elements to the simple steering controller demonstrated in Figure 1.

    This combination can track the desired path around the corner quite closely, as shown by the trajectory in Figure 2. This plot shows the performance on a rough dirt track with a friction coefficient again between 0.4 and 0.6 and therefore a maximum possible acceleration of between 4 and 6 meters/second2.

    Figure 2. Latest result of TTS on Santa Clara fairground track; arrows indicate amount of vehicle acceleration (in green) or braking (in red).
    Figure 2. Latest result of TTS on Santa Clara fairground track; arrows indicate amount of vehicle acceleration (in green) or braking (in red).
    Figure 3. g-g diagram plots longitudinal and lateral acceleration, from tests on a different track, with friction on this surface (.65) somewhat higher than discussed in the text (0.4–0.6).
    Figure 3. g-g diagram plots longitudinal and lateral acceleration, from tests on a different track, with friction on this surface (.65) somewhat higher than discussed in the text (0.4–0.6).

    To demonstrate that Shelley is operating at the limits of friction, a g-g diagram is depicted in Figure 3. These diagrams, which are typically used to evaluate racecar driver performance, plot the longitudinal and lateral acceleration of the vehicle. An expert driver will achieve the maximum possible longitudinal acceleration in braking and the maximum lateral acceleration in cornering.

    In transition between braking and cornering, the best drivers will use all available friction, giving the ideal curve a roughly circular shape. The g-g diagram for this test illustrates that Shelley continually operates at the limits of friction. As a result, the curve bears some resemblance to the behavior of an expert racecar driver. More precise comparisons with expert drivers driving the same course are planned for the future.

     Shelley at rest as crew prepares DGPS base station and checks onboard computer.
    Shelley at rest as crew prepares DGPS base station and checks onboard computer.

    A Rich Legacy

    Shelley follows in the tracks of other Stanford robot cars such Junior, an autonomous Volkswagen Passat. “Junior was a perceptual challenge,” Gerdes recalled. Junior and its predecessor Stanley, under the direction of Stanford professor Sebastian Thrun, were designed to perceive the environments around them, understand signs and recognize the driving situation of nearby vehicles, then logically respond to what they saw. Both competed in the Defense Advanced Research Projects Agency (DARPA) Grand Challenges.

    Stanley and Junior, while possessing a much higher level of autonomy than Shelley and able to handle a range of environments, crept along at speeds well below the average driver’s comfort level, and placed little emphasis on driving dynamics. Shelley is highly focused on the dynamics issue.

    “They’re all autonomous vehicles to some extent, but they have very different scopes, and I guess you could say, very different personalities as well,” Gerdes said.

    “Can we go around turns as fast as possible, brake at the last possible minute, and accelerate out as soon as we’re steering out of a turn?” Gerdes asked. This became the group’s goal for Shelley.

    Rami Hindiyeh had the task of crafting Shelley’s judgment. He writes software designed to mimic a rally car driver’s mind with a series of mathematical analyses that predict how the car should control itself in different situations. He looked at “ways to slide Shelley through turns like a rally car racer would.” Mick Kritayakirana is in charge of the autonomous racing controller to govern Shelley “at the limits, like racecar drivers race on the pavement.”

    The Audi TTS’s steering, brakes, gears, and throttle are all controlled electronically, so Shelley required few mechanical modifications to integrate her systems into a controller area network that allows the vehicle’s components to communicate. The network enables the team to individually switch each component from manual to automatic so the team can test its reliability.

    Shelley’s most critical components are GPS antennas and receivers coupled to an inertial system that determines speed and sideways motion. The INS controls the car’s direction during GPS signal interruptions, giving up to 200Hz updates on car position.

    While the combined effects of Shelley’s systems are complex, the computer in the trunk that processes the data isn’t any faster than one you could buy a decade ago. Most calculations are done separately within the GPS and in the vehicle electronics. “We don’t need a whole lot of computational power to run the driving and racing algorithms,” Gerdes said.

    “We have to spend a lot of time trying to make the car listen to what we command,” Kritayakirana added.

    The Pikes Peak course was plotted on a GPS map for the car to follow, and based on that information and how much friction the computer predicts, it has an idea of how fast it can take turns at different angles and with varying road surfaces. The computer refines its speed and steering with each test turn to figure out what Gerdes calls Shelley’s “braking point.”

    “When a human is driving a car and they see a turn coming up, they can, at a constant rate, so to speak, just try to turn the wheel towards that curve preemptively,” said team member David Hoffert. “And that works because roads are designed with certain mathematical geometric properties that if you do that, [you] follow the path.”

    As the team nears the finish line, members continue to closely collaborate with Volkswagen’s research group. They have weekly meetings “where we talk about our current status and evaluate the hardware and software,” said Marcial Hernandez, senior research engineer at Volkswagen. The team aims to have Shelley back on the mountain in September. “We’d really like to send the car pretty close to its capability, certainly much, much faster than people would be comfortable driving unless they were highly skilled racecar drivers,” Gerdes said.

    Pre-Race Tests

    The team’s trip to Pikes Peak in July enabled the group to experience the International Hill Climb and watch some of the best racers in the world tackle the mountain. Following the hill climb, the project team devoted a couple of days to gathering GPS data on Pikes Peak. This included scouting locations for base stations to broadcast DGPS corrections and determining the availability of corrections at different points along the highway. In addition, the team took measurements of the road boundaries and profiles for developing digital maps of the course.

    Line-of-sight issues for the GPS base stations and interference of other voice and DGPS users on the broadcast frequencies used by the team present challenges for racing on the mountain. The group made significant progress on these issues during the June experiments and has scheduled additional GPS testing for July. Travis Wolgram, a test engineer at the Association of American Railroads in Pueblo, Colorado, joined the group to discuss using the High Accuracy National DGPS system in future testing. With a prototype base station now operational at the Federal Railroad Administration’s Transportation Technology Center, 50 miles southeast of Pikes Peak, there is a unique opportunity to harness these corrections for the project.

    Shelley should return to Pikes Peak in September, with the goal of driving the entire course slowly and selected segments at full race speed. With proper analysis of this data during the winter months when snow is on the mountain, the team should be prepared to make a full run at race speed in 2011.

    Manufacturers

    The Autonomous Audi TTS Pikes Peak uses an Applanix POS LV420 GPS and inertial measurement unit, with OmniStar HP service for 10-centimeter or better accuracy, Trimble SPS851 GPS receiver for the base station, two Trimble HPB450 transmitters for RTK signal transmission from the base station, and a Pacific Crest ADL Vantage receiver in the vehicle to receive the RTK corrections.


    Tyler Brown is a Stanford undergraduate. An earlier version of this story appeared in the Stanford Daily; it has been updated and expanded here by the Dynamic Design Lab and GPS World staff.


  • Expert Advice: Remembering. And Resolving

    profile_shadow_mask

    By The Masked Engineer

    In a few weeks, we will again observe the tragic anniversary of the 9/11 attacks on the United States. This will mark nearly a full decade since that terrible day that changed the lives of people around the world, forever. Many will remember. Many will mourn. Many will work to ensure that such an event never again threatens any nation. That is a good thing.

    Few outside the position, navigation, and timing (PNT) community will also recall that the day before the 9/11 attacks, the U.S. government released a landmark document that described the vulnerabilities of services provided by GPS to disruption, whether by attack or inadvertent interference. The Department of Transportation Volpe Center’s GPS vulnerability assessment recommended that services utilizing GPS-provided PNT seek alternative sources of these services. What decisions and actions have the findings and recommendations of this report promoted? The answer is most disturbing.

    The U.S. government has sealed the fate of Loran-C and kept the decision on an enhanced Loran system (eLoran) in limbo for more than 10 years. The government has spent hundreds of thousands (if not millions) of dollars studying the problem over and over again and either ignoring or classifying the results. The Department of Homeland Security (DHS), a direct outcome of the 9/11 attacks, has done nothing to address the need for a national backup other than study and re-study the problem and disregard the findings and warnings of world-class PNT experts.

    On the positive side, a recent paper from the Federal Aviation Administration (FAA) attempts to address the problem by proposing to investigate alternative PNT (APNT). While the FAA does this under its Title 49 responsibility and authority to ensure the safety, security, and efficiency of our National Airspace System (NAS), and the alternatives it is looking at are certainly aviation-centric, it is admirable that somewhere in this government someone is finally moving forward to define and implement a real, operational PNT alternative to GNSS and its augmentations. [An abridgement of the FAA paper appeared in the July GPS World; the full paper is available here.]

    I applaud the FAA’s actions and only hope that bureaucrats and bureaucratic processes don’t penalize it for its efforts.

    But the question remains: When will a decision on the U.S. national PNT backup be made? The urgency of this issue can be highlighted by posing some simple questions about another current threat to the U.S. infrastructure and economy.

    To what extent are GNSS-provided PNT services being used to identify the amount and movement of the oil in the Gulf of Mexico? What level of information exactness/integrity would be lost if GNSS-provided PNT services were not available?

    Remember, not only navigation, but communications and surveillance rely on GNSS. See UK/Ireland General Lighthouse Authority’s report on GPS jammers and effects on maritime operations.

    To what extent are GNSS-provided PNT services being utilized by cleanup crews and other impact-mitigation services? How would the efficiency of the cleanup/mitigation activities be impeded if GNSS-provided services were not available?

    Finally, what is the opportunity cost of not having a national PNT backup? Why has this decision been so hard to make? One would intuit that it has encountered political obstacles, not scientific ones. What are they, exactly?

    While the FAA is doing what it must to ensure a safe, secure, and efficient national airspace, what about the rest of us? The boaters, the truckers, the farmers, the power transmission people, the telecom providers, the cell-phone users? The list goes on and on.

    It has been nine years. Why is this so hard?

    As we take time on September 11 to remember where we were when we heard the news, to mourn those lost, and to do, each in our our way, something to ensure that such a thing never happens again, we should also take time on September 10 to thank the folks at the Volpe Center for their important efforts. And we should try, each in our own way, to do something to ensure that the effects of a loss of GNSS-provided services will be once and for all properly mitigated.


    The masked engineer harbors strong convictions, matched by a desire to hold onto a day job.

  • INRIX Expands the Largest Traffic Network in Europe

    INRIX announced it has expanded its European real-time traffic coverage to 18 countries making it the largest traffic network in Europe. With the launch of real-time traffic information in Ireland, Hungary, Poland and Slovenia since February, INRIX traffic services now cover more than 1 million kilometers of motorways, city streets and secondary roads, throughout Europe — more than 2X the amount of real-time road coverage of its nearest competitor.

    “Whether driving across town or across borders, European customers uniquely benefit from INRIXs ability to reliably help drivers avoid traffic congestion wherever their travels take them,” said General Manager of INRIX Europe Dr. Hans-Hendrik Puvogel. “Through our expanded coverage, continuous technology innovation in support of standards like TPEG over IP, and growing customer base, we’re proving to the market everyday why we’re the best provider of quality traffic services across Europe.”

    In a separate announcement today, INRIX introduced a breakthrough in the delivery of traffic information called TPEG Connect. Based on the new encoding and transmission standard for traffic and travel information developed by the Transport Protocol Experts Group (TPEG), INRIX TPEG Connect provides automakers and navigation application providers with the ability to optimize payloads and bandwidth for delivering richer real-time and predictive traffic flow, incident, and location-based services like weather conditions on the road to devices using TPEG over IP. By providing delta support that can reduce data payloads by up to 50 percent on each message request, INRIX TPEG Connect helps OEMs and consumers save on connectivity costs by reducing data consumption in ways that ensures only the most location-relevant real-time information is delivered to the device.

    “TPEG Connect provides the industry with a better way to deliver pan-European traffic information that enables the delivery of more dynamic traffic and traveler information at less cost both to the OEM as well as the consumer,” said INRIX Vice President of Product Management Ken Kranseler, “By making the standard production for use over IP, INRIX TPEG Connect removes key technical and commercial hurdles for our customers accelerating the delivery of next generation of traffic applications and driver services that will improve mobility for millions of people worldwide.”

    According to the announcement, INRIX delivers the broadest and most accurate real-time traffic information through its distinctive Smart Driver crowd-sourced traffic information network and Total Fusion data analytics technologies. The company offers real time traffic information today in the following European countries:

    Austria
    Belgium
    Denmark
    Finland
    France
    Germany
    Hungary
    Italy
    Ireland
    Luxembourg
    The Netherlands
    Norway
    Poland
    Spain
    Sweden
    Switzerland
    Slovenia
    United Kingdom

    INRIX also announced an agreement with road safety products and services company Coyote Systems to provide real-time traffic information in future Coyote products. As Coyote’s preferred global provider of traffic information, INRIX and Coyote will work together to apply each other’s expertise in user-generated content for the development of future products and services.

  • The System: GPS L5, the Real Stuff

    The System: GPS L5, the Real Stuff

    By Oliver Montenbruck, Andre Hauschild (DLR/GSOC), Stefan Erker, Michael Meurer (DLR/IKN), Richard B. Langley (UNB), and Peter Steigenberger (TUM)

    The L5 signal of the new Block IIF satellite shows a very favorable signal strength (Fig. 1), which is somewhere in between the L1 and L2C signal strength for the employed antenna and slightly higher than that of the GIOVE-A/B satellites. While the L5 test signal of the second-last Block IIR-M satellite (PRN1/SVN49) is transmitted through a narrow beam antenna and shows a steep variation with elevation angle, the new satellite exhibits an almost constant flux irrespective of the boresight angle.

    Following the successful launch of the first Block-IIF GPS satellite (PRN25/SVN62) on May 28, 2010 (UTC), and the activation of the legacy signals on June 6, users around the world have eagerly awaited the first transmission of PRN25 signals in the L5 band.

    In June, at last, the L5 payload was activated for more than five hours transmitting nominal signals with the PRN25 ranging code. This enabled standard tracking receivers to collect the first real L5 measurements from the new satellite.

    Scientists of the German Aerospace Center (DLR), the University of New Brunswick (UNB), and the Technische Universität München (TUM) spotted the first L5 data at 15:17:11 UTC from a station in Fredericton, Canada, followed a second later by stations in Japan, Singapore, the Canary Islands, and Germany. The stations are part of the CONGO network, which is the first global network of tri-band (L1/E1, L2, L5/E5a) GNSS receivers monitoring the GPS, GLONASS, GIOVE, and SBAS satellites. For background on the CONGO network, see the September 2009 GPS World article.

    Fig.1 Carrier-to-noise-density ratio of GPS (left) and GIOVE-A/B signals measured at the Wettzell station on June 17, 2010. Red curves refer to signals in the L5/E5a band and include data from the PRN1 test satellite and the new PRN25 satellite.
    Fig.1 Carrier-to-noise-density ratio of GPS (left) and GIOVE-A/B signals measured at the Wettzell station on June 17, 2010. Red curves refer to signals in the L5/E5a band and include data from the PRN1 test satellite and the new PRN25 satellite.

    The L5 signal of the new Block IIF satellite shows a very favourable signal strength (Fig. 1), which is somewhere in between the L1 and L2C signal strength for the employed antenna and slightly higher than that of the GIOVE-A/B satellites. While the L5 test signal of the second-last Block IIR-M satellite (PRN1/SVN49) is transmitted through a narrow beam antenna and shows a steep variation with elevation angle, the new satellite exhibits an almost constant flux irrespective of the boresight angle.

    Fig. 2 Multipath plots of L1 C/A code, semi-codeless L2 P(Y) code, and L5 code tracking for the Singapore station of the CONGO network (10-second smoothing).
    Fig. 2 Multipath plots of L1 C/A code, semi-codeless L2 P(Y) code, and L5 code tracking for the Singapore station of the CONGO network (10-second smoothing).

    While the new Block IIF satellite has not yet been set healthy and made available for public use, the early measurements collected on June 17 already demonstrate good tracking quality. This is illustrated in Fig. 2, showing the so-called multipath combination for pseudorange measurements from L1 and L2 legacy signals (the upper two panels) as well as the new L5 signal for Singapore, which had continuous visibility of PRN25 during the period of interest. Except for low elevation angles that are affected by strong multipath from structures in the vicinity of the antenna, root-mean-square tracking errors well below 30 centimeters were obtained for all signals.

    Fig. 3 L5 spectrum of PRN25 collected on June 17, 2010 with a 30-meter high-gain antenna at Weilheim, Germany.
    Fig. 3 L5 spectrum of PRN25 collected on June 17, 2010 with a 30-meter high-gain antenna at Weilheim, Germany.

    In addition, the GNSS signal monitoring facility at DLR’s ground station in Weilheim has been used to record high-rate radio-frequency samples and spectra of the new signal, a snapshot of which is shown in Fig. 3. The raw sampling also confirmed that the L5 signal of PRN25 comprises both in-phase and quadrature modulation (in contrast to the PRN1 test signal, which contains a Q-component, only).

    To the regret of U.S. scientists, the first publically traced L5 signals were only transmitted when the satellite was over Europe and Asia (see Fig. 4). Nevertheless, the test transmission provided an excellent sneak preview of what we can expect when the regular transmission starts. The satellite is presently expected to be set healthy and to start regular service by the end of August at the latest.

    Fig. 4. The ground track of PRN25 during the transmission of L5 signals on June 17, 2010. Also indicated is the footprint of the satellite showing the 0°, 30°, and 60° elevation angle contours at the beginning of the transmission. The ground track is almost centered over Diego Garcia, one of the GPS monitoring stations.
    Fig. 4. The ground track of PRN25 during the transmission of L5 signals on June 17, 2010. Also indicated is the footprint of the satellite showing the 0°, 30°, and 60° elevation angle contours at the beginning of the transmission. The ground track is almost centered over Diego Garcia, one of the GPS monitoring stations.

    Equipment. The CONGO network stations use JAVAD GNSS Triumph Delta-G2T/G3TH receivers. A Leica AR25R3 chokering antenna is used at Wettzell, while the Singapore station is equipped with a Leica AX1203+ GNSS antenna. The L5 spectrum was recorded with an Agilent PSA E4443A vector signal analyzer.

    Beidou G3

    China launched another Beidou/ Compass satellite, named G3, on June 2. By June 9, its apogee kick motor had placed the satellite in geostationary orbit at 84°38’ east, according to NORAD tracking reports.This is close to the position initially occupied by G2 (83°30’) before it started drifting. By June 9, G2 had drifted to 64°29’. By June 11, G3 had started transmitting signals on three frequencies.

    China now has two properly functioning geostationary satellites in its second-generation system, out of a total of five it expects to place by 2012 for a regional operating system; also needed for this concept are four mid-Earth orbit satellites (one currently aloft), and five inclined geosynchronous orbit satellites (zero in orbit now). A planned global system would require 5, 27, and 3 satellites in GEO, MEO, and IGO orbits, respectively, by 2020.

    Current regional-system signals on three frequencies use quadrature phase shift keying. Global-system signals will be binary offset carrier waveforms.

    Opinions on SVN-49

    The public comment period on proposed mitigation options for GPS satellite IIR-20M (SVN-49) ended May 28, and comments are viewable at www.regulations.gov under RITA Docket 2010–0002. Among others, the U.S. GPS Industry Council, NovAtel, Garmin, Septentrio, Raytheon, Boeing Commercial Airplanes division, General Motors OnStar, the European Commission, the MITRE Corporation, STMicroelectronics, the German Space Operations Center, and Cessna Aircraft have all filed comments expressing a preference for one option or another.

    Unfortunately for the U.S. Air Force and the GPS Wing, no clear consensus emerges. Indeed, differences of opinion naturally follow the respective orientation of each company or organization toward their customers’ or members’ specialized needs.

    Devote It to Science. Perhaps in recognition of this imbroglio, at the Air Force Space Command- Industry Exchange on June 15, Lt. Colonel Todd Parks briefed the PNT Functional Capability Team, explaining that the Air Force now was soliciting from industry “innovative applications” for the SVN-49 signal in space.This echoes a suggestion by Javad Ashjaee at last year’s unprecedented ION/ USAF session on SVN-49, where he proposed that the signal be used for studying multipath.

    A website article at env-gpsworld-integration.kinsta.cloud/49opinions recaps commentary and preferred options from several companies and organizations.

    The potential mitigations are each designed to reduce the impact of the unique nature — that is, errors — of the SVN-49 signal to a portion of the user segment. They are (so far):
    1. Set healthy with current 152- meter antenna phase center (APC) and associated clock offsets.
    2. Set healthy with factory APC offset.
    3. Users switch to multipath-resistant receivers.
    4. Modify receiver software to use look-up table corrections.
    5. Increase user range accuracy (URA) index to a minimum value of 3.
    6. Remove data modulation from L2 P(Y)-code, and
    7. Change L2C PRN code to a “unique sequence.” (6 and 7 are considered a pair, to be jointly implemented for desired effect.)
    8. Change SVN-49 from PRN-01 to PRN-32.
    9. Use spare health code so future users could use SVN-49 despite unhealthy setting. For background on the SVN-49 situation, see Richard Langley’s Expert Advice column from August 2009. Briefly, the pseudorange data broadcast by the satellite contains larger than normal errors that vary according to the elevation of the satellite above the horizon.

    The comments filed by the U.S. GPS Industry Council (USGIC), available as a PDF file at both URLs listed in this story, are the most detailed and extensive across all the options. However, the stated preference of the USGIC for Option 9 does not necessarily reflect agreement across all sectors of industry. As the USGIC points out, “Options 1 through 8 propose to designate SVN 49 as healthy using techniques that enable mitigation for some user applications, but that are unable to also mitigate adverse impacts to otherusers.”


  • GNSS Vulnerability and Alternative PNT

    As NextGen air traffic management increasingly relies on GNSS for safety-critical functions, some form of backup is needed in the event of GNSS signal loss, whether due to intentional jamming or other causes.

    A group working under the auspices of the Federal Aviation Administration (FAA) Navigation Services Directorate recently prepared a study assessing non-GNSS navigation system architectures to provide alternate positioning, navigation, and timing (APNT) services for aviation users, to mitigate GNSS vulnerability to radio frequency interference (RFI). The APNT architecture would be based on selected elements of today’s terrestrial navigation network, possibly upgraded, plus new elements anticipated for the 2025 timeframe.

    This article summarizes the scope and initial results of the study; to download the full paper, visit env-gpsworld-integration.kinsta.cloud/alternativePNT. As a result of the 2001 Volpe Vulnerability Study and subsequent U.S. government policy on PNT services provided by GPS, the FAA has begun investigating APNT concepts by which the safety, security, and efficiency of the U.S. National Airspace System (NAS) can be maintained in the event of a loss of GPS-provided PNT services. The sought-after APNT network should be cost-effective based on likely aircraft equipage in the 2025 timeframe.

    The FAA recognizes that during migration from the current NAS to the Next Generation Air Transportation System (NextGen), reliance on PNT services will increase to support area navigation (RNAV), digital communications, and enhanced surveillance services. This paper, presented by the FAA to the International Civil Aviation Organization’s (ICAO’s) Navigation Services Panel in May, identifies three major areas of research and analysis. The APNT work represents a constructive response to concerns raised by the simultaneous 9/11 terrorist attacks and the Volpe Report on GPS vulnerability.

    The first area of research proposes to investigate current distance measuring equipment (DME) to see if better RNAV services can be provided to current and future users, and to mitigate the possible problem of over-interrogation as demand on the system grows. The second area will investigate multi-lateration to see how the services based on systems currently being planned and fielded could be expanded or enhanced by synergy with other ground-based navigation systems such as DMEs.

    The third area of interest will investigate the use of the current and future DME network, and potentially other ground-based equipment, to provide a robust RNAV pseudolite system broadcasting in the current DME L band. This third alternative receives the bulk of the attention of this two-page digest of the full paper.

    Background

    The United States is pursuing the NextGen air traffic modernization program to support a predicted increase in operations by a factor of 2–3 by 2025. Many of the new capabilities depend on PNT services provided by GNSS. Specifically, performance-based navigation (PBN) and automatic dependent surveillance broadcast (ADS-B) will be based on GPS with satellite-based augmentation systems (SBAS) and ground-based augmentation systems (GBAS). PBN and ADS-B will, in turn, support trajectory-based operations, area navigation (RNAV), required navigation performance (RNP), precision approach, closely spaced parallel operations, and other operational improvements.
    As NextGen modernization and implementation progresses, U.S. NAS dependence on GNSS services will increase. Appropriate mitigations for GNSS vulnerability to RFI also must be assessed and implemented where necessary.

    APNT Assumptions

    The study group established a set of assumptions to guide the analysis activity. Key among the 13 assumptions were:

    • In 2025, there will be “RNAV everywhere and RNP where beneficial.” There will likely be many different variants of RNAV and RNP that are yet to be defined.
    • APNT is a means to continue RNAV and RNP operations to a safe landing during periods when it is discovered that GNSS services are unavailable, due to interference.
    • Users equipped for APNT will be able to continue conducting RNAV and RNP operations (dispatch, departure, cruise, arrival) during the GNSS outage after the transition to APNT.
    • Users not equipped for APNT may not be able to continue RNAV and RNP operations in areas where GNSS is required during the GNSS outage.
    • APNT service performance may not be equivalent to GPS performance.
    • At least one instrument landing system will be retained at airports wherever required for safety or economically justified.

    Pseudolite Multi-Lateration

    This article passes over the paper’s discussion (see link cited earlier for full version) of DME network optimization and passive wide-area multi-lateration (WAM) to take a brief overview of the pseudolite-based multi-lateration.

    As shown in Figure 1, the pseudolite (PL) architecture allocates the position and integrity functions to the aircraft, similar to how GPS receiver-autonomous integrity monitoring works. The PL alternative would leverage all of the existing 1,100 DME facilities plus the planned ADS-B ground-based transceiver (GBT) facilities to provide a combined network of approximately 1,900 sites.

    As shown in Figure 2, the PL architecture requires the GBT and DME sites to be synchronized to a common time standard so each facility can generate and transmit a heartbeat message consisting of the station identification and an accurate time stamp. The ADS-B in avionics would host the position calculation and integrity monitoring functions and pass this information to the aircraft navigation over a new interface, if GPS becomes unavailable.

    Figure 2. Multi-lateration (MLAT) alternative block diagram.
    Figure 2. Multi-lateration (MLAT) alternative block diagram.

    The potential advantages of this alternative include a simpler architecture that does not require a ground system to compute the position of the aircraft. A common non-GNSS or robust GNSS time reference is required.

    Straw Man Signal Design

    The authors propose a straw man signal design for the broadcast of one-way ranging signals from existing DME transmitters. The goal is not to provide a final design for such a signal. They recognize that many modifications and improvements will be required to bring such a function to fruition. Rather, they offer the proposal as a catalyst for the community, and hope that it will serve as a starting point for a vigorous discussion on this critical topic.

    Signal design is directed at these goals:

    • The new signals should be added to the existing broadcast from operational DME beacons without significant degradation to the two-way ranging accuracy provided by the DME beacon to legacy users. The new signals would overlay the existing replies that complete the traditional two-way DME transactions. More specifically, they could be implemented by triggering existing beacon with requests from a pseudo-aircraft located near the operational DME beacon. Thus, they hope to avoid any changes to existing ground hardware and by so doing realize benefit from the entire set of DME beacons in operation today.
    • The new signals should provide one-way ranging to modified avionics. The authors do not wish to modify the ground equipment, but recognize that one-way ranging from a DME station will require new avionics.
    • In addition to one-way ranging, the new signals should also support a modest data capability. This data would include the DME location, DME identification, time information, and a parity field to ensure data integrity. The proposal targets a data capacity around 150 bits per second, because similar capacity has served well for other one-way ranging systems such as GNSS and SBAS.
    • Finally, the new signal should also enable source authentication. The authors feel that signal authentication is needed, becau
      se radio navigation may be subject to electromagnetic attack in the decades ahead.

    The authors then describe and illustrate in seven figures the definition of a DME chip, a do-no-harm criterion, synchronization sequence, data field, data erasures and errors caused by competing channel traffic, data content, and source authentication. They indicate that they are looking at other signal alternatives for the DME band as well. These alternatives would make more liberal use of spread-spectrum technology.


    Authors of the APNT study were Leo Eldredge (FAA), Per Enge (Stanford), Mike Harrison, Randy Kenagy, Robert Lilly (all with Aviation Management Associates), Sherman Lo (Stanford), Robert Loh (ISI), Mitch Narins (FAA), and Rick Niles (MITRE CAASD).

  • Letters to the Editor

    Our readers respond to the cover features in the April, May, and June issues: the two-part special the “Origins of GPS” and Richard Langley’s look at “GPS by the Numbers.”


    GPS0610_Cover
    Source: GPS World

    Spilker and Parkinson: from GPS Origins to L5

    Thank you so much, Brad, for the recognition you gave me in your history of GPS origins in the May and June issues.

    I keep in my sometimes near photographic memory the numerous hours and trips we made over these many years, especially in the early days when you were Joint Program Director of GPS, the meetings we had with Bob Cooper and the Navy admirals. You

    offered me the opportunity of a lifetime to contribute a little.

    The one thing that you did not mention because of modesty is your ability to put together a team of Air Force officers so outstanding that I have not seen a comparable group anywhere else.

    There is at least one other contribution worthy of inclusion, later in the program. One day during a board meeting at Stanford Telecom, I pointed out to Bill Perry that Congress had just zeroed out the GPS budget. He immediately got on the phone to the chairs of the House and Senate Armed Services Committee. Sam Nunn was chair for the Senate, and after much work and many calls, talked them into reversing that decision.

    I have often thought that had the two parallel Navy Timation and Air Force 621B programs not been folded together as a single joint program, neither program would have survived.

    On another subject, I think there is still work to be done on precision interoperability of multiple GNSS. How does it relate to “bounded inaccuracy” and integrity and precision positioning and carrier-phase precision?

    Finally, many probably do not know it, and I have not received any recognition for it, but the work I did in designing the GPS L5 signal was performed as a gift to the U.S. Air Force, Federal Aviation Administration, and our country, with no compensation of any kind including my travel to the ION conference where I gave the award-wining L5 paper with AJ Van Dierendonck.

    [See J. J. Spilker and A. J. Van Dierendonck, “Proposed New Civil GPS Signal at 1176.45 MHz,” Proceedings of ION GPS-99, Institute of Navigation, and an earlier, similar paper at the June 1999 ION Annual Meeting. — Ed. ]

    GPS0410_Cover
    Source: GPS World

    I only mention it now because of the successful Block IIF launch. I ask nothing in return, and only hope it is of some value to our country and the world.

    — Jim Spilker, Jr.
    Half Moon Bay, California

    Brad Parkinson replies:

    Thanks to both you and AJ. It will be an outstanding addition to civil (and I hope military) options. Thanks also, of course, to the groups that ironed out the myriad of important details.

    You also deserve credit for the initial work on split spectrum. Recall we suggested it for the civil signal to attain separation, and it was immediately endorsed and selected as the basis for the military L(M) signal.

    — Brad Parkinson
    Palo Alto, California


    Selling GPS

    Reading your two-part history of GPS origins recalled another story about those early years, and an influential Air Force officer.

    Major General George Keegan was one of the most interesting people I met in my 35 years of Air Force civil service. Primarily an intelligence officer, he was considered one of the leading authorities on the Soviet Union, had been military attaché in the American Embassy in Moscow, and had just been given interim assignment as Director of Plans and Programs, HQ Air Force Logistics Command. He probably did not know anything about logistics, but he had a large staff to help him.

    It was soon evident that he liked to come out to California, ostensibly to see his troops there (my office). What he really wanted was to go to the RAND Corporation in Santa Monica, the first non-profit brains factory set up in 1946 to guide the military services. RAND had a group of retired generals and admirals who war-gamed all sorts of scenarios to test various plans and to critique experiences leading to recommendations for changes. This was stimulating and valuable to him.

    I was in charge of arranging his visits, and he was highly interested in the programs underway and especially in development at the Space and Missiles Systems Organization, where I worked. I would arrange briefings for him and occasionally drive him to our offices outside Norton Air Force Base near San Bernardino where the ballistic missile programs were developed.

    We were collocated with the SAMSO Development Plans shop on the 4th floor of the Aerospace Corporation headquarters building when he called to set up a visit. He asked me what he had not been briefed on. I thought of one program, then called 621B, and told him it was a study area with a lot of promise. He asked me to set it up.

    The “Program” was one lieutenant colonel in an office up the hall from us. He was managing several contracts to explore and develop the concepts for operation and conceptualize the hardware for development of what is widely known now as GPS.

    The lieutenant colonel, whose name is lost to me, was not enthusiastic about briefing Gen. Keegan. I told him he was going to be on the Air Staff, he had security clearances for everything, and he would be smart to accommodate him. He agreed, but obviously reluctantly.

    When General Keegan arrived, the lieutenant colonel started to describe the program as then projected. Gen. Keegan was obviously excited at what he was hearing, and he started throwing questions.

    As a little background, knowing where you are precisely and being able to use that information is one of mankind’s oldest problems, and for the military forces, it is of the highest value. Among the many guidance systems in the inventory were Loran, OMEGA, TACAN, and many others. The annual costs to develop, maintain, improve, and operate these ran into hundreds of millions if not billions of dollars, and all of them operated with severe limitations.

    General Keegan asked, if 621B were developed and deployed successfully, would it supplant and obviate the need for Loran? He got an extremely reluctant answer, yes. Would it replace TACAN? Same answer. OMEGA? Same answer.

    I remember him sitting there staring at a very discomfited lieutenant colonel. He said, if I recall his words correctly, “Colonel, you don’t know what you have here. I don’t think you realize its importance. I will just have to sell it for you.” Later, when the General had left, the lieutenant colonel asked me if he was kidding. I replied that, from what I knew of him, he meant what he said.

    Fast forward now about two years. General Keegan was the Intelligence Chief, HQ U.S. Air Force. Program 621B had progressed, had several people in the development planning process, and was ready to expand greatly if funding were provided by the Department of Defense. It was in competition with many other Air Force, Navy, and Army programs, and there wa
    s no assurance that all would be approved.

    At that time, possibly even today, there was an annual Department of Defense conference to allocate funds called the Defense Systems Acquisition Review Committee, or DSARC. Each agency presented its case. The 621B program chief was there (I now recall him to be Col. Parkinson, from reading the article), and he came to see us after the meeting in Washington. He was euphoric, and he wanted to know who General George Keegan was. I told him of the briefing I had arranged with his predecessor several years ago, and what Keegan had said. He said General Keegan had come through in spades.

    This is second-hand reporting, but what happened was that before the DSARC began, General Keegan, who was not a member, asked the chairman for permission to address the group. What he said was something like this:

    “Perhaps once in your lives, if you are extremely fortunate, you may have the opportunity to influence a development that may truly benefit your country. Today you have an opportunity to foster a program that will not only be of enormous value to all the armed services, but provide the answer to one of man’s oldest problems. Program 621B will give the military capabilities that will surpass anything ever imagined, and give the civilian world a spinoff of obvious immediate value and unlimited future potential. Whatever else is approved today, this program should be considered vital.”

    The program director said General Keegan’s remarks were delivered with passion, and when he had finished and left their room, everyone looked at each other. He said their presentation was made easy — they were asked a lot of questions, and they had the opportunity to fully describe the timing, the impact, and the significance.

    The result was they were not only fully funded, but they were told that if they could use more funds later, to let them know. He said after that speech, there was no question in anyone’s mind that there would be a wide open road for their program.

    One of the rewards of my job in those years was being aware of and sometimes, in some way, involved in many fascinating events and programs. In this case, I inadvertently set in motion a chain of circumstances that, in a small way, may have facilitated the development of one of the most rewarding developments that came from the space and missile programs of the 1960s, ’70s, and ’80s.

    I did not sell GPS, but, unknowingly, I helped.

    — Don Hallwerck
    Long Beach, California


    GPS0410_Cover
    Source: GPS World

    Let Me Count the Waves

    I read your publication with great delight but little understanding — with the possible exception of Mr. Langley’s contributions, especially “GPS by the Numbers” in the April issue. Fiddling with my calculator years ago, I quickly found pi to eight digits using 355/113. Do you suppose Mr. Langley has a better simple m/n?

    — John Woodcock
    Bellevue, Washington

    Richard Langley replies:

    Thanks for your message and kind words about GPS World. Fraction approximations to pi is an interesting topic, one that I didn’t have much room to write about in the numbers article. Your use of 355/113 as a good approximation for pi is one that has been known for awhile. It was first discovered by the Chinese mathematician, Zu Chongzhi in 480 A.D. It is good to seven digits. You need more than an 8-digit calculator to show this, though. Type 355/113 into the Google searchbox to get an answer to 9 digits and you’ll see that only the first 7 are valid. It’s somewhat more complicated, but the fraction 103993/33102 gives pi to 10 digits. These fractions can be derived from the continued fraction representation of pi. For a discussion of that and many other interesting facts about pi, see Wikipedia.


    I have received the latest issue of GPS World. What a remarkable accomplishment! An outstanding example of sustainability, commitment, impact, and excellence! The Innovation column has constantly been a source of inspiration and ideas for all, not least GNSS students around the world.

    If ever you have the chance to collate them in one single pdf file and put it on your website or/and that of GPS World, this would be a most valuable contribution and worth more than many books on the subject I can think of!

    Congratulations, and may we see you on the front page for the 300th column!

    — Gerard Lachapelle
    University of Calgary, Canada


    Just read your “Numbers” article. I enjoyed it very much, especially because I am writing java code for an SDR-GPS-receiver I am building. As a starter I am trying to decode Kai Borre’s data file. I just finished implementing parallel code search using FFT. Gives remarkable insight in DSP. I am a retired engineer and radio amateur PA1KDG. Keep on writing and I’ll keep on reading — promise.

    — Kees de Groot
    Wageningen, The Netherlands

    Richard Langley replies:

    Many thanks for your message and interest in the GPS World Innovation column. Coincidentally, one of my students has just finished up a Ph.D. project on designing a strategy for implementing a SDR-GPS receiver and presented his results in April. Good luck with your project.