TRUSTe has introduced TRUSTed Mobile Ads, a unified mobile advertising privacy management solution. TRUSTed Mobile Ads support mobile browsing and application privacy preferences across all platforms and devices. The solution addresses the evolving privacy compliance standards, growing consumer privacy concerns, and complicated technology requirements unique to the mobile ecosystem.
Developed in partnership with mobile advertisers, publishers, networks and platforms, TRUSTed Mobile Ads provides an end-to-end privacy management solution that enables businesses to deploy advertising capabilities such as behavioral targeting, while providing consumers with transparency, choice, and control over the collection and use of their personal information, TRUSTe said. The solution builds upon TRUSTe’s web advertising privacy management solution, TRUSTed Ads, and its mobile privacy management solutions, TRUSTed Apps, TRUSTed Mobile Websites, and the recently released Free Mobile Privacy Policy Service.
“The need for a standardized cross-platform approach to mobile privacy is essential to maximize mobile advertising opportunities, address growing regulatory concerns and build trust for consumers,” said Chris Babel of TRUSTe. “With TRUSTed Mobile Ads, TRUSTe wants to bring our success as the largest DAA-approved online behavioral advertising compliance provider to the mobile ecosystem. With the support of our partners, we are fully committed to helping the industry take a proactive stance for mobile privacy compliance and consumer confidence.”
Esri announced that ArcGIS for Android is now available for Amazon’s popular Android tablet, the Kindle Fire. ArcGIS for Android, also available on iOS devices, Windows Phones, and other Android devices, lets users access, edit, and share maps. The free app can be downloaded directly from the Amazon Appstore for Android.
According to the announcement, ArcGIS for Android is a native application that serves as a mobile gateway into the ArcGIS system. It provides an intuitive user experience for querying map layers and data. With it, users can quickly access their own maps and data authored in ArcGIS Online as well as collect and edit geographic data. ArcGIS for Android includes a Favorites feature that accesses popular maps quickly; a tool for measuring area and distance; and the ability to display data in popups that support images, charts, links, and more.
Esri reports that ArcGIS for Android is built on Esri’s ArcGIS Runtime Software Development Kit (SDK). This SDK lets developers create custom spatially enabled applications for Kindle Fire and other Android devices and is designed to use web services available from ArcGIS Online. Apps built using the SDK can be deployed within the enterprise or to the public via the Amazon Appstore for Android and Google Play.
Google introduced Google Maps Floor Plan Marker App which enables those who’ve uploaded floor plans to improve the indoor location accuracy their visitors experience when using indoor maps within their venue.
According to the description in Google Play, the Google Maps Floor Plan Market App helps Google Maps show users their location more accurately within indoor venues. Walk around the floors in a popular, public building to collect publicly broadcast data, and afterwards, users of the Google Maps Android app will be able to see their location (“the familiar blue dot”) in those floors when they’re inside the venue. Note that you must first upload a floor plan. Likely to be of interest mostly to map enthusiasts and venue owners.
FCC Chairman Julius Genachowski joined major police department chiefs, including New York City Police Commissioner Raymond E. Kelly, Philadelphia Police Department Commissioner Charles Ramsey, Washington, D.C. Metropolitan Police Chief Cathy Lanier, Washington, D.C. Mayor Vincent Gray, wireless carriers, and Senator Chuck Schumer to announce new initiatives to combat cell phone and data theft.
Genachowski commended police departments and members of Congress, in particular Senator Schumer, for calling attention to a growing epidemic of robberies targeting smartphone users. Genachowski announced an industry commitment to develop a shared, centralized database that will record unique identifiers of stolen wireless devices to prevent their reuse, thereby making it harder for thieves to resell stolen wireless devices. Legislation, sponsored by Senator Schumer, will ensure that authorities have the tools they need to crack down on efforts to evade this technological solution.
According to the FCC, there is a growing epidemic of robberies involving smartphones and other cell phones:
More than 40% of all robberies in New York City involve smartphones and other cell phones.
The situation is getting worse: In Washington, D.C., cell phones were taken in 54% more robberies in 2011 than in 2007, and cell phones are now taken in 38% of all DC robberies.
Other major cities have similar statistics, with robberies involving cell phones comprising 30-40% of all robberies.
Robberies are, by definition, violent crimes, and there are many instances of robberies targeting cell phones resulting in serious injury or even death.
A recent Symantec study indicates that a loss or theft of an unsecured smartphone often results in access to sensitive personal data.
Chairman Genachowski, with the support of major city police chiefs and the wireless industry, announced new initiatives by wireless carriers, initially including AT&T, T-Mobile, Verizon and Sprint who cover 90 percent of US subscribers, to deter theft and secure customer data:
Implement a database to prevent use of stolen smartphones.
Within six months, when Americans call their participating wireless provider and report their wireless devices stolen, their provider will block that device from being used again. This system will be rolling out globally using common databases across carriers over the next 18 months.
Encourage users to lock their phones with passwords.
Smartphone makers will notify and educate users in the most highly visible ways—through messages on the smartphone itself and through “Quick Start” user guides—about how to use passwords to deter theft and protect their data.
Educate users on lock/locate/wipe applications.
Wireless providers will directly inform their customers about how to find and use applications that enable customers to lock/locate/and wipe smartphones remotely.
Public education campaign on how to protect your smartphone and yourself.
The wireless industry will launch a campaign, with media buys, to educate consumers on how to protect their smartphones and themselves from crime.
Progress benchmarks and ongoing dialogue.
The wireless industry will publish quarterly updates and submit them to the FCC on progress on these initiatives.
Accountability.
The FCC will engage the public safety community and wireless carriers in an ongoing dialog, with regular, quarterly meetings, to ensure that the most effective technological processes are in place to deter smartphone theft and data exposure.
The FCC will launch a proceeding if progress on the above deliverables falls behind schedule.
Legislation expected to criminalize tampering with unique hardware IDs on cell phones.
Members of Congress are planning to introduce legislation that will make it a federal crime to take steps to evade the effective deployment of a stolen phone database, including by tampering with hardware identifiers on wireless devices.
Criminalizing tampering with unique hardware identifiers has been an integral part of successful foreign deployments of stolen cell phone databases and the deterrence of cell phone theft.
The big news at the recent O’Reilly Where 2.0 and GPS-Wireless conferences, both located in the San Francisco Bay Area, may be continued industry fallout from Google’s decision to start charging higher volume users. Location-based services may have jumped the shark, as one Nokia executive said at GPS-Wireless, but such deals as Foursquare’s partnership with American Express can only help grow consumer awareness and drive mobile purchases. Indoor positioning and connected vehicles continued to be a hot topic at both Where 2.0 and GPS-Wireless. Yet, at least one executive at GPS-Wireless said that “the year of LBS has come and gone — and nobody noticed it.”
SAN FRANCISCO — A few companies in the location industry have decided to change mapping vendors in the wake of Google’s decision to start charging companies when their sites averaged 25,000 map views per day. Around the time of the recent 2012 Mobile World Congress, Foursquare said it would move from using Google Maps to user-contributed map service OpenStreetMap. The company said Google’s recent price increases prompted the change.
Foursquare did not change mapping vendors because of the quality of the maps, said Holger Luedorf, Foursquare vice president and head of business development. “Google Maps are a great product. We are big fans of openness, but it was not the lack of quality why we switched,” he said at GPS-Wireless 2012.
But while some companies are heading to other places because of the Google charging policy, the company says it is still doing well. “We did announce that Google was going to start charging for 25,000 or more [map hits]. In terms of usage, we have actually gone up since the announcement,” said Jay Akkad, Google product manager, mobile local ads, also at GPS-Wireless conference.
One of the big topics at GPS-Wireless is the idea that the term location-based services has “jumped the shark” in terms of consumer awareness and acceptance. “What the hell is LBS? It is an enabling technology,” said Duncan McCall, PlaceIQ co-founder and CEO. “The mythical Starbucks LBS deal does not make me care. We now have advertisers who have a particular [return on investment] they are looking for.”
At least one speaker, on a venture capital panel, said that the expression “LBS” hasn’t been useful in defining the market in at least eight years. “The huge opportunity is not location — there are tons of 100K-a-year-guys staying at the Red Roof Inn and not the Four Seasons. The huge opportunity is how people shape their habits — and location is one way,” said Prioleau Advisors’ Marc Prioleau. “Banner ads push to consumers, but the objective is loyalty. It’s the ‘we know where you are and where you go’ model.”
In all of the talk about LBS, the usual “who pays for it” was a hot topic at GPS-Wireless. “With 150,000 ads on a platform, [the consumer] doesn’t have to pay for it,” Luedorf said.
For the navigation piece of LBS, it still is the one area consumers know about and want, panel members said.
“Navigation still is hot. More than half of our users choose to use carrier-branded navigation,” said Brian Salisbury, TCS director of business development. “Consumers will start marginalizing a [paid for] service when it stops producing for them. The value for the consumer is if it is bundled with other services—sometimes that bundle is subsidized.”
People still are paying for navigation, despite attendees saying that a freemium model is the future, said Kris Kolodziej, Verizon Wireless associate director of cloud and location services. “Consumers are always going to find options. Maybe they will be looking at premium traffic [in the future],” he said.
Groupon, which presented at GPS-Wireless, announced at the recent 2012 Mobile World Congress in Barcelona that one quarter of its users purchased vouchers through a mobile service, a triple increase to more than 9 million deals. The company also said that LBS and proximity-based sales will increase because it plans to roll out mobile service in more than 30 countries soon. Currently, the company has its daily-deal service, online, in 48 countries.
“The core foundation of our company is the daily deal. Groupon Now goes into the core of location — where we are expanding into 30 markets — so location doesn’t get more specific,” said Andreas Lieber, Groupon director of mobile partnerships. “We recently released our mobile numbers and are seeing 25 percent growth — this is a really significant revenue stream.”
Mobile searches and deals will continue to grow, Google’s Akkad said. “Mobile searches have grown four times since 2010, according to our user surveys. This is a huge opportunity for developers,” he said. “One area we have noticed is the ability to close the loop in the location business. Businesses have to identify who is coming into their stores — that’s why hyper local ads are important — because of the proximity signal that tends to be a strong signal.”
The big location market still is evolving, but Foursquare’s deal last summer with American Express doesn’t hurt consumer awareness. “The deal with American Express drives users to Foursquare. No one knows how it is going to play out, but we are seeing an uplift as people are spending money,” Luedorf said. “[Location is] not monetizing heavily right now — companies need scale. But it actually is selling. We believe it’s through an ad model we can build, but not a premium service. Facebook and Twitter are trying to monetize — we will see.”
While the deal with American Express is a nationwide one where cardholders check in with Foursquare on their mobile devices at certain shops and restaurants for deals, check-ins may not be the emphasis the company wants in the future. “We are seeing more people consuming the data — not just checking in. They want to see what’s local in terms of tips for eating out and drinking and other entertainment,” Luedorf said.
Overhyped Expressions in the Location Industry
One of this editor’s pet peeves is the use of the word “experience” as in “consumer experience” when a company official describes a market, product or service. In a new technology and markets panel, moderator Clay Babcock of Rand McNally asked his panel what is an overhyped expression in the location industry. Kanwar Chadha of CSR said, “GNSS triangulation, TV or otherwise.”
Nick Brachet, CTO of Skyhook Wireless said, “near field communications.” Babcock chimed in with “augmented reality,” the expression “gadget play.” David Allen, CTO of Locaid said “anything to do with beacons.” Ankit Agarwal, Micello CEO, “any Starbucks story, especially something about a coupon.” One person said, in a conference filled with this story line, “indoor positioning is overhyped.”
At Where 2.0, the expression “SoLoMoCo” is destined to be one of those types of overhyped monikers. SoLoMoCo stands for a busy mix of social, local, mobile and commerce.
The DNRGarmin application has been a popular tool for GPS users worldwide since 1999. Developed at the Minnesota Department of Natural Resources (MNDNR) to facilitate field data collection by staff, DNRGarmin use grew quickly soon after being released as freeware to the public. In addition to thousands of Minnesota users, DNRGarmin has been used worldwide by fishermen in Japan, search and rescue teams in New York, wildland firefighters across North America, professional adventurers in Brazil, and miners in Africa.
MNDNR has released numerous updates of DNRGarmin over time to add functionality and maintain compatibility with software and handheld GPS receivers. Escalating changes in technology, an expanding user base, and requests for additional functionality prompted DNR staff to examine new ways of maintaining the application.
DNRGPS is a new iteration of DNRGarmin created by MNDNR and the National Park Service. The new name reflects a focus to expand the compatibility of the application to more brands and models of GPS receivers. DNRGPS is also able to consume more geospatial data formats, has more data projections, and is compatible with the latest versions of ArcMap and Google Earth.
DNRGPS is being released as Open Source software so that any programmer can download and alter the code. It is hoped the Geospatial Community will “adopt” DNRGPS as its own, testing and checking-in enhancements to the code, thereby contributing to the timely maintenance and expanded functionality of the program for all users.
A public DNRGPS webpage has been created for the distribution of DNRGPS and accompanying documentation. The site highlights functionality, lists prerequisites, and includes links to DNRGPS mailing lists.
Polaris Wireless, a provider of software-based wireless location solutions, announced that Per K. Enge of Stanford University has joined its executive team as the chief technical advisor. In an interview with GPS World, Enge describes how combined wireless location signatures and GPS show an exciting way forward for location in dense urban environments, where the wireless solution actually improves as GPS degrades.
Polaris Wireless, a provider of software-based wireless location solutions, based in Mountain View, California, announced that Per K. Enge has joined its executive team as the chief technical advisor to the company’s CEO, Manlio Allegra.
Enge is a professor of aeronautics and astronautics at Stanford University, where he directs the GPS Research Laboratory. He is also is co-author of the textbook Global Positioning System: Signals, Measurements, and Performance and has received the Kepler, Thurlow, and Burka Awards from the Institute of Navigation (ION) for his work. He received his Ph.D. from the University of Illinois in 1983, where he designed a direct-sequence multiple-access communication system that provided an orthogonal signal set to each user.
Polaris Wireless’s core product is a Wireless Location Signature (WLS) for wireless network operators to identify the location of a wireless device to within 50 meters, at low cost, even in urban and indoor environments. Polaris WLS is designed to scale as an operator’s network grows, providing location capabilities in 2G (GSM/CDMA), 3G (UMTS/CDMA 2000), and emerging 4G (LTE) air interfaces, as well as indoor technologies such as W-iFi, DAS, and Femtocells. Founded in 2003, Polaris also counts among its customers law enforcement/government agencies and location-based application companies.
In an interview with GPS World, Enge described how the Polaris location solution is actually enhanced by buildings, in direct opposition to the way GPS operates, and how he sees integration of the two technologies as leading the way forward for location-based services.
“A cell phone general receives signals from 3 to 10 base stations, and is required to report the signal to noise ratio of those, even beyond base station used. We backhaul that information into the Polaris server, where we do multilateration based on signal strength measurements. Imagery shows how RF signal stregnth varies in the city. Polaris uses the base station signals (similar to how Skyhook using Wifi access points), but the cell infrastructure use is better because it is always there and used by every phone, while Wifi receiver is not on all phones yet, just smartphones.
“Marriage to GPS is very cool, because the Polaris technology loves buildings, they introduce the variation, the grain in the signal-strength map. It’s jagged, it’s got nooks and crannies, which are well-predicted by our propagation models. So those buildings enhance our technology.
“We’ve got it pretty widely deployed, on 24 E911 networks, 24 wireless carriers that we have commercial relationships with in the United States, from quite big to more boutique providers. Some are smaller, regional, other larger, like Verizon though not the total network.
Michael Doherty, Polaris Wireless product marketing and communications director, added that “We also work outside the United States for location surveillance for governments who are also looking to deploy for commercial services. The solution is software-based, in the control plane of the handset, it is already within the handset, using network measurement reports (NMRs). Emergency caller location for cell phones, E911, is just the first of applications to come, it’s where we cut our teeth.”
Polaris Wireless has been a research partner and sponsor at the Stanford GPS Research Laboratory that Enge directs. “Now I’ve stepped up my relationship with them, to start talking about getting the next level of accuracy. They joined about 4 or 5 years ago, and funded the work of David De Lorenzo , a Ph.D. student who did first big set of measurements that we did on indoor navigation, on GPS penetration into buildings. On campus. We’re aviation people, so this was a new area, good for us, we expanded into that area and got a lot smarter about how to navigate indoors.”
De Lorenzo’s 2009 Institute of Navigation International Technical Meeting paper, “Design and Performance of a Minimum-Variance Hybrid Location Algorithm Utilizing GPS and Cellular Received Signal Strength for Positioning in Dense Urban Environments,” can be accessed here.
“In New York, three-quarters of cell calls get 50-meter accuracy,” stated Doherty. “99 percent get 150-meter. Polaris solutions will improve that by a factor of 2. That’s a forward-looking statement.”
“We are entering a significant growth period for the company. From 2007–08 we saw our business start to take off, from core E911, take off in demand from overseas governments, for anti-crime, anti-terrorism. From 2007 to 2010, Polaris Wireless had an average 66 per increase per year in bookings, in contracts signed. That’s a healthy indicator of future revenues
“Year over year 2010 to 2011, we saw a quadrupling of bookings, and a revenue increase of 30 percent, as we started to see those deployments taking place, and revenues coming in as a result. we expect that trajectory to continue through 2012 and 2013. Again, forward-looking statements.”
“During the deep recession, when U.S. governments were cutting back, we went overseas and were able to ride that wave.”
As to particulars on directions that Polaris research and development might take under his advisement, Enge volunteered “One of the really big initiatives is the inclusion of map-matching, knowing that we’re probably on a street, especially if our velocity is appreciable, going beyond a snapshot solution fix, taking advantage of knowing where streets our. We have cached that as a particle-filter problem, a Kalman filter associated with a set of hypotheses. When you have a sequence of snapshots, the particle filter is a very powerful way of putting that together.
“How do we know if we’re in a building? By looking at the NMRs. Now, how high are we in that builidng, so that’s aided by the database.
“The big core enterprise of Polaris, stripping away PNT, the strength is the underlying [cellular network] database. Polaris is where the database meets navigation. To make E911, law enformcement, navigation, all better.
“One application I’m particularly keen on is for campuses.The risk for muggings is greatest when walking to a car in a distant parking lot. We’re thinking about how we can help that student when assaulted. You can’t pull out your phone and call E911 nor run to a blue tower [emergency phone]. But you might have your keys in your hand, so if we make it so you can just push a button on it, the NMR goes to an emergency center on campus, then we can be more helpful in helping that student.”
Doherty inserted, “The beauty of our technology is that no one has to do anything. Our technology is capable of locating any device connected to the cellular network, as long as the device is powered on. It’s a software deployment, nothing to go out and deploy equipment cell tower by cell tower. Nor can bad guys disable anything in the phone to void this service. Polaris’s solution resides in the network, not in the handset. The confluence of signals in the network drives the solution. There is no chip in the handset that can be disabled or turned off. Whether GPS is enabled or not.”
In a final comment on concerns for the future, Enge said, “Personal privacy devices, PPDs, the GPS jammers. I’m pretty worried about that. Unlike the Polaris technology, GPS technology can be slapped on someone’s car without an organization making sure the rule of law is preserved. We’re hoping to make the PW technology complementary to GPS, so that when GPS is jammed, the PW solution will still provide a location.
Doherty added, “It is complementary today. Cellular networks covers a large area. Take for example, downtown San Francisco: The wireless signature solution is absolutely the best to locate there. In wide-open country, GPS has an advantage. That complementarity is happening today.
“Having Per onboard, we’re going to make that complementarity work better and better.”
By Holly Borowski, Oscar Isoz, Fredrik Marsten Eklöf, Sherman Lo, and Dennis Akos
A component of most GPS receiver front-ends, the automatic gain control (AGC) can flag potential jamming and spoofing attacks. The detection method is simple to implement and accessible to most GPS receivers. It may be used alone or as a complement other anti-spoofing architectures. This article presents results from a baseline AGC characterization, develos a simple spoofing detection method, and demonstrate the results of that method on receiver data gathered in the presence of a live spoofing attack.
Growing reliance on GNSS also creates the need to defend against those with the ability to exploit its weaknesses. Specifically, GNSS signal spoofing is recently a growing concern, as an effective spoofing attack can fool a GNSS receiver into producing erroneous navigation and timing information. Although applicable to many GNSS, GPS will be used as the example.
One example of spoofing seen recently in the popular press was the Iranian claims of bringing down a U.S. unmanned aircraft via a GPS spoofing attack. Although this may be unfounded given the complexity required, spoofing attacks to autonomous vehicles are emerging threats. A second hypothetical example is a fisherman whose location is monitored using GNSS may be motivated to use spoofing, such that illegally fishing in protected waters is not detetcted, increasing profits.
GPS signals received by a traditional hemispherical antenna are below the thermal noise floor, a physical constant dependent only on temperature. Although multiple signals are transmitted at low power in the same frequency band, they can be acquired and tracked using code-division multiple-access (CDMA). However, low signal power also makes GPS systems vulnerable to intentional radio-frequency interference (RFI) and the more sophisticated spoofing.
Spoofers range from simple to sophisticated. For example, a simple spoofer may be built from a GPS repeater (known as meaconing) by simply using it to rebroadcast signals at a higher power than the authentic GNSS signals. Receivers close enough to these spoofers then acquire and track the stronger spoofed signal, producing an erroneous position/timing solution. In this case, a position jump is likely to occur in the victim receiver’s reported solution as it transitions from the true signals to the spoofed signal, alerting the user of a potential spoofing attack. Somewhat more complex than a simple repeater would be to broadcast signals from a GPS simulator, which would enable a threat with more control over the signal-to-noise ratios as well as the resulting position. Finally, a very sophisticated spoofing attack first introduced by Humphreys , et al. in 2008 may be implemented by placing a spoofer near the receiver, so that it can correctly align its transmitted false signals to the authentic ones seen by the victim receiver. The spoofer then gradually increases the power of its transmitted signals, eventually capturing the receiver. After the receiver begins tracking the false signals, the spoofer can gradually deviate its transmitted signals from the authentic ones, causing the victim receiver to produce false navigation and timing information.
Effective methods have been developed for distinguishing spoofed from authentic GPS signals with a summary most recently presented in a January 2012 GPS World article by Wesson, Shepard, and Humphreys. In short, these methods can be divided into cryptographic and non-cryptographic spoofing detection schemes.Unfortunately the presented methods are not readily available to the majority of current standalone GPS receivers and can be quite computationally expensive.
We suggest a method using the Automatic Gain Control (AGC), a component of most GPS receiver front ends, to flag potential jamming and spoofing attacks. The proposed spoofing detection method is simple to implement and accessible to most GPS receivers as a measure of confidence in the authenticity of received and tracked signals. It may be used by itself on receivers without other spoofing detection capabilities or to complement other anti-spoofing architectures.
AGC Background
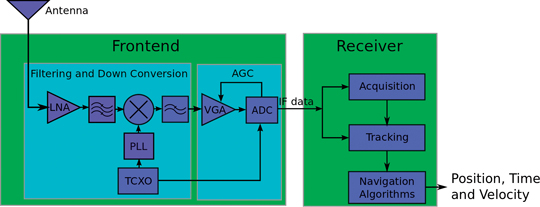
GPS receivers consist of an analog portion and a digital portion: the analog signal, comprised nominally of GNSS signals and white Gaussian thermal noise, is received, amplified, down-converted, and filtered, then converted to a digital signal for processing within receiver acquisition and tracking loops. During signal sampling and quantization by the Analog to Digital Converter (ADC), some quantization losses will occur. These losses depend on the ratio between the ADC’s maximum quantization threshold, L, the number of bits utilized, and the incoming signal standard deviation, σ.
This is where the AGC comes in. In a typical GPS receiver, it sits between the analog portion of the front end and the ADC, as shown in Figure 1. The AGC acts as a variable gain amplifier, adjusting the power of the incoming signal to optimize the L/σ ratio, minimizing quantization losses. This assumes the receiver is a multibit design which is the norm for GPS receivers today.
FIGURE 1. Typical GPS receiver architecture.
When the GPS band is interference free, which should be the norm due to restrictions on emissions in and near the band, the AGC gain depends almost exclusively on thermal noise, since the received GPS signal power level is below that of the thermal noise floor. Since this thermal noise is a physical constant with minimal fluctuation resulting from the span of temperature variations on earth, the primary role of the AGC is to adjust to different active antenna gain values. However, in the unlikely presence of interference the AGC gain drops in response to increased power in the GPS band. Thus, AGC levels may be used to indicate potential interference. Moreover, AGC levels are expected to respond to the interference before receiver performance is compromised, so useful flags may be established, which could provide a warning before a problem exists.
Baseline AGC Data Gathering
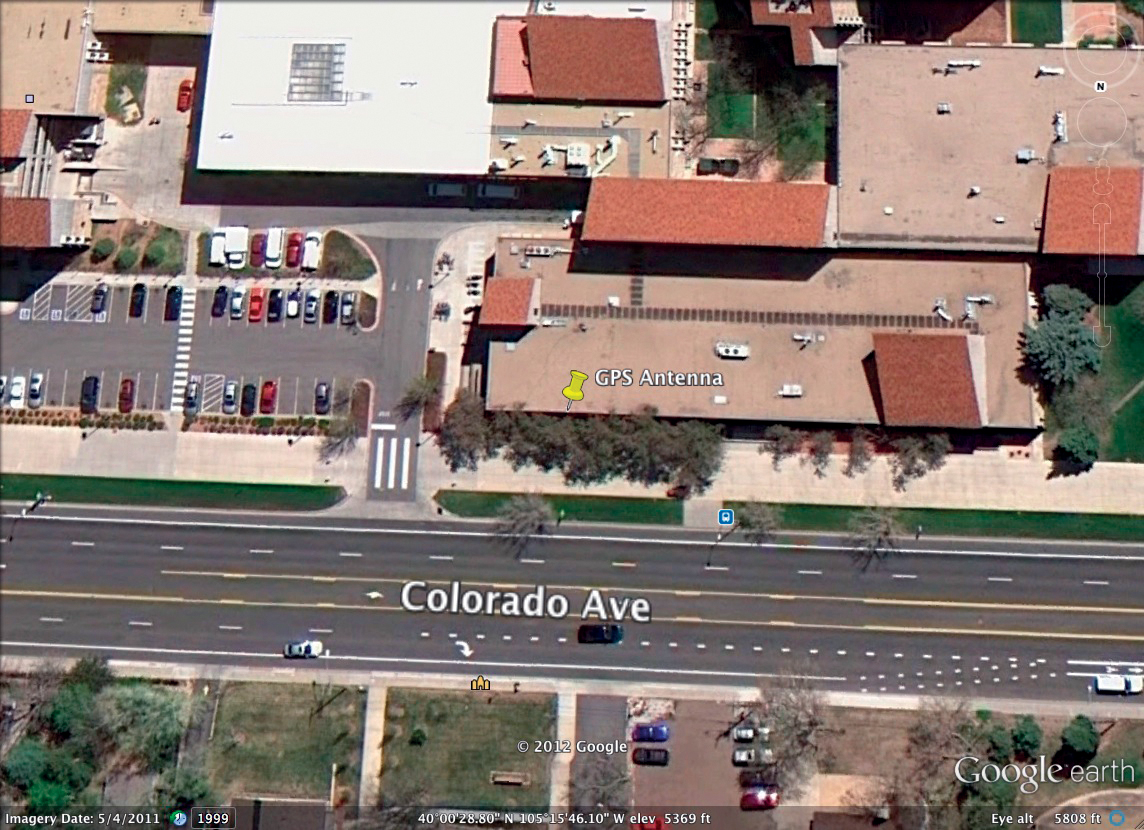
Prior to the spoofer experiment, baseline AGC data were collected for 72 hours using both a survey grade and a mass market receiver. The GPS antenna was located on the roof of the Engineering Center at Colorado University (CU) in Boulder (Figure 2).
FIGURE 2. Antenna location for baseline AGC data collection.
Currently there is no standardization among GPS receivers for AGC reporting units or the measurement itself. Most receivers offer such a metric but it is likely that each needs to be interpreted individually. However, in general this metric provides an indication of the relative gain of the amplifier within the receiver. Should the active antenna be disconnected (loss of gain), the AGC metric will increase showing the increase in internal gain needed to compensate for the loss of the active antenna amplification of the thermal noise floor. Should additional energy be detected in band, the internal gain will decrease accordingly.
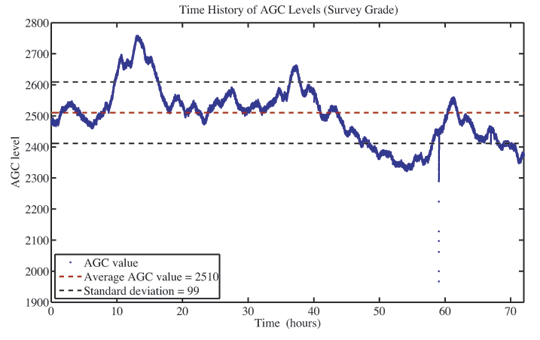
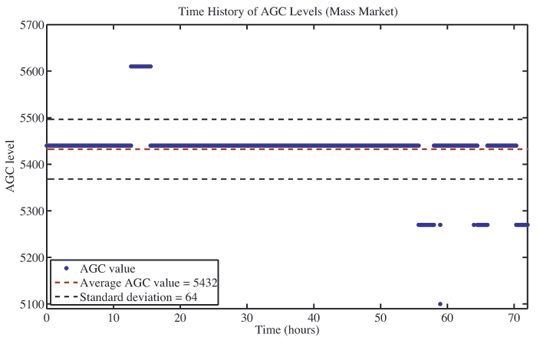
Baseline AGC levels from the survey grade and mass market receiver are shown in Figures 3a and 3b, respectively. The survey grade receiver AGC measurement was more sensitive to changes in the nominal environment; these results will be discussed later in more detail. The mass market receiver provided a much more consistent measure for the entire test period. Interestingly, there was one brief yet noticeable drop in AGC metric from the survey grade and mass market receivers at approximately hour 59 into the collection. Its magnitude was not overly significant, as it did not have an impact on the availability or accuracy of the position solution measurements from either receiver. It is assumed that this is a brief RFI event that occurred during the collection, perhaps from an illegal personal privacy device (PPD) in a vehicle on the nearby road.
FIGURE 3A. Nominal AGC values for survey-grade receiverFIGURE 3B. Nominal AGC values for mass-market receiver.
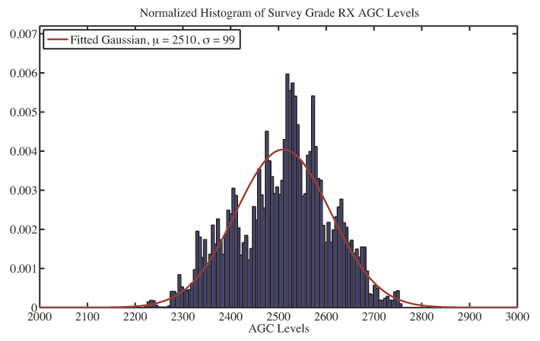
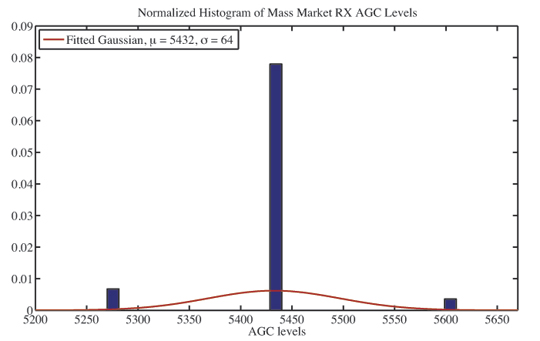
This RFI event outlier was excluded from the computed mean and standard deviation from the receivers’ AGC data. As shown in Figure 4a, the mean reported AGC gain was approximately 2510, and its standard deviation was approximately 99. For the mass market receiver, the data shows clear evidence of quantiztion in Figure 4b. Here the mean AGC level in this test was approximately 5432, standard deviation was approximately 64. Again, the absolute measures mean little and cannot be compared from various vendors of receivers. It is, of course, possible to calibrate individual receivers and obtain an absolute measure should this be required for a specific application. During the baseline data collection receiver reported position solutions were nominal, with deviations on the order of 2-3 meters in east and north directions, and 5-6 meters in the vertical direction for both receivers. A Gaussian curve was fit to the AGC data and although the data may not be well modeled by a Gaussian, a 2x standard deviation will be used to establish a quick initial flag to indicate potential spoofing/interference.
FIGURE 4A. Histogram of survey-grade AGC data.FIGURE 4B. Histogram of mass-market AGC data.
AGC Reactions to Live Spoofing
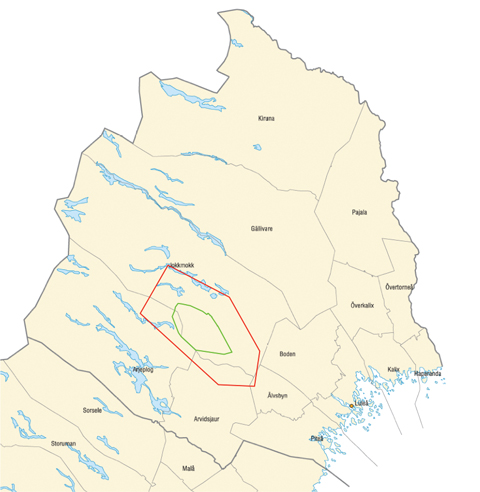
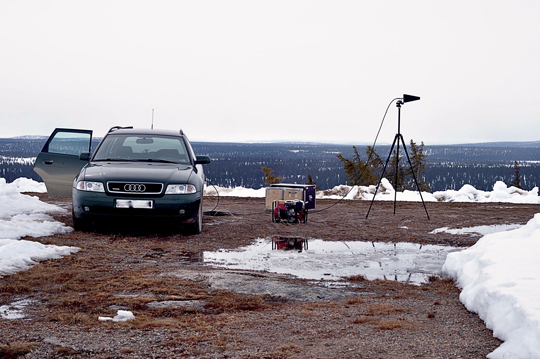
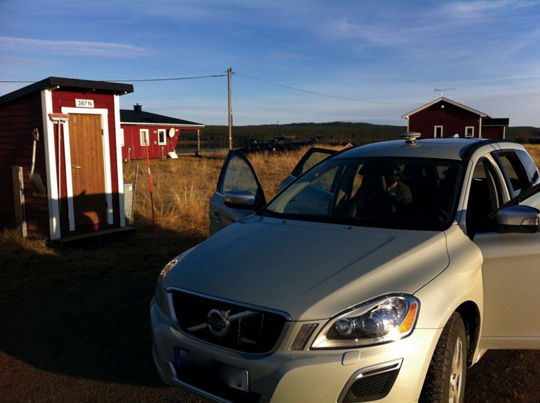
Live RFI or spoofing experiments are quite difficult to conduct due to the global and national legislation protecting the GPS frequency band. Any such experiments tend to be conducted with significant advanced planning and in locations where the testing will have no impact on any system or application which uses GPS outside the test range. Thus, we are grateful to have been able to test the AGC detection of live transmissions in the GPS band. This was done at the Robotförsökplats Norrland test range in Northern Sweden (Figures 5A, 5B, 5C) with the support of the Swedish Defense Research Agency.
FIGURE 5A Robotförsökplats Norrland test range in Northern Sweden (green outline is the test range and red outline is the flight restriction area, approximate 130 x 70 kilometers).FIGURE 5B Repeater spoofer transmission antenna.FIGURE 5C. Test vehicle
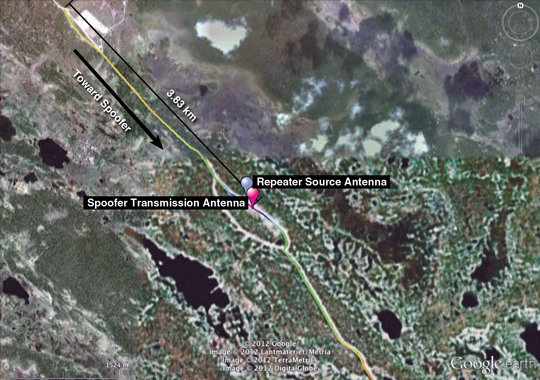
Dynamic GPS receiver measurements (position and AGC) from both the survey grade and mass market receivers were logged in the presence of repeater spoofing. Tests performed involved installing GPS antennas on the rooftop of a vehicle and driving along a 4km stretch of road toward (and away) from a hill top repeater spoofer transmission antenna while logging AGC levels and receiver positions from various GPS receivers. The data from both the survey grade and mass market receivers, used in the baseline collections, will be used here. The repeater spoofer source and transmissions antennas and the road (color shaded by elevation) used to go to/from the spoofer transmission antenna are shown in Figure 6.
FIGURE 6. Google Earth view of testing environment.
The baseline receiver data was used to establish the change in AGC levels necessary to flag potential jamming, spoofing, or unintentional RFI. In order to implement the AGC flag proposed in this paper, a known fixed RF chain (antenna, cable, and front end) would be calibrated in a known non RFI environment and the mean AGC would be established. Given the baseline data collection, a mean value has been established and a 2σ threshold is set as the RFI/Spoofing flag for each receiver. When the AGC drops below this flag, the resulting position/time solution should not be trusted.
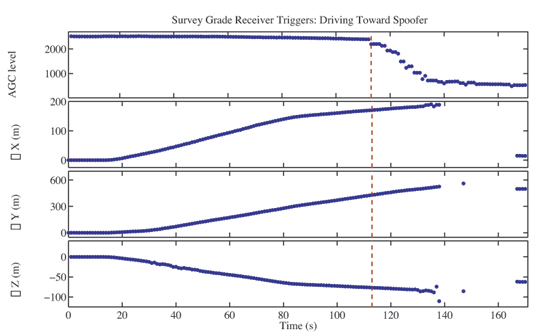
In Figure 7 the measurements (AGC metric and survey receiver reported position) are shown as a function of time as the receiver is driven toward the spoofer transmission antenna. Under nominal conditions (no RFI or spoofing) one would expect a constant “safe” AGC value as well as a smooth gradual change in the reported XYZ coordinates (as the drive maintained a constant speed on the road for the duration of the test). However, as expected, due to the additional power in the GPS band, the AGC gain drops as the receiver gets closer to the repeater spoofer. At approximately 138 seconds the receiver fails to report a position and this continues for the next 30 seconds as the vehicle progresses toward the spoofer transmission antenna. At approximately 168 seconds, the survey receiver is captured and reports the fixed position of the spoofer source antenna despite continually moving toward the transmission source. Although the loss of lock and position jump could be utilized as a flag for spoofer detection, the AGC metric here clearly shows the additional power in the band prior to any corruption of the reported GPS receiver position. If the previously computed threshold is used here, the 2σ trigger occurs as the AGC level begins to drop, significantly before any loss of lock or any change in the position solution resulting from the repeater spoofer.
FIGURE 7. Survey-grade RX AGC/position during drive toward spoofer.
Figure 8 shows this same data for the mass market receiver with similar observations. First, and most importantly, the AGC metric can be used here as a flag well before any corruption of the resulting position solution. The resulting position solution as the receiver becomes “captured” by the spoofer is odd, not going directly to the repeater source antenna location but also not maintaining the true position either. Likely a result of the navigation filtering coupled with individual range measurements transitioning from the true satellite measurements to that from the repeater spoofer. Nevertheless, it is clear from the AGC metric that the receiver output should not be trusted , well before any misleading information is provided.
FIGURE 8. Mass-market RX AGC/position during drive to spoofer.
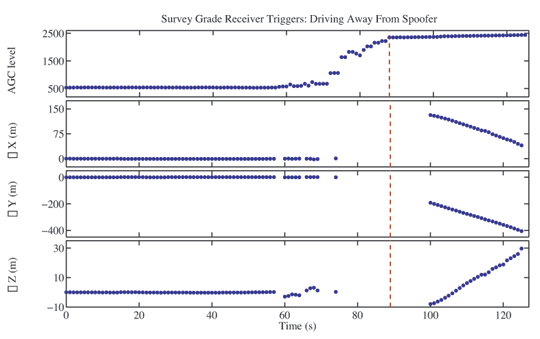
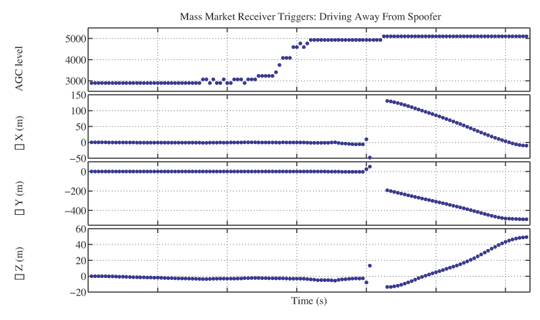
Figure 9 shows AGC levels and reported positions for the survey grade receiver as it is driven away from the repeater spoofer. At the beginning, the receiver is already captured by the spoofer and reports a false fixed position solution even while the vehicle is moving. While in close proximity to the spoofer, the AGC levels are low, attempting to compensate for the additional power in the GPS band. This would be an obvious flag that the resulting position cannot be trusted (all measurements to the left of the threshold are considered untrustworthy). As the receiver is driven away and exits the spoofer’s region of influence, power levels in the GPS band return to normal, the AGC reacts accordingly by increasing its gain, and the receiver begins to report accurate position solutions.
FIGURE 9. Survey-grade RX AGC/position during drive from spoofer.
Figure 10 shows this same data for the mass market receiver with similar observations. The AGC metric can be used as a flag indicating the position solution cannot be trusted until the receiver is well outside the range of the repeater spoofer. In this test, the AGC level does not return to a level within the established threshold, indicating that GPS solutions should not yet be trusted. This is likely a result of an overly conservative threshold (perhaps from the poor fit of data which is not well represented by a Gaussian) or perhaps hysteresis or smoothing in the AGC metric for this receiver.
FIGURE 10. Mass-market RX AGC/position during drive from spoofer.
These cases are representative of similar repeater spoofing tests we performed: in all cases this trigger identified potential interference well before the receiver reported false positions with the simple triggers established.
Improvements and Optimizations
These results do demonstrate the power of AGC to detect deception in GPS transmission, rendering these spoofers no more of a threat than the much less sophisticated jammers. However, the spoofer used in this testing was of a simple nature — a repeater spoofer.
The challenge would be to utilize such an approach to detect the most sophisticated spoofing attacks. This should be possible as the underlying thermal noise floor is a physical constant and in order for a receiver to be spoofed additional energy must enter the RF chain which, again, should be detectable. The optimization will come in via establishing thresholds – similar to GPS signal acquisition/detection. One will not want to set such a loose threshold such that frequent false alarms provide little confidence in the resulting position/time solution. Likewise one would not want to establish threshold so loose that the more sophisticated spoofing attacks would be successful. The key is the calibration and assessment of the underlying AGC measurement.
Recall the variation observed in the survey grade receiver data. Was this truly random noise that one must overbound as was done to establish the threshold for the experiments in this paper? And why were the noise levels so different for the baseline AGC collections in the survey grade and mass market receiver? We try to address both of these questions to provide a bit of insight into the advantages and shortcomings of the AGC metric.
First, the AGC measurement across receivers is not equal. In comparing these two receivers, the survey grade receiver has a much higher resolution measurement than that of the mass market receiver. This is obvious from the baseline data which showed little deviation from specific quantized levels in the mass market AGC metric. So although the great majority of GPS receiver already have/report their AGC measurement it may not be of sufficient fidelity for the most sophisticated spoofer detection.
Second, high resolution provides little benefit in a noisy measurement. So there is a pending question if there is a source for the variation in the AGC measurement for the survey grade receiver during the 72 hour baseline data collection – or was it simply a noisy measurement. Past work in this area led to the association of ambient temperature and the AGC measure, but perhaps not in the way one would initially think. Yes, the thermal noise level is dependent on temperature (from kTB), as well as bandwidth and Boltzmann’s constant, but this is really antenna temperature and in this case the correlation is with ambient temperature.
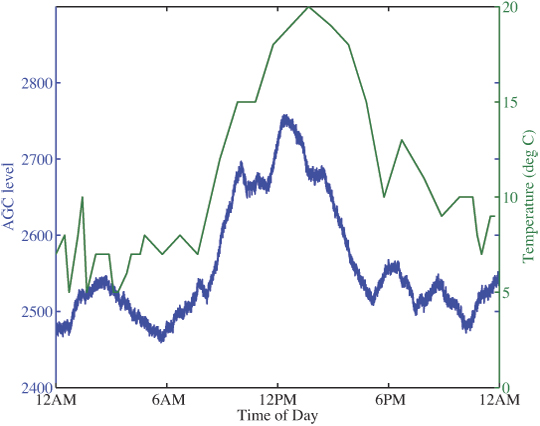
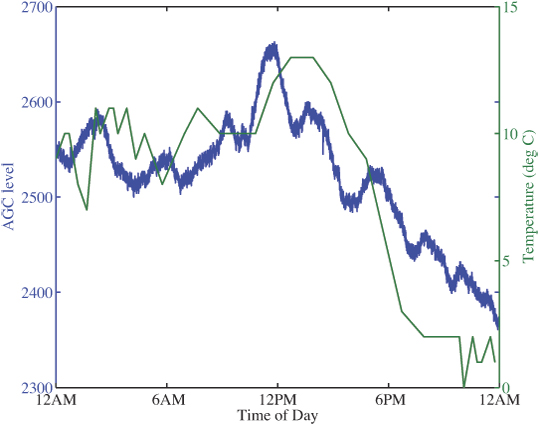
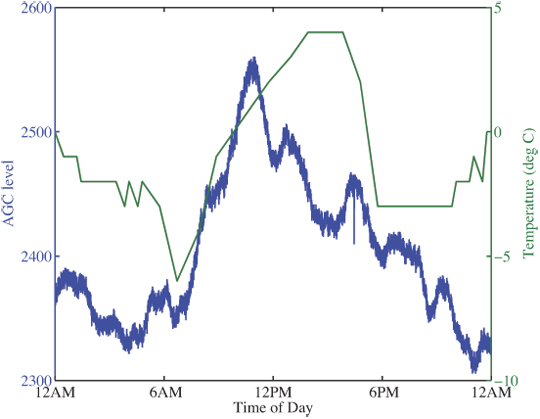
The baseline AGC levels were compared to changes in ambient temperatures in Boulder during testing to determine if observed fluctuations were related to temperature. The weather data were gathered in Broomfield, approximately 10 miles from CU; thus plotted temperatures do not exactly reflect the air temperature at the antenna. However, the data do reflect a correlation between approximate ambient temperature and AGC gain, shown in Figure 11a, b, and c.
FIGURE 11A. AGC measure (survey-grade RX) and ambient temperature, Day 1.FIGURE 11B. AGC measure (survey-grade RX) and ambient temperature, Day 2.FIGURE 11C. AGC measure (survey-grade RX) and ambient temperature, Day 3.
Why does this correlation exist? Why, when the temperature increases, must the gain of the receiver also increase? That may initially appear to be counter intuitive in that one may think higher temperature would result in higher thermal noise. Again, it is important not to confuse antenna temperature and ambient temperature which is the basis for the thermal noise floor. Why then must the receiver provide more gain with higher ambient temperatures? The validated hypothesis is that the antenna is an active design with an internal low noise amplifier. The gain, or really efficiency, of this amplifier is dependent on its temperature (and it is quite small, on the order of a dB). So as the ambient temperature increases the efficiency of the amplifier in the antenna decrease so the receiver is required to put more gain into the RF chain to accommodate.
This temperature correlation is an attempt to illustrate the power of the AGC metric and its potential sensitivity for detection. Other triggering methods, such as comparing current AGC levels with a moving average of previous values, could be implemented depending on desired performance. If such changes can be incorporated and/or calibrated out, we expect the most sophisticated spoofers could be detected coupled with a low false alarm rate.
Conclusion
A trigger based on the AGC, a measure available in a majority of GPS receivers, has been proposed that indicates the presence of potential signal spoofing prior to a compromise in receiver positioning. This proposed trigger is an effective tool for current GPS receivers to establish a low computational complexity measure of confidence of the reported position solution, and may complement other spoofing detection methods. The triggering mechanism may be adapted according to desired sensitivity in AGC changes, thereby either reducing the false alarm rate, or providing a conservative flag of potential RFI. Upon receiving such a flag, other navigation sources may be consulted to determine position, or the trust in the GPS solution may simply be lowered. Thus spoofing would be no more of a threat to satellite navigation/timing receivers than the much less sophisticated jamming.
Acknowledgments
Our thanks to the Robotförsökplats Norrland test range in Northern Sweden and the Swedish Defense Research Agency, particularly Peter Johanson and Mickael Alexandersson (who provided many of the photographs) for supporting the experiment.
Holly Borowski is a Ph.D. student working in the Research and Engineering Center for Unmanned Vehicles at the University of Colorado-Boulder. Her research involves unmanned vehicle path planning for information gathering in uncertain environments.
Oscar Isoz is a Ph.D. student at Luleå University of Technology. He has studied GPS interference detection and localization and is now focusing on radio occultation.
Fredrik Marsten Eklöf is the project manager for NAVWAR research at the Swedish Defense Research Agency.
Sherman Lo is a senior research engineer at the Stanford GPS Laboratory. He is the associate investigator for the Stanford University efforts on the FAA evaluation of alternative position navigation and timing (APNT) systems for aviation.
Dennis Akos is an associate professor with the Aerospace Engineering Sciences Department at the University of Colorado as well as a consulting associate professor with Stanford University and a visiting professor with Luleå University of Technology.
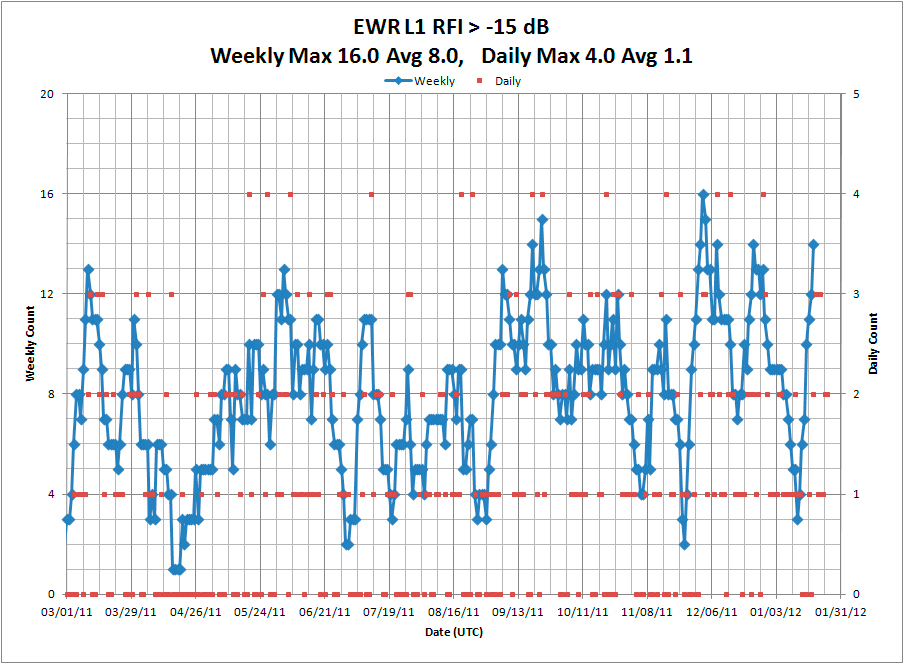
When jamming interfered with GPS signals at Newark Airport, a three-month effort determined that low-power, mobile personal-privacy devices were responsible. This article describes how they were found and outlines how the observable parameters of such devices encompass a wide variation in RF spectra and internal modulation.
Personal privacy devices (PPDs) are now recognized as being responsible for causing interference to GPS receivers. However, in November of 2009, when the Local-Area Augmentation System (LAAS) installed its first Ground-Based Augmentation System (GBAS) at Newark International Airport (EWR), this fact was not known. Within the first month of its installation, anomalies in GBAS processing were correlated to the presence of radio-frequency interference (RFI). Initial efforts to determine the source of this unexpected RFI were not successful.
The Federal Aviation Administration (FAA) had a significant interest in finding this RFI source, leading to deployment of RFI detection and location equipment by several groups. Zeta Associates temporarily installed equipment in early January 2010 that was capable of detecting and characterizing RFI but did not have emitter location capability.
Determining that an RFI transmitter is in motion is more certain if the RFI is observed simultaneously by multiple sensors. However, analysis from hundreds of RFI events indicates that when an RFI source is in motion, observations collected by a single sensor can provide sufficient information to determine that the RFI transmitter is in motion.
Continuing interest in understanding PPD effects on GPS receivers led to the installation of remotely accessible monitoring equipment that provides detailed characteristics of these devices. Remote access facilitates monitoring, particularly since PPDs are present for 30 to 60 seconds at a time and only a few times a day.
Background
The January 2010 deployment included a WAAS GPS receiver, spectrum analyzer, and a Zeta custom-developed Snapshot System, assembled from commercial off-the-shelf (COTS) equipment for conducting WAAS site-installation surveys, and capable of capturing intermittent short-duration RFI events. It consists of a tuneable receiver (10 MHz to 3 GHz) whose RF front end spans 25 MHz that is digitized at a sample rate of 56 MHz, with storage capacity sufficient for up to 80 minutes. Once captured, the time-series data can be analyzed in many different ways. Possible analysis techniques include examination of the raw time samples, generation of spectral plots, or demodulation of the RFI signal. Each approach can lead to a better understanding of the underlying interference signal. If digital data is present and can be demodulated, it might be possible to associate the demodulated bits with a known transmitter.
Data can be captured manually or programmatically using a trigger determined by an algorithm that monitors WAAS GPS receiver automatic gain control (AGC) logs. The AGC function within a WAAS receiver has a well-behaved response for normal Gaussian noise RF environments. When RFI is present, the AGC exhibits atypical responses that then trigger the Snapshot System. As WAAS receivers utilize both L1 and L2, and each RF path has its own AGC, it is possible to detect the presence of potential RFI at either L1 or L2.
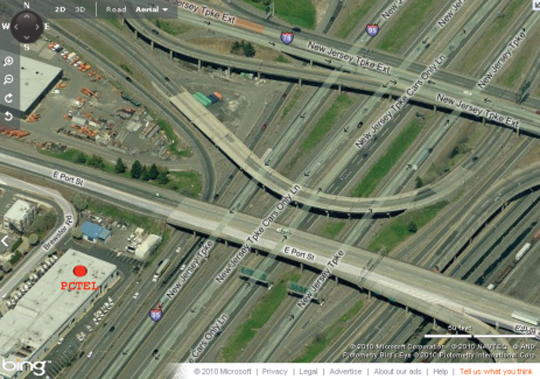
The Snapshot System RF input for this deployment was from a PCTEL antenna identical to those used at WAAS reference sites. This antenna incorporates a triplexer that provides three separate 40 MHz passbands each centered on L1, L2, and L5, with approximately 50 dB of gain. This antenna was located approximately one mile north of the four LAAS antennas within Port Authority of New York and New Jersey (PANYNJ) Building 80.
Within the first hour of being deployed on January 20, 2010 the Snapshot System had detected and captured one RFI event in the GPS L1 band. After one day, the Snapshot System had detected and captured more than 25 separate instances of RFI within the GPS L1 band. Most RFI events were narrowband (10s of kHz bandwidth) and short duration (no more than 3 seconds).
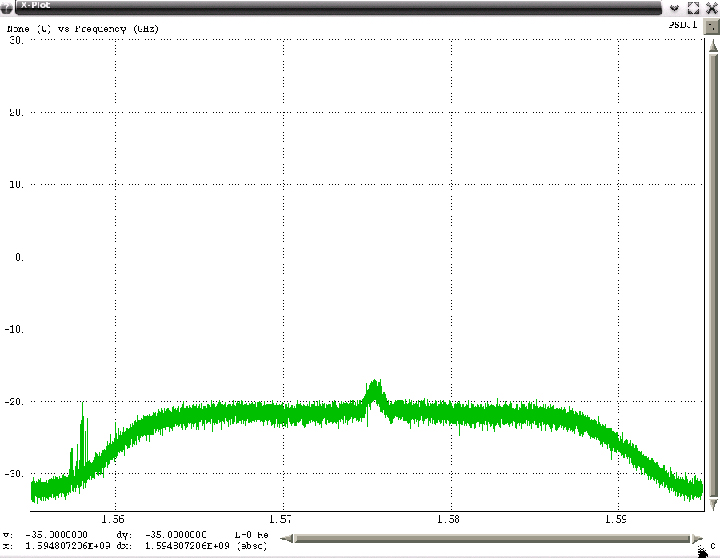
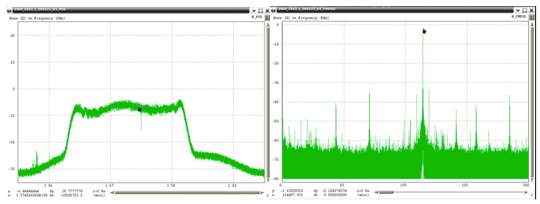
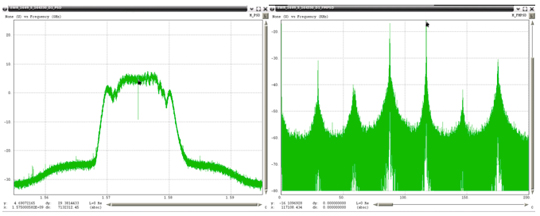
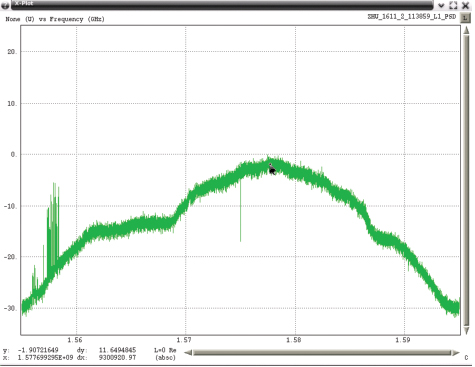
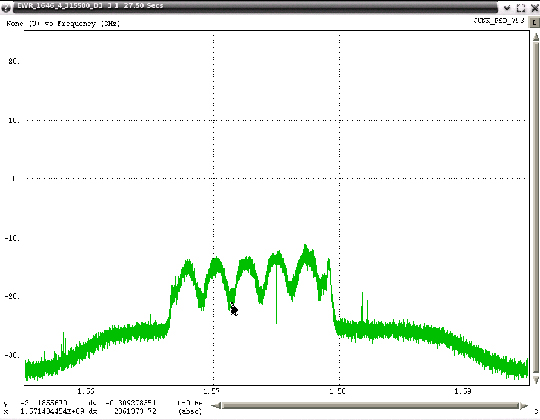
However, there also were five RFI events that spanned more than 15 MHz across L1 (Figure 1) were present as long as 20 seconds and at a power level as much as 25 dB above the receive antenna’s noise floor. Some of these RFI events were strong enough to reduce a WAAS G-II receiver C/N0 by as much as 20 dB and thereby resulted in loss of tracking for lower-elevation GPS satellites. Higher-elevation GPS satellites were able to continue tracking throughout these events but at a lower C/N0. The wideband RFI events were also detected by the SLS 4000 GBAS monitor and coincided with tracking problems in the LAAS GBAS receivers.
FIGURE 1. EWR wideband RFI.
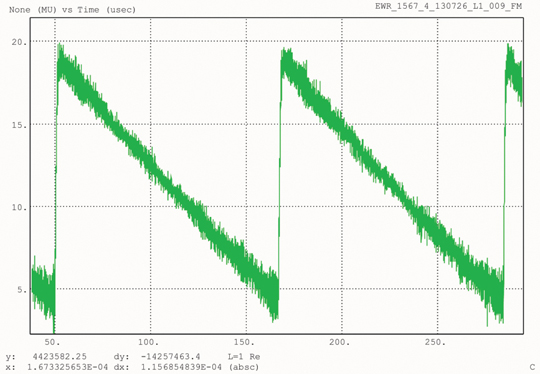
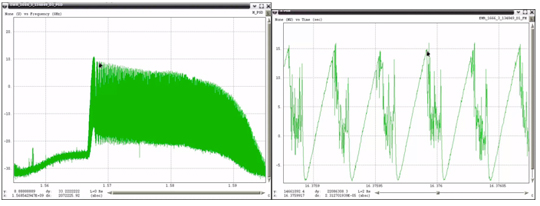
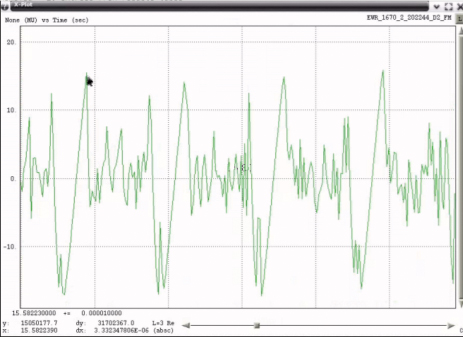
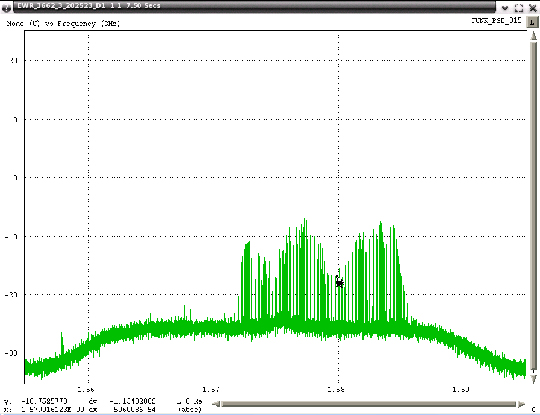
Two of the captured broadband RFI events were demodulated and analyzed. The underlying linear frequency modulation (FM) signal swept over more than 15 MHz in less than 1 millisecond (Figure 2).
FIGURE 2. FM demodulated wideband RFI.
At that time, it was not known if the source of the RFI was stationary or moving, whether it was unintentional (emanating from a licensed transmitter but with malfunctioning electronics), inadvertent (equipment normally used for test purposes and capable of operating in the GPS band but accidentally left on), or intentional (purposeful jamming of GPS).
Since the RFI was observed by GPS receivers separated by 1,700 meters, a search was undertaken to identify any other GPS receivers in the vicinity of EWR. One National Geodetic Survey (NGS) continuously operating reference site (CORS) NJI2 is located near EWR about 4,500 meters northwest from Building 80. Analysis of data from NJI2 during the same time periods that RFI was detected by the WAAS and LAAS receivers did not contain any indication of RFI, and therefore suggested that the source of RFI was more localized to EWR.
The Snapshot System remained in place for approximately two weeks before moving to another location. Collected data was analyzed, showing that wideband RFI was associated with significant degradation to both the WAAS and LAAS receivers. Additional characteristics noted the RFI was intermittent, lasting typically 30 seconds but no more than 60 seconds, was observed more often Monday through Friday, and most frequently around 8 a.m. local time.
Locating The RFI
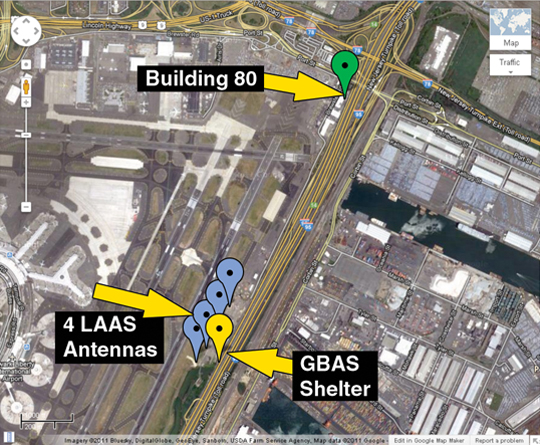
Figure 3 shows a Google map of EWR with blue dots indicating the location of the four LAAS antennas, a green dot for Building 80, and a yellow dot for the GBAS shelter. EWR is adjacent to the New Jersey Turnpike (NJT), which has seven southbound and seven northbound lanes of traffic.
FIGURE 3 Google map of EWR.
Since the Snaphsot System did not include location capability, other teams with direction-finding equipment, including beam-forming antennas, travelled to EWR to try to locate the RFI source. These teams were on site at various times from February to March. However, those efforts did not provide sufficiently reliable information to reduce the search area. By mid-March, the search area remained identical to that of January.
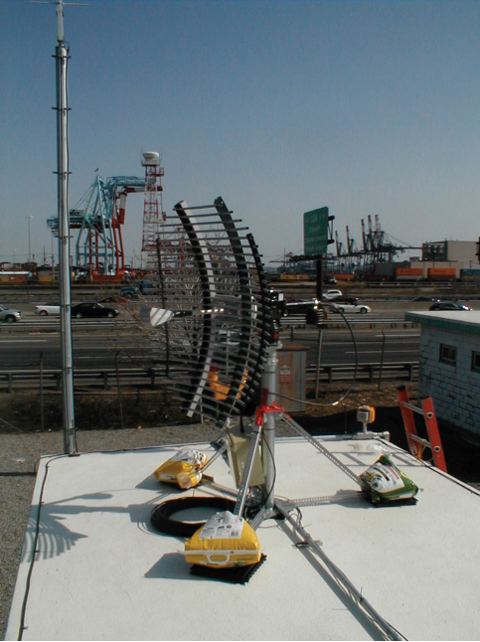
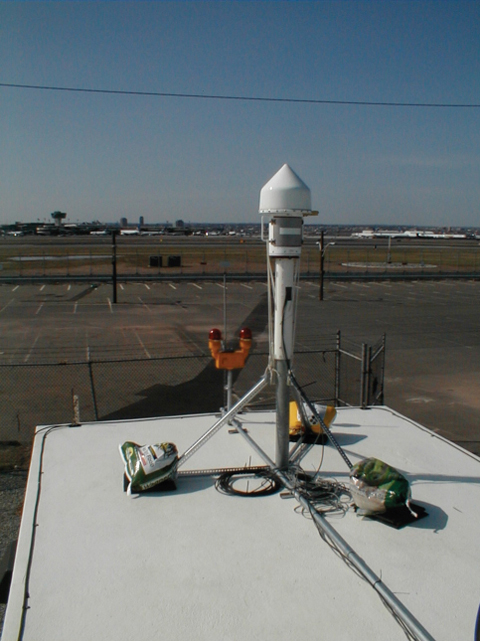
Zeta then deployed two WAAS G-II receivers separated by considerable distance (1,722 meters) to monitor for RFI, and analyze each receiver’s response only when RFI sufficient to significantly degrade GPS reception was detected. One receiver was located within Building 80, and the second receiver within the GBAS shelter near the LAAS antennas. This configuration was designed to determine degradation relative to each reference receiver and thereby establish probable search areas for the RFI emitter. The Zeta equipment also incorporated a rotating directional antenna (at the GBAS shelter shown in Figure 4) that was commanded to rotate only when significant RFI was detected.
FIGURE 4A. Antennas on roof of GBAS shelter.FIGURE 4B. Antennas on roof of GBAS shelter.
The expectation was that RFI would be detected simultaneously by both GPS receivers, and that the relative degradation in normalized C/ N0 would provide an indication as to which location lay in closer proximity to the RFI source. The rotating high-gain directional antenna would then indicate a reduced probable search area consistent with the relative degradation between the two receivers. At the time this equipment was deployed, it was still thought that the RFI was most likely stationary and high-power. However, the measurement results were quite different than expected. Subsequent data analysis from this equipment revealed that the RFI was low-power and moving, specifically moving along the NJT.
The Zeta equipment was deployed on March 19, 2010, and remained in place while operating automatically. On March 25, data collected during the previous week were analyzed. During this 1-week collection there were 11 instances when both receivers detected wideband RFI events and one antenna rotation even partially tracked one wideband RFI emitter. Such data was indicative of a non-stationary emitter, a finding that was quite significant. Based on data from the two receivers, the apparent velocity of the RFI emitters ranged between 45 miles per hour (mph) to 72 mph. Initial analysis of antenna-rotation data also indicated the RFI source was east of the GBAS shelter and moving south on the NJT.
Understanding the importance of degradations from both receivers was crucial in determining that the RFI has attributes of transmitting at low power and is moving. Had a single stationary RFI emitter been responsible for these observations, the degradations measured at each receiver would have occurred at essentially the same time, not 50 to 80 seconds apart. A high-power moving RFI emitter would also have produced degradations at both receivers at the same time, and since that was not observed, the conclusion was that the RFI emitter was relatively low in output power. Low-power RFI emitters will cause significant degradation to GPS receivers only when they are in close proximity to them, on the order of hundreds of meters.
Receiver data logs were processed specifically for degradation in normalized C/N0. Normalized C/N0 was only computed for those satellites above 20 degrees, and all of those results were averaged together. Prior knowledge regarding WAAS PCTEL antennas has established an expected C/N0 versus satellite elevation that is accurate to approximately ±1 dB with a nominal mean of 0 dB. This normalized C/N0 represents an average of all satellites in view. However, individual satellite signal strength can vary greater than ± 1 dB. Significant deviations of more than –3 dB are indicative of strong RFI within the GPS processing band. Normalized C/N0 was plotted for each day that data was collected, followed by expanding those time periods where significant degradation was present.
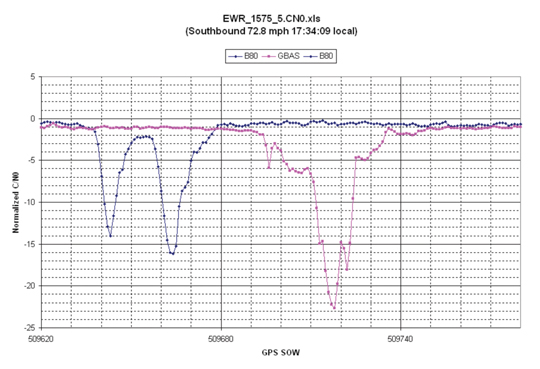
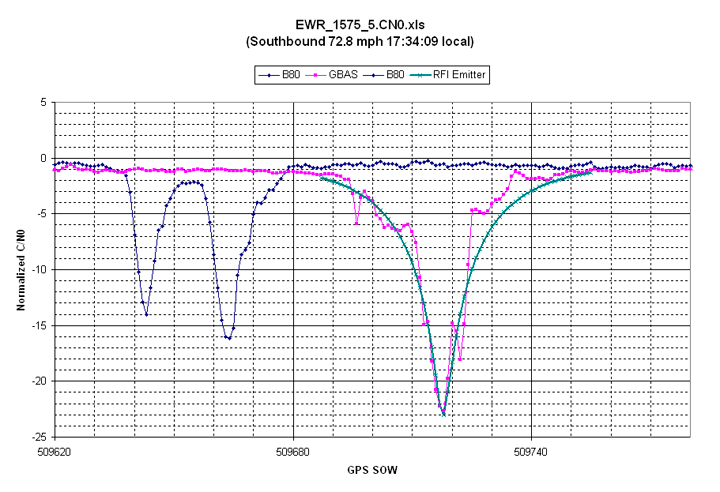
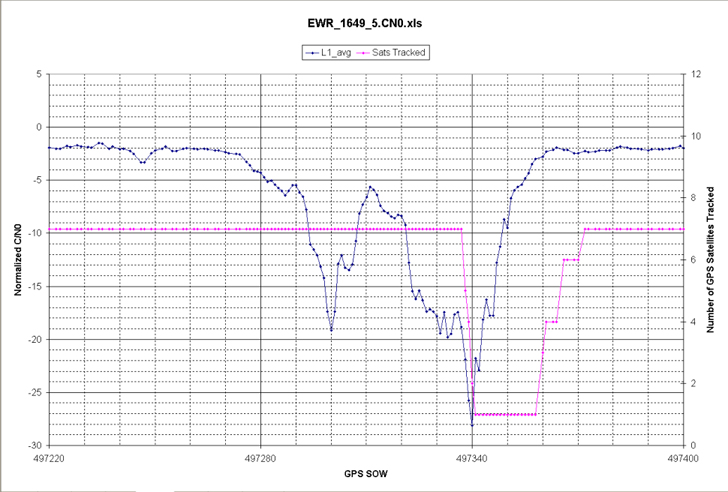
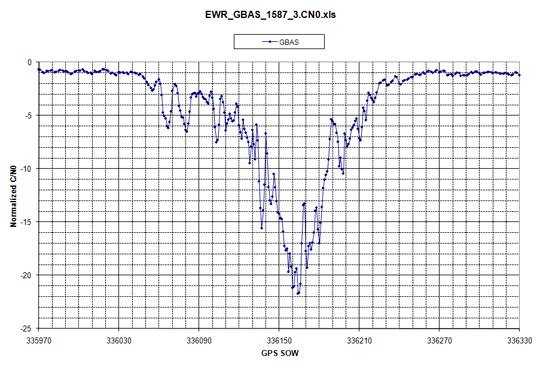
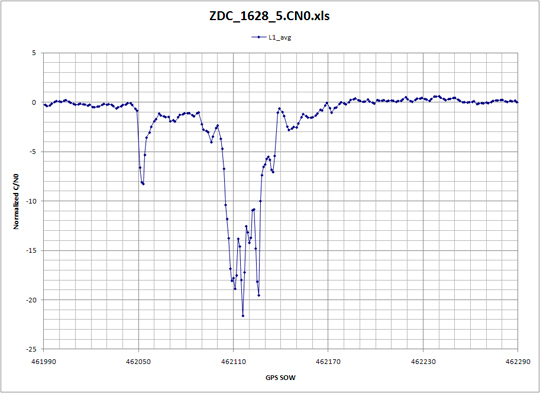
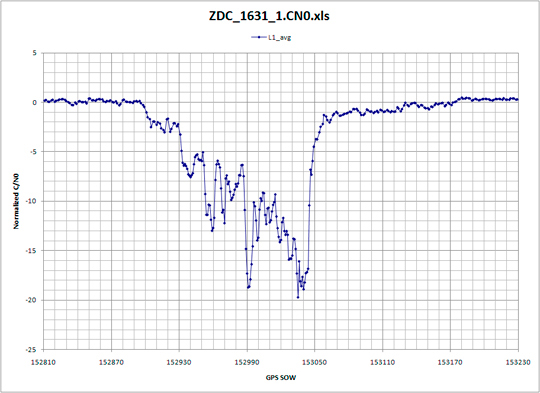
Figure 5 shows data of the first evidence of a low-power moving PPD. Data for Building 80 receiver is in blue and data from the GBAS shelter receiver in pink. Since Building 80 is north of the GBAS shelter, when degradations occurred first at Building 80, this implies that the RFI emitter is moving from north to south. Similarly, when degradations were first seen at the GBAS shelter, the RFI emitter was moving from south to north. This plot uses major time grids of 60 seconds and minor grids of 10 seconds.
FIGURE 5. Normalized C/N0 observed at Building 80 and GBAS shelter.
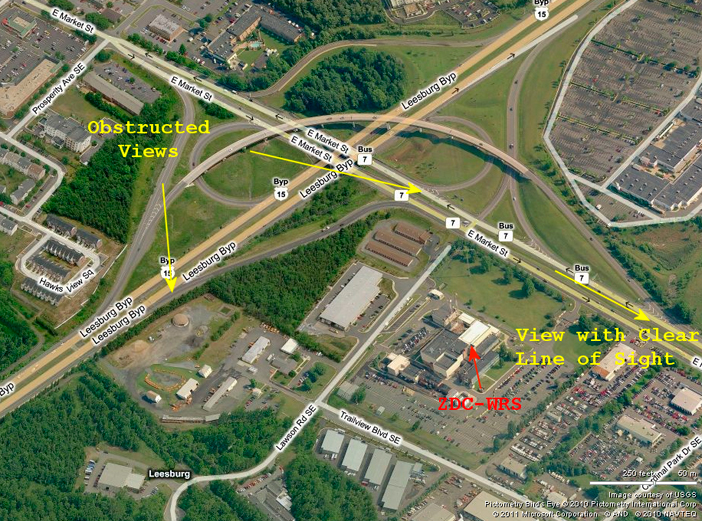
The double separate degradations observed by the Building 80 receiver have only been observed from monitoring equipment located at that building, and have since been associated with travel paths of PPDs on the nearby highways. Both GPS receiver and spectral data contain this same characteristic. This characteristic is due to the fact that vehicles traveling south on the NJT have clear line of sight to the roof of Building 80 (shown by Figure 6) before they travel under Interstate 78, after which they pass next to Building 80. During the time that they are under Interstate 78, their transmissions are blocked in the direction of the roof of Building 80.
FIGURE 6A. View of NJT near Building 80.FIGURE 6B. View of NJT near Building 80.
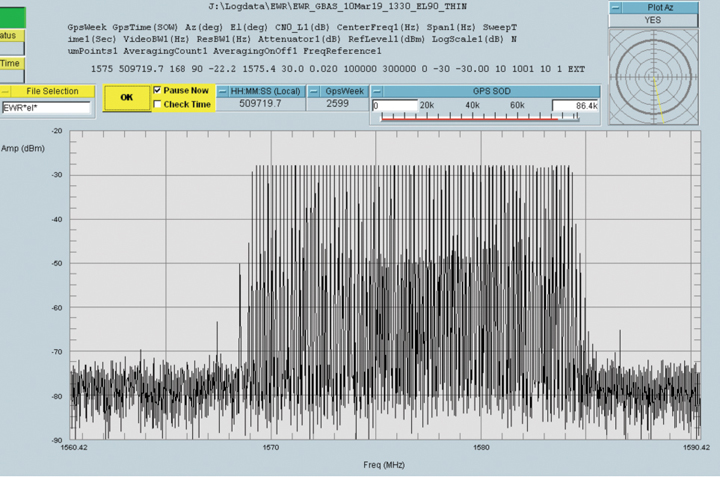
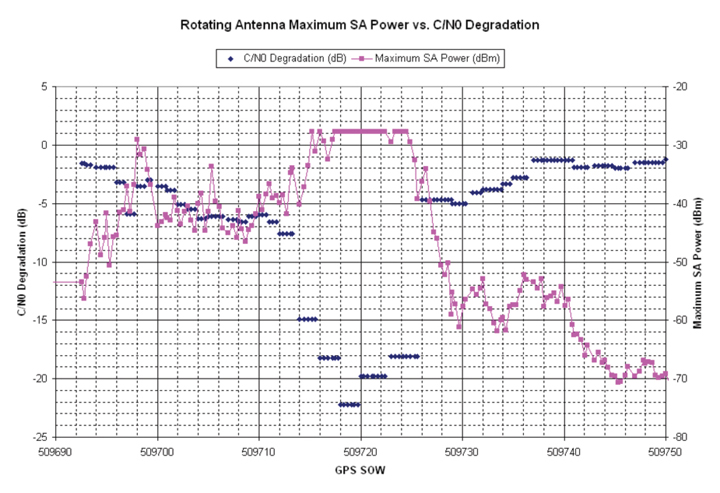
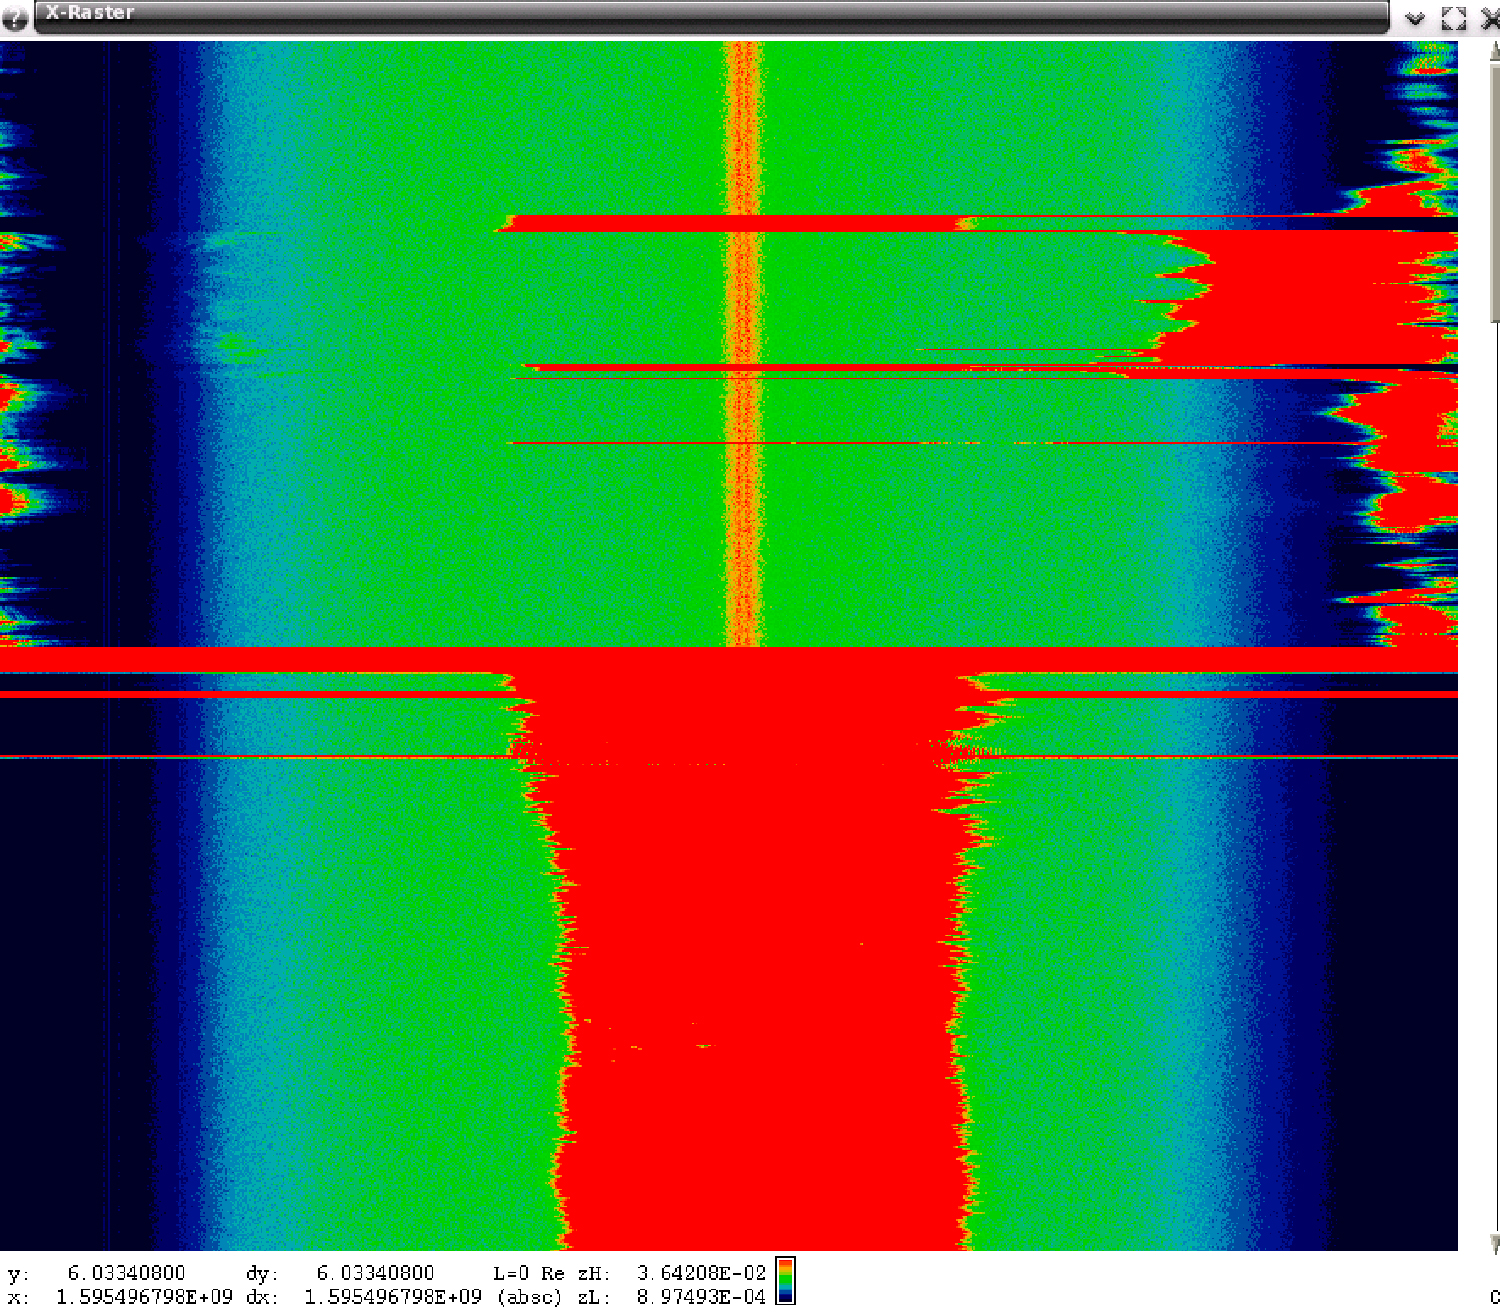
Spectral data as observed by the 4-foot reflector is shown in Figure 7. Figure 8 shows spectral maximum data as collected by the 4-foot linearly polarized reflector along with additional information.
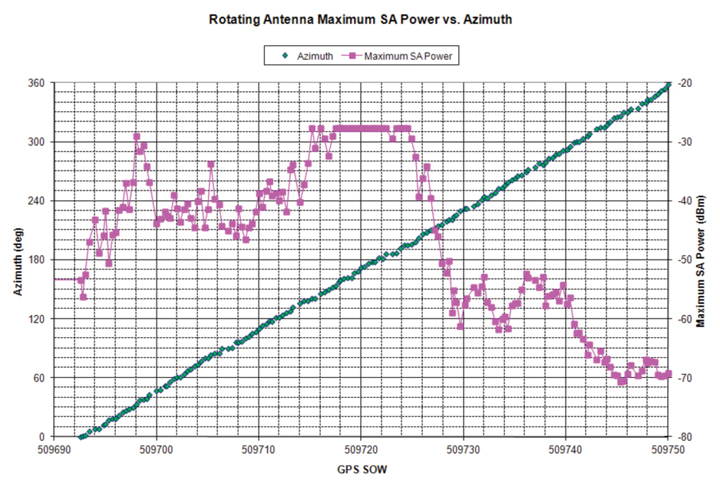
FIGURE 7. Wideband RFI observed by 4-foot reflector (click to enlarge.)FIGURE 8A. Pink represents spectral maximum data as observed through the reflector, green represents the azimuth of that antenna, and blue the reported degradation of the GBAS shelter receiver.FIGURE 8B. Pink represents spectral maximum data as observed through the reflector, green represents the azimuth of that antenna, and blue the reported degradation of the GBAS shelter receiver.
When the GBAS shelter receiver at first detected RFI, the reflector began rotating from an azimuth of 0 degrees in a clockwise direction. At the same time, a spectrum analyzer began capturing spectra at a rate of 3 per second. The first spectral maximum was observed at an azimuth of 30 degrees, a direction in which the antenna was pointed towards the NJT, to a location approximately 900 meters away from the GBAS shelter. The next time spectra were at high levels occurred for azimuths between 145 to 195 degrees, or southeast of the GBAS shelter. The approach of using a rotating antenna was originally intended to provide a direction towards a stationary source and not to track a moving emitter. However, it appears that to some extent, the rotating antenna in fact did track a moving emitter from north to south.
On the afternoon of the day these results were communicated to the FAA lead for the EWR RFI investigation, all search activities were shifted to the NJT and away from the airport operating area. Just south of the GBAS shelter there is an official-use overpass that straddles the NJT. All detection equipment was positioned onto the overpass, under the hypothesis that the RFI was emanating from vehicles traveling the NJT. Evidence substantiating this initial finding was found within a day, and approximately one month later a concerted effort was undertaken to identify and stop a single vehicle that was using a PPD.
The Zeta equipment remained in place for many months and continued to provide additional evidence of PPD characteristics. Early in the investigation it was hoped that only a few PPDs had been responsible, but as more data was collected it became evident that many different types of PPDs were traveling along the NJT past EWR.
Modeling PPD Effect
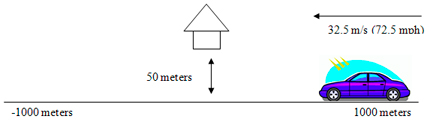
Once it was realized that the RFI was from low power moving emitters, a simple model was used to predict their degradation effect on WAAS GPS receivers. The model shown in Figure 9 was used for the purpose of computing distance between the RFI emitter and a WAAS antenna and to then compute the additional level of interference noise power that the WAAS antenna would receive. Here, the WAAS PCTEL antenna is located 50 meters from a road that is 2000 meters long and straight and has an RFI emitter transmitting +25 dBm, moving at 32.5 meters per second (72.5 mph) and with clear line of sight to the WAAS antenna.
FIGURE 9. Simple model of moving emitter.FIGURE 10. Model of normalized C/No due to a PPD.
With these assumptions it is a simple matter to compute the additional noise power at the WAAS antenna. Non-coherent summation of the RFI noise and inherent system noise was used to compute the total noise power and therefore the additional degradation in C/N0. The resulting predicted degradation was overlaid on one of the actual RFI events and is shown as a green line in Figure 10. The predicted degradation closely resembles actual event data logged by receivers.
The shape of degradation in normalized C/N0 versus time has been observed in nearly all of the EWR RFI events that have been analyzed. The magnitude of degradation depends on the power of the RFI and its proximity to the GPS antenna, while its time duration depends on the velocity of the vehicle carrying the PPD. The shape is directly related to the distance versus time between the vehicle and the WAAS antenna. Faster/slower moving vehicles with PPDs will simply shrink/stretch the time scale. Curved roadways would have different shapes that could also be readily predicted.
CORS data was revisited after realizing that PPDs were traveling the NJT. Specifically, two CORS sites CTDA (70 meters from Interstate 95) and NJDY (380 meters from Interstate 95) were identified. Data from those two sites were analyzed for a couple of weekdays. Possible evidence of PPDs was found within that data. Reported Signal to Noise Ratio (SNR) from CTDA and NJDY contained variations similar to those observed by GPS receivers at EWR during times when PPD induced RFI has been detected.
Continued RFI Monitoring
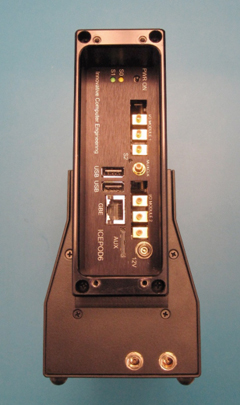
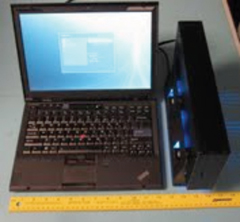
The LAAS program desired continued monitoring of RFI from PPDs near EWR, including estimates of their effective isotropic radiated power (EIRP). Additional equipment was assembled to provide this capability and installed on March 3, 2011. This monitoring equipment is located within the GBAS shelter at EWR and comprises several COTS components that incorporate improvements beyond the first Snapshot System used at EWR. Improvements include an upgraded Snapshot System (Figure 11), an RHCP directional antenna, and a wireless modem that provides remote access to the monitoring equipment.
Figure 11A. Snapshot System ICEPOD6-M5.FIGURE 11B. Snapshot System laptop.
Remote access makes it possible to analyze captured RFI data from any computer connected to the Internet, and to modify software if necessary. The new equipment configuration, specifically the use of an AEL AST 1507AA RHCP antenna, was chosen with the explicit purpose of establishing more accuracy in estimated EIRP.
Analysis of data collected during 2010 indicated three significant sources of error in estimating EIRP; Free Space Loss (FSL) from not knowing the exact position of the PPD on the NJT, polarization mismatch loss between the PPD antenna and the receive antenna, and the effects due to transmission from within a vehicle. Differences in FSL loss between the closest southbound lane on the NJT and the most distant northbound lane is on the order of 11 dB. If it is known that the PPD is traveling south, the difference in FSL between the nearest to farthest southbound lanes is less but still about 6 dB. FSL differences for northbound lanes are smaller, on the order of 3 dB. Knowing the direction of travel reduces this uncertainty but does not eliminate it. The WAAS PCTEL antenna is RHCP, but at the horizon has an axial ratio of approximately 5 dB. Many PPDs appear to be using quarter wavelength dipole antenna that are mounted with a rotatable connector. Assuming all PPD antennas are linearly polarized, there would then be an uncertainty of about 5 dB when using data observed by the WAAS PCTEL antenna. The AEL antenna has an axial ratio of 0.2 dB at L1 and significantly reduces uncertainty of polarization mismatch loss. Even though the AEL antenna has a 3 dB mismatch loss, that loss has an uncertainty of 0.2 dB for any orientation of the PPD antenna. The PCTEL antenna has a symmetric gain response relative to the NJT. The AEL antenna was pointed to the north intentionally so that observed RFI power will be stronger when a PPD is north of the GBAS shelter. Simultaneous capture of real time samples from both antennas by the ICEPOD6-M5 provides an indication of the direction in which the PPD is traveling. The third uncertainty comes from the effects of the PPD being located within a vehicle. Vehicular effects on the PPD transmitters were not accounted for due to difficulty in using a simple model. Aloi [1] has measured vehicular effects of quarter wavelength dipole antenna (typically used by PPDs) and has previously published [1] [2] on the effect of vehicles on GPS signals. His most recent findings have not yet been published but indicate that the type of vehicle, the location of a dipole antenna within it, and the position outside of the vehicle from which power is being measured, can lead to significant variation (10 to 15 dB) of the observable power. Consequently, the reported EIRP estimates from the Snapshot System have been referenced to a point just outside the vehicle and do not attempt to account for vehicular effects.
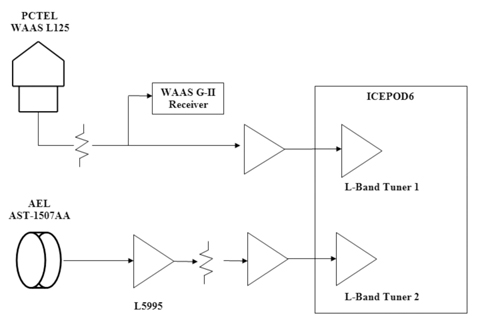
Figure 12 shows a block diagram of the current monitoring equipment. The PCTEL antenna along with the WAAS G-II receiver is used for monitoring GPS signals. WAAS G-II receiver logs are monitored continuously and saved to disk, but snapshots are only taken if the RFI algorithms indicate that RFI is present. A snapshot will be taken if any of three tests (based on AGC, normalized C/N0, or spectral power) are exceeded. Narrowband RFI tends to most impact the AGC response, while wideband RFI tends to trigger the normalized C/N0 metric. Since the Snapshot System is also continuously monitoring the RF spectra from both antennas, an additional test checks if there are significant spectra changes.
FIGURE 12. Current Snapshot monitoring block diagram.
The AEL antenna is connected to a filter/low noise amplifier (LNA) (Delta Microwave L5995) identical to those within the PCTEL antenna, before it is connected to one of the two L-band tuners (900 to 2200 MHz) of the ICE-Online ICEPOD6-M5, which includes 1 TB of long-term storage and 8 GB of high-speed RAM and is capable of sustained data transfers of as high as 400 MB/s between the L-band tuners and disk. Sample rates and RF filtering are programmable and have been set to use a complex sample rate of 40 MSPS and an RF bandwidth of 30 MHz. When RFI is present, data transfers are 320 MB/s. The internal 1 TB disk can store approximately 100 minutes of RFI. Software parameters limit RFI data capture for any single event to no more than 90 seconds. Implementation of a circular buffer within the high-speed RAM (8 seconds for each L-band tuner path) allows continuous capture of RF data while waiting for a trigger indicating that RFI is present. To reduce false alarms, RFI must be present for at least 4 seconds before data is captured. However, no RFI data is lost, because the circular buffer is longer than 4 seconds. RFI data captures typically contain 3 seconds of data at the beginning, with no RFI, and therefore make it possible to observe the onset of the RFI.
The new equipment has captured hundreds of RFI events, spanning a wide range in bandwidth (7 MHz to an estimated 150 MHz), chirp rate (9 kHz to 170 kHz), and power levels (–10 dBm to as much as +20 dBm). Accurately estimating EIRP of moving emitters is a challenge and requires detailed knowledge of the characteristics of all components used in generating the estimate. Furthermore, distance to the RFI source can only be inferred, since its movement precludes exact measurement, and consequently there will always be some uncertainty in any reported EIRP. However, even with these qualifications, there is evidence from Snapshot System data that some of the RFI sources are transmitting at power levels as much as +20 dBm.
Modeling Antenna Responses
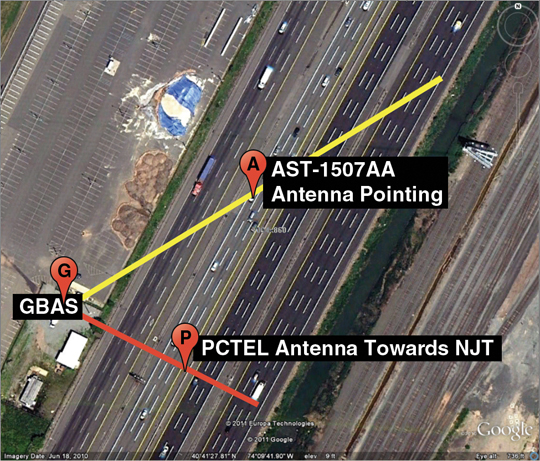
The use and orientation of the two antennas was chosen to determine the direction that PPDs are traveling and thereby reduce some of the uncertainty with respect to their exact location. Figure 13 shows the direction (58 degrees) in which the AEL antenna is pointed.
FIGURE 13. Pointing direction of the AEL antenna.
The combination of its beam width (70 degrees) and axial ratio (0.2 dB) results in a nearly uniform gain across all lanes north of the GBAS shelter. Although FSL still depends on the exact location of the PPD, this approach does reduce many of the uncertainties associated with estimating EIRP. Since the PCTEL antenna has an omnidirectional pattern it will have a symmetrical response.
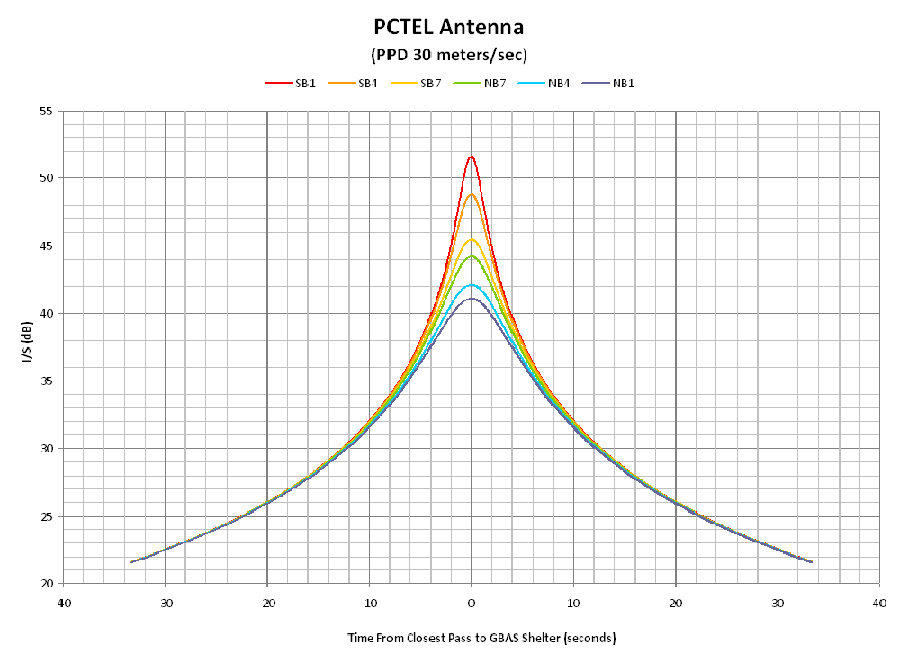
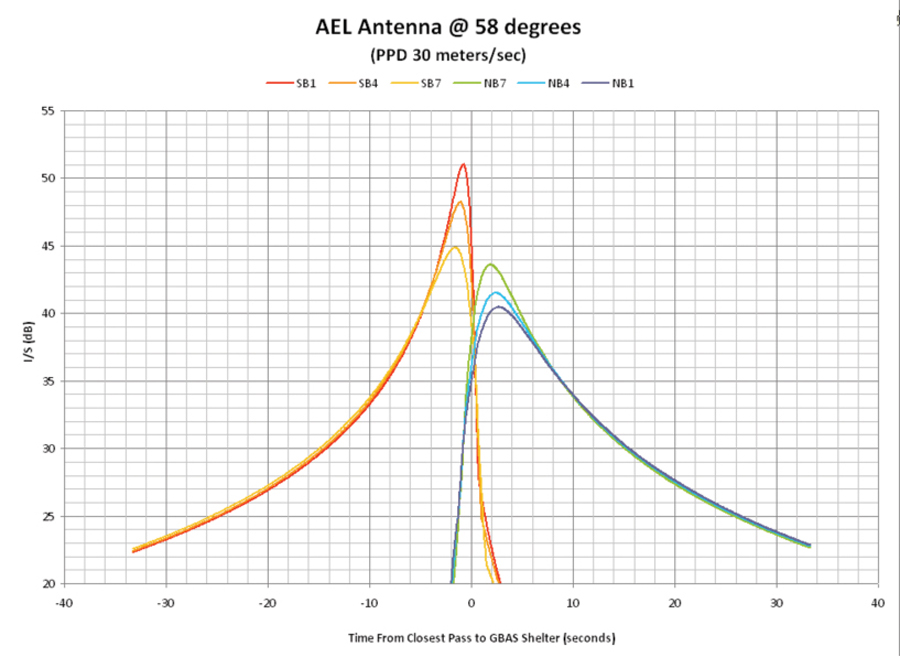
To determine the time that maximum PPD power would be observed by each antenna, a model was used that assumed the PPD was transmitting at constant power, with fixed polarization, travelling at a constant velocity, and there were no obstacles between the transmitter and each antenna. FSL was calculated for each second of travel and used to determine the magnitude of RFI power that would be received. This value was then used to calculate a nominal Interference to Signal (I/S) relative to the GPS signal. The distance between each antenna and each of the travel lanes on the NJT were also used. The intent of this model was to understand how I/S would vary with time for each of the NJT travel lanes. Figure 14 shows the predicted I/S for the PCTEL antenna and Figure 15 for the AEL antenna. In each of these plots red, yellow and orange represent 3 of the 7 south bound travel lanes and green, blue and purple represent 3 of the 7 north bound travel lanes. A time of 0 was used for the time when the PPD is nearest physically to the GBAS shelter. A nominal velocity of 30 meters/second (67 MPH) was used for the PPD and I/S was computed for 30 seconds before and after its closest approach (± 900 meters north and south of the GBAS shelter). If the PPD travels slower than 30 m/s then the following curves would be wider for the same times. Similarly, if the PPD travels faster, these same curves would be narrower.
FIGURE 14. Predicted I/S for PCTEL antenna (click to enlarge.)FIGURE 15. Predicted I/S for AEL AST-1507AA (click to enlarge.)
Modeling of the AEL antenna took into account its pattern and orientation. It has less gain towards the south, and consequently observed power from a PPD located south of the GBAS shelter is much less. A southbound PPD will initially be within the main beam of the AEL antenna; therefore the expected interference to signal ratio (I/S) will gradually increase until it passes to the south of the GBAS shelter. Similarly, a northbound PPD will not exhibit significant I/S until north of the GBAS shelter. Figure 15 indicates that the maximum I/S occurs within 2 seconds of the point where the PPD is closest to the GBAS shelter. Typical GPS receivers can tolerate an I/S of 30 dB for CW type signals.
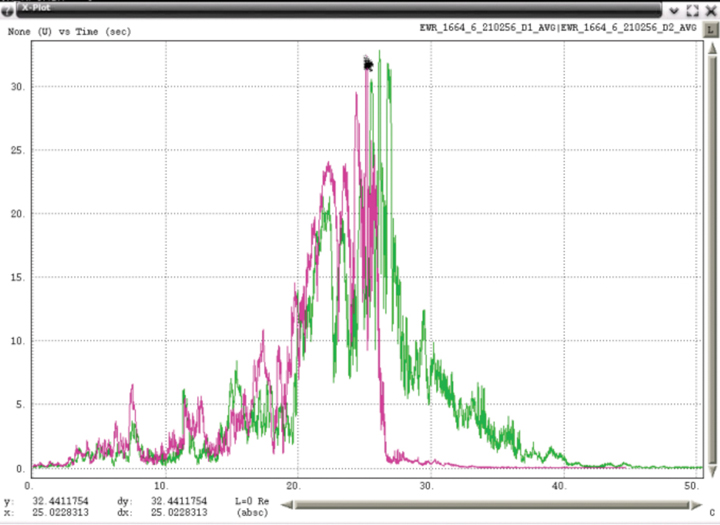
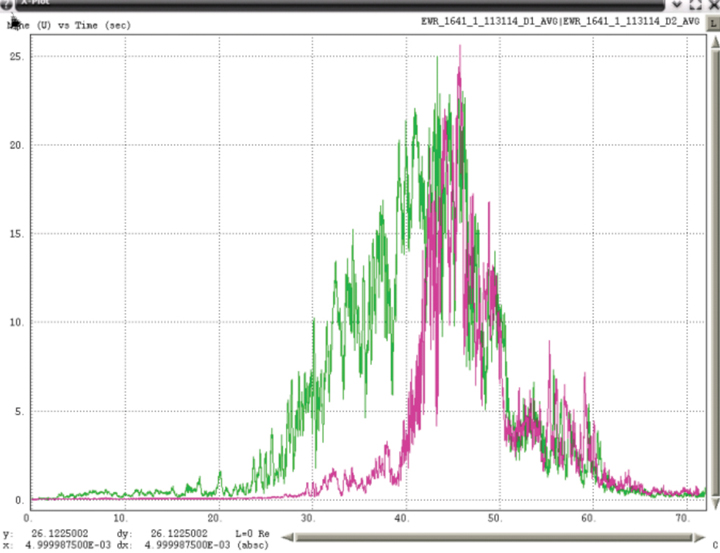
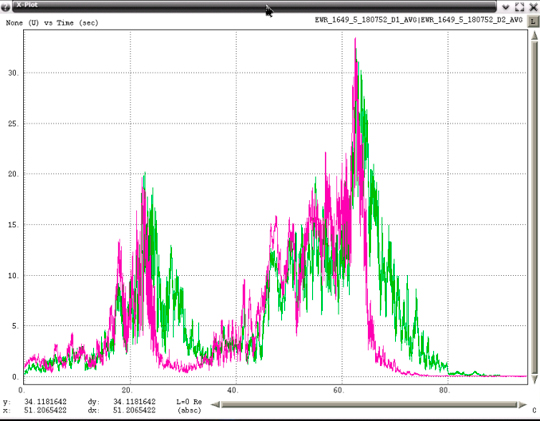
Processed RFI data does display some of these characteristics but with some important differences. PPD power was measured once every millisecond using Snapshot System data and total power within the bandwidth of that PPD was calculated. Total power from both the PCTEL (green) and AEL (pink) antennas were then plotted together with one example for a southbound PPD in Figure 16 and a northbound PPD in Figure 17.
FIGURE 16. RFI Power of southbound PPD (click to enlarge.)FIGURE 17. RFI Power of northbound PPD (click to enlarge.)
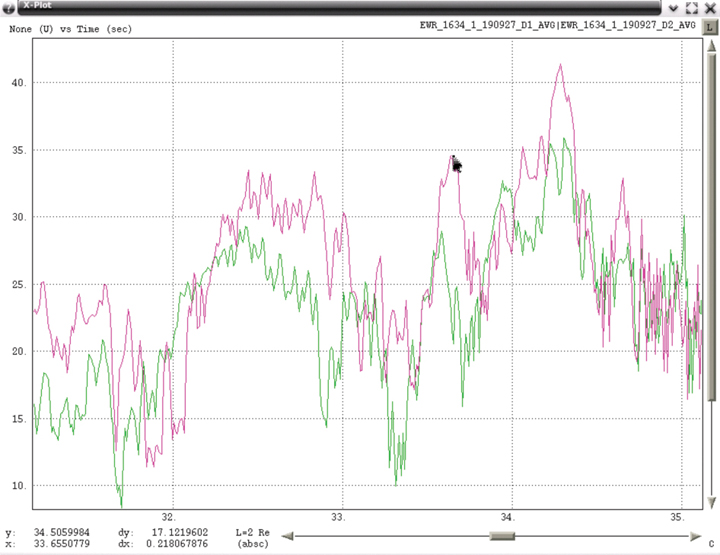
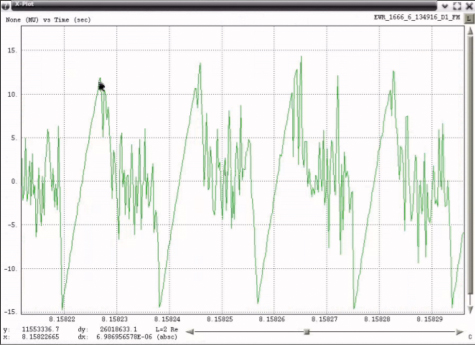
Although the envelope of the measured average power tends to have the shape that modeling predicts, there are significant variations over short periods of time. Figure 18 expands a portion of one example and indicates that RFI power varied by more than 17 dB in 0.2 seconds. Examination of spectral data for time intervals of less than one second frequently contains significant changes in observable power. Swept CW from PPDs should exhibit relatively flat RF spectral power, but typical observed spectra include sloping across the band and notches. Possible explanations for these observations include: blockage and diffraction from other vehicles near the one containing the PPD, multipath from other vehicles on the NJT, and the effect of transmitting from within a vehicle. Although some of the snapshot captures exhibit smooth power variation similar to predicted, the vast majority of the hundreds of snapshots exhibit significant variations in power.
FIGURE 18. RFI Power of southbound PPD (expanded).
Examples of Observed PPDs
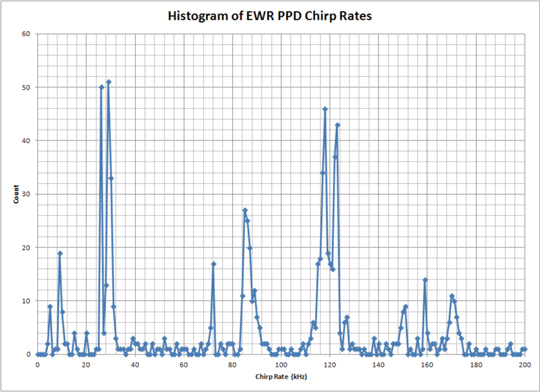
The variety of PPDs observed by the updated EWR monitoring equipment has been surprising. Within its first month of operation, more than 40 PPDs were observed with no less than 19 from unique and different PPD transmitters. Classification of PPD transmitters is based on the combination of RF spectra and the spectrum of the FM demodulated data. Although the observed PPD transmitters use a linearly swept FM sawtooth, most contain deviations from a pure linear sweep. Figure 19 shows examples of FM demodulated time series. Rather than attempting to uniquely describe the attributes of each type of deviation, it is simpler to compute the spectrum of the FM demodulated data. The fundamental frequencies of chirp rates that have been observed have spanned 9 kHz to 170 kHz. Figure 20 shows a histogram of chirp rates observed near EWR and indicates that the most frequent rates have been 9, 26, 29, 72, 85, 118, 123, 159 and 170 kHz.
FIGURE 20. Histogram of EWR PPD chirp rates.
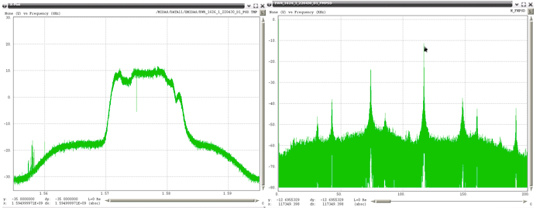
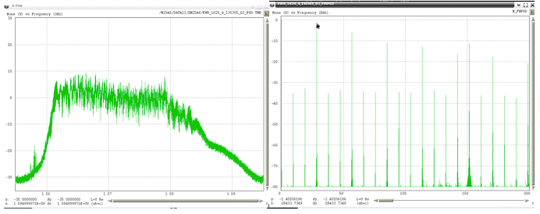
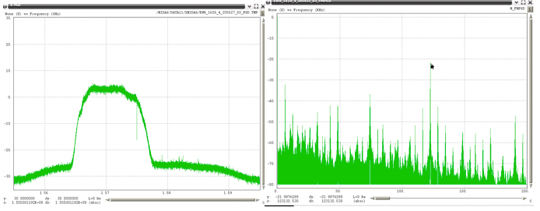
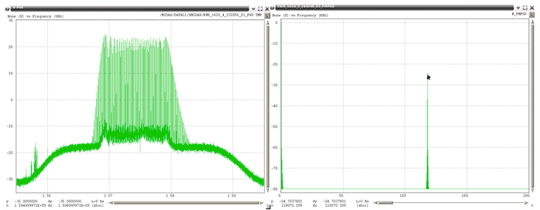
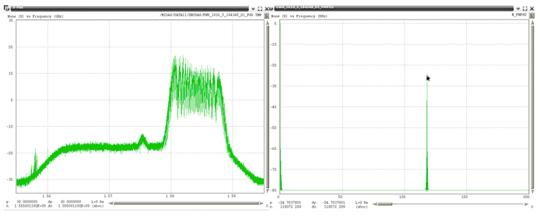
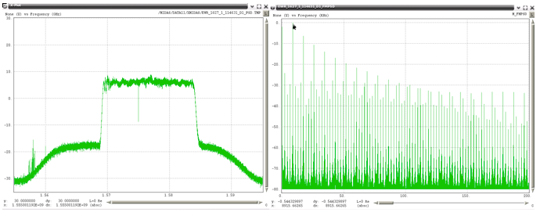
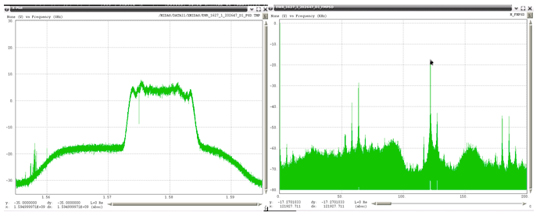
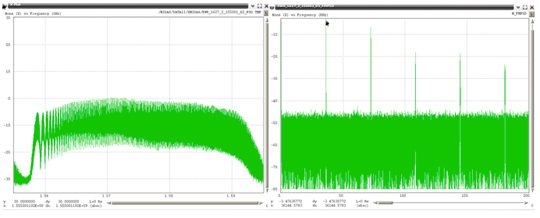
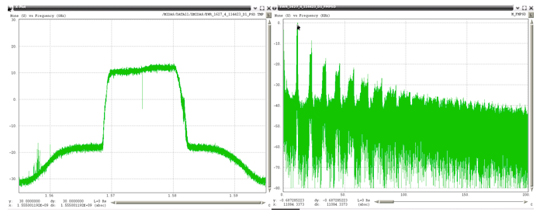
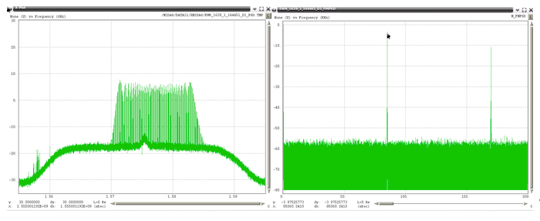
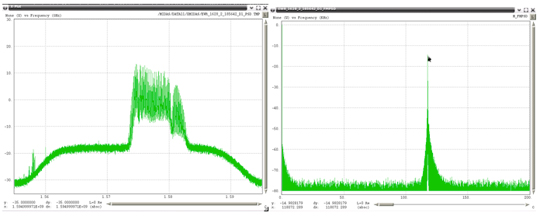
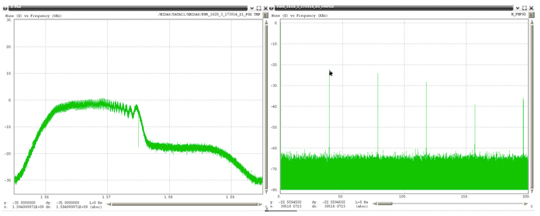
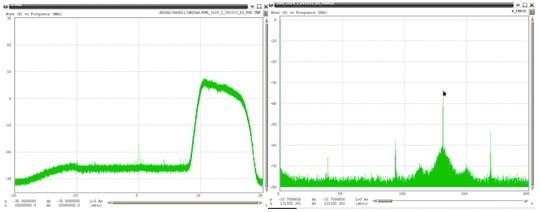
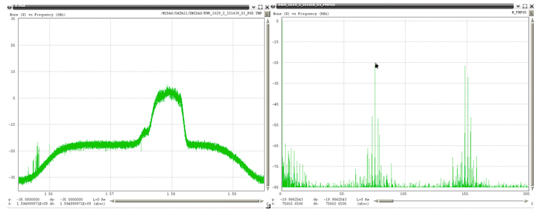
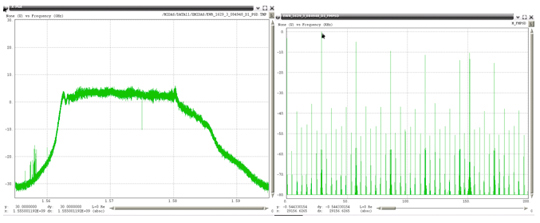
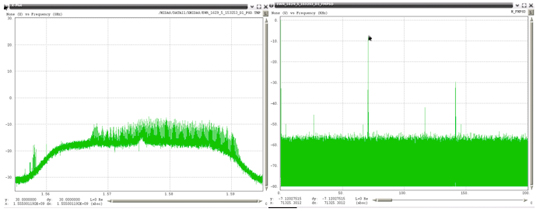
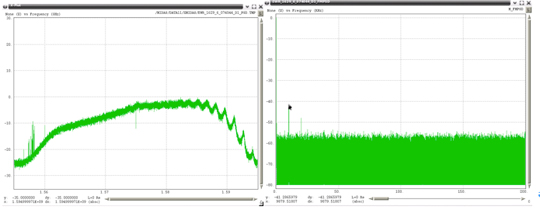
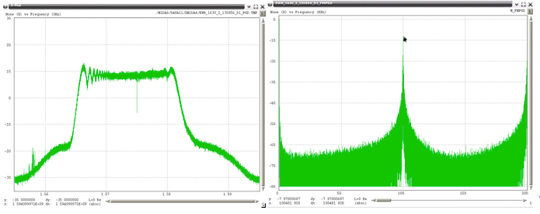
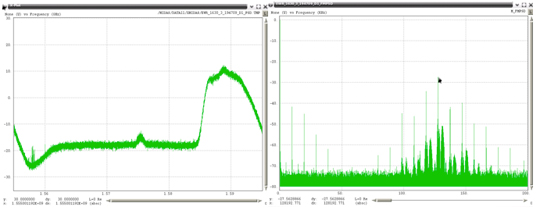
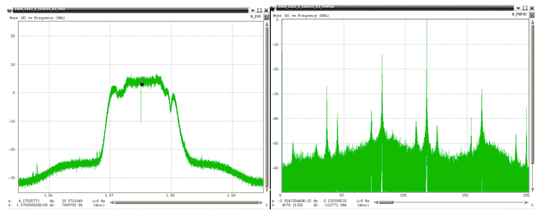
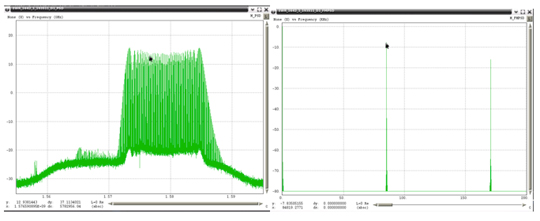
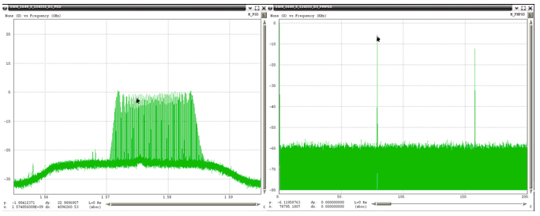
Examples of the 19 unique PPDs (detected within one month) are shown in Figure 22 through Figure 40, with the RF spectrum shown on the left, and the spectrum of the FM demodulated shown on the right. In each of these plots the scaling for the RF spectra is identical, spanning 40 MHz centered on 1575 MHz with a vertical scale using 10 dB per grid. All of the FM demodulated spectra use a horizontal axis that spans 0 to 200 kHz. For references purposes Figure 21 shows the RF spectra when no RFI is present.
Some of these PPDs were transmitting at power levels (observed by the PCTEL antenna) as much as 40 dB above the LNA noise floor. Most spectra were not centered symmetrically about L1 with some completely outside the mainlobe of the GPS C/A code. A few were transmitting outside the programmed 40 MHz bandwidth of the Snapshot System (1555 to 1595 MHz). For those PPDs transmitting outside this band, estimates were made of the upper or lower frequencies using the linear slope of the FM demodulated data, and then extrapolating that slope based on the chirp interval.
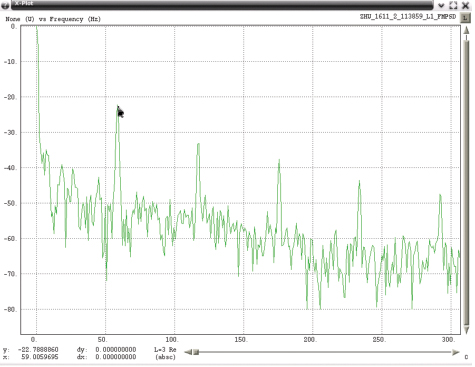
Some of the FM demodulated spectra contain a single spectral line that indicates the waveform modulating the RF has a very linear sweep. Most contain additional harmonic lines about the major component and a few appear to have bandwidth about their main spectral component. The current hypothesis is that many of these devices are poorly shielded and that the internal oscillator used to modulate the RF is affected by other nearby signals that are then appearing at the RF output. Some of the possible sources could be circuits that are within the device itself but there is some evidence that a few of these devices are susceptible to energy external to the PPD. A Snapshot System located near Houston International Airport (ZHU) has captured data from PPDs that contain strong components at 58.7 Hz in addition to its linearly swept 97 kHz waveform. Since this frequency is sufficiently different from utility AC power sources (60 ± 0.03 Hz), it has been hypothesized the vehicle carrying that PPD, also has a power inverter. Most power inverters are specified to provide a frequency output of 60 ± 3 Hz. Figure 32 shows a spectral notch that was present at that single frequency throughout the complete capture and suggests that that particular device may have had an impedance matching problem in its transmission path.
FIGURE 21. Spectra with No RFI Observed by PCTEL (click to enlarge).FIGURE 22. 1570 to 1583 MHz, Chirp 117.35 kHz.FIGURE 23. 1556 to 1583 MHz, Chirp 28.43 kHz.FIGURE 24. 1565 to 1578 MHz, Chirp 123.13 kHz.FIGURE 25. 1568 to 1583 MHz, Chirp 111.08 kHz.FIGURE 26. 1578 to 1589 MHz, Chirp 118.07 kHz.FIGURE 27. 1568 to 1584 MHz, Chirp 8.92 kHz.FIGURE 28. 1572 to 1584 MHz, Chirp 121.93 kHz.FIGURE 29. 1557 to 1622 MHz, Chirp 36.14 kHz.FIGURE 30. 1568 to 1582 MHz, Chirp 11.08 kHz.FIGURE 31. 1570 to 1585 MHz, Chirp 85.06 kHz.FIGURE 32. 1572 to 1582 MHz, Chirp 118.07 kHz.FIGURE 33. 1529 to 1577 MHz, Chirp 39.52 kHz.FIGURE 34. 1578 to 1594 MHz, Chirp 131.33 kHz.FIGURE 35. 1575 to 1582 MHz, Chirp 75.66 kHz.FIGURE 36. 1561 to 1586 MHz, Chirp 29.16 kHz.FIGURE 37. 1568 to 1592 MHz, Chirp 71.33 kHz.FIGURE 38. 1560 to 1595 MHz, Chirp 9.88 kHz.FIGURE 39. 1564 to 1582 MHz, Chirp 100.48 kHz.FIGURE 40. 1584 to 1599 MHz, Chirp 128.20 kHz.
A few snapshots have also provided evidence that some of the PPDs are erratic and probably not functioning as their manufacturer intended. Figure 41 contains a raster of 6 seconds of spectral data that shows a PPD whose output was meant to be between 1560 and 1580 MHz but for short periods of time was transmitting at frequencies above 1580.
FIGURE 41. Spectral Raster, PPD with Unstable Output.
Remarks on Additional PPDs
Since April 2011 the Snapshot System has captured many additional and different PPDs. No effort has been carried out to catalog all of the different types that have been observed but the following describes interesting and notable PPDs.
Figure 42 shows characteristics of a PPD that has had estimated EIRP approaching +20 dBm, to a point just outside the vehicle, and has also been associated with GPS receiver C/N0 degradation of more than -27 dB, strong enough to cause the WAAS receiver, located at the GBAS shelter, to lose lock on all GPS satellites for a short period of time.
FIGURE 42. 1568 to 1582 MHz, Chirp 118 kHz
Figure 43 shows a PPD that is one of the most frequently observed PPDs but that has not been associated with any significant degradation to the GPS receivers. Estimated EIRP for these PPDs has been on the order of no more than +10 dBm. One device with similar characteristics was procured and its measured power at the antenna output port was no more than +14 dBm. Marketing information on the internet for that PPD specified its output power as +25 dBm.
FIGURE 43. 1572 to 1589 MHz, Chirp 85 kHz.
Figure 44 shows a PPD that is transmitting at both L1 and L2. The EWR Snapshot System has been configured to only capture snapshot data at L1 due to the fact that LAAS only uses L1. However, the WAAS receiver used to monitor for RFI is a dual frequency receiver that on occasion has indicated simultaneous RFI at both L1 and L2. Even though the EWR Snapshot System has not captured data at L2, the simultaneous presence of both L1 and L2 RFI, provides strong circumstantial evidence that this RFI source was transmitting on both frequencies. A Snapshot System monitoring the WAAS Reference Station (WRS) at Leesburg Virginia has captured simultaneous L1 and L2 RFI events. Demodulation of that data indicated the two RF outputs had similar modulation but the demodulated data was not coherent. Therefore, that PPD was probably using individual, but similar waveform generators, for each RF output.
FIGURE 44. 1562 to 1583 MHz, Chirp 114 kHz.
Almost all PPDs have been observed individually. However, there have been at least three times in the last two years when two unique PPDs have been observed within 60 seconds of each other. Figure 45 plots normalized degradation in C/N0 while Figure 46 plots snapshot measured power for the same RFI event. Analysis of snapshot data for each of the times that had strong RFI power are shown in Figure 47 and Figure 48 and confirmed that there were in fact two unique PPDs observed approximately 40 seconds apart. Both were traveling south on the NJT and approximately 1200 meters apart.
FIGURE 45. Normalized C/N0 August 19, 2011FIGURE 46. Snapshot Power August 19, 2011.FIGURE 47. C/N0 -19.0 dB, Chirp Rate 78.97 kHz.FIGURE 48. C/No -28.0 dB, Chirp Rate 117.24 kHz.
Most of the observed RFI events last for no more than 50 seconds although a few that lasted much longer have been correlated with slow traffic on the NJT. Figure 49 is from June of 2010, before the updated monitoring equipment was in place, and displays normalized degradation of C/N0. The time duration for which this RFI was observed was more than 3 minutes and was during a time when traffic was ‘slow’ on the NJT.
FIGURE 49. June 9, 2010, PPD, Estimated Velocity 10 m/s.
Very wide-bandwidth PPDs have recently been observed more often. The frequency span these devices are transmitting has had to be estimated due to the fact that the Snapshot monitor has 40 MHz of bandwidth, and these PPDs are transmitting beyond this bandwidth. Figure 50 through Figure 52 show examples of these types of PPDs. The left plot in these figures is the RF spectra and the right plot is the FM demodulated waveform. The latter each contain a linear component that is present for only a portion of the chirp interval. Under the assumption that the modulating waveform would be linear for the repetition interval, the slope of the visible linear component was extrapolated to the total chirp time interval. It is not possible to estimate the upper and lower frequency points for the last two examples, since neither of those had a frequency that began or ended within the observable 40 MHz bandwidth of the monitor.
Although the Snapshot System L-band tuners can be programmed for greater bandwidth, the limiting bandwidth is the bandpass filters contained within the LNA modules, which have bandwidths of 40 MHz.
Data captured by a Snapshot System operating near ZHU contains evidence that external energy may have coupled into that PPD and affected the modulation waveform. Figure 53 shows a plot of the RF spectra and an expanded portion of the FM demodulated spectra indicating the presence of a 58.7 Hz component. A raster of the demodulated FM, shown in Figure 54, highlights the 58.7 Hertz component.
FIGURE 53A. ZHU chirp 118 kHz with 58.7 Hz.FIGURE 53B. ZHU chirp 118 kHz with 58.7 Hz.FIGURE 54. ZHU raster of FM showing 58.7 Hz (Click to enlarge).
Careful analysis of normalized C/N0 has also provided clues as to the possible travel paths that a PPD might be using. RFI was suspected at the WRS located at Leesburg Virginia (ZDC). A Snapshot System was installed to detect and characterize possible RFI. Analysis of snapshot data did confirm that a few PPDs were traveling past ZDC. One of the PPDs was more disruptive than the others but fortunately was also following a very predictable schedule. It was regularly detected twice a day, first within 10 minutes of 4:30 AM local and next within 30 minutes of 2:30 PM. Normalized C/N0 contained similar patterns for each time of day and are shown in Figure 55 and Figure 56. Examination of the local roadways, shown in Figure 57, suggested the possible roads and direction in which this PPD was traveling. The WAAS antennas on the roof of ZDC have clear line of sight to state highway 7 for vehicles that are east of ZDC. Normalized C/N0 for morning events tended to have a relatively abrupt onset followed by a gradual return to normal while the afternoon events exhibited a gradual increase in degraded C/N0 followed by a quick return to normal. This observation lead to hypothesizing that the PPD was traveling east in the morning and west in the afternoon.
FIGURE 55. ZDC Typical Morning Degradation.FIGURE 56. ZDC Typical Afternoon Degradation.FIGURE 57. Roads near ZDC (click to enlarge.)
FAA Spectrum personnel were informed of this analysis and confirmed that this hypothesis was correct. Using this information they were able to detect the vehicle that was responsible and remove this particular PPD from service.
EWR RFI Event Statistics
A large number of RFI events have been detected at EWR since the updated Snapshot System was installed on March 3, 2011. These RFI events have been ranked according to the magnitude of degradation in normalized C/N0, as reported by the GBAS shelter WAAS receiver. The following plots show the total number of RFI events per day (red dots) and for every seven consecutive days (blue line). On average, PPD-induced receiver degradation of at least 10 dB has been observed two times a day. Although a small number of narrowband RFI events produced receiver degradation of as much as 10 dB, the vast majority of RFI events causing 10 dB or more of receiver degradation are due to PPDs.
Figure 58 indicates that since March 2011, more PPD RFI events are being observed. However, Figure 60 indicates that the higher-power PPDs are not being observed as often. One possible explanation is that the previously observed PPDs have stopped working, and the individuals using them have either not acquired replacements or they have acquired different ones with less-damaging RFI.
FIGURE 58. History of RFI > –10 dB (click to enlarge).FIGURE 59. History of RFI > –15 dB (click to enlarge).FIGURE 60. History of RFI > –20 dB.
Many recent PPDs have been transmitting with estimated frequency spans of 65 MHz to 140 MHz. Although the estimated EIRP of many of these very wide bandwidth PPDs has been as much as +10 dBm, their effect on GPS receiver processing has not been as damaging due to the fact that the RFI is within the GPS receiver processing bandwidth for only a portion of the time.
Spectra of Swept FM with Multipath
One of the most commonly observed characteristics in PPD spectral data has been uniformly spaced nulls as shown in Figure 61 and Figure 62. Figure 63 displays a spectral raster that shows how the nulls shift in frequency over time. Initially, there was uncertainty as to the mechanism responsible for these observations. Under the hypothesis that multipath might be responsible, a single ray multipath model was used to predict the spectral characteristics of a PPD that includes a multipath component. This analysis was pursued in the hope that it might provide additional information as to the exact location of PPDs.
The swept CW signals used by PPDs provide a useful source for characterizing multipath between the PPD and monitoring antennas. Equation (1) models observed CW that is the sum of the direct path and a single reflection in which reflected component has a path length difference of d meters.
(1)
Assuming the reflection is from a metal surface, it should experience a phase reversal. Therefore, destructive cancellation between the direct and multipath component will be present for those frequencies that have a path length difference that is an integer multiple of the wavelength. Equation (2) represents this condition.
(2)
Simplification results in the following expression.
(3)
As an example, if spectral nulls are observed at intervals of 10 MHz, then the path length difference is approximately 30 meters. Spectral nulls have been observed at frequency intervals ranging from 2 MHz to as much as 30 MHz. These null spacing’s translate to path length differences of between 150 meters to 10 meters. Multipath with a path length difference of less than 8 meters will exhibit a single null in the 40 MHz bandwidth of the Snapshot System and therefore cannot be estimated accurately using this technique. A path length difference of 8 meters is also what might be expected for two vehicles traveling side by side on interstate highways since interstate highway specifications require lanes to be approximately 4 meters wide.
Once a possible mechanism for the spectral nulls was hypothesized, additional analysis was performed on specific RFI events in which uniformly spaced spectral had been observed. Snapshot and GPS receiver data indicates the direction of travel for a PPD. With direction of travel known, it is possible to approximate the distance that the PPD is from the monitoring equipment. However, for those RFI events that were examined, the calculated path length difference was similar to or greater than the distance between the PPD and monitoring equipment. The most likely location of surfaces that would reflect the PPD transmission was other vehicles on the NJT. Had the surfaces responsible for the reflections been stationary objects nearby, then it might have been possible to hypothesize the most likely location of the PPD by combining receiver proximity and path length differences.
The magnitude of the reflection coefficient can be estimated by comparing the relative power of the spectral maximum and minimum. However the magnitude of the reflection coefficient can only be bounded since it depends on both the reflection coefficient and the relative path length difference. Since the reflected path travels farther, its magnitude will inherently be reduced, in addition to the loss from the reflection, and therefore the observed relative difference will be smaller than shown by equation (4).
(4)
For the examples shown in Figure 61 and Figure 62 the spectral max/min was on the order of 10 dB. By using 10 dB for SpectraMaxMin in equation (4), a reflection coefficient of at least 0.5 is calculated. Reflection coefficients of trucks with shipping containers will probably be much greater than 0.5 and could easily be as high as 0.9.
Direction-Finding Methods
After examining more than a thousand examples of PPDs and their effect on GPS receivers, I have concluded that any type of ground-based direction finding system intended to detect and locate low power moving PPDs over a large area using time-difference-of-arrival (TDOA) or beam forming (angle-of-arrival, AOA) techniques will face significant challenges.
Accuracy of TDOA-based location systems can be decomposed into two components: measurement accuracy, and the geometry of the equipment used to make these measurements. In 1982, Paul Chestnut calculated the relationship between accuracy and these two components, showing that geometry is a multiplicative factor. Direction-finding conceptual design typically strives to position the measurement equipment such that it surrounds the area to be monitored, if possible. For those situations where it is not possible to encircle the area, the measurement equipment will typically have a long baseline between its sensors and with a perpendicular orientation with respect to the monitored area. This strategy reduces errors due to geometry.
Measurement error depends on the observable power of the signal to be located. This component will most likely limit the ability to accurately locate low-power moving PPDs. Measurement data from GPS receivers demonstrate the ability to reliably detect the presence of these PPDs, but only when they have been within hundreds of meters. Most PPDs have been observed for 30 to at most 60 seconds. For PPDs traveling along the NJT at a velocity of 30 m/s, this time span implies that they were not detected until they were within 900 meters. Reliable detection was not demonstrated unless they were within 500 meters. This is a direct consequence of the fact that all GPS antenna are designed for hemispherical coverage for satellites above the horizon. The PPDs are at the horizon or lower relative to most GPS antenna patterns. If GPS antennas were used as part of a TDOA-based system, they would need to be positioned no further apart than approximately 600 meters. Using GPS antennas to detect and locate PPDs is inherently limited to proximity detection.
The ability to locate low-power PPDs within a larger area requires a system to be able to detect a PPD by all of its sensors simultaneously from distances much greater than 600 meters. In principal, higher-gain antennas orienting their main beam along the NJT would increase the distance over which PPDs could be detected. Even when high-gain directional antennas have been positioned along the NJT, the observed power has not followed predictions based strictly on FSL. One reason for this is that clear line-of-sight could not be achieved between the high gain antenna and the PPD. Vehicular effects might also be responsible for these observations. What is known is that the power observed by ground-based antennas has shown significant fluctuation, much greater than could be explained by FSL propagation. Ground-based direction finding systems for low-power moving PPDs must be able to simultaneously detect RFI by multiple sensors, in an environment that may at times shield the PPD from its sensors, and that also has fluctuating observable power.
The ability to observe, detect, and locate low-power moving PPDs over a large area would require a system to have its monitoring antenna located high above the NJT, and oriented to look down on the NJT and the surrounding area. Although such a system must still contend with shielding from the vehicle itself, it would be the only approach that could potentially observe these PPDs over a large area, simultaneously by all of its measurement sensors. Implementing such a concept may be expensive.
A less expensive approach might rely on proximity detection, with many sensors on the ground, each monitoring their own small area, and only report PPDs that travel close to each of them. One such approach, referred to as crowd sourcing, uses cell phones to aid in detecting and locating PPDs. Crowd sourcing is a form of proximity detection.
Summary
The first evidence of low-power moving PPDs along the NJT used two GPS receivers separated by considerable distance and then correlated their responses. This approach is only useful for detection of PPDs traveling in close proximity to the GPS receivers. Analysis of GPS receiver normalized C/N0 also provided a basis for determining if RFI might be from a moving emitter. The shape of normalized C/N0 versus time not only provides clues that the RFI source is in motion, but may even be correlated with their possible travel paths, when blockage exists between the GPS antenna and local roadways.
Autonomous operation is a necessity for detecting low-power moving PPDs, since they may be observable only a few times a day and for less than 60 seconds.
Capturing real-time samples of these intermittent RFI events determined the existence of many different types of PPDs. Almost all use some form of swept FM modulation. Analysis of their spectra and modulation indicates that many devices are probably not operating as their manufacturer intended. Modulation waveforms of PPDs have included triangle, highly linear sawtooth, sawtooth with synchronous perturbations on top of the fundamental sawtooth, and sawtooth with analog modulation. The leading hypothesis for this observation is that the devices are not shielded very well and that the internal modulator is susceptible to coupling from either other circuits within the PPD itself or from external electronic devices operating in the vicinity of the PPD.
Acknowledgments
The author thanks the FAA for support in this investigation, Rich Holley of ICE-Online for help in utilizing capabilities of the ICEPOD6-M5, and Julian Babel of the FAA Technical Center for regularly swapping external hard drives attached to the Snapshot System.
Joe Grabowski is a systems engineer at Zeta Associates where he works on a variety of GPS projects in support of the FAA, as well as communications systems and digital signal processing applications. He received an M.S.EE from Purdue University. Since 2010 he has been involved in the investigation of personal privacy device impacts on FAA SBAS and GBAS sites.
Telogis, Inc. announces the acquisition of the assets of Maptuit, a leading provider of connected navigation for commercial fleets. This acquisition — the company’s fifth in three years — expands Telogis’ services as the market increases adoption of location-based Software-as-a-Service (SaaS) solutions. Maptuit’s commercial navigation technologies further enhance the Telogis enterprise platform of SaaS solutions, which includes fleet management, navigation, multi-vehicle route optimization and planning, work order management and mobile integration.
“This acquisition adds a new dimension to our platform,” said Newth Morris, president, Telogis Route and Telogis Mobile. “With these advances, Telogis further differentiates itself in the market by providing the most comprehensive suite of location intelligence solutions on a single platform.”
According to the announcement, the enhancements to the Telogis platform resulting from this acquisition include an advanced location-based service (LBS) engine that receives feedback from the field on road conditions and physical restrictions that may not be captured by commercial and open source map data. These capabilities are critical not only to the commercial navigation markets where Maptuit has been successful, but also to industries such as mining, and oil and gas, which operate in remote regions where map data coverage is limited.
Maptuit’s technologies also allow companies to specify “known-good” routes and yard-approaches. These capabilities help companies improve the safety of route operations and are increasingly important in international markets where bonded routes exist.
Telogis reports it will integrate Maptuit’s technologies directly into its enterprise platform, thereby expanding the Telogis customer base by more than 100,000 subscribers.
“The commercial navigation technologies that Maptuit has revolutionized will enhance all of the applications on our platform — route planning, navigation, execution analytics — and position our company to best handle the growing location intelligence needs of companies worldwide,” said Morris. “This acquisition complements the Telogis platform with a unique set of high-value capabilities that allow companies to dramatically transform their operations, improve safety and lower operating costs.”
allows users to record, export, and import routes and landmarks together with information such as photos, videos, audios, or text directly to an iPhone. The product is intended both for professional survey teams and outdoor adventurers. Key features include:
Enjoy recording your trip routes and pinning impressive landmarks, with multimedia files and descriptions.
Advanced functions; export/import, geotag/geocode, along with Multiple Recording Filters.
Versatilely edit the saved track/point; crop, move, copy, merge, or change properties.
Share and develop your trips with friends easily via iTunes or email.
Available in two versions: The Basic (TMX) and The In-App (TMX, GPX, MID/MIF, or Shapefiles.)
It wasn’t quite a call to arms, but Bill Ford, head of Ford Motor, called on the wireless community to work with car makers to avoid global gridlock and create a future of “urban mobility,” a network that will track vehicles and automatically instruct cars to change lanes, exit a road, or park. Vehicle connectivity was one of the major themes of the Mobile World Congress, held in February in Barcelona. For some of us, it brought up memories of the PATH automated highways project of the 1990s. You have likely seen photos of that prototype automated highway with platoons of driver-less vehicles riding on I-15 in southern California. The vision has changed, and we are headed towards autonomous, connected vehicles and away from the specialized, and prohibitively expensive, infrastructure that defined earlier efforts.
By 2020, 90 percent of cars will have mobile connectivity, compared to 10 percent today, predicts Machina Research in a study funded by the GSMA. The industry is aflutter with connected activity. Sprint Nextel is partnering with Chrysler Group’s Uconnect voice-activated vehicle communications system that enables Sprint phones to connect to the vehicle’s audio system. The Ford Sync will be available to European customers. The Family Locator from TCS will be incorporated in connected vehicles.
Smartphones Overtake Feature Phones. For the first time, close to half of Americans own smartphones, edging out feature phone ownership, reports the Pew Internet and American life project. According to its report, 45 percent of adults identify themselves as smartphone owners, compared to 41 percent who identify as feature phone owners. There was a notable increase in smartphone ownership by almost every demographic group, including men and women, younger and middle-age adults, urban and rural residential and wealthy and lower-income people.
Apple Grown Maps. For a year, there have been signs that Google was developing its own mapping and navigation service. Apple has acquired digital mapping companies and listed licenses from many third-party location service companies. 9to5Mac reports that Apple’s mapping contract with Google expires at the end of 2012, and hasn’t yet been renewed. The just-released iPhoto application uses Apple-grown mapping, and not Google.
Disappearing Ovi. Nokia is closing down the Ovi Share media sharing site to focus on offerings by its location and commerce division, dedicated to building consumer-centric social location products and applications, as well as platform services and local commerce solutions. Services include Nokia Drive, Nokia Maps, and Nokia Transport.
Gambling Geo-Fence. In the U.S., online and mobile gambling is only legal within the state of Nevada. The location of the mobile user must be determined to ensure she is within state boundaries. Locaid Technologies is the first company to meet all the requirements of the Nevada Gaming Control Board to certify the location of a mobile gambler. Locaid uses geofencing to build virtual, digital perimeters around the state of Nevada and reports it can “prove that a user is physically with a mobile device, and whether the person is located within Nevada state borders, across any major carrier mobile network — whether the mobile device is indoors or outdoors, GPS-enabled or not, and whether the device is a smartphone, feature phone, or laptop computer.”
February Black Friday. Shopkick announced results of an experiment to create a one-day boost in foot traffic at partner retail stores using holiday tactics during a non-peak shopping period. “We asked a simple question: What if retailers could create Black Friday shopping behavior any day of the year that they wanted?” said Cyriac Roeding of shopkick. The company reports that by doubling the incentives they deliver via smartphone, none worth more than a dollar, their retail partners experience double-digit increases. Retail partners include American Eagle, Macy’s, Old Navy, and Best Buy.
Effectiveness of Mobile Shopping Apps? Smartphones are increasingly used for shopping, researching products, comparing prices, and finding retail locations. Nielsen metered the smartphones of 5,000 U.S. volunteers during the 2011 holiday shopping season. Nielsen’s analysis reveals that retail websites are more popular than retail apps. Both genders prefer retailers’ mobile websites over mobile apps. The top retail apps and websites combined were Amazon, Best Buy, eBay, Target, and Walmart, and reached nearly 60 percent of smartphone owners during the end of 2011.
What Was Ford Thinking? In his Mobile World Congress address, Bill Ford, great grandson of Henry, warned that unless the wireless and automotive industries find a solution, global gridlock could one day become a “human rights issue.” In addition to working to end torture, does Mr. Ford think that Amnesty International should pursue the issue of vehicle traffic mitigation?
 Polaris Wireless, a provider of software-based wireless location solutions, based in Mountain View, California, announced that Per K. Enge has joined its executive team as the chief technical advisor to the company’s CEO, Manlio Allegra.