Category: Mobile

  • J911: Fast Jammer Detection and Location Using Cell-Phone Crowd-Sourcings

    By Logan Scott

    Inexpensive, readily available GPS jammers constitute a threat to safety, national infrastructure, and industry revenue streams. Cell phones could incorporate GPS jam-to-noise (J/N) ratio detectors to provide timely interference detection and effective localization, with a flexible and updateable system since the crowd processing function resides in software.

    Events in early 2010 at Newark Liberty International Airport demonstrate the vulnerability of civil GPS infrastructure to interference. Over a period of several weeks, sporadic outages of the GPS Ground Based Augmentation System (GBAS) located at the airport to provide precision approach services occurred, due to radio-frequency (RF) interference from unknown sources. Analysis showed that certain vehicles on a nearby freeway were the likely culprit(s), and an interdiction effort was launched to catch an offender. Using advanced interference detection equipment and multiple surveillance cameras, an offender — a truck driver — was caught and arrested. In his possession: a widely available $33 GPS jammer.

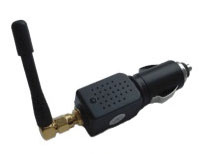
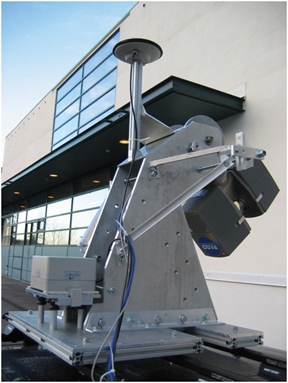
    For sale over the Internet, the jammer emits 200 mW and plugs directly into a vehicle’s cigarette lighter (see photo). To prevent future incidents, the FAA is relocating the airport’s GBAS system to a more protected location away from the freeway.

    Such an approach to jammer detection, localization, and enforcement, while successful in this instance, ultimately serves only as a stopgap. It took tremendous resources and several weeks to find one offender.

    Increasing use of GPS jamming and spoofing to cover both licit and illicit activities is likely, given the general public’s desire for privacy and the general lack of awareness of how devastating GPS jamming can be. The $33 jammer in this instance could have affected critical flight operations 10 miles away. Currently, most jammers are not even detected; we simply have an unidentified GPS outage. It was only because of the technical sophistication of the FAA’s GBAS that the outage’s underlying cause was identified as jamming.

    GPS Jammer. A $33, 200mW jammer for sale over the Internet.
    GPS Jammer. A $33, 200mW jammer for sale over the Internet.

    At the ION-GNSS 2010 plenary session, Phil Ward advanced the notion that cell phones could incorporate GPS jam-to-noise (J/N) ratio detectors to provide timely interference detection. Having an extensive background in cellular communications as well as GPS, I found the idea intriguing. In this article, I explore the viability of this concept, whether jammer location can be determined, and what it would take to implement such a system.

    In urban and suburban areas, it appears feasible to provide warning of jamming in less than 10 seconds while providing real-time jammer location to better than 40 meters. Such a capability would aid immensely in mitigating jamming events by enabling effective law-enforcement action. Potential jammers will know they are likely to be caught and that the penalties are severe. They won’t do it after a few well publicized interdictions. The cost for this nationwide system can be relatively modest. It won’t take billions of dollars and decades to implement; it will take an act of national will similar to the phase II wireless E911 effort. IOC could happen as early as 2015, with full national coverage by 2017.

    J911 System Architecture

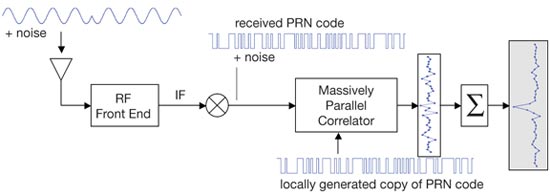
    Figure 1 depicts the automatic gain control (AGC, the process by which RF front-end gain is controlled so as to present the analog-to-digital (A/D) converter with appropriate signal levels) loop found in some form in virtually all GPS receivers. The core objective is to set the gain GA so a set percentage of 2-bit A/D converter outputs correspond to large values of 3 and -3. Typically, VT percentage is set to 35 percent in a Gaussian noise environment to hold A/D conversion losses to ~0.5 dB. In another popular variation, the 1.5 bit A/D converter, the zero threshold is not implemented and three possible values are output (-1, 0, and -1). Such a converter has about 0.9 dB of conversion loss if VT percentage is set to 40 percent, and considerably simplifies correlator processing.

    J-1
    Figure 1. Adaptive A/D converter with jamming-to-noise (J/N) meter output. Knowing you are jammed is the first step.
    J-2
    Figure 2. J/N as a function of position relative to a 200 mW jammer. phones located closer to the jamming source will see higher J/N than those further away.

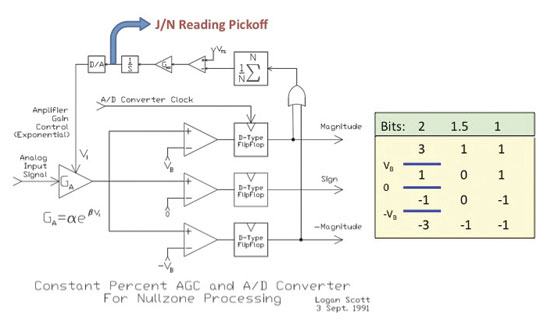
    Of particular interest for interference detection purposes, the control voltage to the AGC amplifier can also be used to measure jammer-to-noise power (J/N). Under unjammed onditions, the nominal input power to an L1 C/A receiver is about -110 dBm, most of this due to naturally occurring thermal and amplifier noise. The C/A code signal at -130 dBm is a factor of 100 weaker and does not influence AGC operation. If, however, interference starts rising above the thermal noise floor, the AGC will respond by decreasing gain GA so as to maintain the correct percentage in large outputs. Response times to a change in input power level are very fast, typically less than 1 millisecond, and so pulse jamming characteristics can be determined as well.

    If the receiver knows the control characteristics of the AGC amplifier (β,α) then the receiver can determine the change in J/N given V1. Additionally, if the receiver knows the quiescent V1 associated with a thermal noise-only input, it can obtain J/N on an absolute scale. To obtain the quiescent value, the receiver can short the antenna on power-up as part of built-in test prior to operation. Alternatively, it can maintain and refine a historical value during normal operations, the caution being that spoofers and jammers may try to manipulate history-based values.

    Even with relatively small jammers, front-end saturation can be a problem when the jammer is nearby. The thermal noise floor in a 1.7 MHz bandwidth is about -110 dBm, and so a J/N of 60 dB corresponds to jamming signal strength of -50 dBm. Accurate J/N measurements are possible at this level, but likely require adding a switchable input step attenuator in the down-conversion chain. Measuring J/N above this level gets problematic for a low-cost GPS front-end.

    In a further refinement, receivers can include additional comparators set at -1.2 VB and + 1.2 VB. If a constant envelope (CE) jammer (CW, swept CW, or Gold code jammer types) is present, this threshold will be crossed 16 percent of the time given CE jamming, versus 32 percent of the time for Gaussian distributed jamming if VT percentage is set to 40 percent, as is typical for a 1.5 A/D converter. With the jammer type identified, the receiver can adapt V<su
    b>T percentage if it is seeing CE jamming to obtain several dB of additional jamming resistance. The TI-420 L1 C/A receiver developed by my team at Texas Instruments in 1986 routinely outperformed P-code receivers against CE jammers using this technique. The takeaway from this discussion is that with very simple hardware, an L1 C/A receiver can measure J/N and also determine the approximate type of jamming that it sees: pulse, constant envelope, and Gaussian.

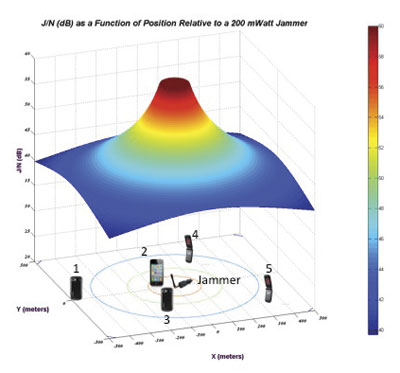
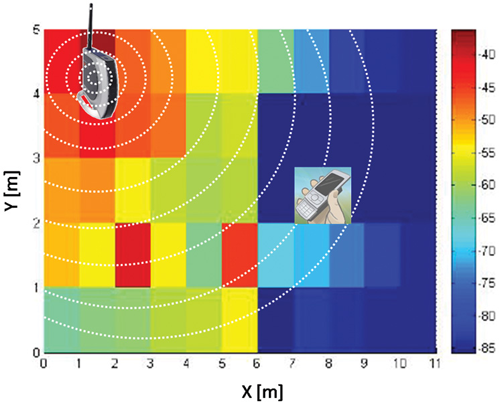
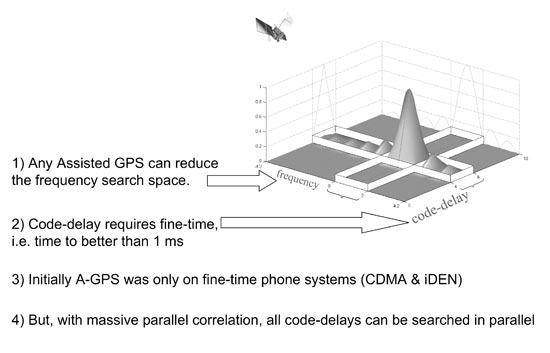
    Can this information be used to detect and locate jammers? In Figure 2, a 200 mW jammer is located at the origin [0,0] and J/N (dB) is plotted as a function of relative location. Conceptually, phones located closer to the jamming source will see higher J/N than those further away. The aggregate of phones, each reporting J/N and own position, provides a basis for locating the jammer. Some phones may also report the type of jammer they are seeing. Information about phone type and its physical orientation would also be of use in interpreting and correcting raw J/N information with regards to antenna gain and accuracy.

    Structurally, the J911 system would be very similar to the E911 system and would heavily leverage existing infrastructure and standards already in place. When a wireless E911 call is placed, the serving base-station(s) routes the call through a mobile switching center (MSC) where the call is identified as a 911 call. The MSC then connects the call to a local exchange carrier (LEC) who then connects the call to a public safety answering point (PSAP).

    In the United States, 6,149 PSAPs are distributed around the country.Wireless E911 calls are connected to a specific PSAP usually based on the location of the caller as determined by the cellular carrier. Under Phase II requirements, E911 call takers receive both the caller’s wireless phone number and their location information. Currently, 95 percent of PSAPs have some Phase II E911 capability.

    Using the E911 system as a basis, creating a federal J911 PSAP to process J/N measurements into jammer location estimates would not be all that problematic. Software upgrades to phones, base stations, MSCs, and so on, are routine and often include new or modified message provisions and capabilities. Adding a Jamming Report message type would use existing message transport and routing facilities already part of the infrastructure. The main infrastructure addition would be a facility to process jamming reports, either at the federal level or as an adjunct to existing PSAPs.

    Adding a J/N measurement capability to phones is a straightforward hardware issue, but modifying extant phones is not feasible. Fortunately, cell phones typically have a two-year lifecycle before being replaced. Adding a jammer reporting capability can be accommodated through the normal replacement cycle.

    J911 System Performance

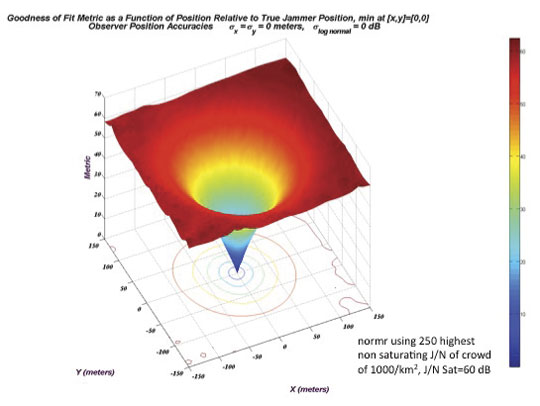
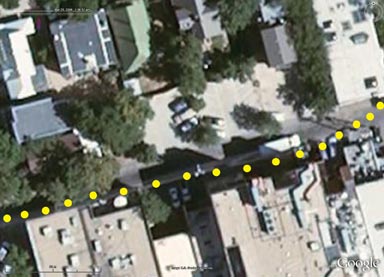
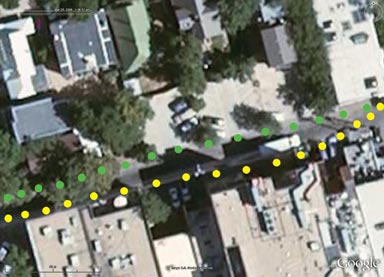
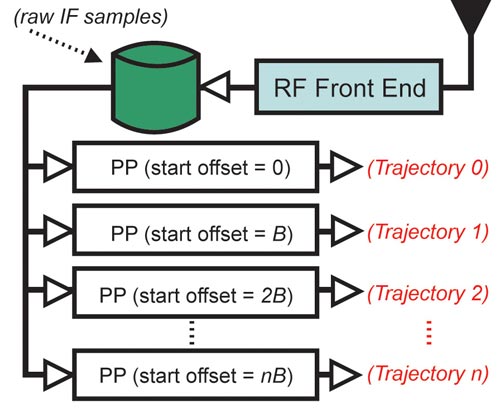
    Given the location and J/N measurements obtained by a crowd of randomly located cell phones, one approach to determining the jammer’s location is to perform a series of curve fits for a grid of hypothetical jammer locations and see which location provides the best fit. Figure 3 illustrates this process; for the moment, the cell phones (observers) are assumed to provide exact J/N and location measurements.

    Here, a 200 mWatt jammer is located at xy = [0,0]. 1,000 cell phones are uniformly distributed over a surrounding 1-square-kilometer area. A hypothetical jammer location grid of points 5 meters apart is created over a span of ±150 meters in x and y. At each hypothetical point, the 250 highest non-saturated J/N reports are used in a least-squares curve fitting process that assumes jamming strength falls off as 1/Rα. (In the ground mobile environment, α is usually in the range of 2 to 4. α = 2 is consistent with a free space propagation model.)

    Specifically, J/N (dB) is presumed to be a linear function of log10 (R) where R is the range from reported observer position to hypothetical jammer location. At each hypothetical jammer location point, the norm of the residuals is collected as a metric of how closely the jamming reports (J/N + location) matched the least squares curve fit. The smaller the norm of the residuals, the better the curve fit. This metric is plotted in Figure 3 and shows that the best fit is obtained at the true jammer location.

    ▲ Figure 3. Location metric as a function position relative to true jammer position (no observer errors).
    Figure 3. Location metric as a function position relative to true jammer position (no observer errors).

    In practice, knowledge of cell-phone locations is imperfect, and for those phones near to the jammer, GPS will be unavailable. There are several alternatives for determining location. Cellular carriers use a plethora of location determination techniques based on round-trip timing between the cell phone and observing base stations. Another very good option is to use Wi-Fi-derived location based on visible access points (AP). Companies such as Skyhook and Google have commercialized this technology, and it is available now in most areas. Positioning accuracies of 30 meters are typical, absent GPS. Looking down the road a bit, many phones now have integral accelerometers and could in the future propagate position with good accuracy even when GPS is unavailable.

    Another very important factor is that J/N observations are going to be highly variable.

    Three major effects to consider:

    • Cell phone errors in measuring J/N due to quiescent V1 errors, imperfect AGC amplifier characterization, and uncompensated receive antenna gain directionality.
    • Variability in J/N due to large-scale shadowing due to buildings, hills, bridges, etc.
    • Variability in J/N due to small-scale multipath effects. Jamming signals may follow multiple paths to the cell phone and add up constructively or destructively. Moving the cell phone a few inches may yield a very different J/N.

    To model these effects, a log normal model of J/N measurement deviation from ideal free-space propagation is used. In this model, free-space propagation represents median signal strength and σ log normal, expressed in dB, describes Gaussian random deviation from the median signal strength. Such models are widely used in predicting statistical cellular coverage and have a strong correlation with real-world observations.

    Figure 4 shows a jammer location metric manifold computed using the same process as in Figure 3, except now with observer location errors of
    σx = σy = 30 meters and σ log normal = 6dB. Basically this says that the cell phones have Wi-Fi-based locations, and that the measured J/N is within ±6 dB of the free space value 68 percent of the time, and, within ±12 dB of the free-space value 95 percent of the time. These are relatively modest performance goals for the cell phones.

    ▲ Figure 4. Location metric as a function position relative to true jammer position (observer errors: 30 meter 1 /6 dB 1 J/N).
    Figure 4. Location metric as a function position relative to true jammer position (observer errors: 30 meter 1 /6 dB 1 J/N).

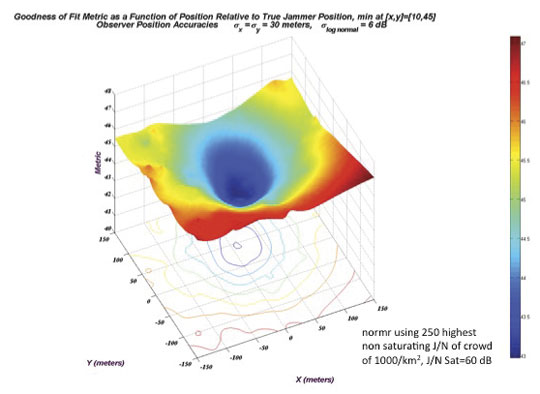
    In this particular run, the hypothetical jammer position yielding smallest residual norm is at xyjammer = [10,45] meters. Even though the individual measurements are of poor quality, the crowd consensus yields a fairly accurate estimate of the jammer’s position.

    Before continuing, a few words on crowd size and cell phone densities. Assuming a cellular penetration rate of 70 percent, Table 1 shows approximate cell-phone densities for select suburban and urban municipalities. No doubt there is considerable variation in cell phone densities even within a municipality, but as a rough order of magnitude, 1,000 cell phones per square kilometer is not an unreasonable number.

    Table1
    Table 1. Density of 1,000 phones/square kilometer Is common in urban areas.

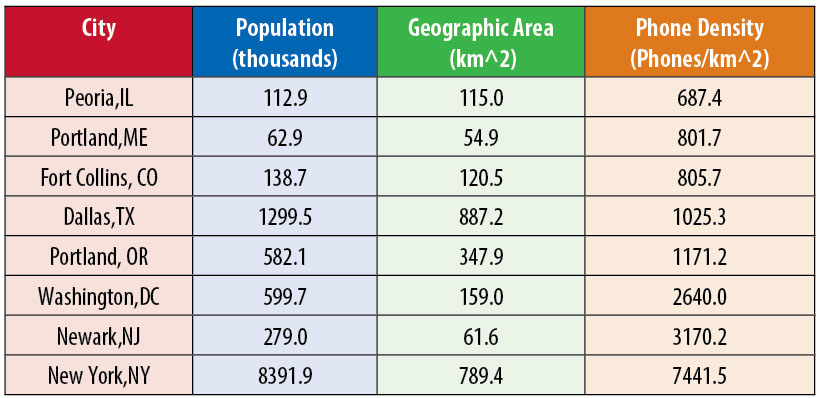
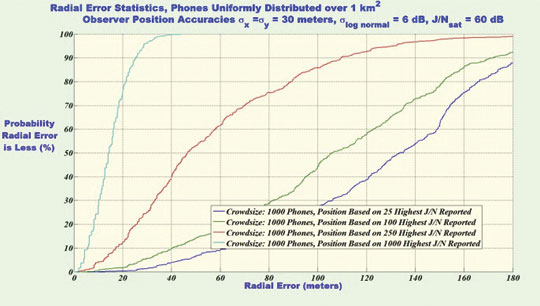
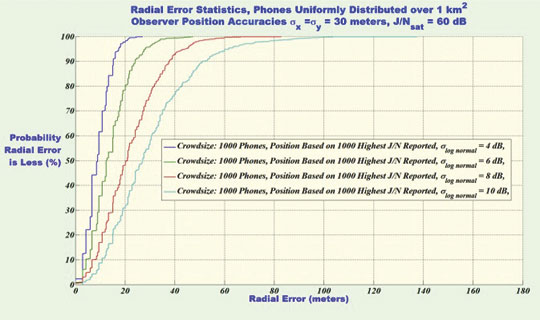
    Figure 5 shows statistics of jammer location accuracies, presuming a uniformly distributed cell phone density of 1,000 cell phones per square kilometer. Based on a simulation of 500 independent runs, this figure plots jammer location radial error statistics assuming 25, 100, 500, or 1,000 measurements are processed in the curve-fitting process where radial error is given by:

    J-EQ.

    Processing the full crowd yields 14-meter or better radial errors in 50 percent of the trials and better than 27 meters in 90 percent of the trials. So why process less than the full set of measurements obtained by the cell phones? In practice, if all cell phones observing a jamming event were to report everything they see, the cellular infrastructure could be overwhelmed. To limit traffic surges and to limit false alarms, a jamming event is likely to be processed in two distinct phases; the detection phase and the locating phase.

    J-5A
    Figure 5. Radial error statistics with 1,000 phones/sq km crowd density.

    Jammer Detection

    In the detection phase, cell phones would report relatively infrequently based on which page group they are in. In current practice, to minimize cell-phone power consumption while in standby, each cell phone belongs to a particular page group based on its supposedly unique International Mobile Equipment Identity or IMEI. (As a bit of trivia, most cell phones display their IMSE if you dial *#06#). In GSM there may be 50 distinct page groups. Depending on which page group the phone belongs to, the phone knows when to wake up to listen to the paging channel (PCH) and see if there is an incoming call for it. By limiting jammer reporting based on which page group the phone is a member of (or IMEI), the size of the initial traffic surge can be limited.

    During the detection phase, the system will also need to determine the type of interference event being seen. A solar event may trigger large numbers of phones, but the flat J/N versus location response can be used to rule out a localized jamming event. A real jamming event will tend to have a geographic center with many high J/N values over a fairly restricted area. Also, if CE interference is reported as opposed to Gaussian interference, there is good confidence the event is human originated, and the source can be located.

    Jammer Localization

    If jamming is determined to be the cause of interference, then the system transitions to a jammer localization phase. Tentatively, the jammer location process would seem to be better served by using phones near the jammer, but not those phones with saturated J/N meters. The non-saturated phones provide good RSSI (received signal strength indicator) information that is correlatable with distance, and those cell phones closest to the jamming source (high J/N) tend to experience fewer propagation anomalies. To control traffic loads during a jamming event, the J911 PSAP may restrict which phones report by requesting that only phones seeing a J/N value of greater than J/Nmin report.

    Returning to Figure 5, processing the full set of data yields better snapshot jammer location accuracy as opposed to results obtained using a trimmed subset. Processing the full crowd yields 14 meter or better radial errors in 50 percent of the trials and better than 27 meters in 90 percent of the trials. Relying on only the subset of the 250 strongest J/N values adversely affects jammer snapshot location accuracy; yielding 47 meter or better radial errors in 50 percent of the trials and better than 110 meters in 90 percent of the trials.

    The upside is that the traffic generated on the cellular network is one quarter as much. Stated another way, for a given traffic handling capacity, we could update jammer location at four times the rate. Using page group membership, general location, or IMEI as an additional reporting criteria, we can sample different cell-phone populations at each snapshot interval.

    If a Kalman filtering approach is used to track/smooth jammer location estimates, the reduced set of observations may ultimately yield better performance, especially considering that individual phones can move around considerably over time. Also, geographical centroiding using phones with saturated or very high J/N indications may be another viable jammer locating technique, and perhaps combining approaches would be good. If the jammer is determined to be in a vehicle, substantial accuracy improvements in location accuracy may also be obtained by limiting the hypothetical jammer location grid to include only roads based on map input. These are all open issues for further study.

    Figure 6 repeats the analysis of figure 5 except now, cases of much reduced cell-phone density are considered. In all cases, the full set of data is reported and processed. Not surprisingly, with more observers, the jammer locating accuracy is better, but even with low cell-phone densities, the performance is not bad: 50 meters 50 percent of the time, and 100 meters 90 percent of the time with 100 phones per square kilometer. Jamming detection and location is feasible in modestly populated areas.

    J-6
    Figure 6. Radial error statistics with crowd densities of 50, 100, 250 and 1,000 phones per square kilometer

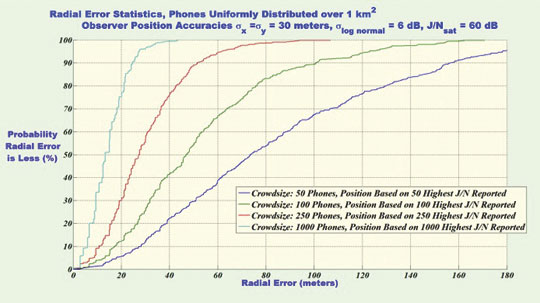
    Figure 7 shows radial accuracy statistics for σlognormal = 4, 6, 8 and 10 dB. As expected, as J/N measurement reliability deteriorates due to increased propagation variability and/or cell phone measurement errors, the accuracy of jammer location estimates also deteriorates but not catastrophically so.

    J-5
    Figure 7. Radial error statistics with σlog_normal =[4,6, 8, 10] dB crowd densities of 1,000 phones per square kilometer.

    Similarly, simulation runs with larger cell-phone location errors showed modest performance losses in jammer location accuracy. In aggregate, Figures 5 through 7 point towards crowd size and crowd selection algorithm, not the accuracies of individual measurements, as the main driving factors in jammer-location accuracy.

    Putting J911 in Place

    Initially, wireless operators had little enthusiasm for implementing wireless E911 as it introduced substantial hardware requirements for mobile station (MS) position reporting (a cell phone is an MS). Now, E911 provides the technical underpinning for numerous revenue streams, most notably the location-based services (LBS) industry. GPS jamming is a direct threat to this revenue stream.

    As GPS becomes integrated with vehicle navigation systems and intelligent highway systems, cellular carriers will play an important role in provisioning needed communications facilities. GPS jamming is a direct threat to this future revenue stream.

    Cellular signal jamming is also a threat to national infrastructure (and carrier revenue). The approaches described above are readily adaptable to detecting and locating cellular frequency band interference sources in a timely manner. By emphasizing the potential benefits of a J911 system to the cellular carriers, there is better potential for buy-in by industry.

    Using the wireless E911 experience as a model, J911 could be made a reality using a three-step process:

    Rulemaking. After validating the requirement, the FCC would issue a Notice of Proposed Rulemaking (NPRM) stating the system functional requirements. Industry would comment, and through an iterative process the J911 requirements regarding performance and mandated deployment schedules would be established. This process would take about two years.

    Standards Setting. Well established wireless, LEC, and PSAP standard-setting bodies would create detailed standards for implementing J911. The bulk of the work would be done by collaborating representatives from industry. Standards would be issued for various system portions — for example, MS standards, BSS standards, and so on — to permit manufacturers to build interoperable equipment. The standards setting process would take one to two years.

    Rollout. With the exception of the MS portions, J911 does not require hardware modifications to the cellular infrastructure. J911 would be implemented and deployed as part of the normal update and release cycle. Under the mandate, new mobile stations would have to meet the requirements of the FCC rulemaking and standards setting processes. Over a two-year period, mobiles would transition to J911 capable models and the J911 system would be in place.

    Crowdsourcing

    In the March 7, 1907, issue of Nature, Francis Galton reports on an experiment where, at a county fair, he had 787 people guess the dressed weight of a fatted ox, charging them six-penny a guess. Individual estimates varied wildly, as did the expertise of the guessers. However, the median estimate of the crowd was within 0.8 percent of the correct value.

    Conclusions

    Creating a national infrastructure for detecting and locating GPS and cellular jammers is needed. Such a capability would provide the underpinnings for rapid and effective enforcement actions. Crowdsourcing approaches using a multitude of opportunistic cell phone based observers appears a plausible solution providing timely and location specific alerts. Even though the individual measurements are of poor accuracy, the crowd consensus yields good accuracy. While this system would not reliably detect purpose-built precision power-controlled spoofers, it could detect coarser cell-phone apps-style spoofers that might, for example, be seen in road-use tax avoidance.

    Numerous open issues remain. Jammer antenna gain patterns can adversely affect locating accuracy. To what extent can this be mitigated by mapping out antenna gain contours? How can multiple simultaneous jammers be resolved? Can map and propagation modeling based aiding algorithms improve jammer location accuracy?

    Significant research is needed, but the proposed system is open for continual improvement, even after it is fielded, since the crowd processing function resides in software.


    Logan Scott is a consultant specializing in radio frequency signal processing and waveform design for communications, navigation, radar, and emitter location. He has more than 32 years of military and civil GPS systems engineering experience. As a senior member of the technical staff at Texas Instruments, he pioneered approaches for building high-performance, jamming-resistant digital receivers. He is currently active in location-based encryption and authentication, high performance/low bias adaptive array technologies, and RFID applications. He teaches Navtech Seminars’ New Signals course and holds 32 U.S. patents.


  • INRIX Announces INRIX Traffic! and INRIX Traffic! Pro Availability for iPad

    INRIX announced the upcoming release of a new iPad version of INRIX Traffic!, its popular app for commuters.

    Using the MDK (mobile developer kit), INRIX completed development of an iPad optimized version of its popular INRIX Traffic! and INRIX Traffic! Pro app in less than 2 weeks. Coming later this month to the iPad App Store, INRIX Traffic! is a free app that provides real-time traffic, traffic forecast, speed trap, accident and incident information for all major cities and roads across the U.S. and Canada. Winner of a 2010 MacWorld Best of Show Award, INRIX Traffic! Pro is available as an in-app upgrade to the free app that provides motorists with the added benefit of always knowing the fastest route, best time to leave, travel time and ETA for any destination.

    “Our mobile apps and tools have helped companies like Ford and providers of 8 of the top 10 most popular GPS smartphone navigation apps get to market fast with new traffic-powered navigation services,” said INRIX President and CEO Bryan Mistele. “Bill’s experience helps us transform our unique consumer insights into new features that extend beyond INRIX Traffic! to apps that empower our partners and customers to deliver consumer experiences that make navigation more useful every day.”

  • Mobile World Congress 2010: Planet of the Apps

    Mobile World Congress 2010: Planet of the Apps

    APP PLANET featured 100 exhibitors and a lounge for old-fashioned social networking.
    APP PLANET featured 100 exhibitors and a lounge for old-fashioned social networking.

    By Moni Malek

    It’s that time of year, around Valentine’s Day, when most of the who’s who in the mobile phone industry meet at the Mobile World Congress. I have been attending this event for nearly 15 years, and have seen the location change from Cannes to Barcelona, and the name change from GSM World Congress to 3GSM World Congress to Mobile World Congress.

    At the same time, the number of mobile phone users shot up from the millions to the billions. A new feature this year was the App Planet hall. The attendance of 47,000 was only marginally down from the 49,000 visitors in 2009, making it still a very busy a event, with no sign of the recession compared to other shows I’ve seen. It’s still the best place to meet companies in the mobile space — I met 25 in three days, as well as running into ex-colleagues and contacts who, like me, have been attending for years.

    Smartphone Entry. The trend of the last year or so has been the burst entry of smartphones. First started by Apple iPhone for consumers and to some extent Blackberry for professionals (the so-called fruit phones), operating systems (OS) have evolved to include Android from Google, Palm Pre’s webOS, Nokia and Intel merging their top-end smartphone operating systems, and Symbian going open source. Microsoft has people excited with Windows Phone 7, with the first handsets running on it scheduled to hit the markets around the holiday season.

    Most of the smartphones are GPS-enabled, and as these phones increase the market penetration of GPS, GPS use will increase, leading to more use of location-based applications.

    Deep Pockets. For those of you who think GPS personal navigation device market pricing is tough, the mobile phone market is cut throat. Volumes are out of this world, and in lots of countries around the globe, the volumes are more than the population! These volumes require deep pockets to keep up the investment to make money on decreasing margins.

    There has been a trend toward  consolidation in the GPS chip industry. Less than a year or two ago in Barcelona booths represented eRide (acquired by Furuno), Global Locate (acquired by Broadcom), GloNav (acquired by NXP, then wound up in ST Ericsson), Nemerix (which seems to have disappeared, though it’s rumored some assets went to another chip company), and finally SiRF (now part of CSR-SiRF). CSR-SiRF’s booth was more like a fortress, but at least I got to talk to the SiRF founder.

    It will be interesting to see what a Bluetooth-GPS company with a lot of cash in the bank plans as a next move. As for survivors, u-blox still had a booth (they weren’t acquired; they did an Initial Public Offering), and CellGuide had a small section of the Israel booth.

    App Planet. Since I first attended this show, global mobile-phone technology has gone from GSM voice to GPRS data to 3G voice/data to HSPA. Now comes LTE (Long Term Evolution), which is really a packet data network that can use VoIP.  Together, 3G and smartphones give us an environment which lets apps become a new business model worth billions. The Apps Planet hall showcased a lot of these models. The hall didn’t exist last year, but this year had 100 exhibitors. It easy to predict this number will grow.

    There are so many applications, they will need to differentiate to stand out from the crowd and gain mass. I think location-based apps need to get better, and I see that happening at the show. deCarta allows searches for places based on real walking distances or near the route you are traveling. Aloqa has clients for every smartphone with channels that you can choose for your interest. Mireo impressed me with not only natural text guidance (“turn left after the Apple store”) but its super-fast routing in less that 2 seconds, as opposed to 30-seconds-plus on other devices. It features algorithms with pre-stored routes to major junctions, so only the rest is routed. In any case, the net effect is you are routed before you have to think which way to drive or walk. I always say mobile phone users have short attention spans and expect instant gratification, and fast routing certainly helps.

    Finally, an Audi A5 Cabriolet displayed a solution for the European Commission’s eCall emergency call initiative, a car which automatically sends your position after an accident to a Public Safety Answering Point. eCall should be implemented in Europe by 2014, but Qualcomm is looking to put the system into the Audi A8 this year.
    Moni Malek is CEO of ML-C MobileLocation-Company GmbH, a new company integrating location and communication in a system platform.

    Motorola’s Christian Kurzke discusses Android with developers.
    Motorola’s Christian Kurzke discusses Android with developers.
  • The Spy Who Loved Me

    With apologies to James Bond, Ian Fleming, and, well, just about everybody else. Here is a grab from my mail bag.  The message was subject-lined: GPS Spy Applications.

    “I recently suspected my wife of cheating, having been involved with gps as a land surveyor since 1995, I used and application called mobile-spy.

    “In order to install the application onto an iPhone you have to “jailbreak” the phone. Once its installed it will forward all text, url’s, and a gps location every 30 minutes if it has satellite availability. To make a long story short, I caught my wife in a pretty precarious spot, or spots. It’s my opinion that she was sneaking out and meeting someone at various spots on our normal routes, little hidden offroad trails if you know what I mean. Well I tested and retested the phones gps and the data from the mobile-spy website where I purchased the software, which is actually sold under the name “retina-x” and they make there money by giving you access to these logs through mobile-spy.com.

    “However, my wife contests that all this data is wrong, of course, and she’s never been anywhere near these places. On the other hand, I have a ton of evidence saying she WAS at these locations. She says she’s read an article on AT&T that shows evidence that the gps in the iPhone is faulty and gives out bogus locations. As I said, I tested this a couple of times and it seemed to work perfectly.

    “In good faith we’ve agreed to let me take the iPhone and perform more in depth tracking over a span of a few weeks. I am not really a writer but I’ll definitely keep detailed logs of my observations. Have you guys already had this particular issue come up before? If so, I’d love to know anything you can tell me because the way it stands I am getting a divorce unless this application can be proven wrong! My email is [email protected]
    Cell phone is XXX.XXX-XXXX, I don’t check voicemails, so if I don’t answer just send me a text with your name and number. I look forward to hearing from you soon.”


    Sleep was what I wanted, you know what I got.  Wide awake, staying up late, wishing I was not.

  • Multi-Sensor, Multi-Network Positioning

    Multi-Sensor, Multi-Network Positioning

    By Ruizhi Chen, Heidi Kuusniemi, Yuwei Chen, Ling Pei, Wei Chen, Jingbin Liu, Helena Leppäkoski, Jarmo Takala

    Currently, no single technology, system, or sensor can provide a positioning solution any time, anywhere. The key is to utilize multiple technologies. We are now exploring a multi-sensor multi-network (MSMN) approach for a seamless indoor-outdoor solution. Its hardware platform is described in the previous article. The digital signal processor (DSP) is embedded in the GPS module. All sensors are integrated to the DSP that hosts core software for real-time sensor data acquisition and real-time processing to estimate user location. A smartphone handset provides wireless network measurements.

    Positioning Algorithms

    The multi-sensor positioning platform enables a positioning solution with a combination of GPS and reduced inertial navigation system (INS), or GPS and pedestrian dead reckoning (PDR). The reduced INS consists of a 3D accelerometer and a 2D digital compass, as a low-cost alternative to augment GNSS positioning. The reduced INS combined with GPS uses a loosely coupled Kalman filter for data integration, while the combination of PDR and GPS uses algorithms for estimating the position change with pedestrian step-length estimation.

    PDR. The PDR solution uses human physiological characteristics, implemented in a local-level frame, with equations:

    M-e1

    where k denotes the current epoch, Y is the coordinate in East direction, X is the coordinate in North direction, S is step length, and φ is the heading.

    The PDR positioning algorithm includes step detection, step length estimation, determination of heading, and positioning.

    To achieve an accurate heading, compass measurements are corrected with an empirical online estimated error model, which requires some training data.

    WLAN and Bluetooth. Figure 1 describes the basic concept of the WLAN or Bluetooth locating solution using a fingerprint database approach. The circles around the access point (AP) in the figure represent the radio coverage area and the color the signal strength. This radio map is a simplified example representing measurements from just one AP.

    FIGURE 1. Sample WLAN or Bluetooth fingerprint map, in meters.
    FIGURE 1. Sample WLAN or Bluetooth fingerprint map, in meters.

    For the fingerprinting approach, the received signal strength indicators (RSSIs) are the basic observables. The whole process consists of a training phase and a positioning phase. During the training phase, a radio map of probability distribution of the received signal strength is constructed for the targeted area. The targeted area is divided into a matrix of grids, and the central point of each grid is referred to as a reference point. The probability distribution of the received signal strength at each reference point is represented by a Weibull function, and the parameters of the Weibull function are estimated with the limited number of training observation samples. Based on the constructed radio map, the positioning phase determines the current location using the measured RSSI observations in real time.

    Given the observation vector M-e3, the problem is to find the most probable location (l) with the maximized conditional probability M-e4, maximized by Bayesian theorem as:

    M-e2

    We applied an assumption of Hidden Markov Models (HMM) to represent the pedestrian movement process. The locating problem is then translated into finding such a state sequence (locations) that is most likely to have generated the output sequence (the measured RSSIs) assuming the given HMM model. The Viterbi algorithm typically solves these kinds of problems efficiently. This study also utilizes the Viterbi algorithm to trace the user trajectory.

    MSMN. The general integration scheme combining the GPS output, sensor measurements, WLAN, or Bluetooth output, and their variance estimates is depicted in Figure 2. A simplified representation of the central filter combining different input sources can be described with typical Kalman filter equations. The measurement model is zk= Hkxk+vk where the state estimate vector isM-e5 ,

    with X, Y, and φ as previously defined, and S the user horizontal velocity (speed). The measurement vector is given as

    M-e6

    where g refers to GPS, W to WLAN/Bluetooth, acc to accelerometer, and dc to digital compass. The matrix Hk is the design matrix of the system and the vector vk is the measurement error vector.

    FIGURE  2. Integration scheme for multi-sensor, multi-network positioning approach
    FIGURE  2. Integration scheme for multi-sensor, multi-network positioning approach

    The recursive sequence includes prediction and update steps. The prediction step includes the typical equations of

    M-e7

    and

    M-e8

    while the update step includes

    M-e9

    Indoor Test Results

    A field test has been carried out on a sports field, described in the accompanying article (see Going 3D). An indoor test was carried out in an office-building corridor, but the test started and ended in an outdoor terrace area. During the test, the indoor corridor was covered with eight WLAN and three BT APs.

    Figure 3 shows the positioning results of the GPS-only (red), Bluetooth-only (black), and WLAN-only (magenta) solutions; Figure 4 shows that of the integrated multi-sensor multi-network (MSMN) solution (blue) for an outdoor-indoor-outdoor test. A reference trajectory is in green in both figures and building outlines in grey. The position update rate achievable by the WLAN and Bluetooth fingerprinting approach is only 0.1 Hz whereas the GPS-only and the integrated MSMN solutions are obtained every second and thus have a higher availability.

    FIGURE  3. Pedestrian test results with GPS-only, BT-only, and WLAN-only positioning approaches with respect to a reference trajectory
    FIGURE  3. Pedestrian test results with GPS-only, BT-only, and WLAN-only positioning approaches with respect to a reference trajectory
    FIGURE 4. Pedestrian test result with the multi-sensor multi-network positioning approach with respect to a reference trajectory
    FIGURE 4. Pedestrian test result with the multi-sensor multi-network positioning approach with respect to a reference trajectory

    Figure 5 shows the horizontal errors obtained with the different positioning solutions over time in the indoor test. A mean horizontal error of 2.2 meters was achieved with the WLAN solution. The Bluetooth solution is not as accurate as the WLAN solution, due to the smaller amount of BT APs; it achieved a mean horizontal error of 5.1 meters. When moving inside the corridor, the GPS solutions are used for the MSMN integration only with very low weights due to their poor quality. GPS is mainly used as a source of location outdoors where the test starts and ends. The mean horizontal error of the GPS-only solutions during the whole test is 8.4 meters. WLAN- and Bluetooth-derived locations and the self-contained sensors are the main sources used inside the building for the MSMN positioning solution: the mean horizontal accuracy o
    btained with MSMN is 2.7 meters with a solution availability of 1 Hz.

    FIGURE 5. Horizontal errors of GPS-only, BT-only, WLAN-only and the MSMN positioning approaches with respect to time in the pedestrian indoor test
    FIGURE 5. Horizontal errors of GPS-only, BT-only, WLAN-only and the MSMN positioning approaches with respect to time in the pedestrian indoor test

    The MSMN solution obviously performs much better than a GPS-only solution indoors. The track of the pedestrian walking inside the corridor can be identified clearly, which is not the case with typical approaches of GPS-only or GPS/low-cost sensors. WLAN fingerprinting provides good position accuracy indoors, but the MSMN solution provides the best result when taking into account positioning accuracy and the solution availabilities in both time and space domains.

    Conclusions

    Further development is needed for indoor areas to be able to obtain fully seamless outdoor-to-indoor location, though GPS initialization followed by sensor and WLAN/BT combination already provide very good initial results. Additional sensors and more refined pedestrian-specific algorithms will be added to further improve the positioning accuracy.

  • Going 3D

    Personal Nav and LBS

    To enrich user experience of location-based services and personal navigation, three-dimensional models such as those used in urban planning are added to a smartphone platform, without the requirement of additional hardware.

    Most current map applications for smartphones and other devices providing location-based services (LBS) are based on two-dimensional maps. Three-dimensional (3D) city models are widely used in applications such as engineering design, environmental modeling, and urban planning. Adapting such models for use in smartphones would make it possible to render 3D scenes in real time, enriching contents and user experience for personal navigation and LBS. A delimited yet large-scale event such as the upcoming 2010 World Exposition in Shanghai provides a promising area for system development and testing.

    3D visualization consumes a large amount of computing power, and most of the current successful applications run in a PC environment, as does the Google Earth 3D application. It is still a very challenging task to implement 3D visualization in an embedded system such as a smartphone.

    This article presents an entire 3D personal navigation system based on a smartphone platform, the Nokia S60 platform. The study covers the following aspects:

    • 3D personal navigation and LBS service in a smartphone
    • 3D city modelling, and
    • multi-sensor positioning.

    The objectives of the work include prototyping an entire handset-based 3D personal navigation and LBS system utilizing WLAN/Bluetooth positioning technologies, handset built-in GPS/AGPS, and 3D modeling and visualization (basic demonstration scenario), as well as presenting a multi-sensor positioning (MSP) platform in addition to the handset software (advanced demonstration scenario).

    3D Personal Navigation and LBS

    No additional hardware is added to the Nokia Series 60 (S60) smartphone platform to achieve the 3D visualizations or other functions in the software. Figure 1 demonstrates the functionalities and features available in the 3D viewing of the LBS software. Figure 2 shows the general architecture of the software.

    FIGURE 1.  Functionalities of the 3D LBS software
    FIGURE 1. Functionalities of the 3D LBS software
    FIGURE 2.  General architecture of the 3D personal navigation and LBS software
    FIGURE 2. General architecture of the 3D personal navigation and LBS software

    The software development work focuses on the UI layer, framework layer, and component layer. The software mainly includes the following components:

    • the 3D visualization engine based on OpenGL ES,
    • the route plan component,
    • the locator component,
    • the LBS client component, and
    • UI and framework.

    Most of the challenging tasks are included in the development of the elements in the component layer, especially in the development of the 3D visualization engine based on the OpenGL ES API that is available from the S60 platform SDK (Software Development Kit). The high-level 3D visualization engine architecture covers the interface layer, the core engine layer, and the data management layer. The first one is responsible for cross-component functional communication, request handling, and data exchange. It provides users with the 3D scene visualization functionalities to access the core engine layer via a single class called NaviSceneControl, which includes all the operations of the 3D visualization: scene zooming, view angle rotating, scene and cursor moving, and selecting route planning and virtual navigation.

    The core engine layer takes care of the 3D scene visualization computation and model object management. To enable the 3D visualization for a large region, the objects in the scene are classified into two categories in this layer. One is the 3D models like buildings, trees and poles, while the other is texture of land surface, which consist of ortho-rectified digital aerial photos. All the objects are processed as tiles according to the incoming parameters from the interface layer. Therefore only a small subset is loaded dynamically instead of the whole data.

    The data management layer accesses the 3D models and ground-texture images persistent on the flash disk of the mobile phone through an independent thread. To reduce the data size of the 3D models, the original .3ds file created from 3D Max Studio software is compressed to fulfill the requirements of the mobile device.

    A simple route plan component is implemented in the software to enable to the user to find and view the route to his or her destination. In order to be able to show the entire route, the calculated route will be displayed on top of a 3D view with a downward camera at a high altitude. The 3D scene in this case looks like an orthoimage. An orthoimage shows objects in the perpendicular view to the projection plane of the objects.

    The locator component aggregates the positioning information either from the built-in positioning sensors in the smartphone, a GPS receiver, and a WLAN (Wireless Local Area Network) or a Bluetooth chip, or any external positioning device, such as also the multi-sensor positioning (MSP) device developed in this project. It forwards the positioning information including the location and heading information to the route plan component and the 3D visualization engine to accomplish the navigation functions.

    The purpose of the LBS client component in the handset software is to access the LBS server.

    Figure 3 shows the overview of the mechanism for delivering the location-based services. The services are classified into two categories: the static services and the dynamic services. The static services include those services that are not changing in time. For example, POIs (points of interest) belong to this category of service. The static services are stored in a database that can be downloaded from the Internet by the users in advance. The users can store the database in the memory card of the phone before running the 3D personal navigation and LBS software. With this approach, it saves the data transmission fee for the end-users when accessing the LBS. The dynamic services cover those services that change in time. For example, a piece of real-time news is one of the typical dynamic LBS. For accessing the dynamic LBS, the Really Simple Syndication (RSS) technology is adapted in our implementation.

    FIGURE 3. Mechanism for delivering location-based services and information
    FIGURE 3. Mechanism for delivering location-based services and information

    The LBS client component is implemented so that the handset will pull automatically the news in the background in real time via a widget reader embedded in the LBS client component. Whenever new information is uploaded to the LBS server or to the registered web pages, mobile users will be notified.

    In addition to RSS technology, another approach to broadcast LBS information is considered in the system: to disseminate the LBS information via an SBAS (satellite-based augmentation system) pseudolite. The dynamic LBS information (e.g., a short message) can be first encoded into a user-defined SBAS message. The message encoded is then sent to a pseudolite from which the message is broadcast. The corresponding SBAS message can, in fact, be received by any SBAS-enabled receiver located within radio coverage area of the pseudolite. However, the encoded LBS message can be decoded only with the receiver that has a special firmware, developed in this case by the Finnish Geodetic Institute (FGI). Having received and decoded the LBS messages transmitted from the pseudolite with a dedicated receiver, for example the MSP device part of the more advanced demonstration scenario of the project, the content of the message is then encoded to a user-defined NMEA (National Marine Electronics Association) message and transmitted to a mobile phone in the vicinity via a Bluetooth connection as shown in Figure 3. This solution of LBS data distribution is available only to a very limited number of users with receivers carting a special firmware developed by FGI.

    3D City Modeling

    Due to the memory limitations of a mobile phone, there are certain requirements for the 3D models applied. In our study, a test scene for model reconstruction is focused on a street in Espoo, Finland, in an ordinary residential area. A vehicle-borne mobile mapping system ROAMER (see photo) developed by FGI performed the data acquisition. It consists of a carrying platform, a positioning and navigation system, and a 3D laser scanner system. With the ROAMER system, visible objects can be measured with an accuracy of a few decimeters with a maximum vehicle speed of 50–60 km/hour, and the data for the desired objects can be collected within the range of several tens of meters.

    ROAMER vehicle-based mobile mapping system
    ROAMER vehicle-based mobile mapping system.

    A large amount of data is produced from the system, and noise and outlier points are needed to be removed. Valid data is classified into different point groups using an automatic algorithm developed by FGI. These point groups include buildings, trees, roads, and poles. Models are then reconstructed based on these classified point groups.

    Modeling methods are developed to meet the application requirements of personal navigation: small model size, high accuracy, and good visual appearance. Small model size is achieved by simplified object geometry and reduced texture resolution. Model accuracy is controled by extracting building outlines from a classified point cloud and overlapping with the final 3D model. The model completeness is checked by comparing the resulting model with original images. Good visual effect is realized by applying photo-realistic texture. Photo-realistic texture provides rich information for the 3D scene reconstructed. Figure 4 presents the total process of the 3D modeling, in which only the individual object texture and the final model constructions require manual editing. Figure 5 shows the raw data retrieved and Figure 6 presents the final 3D models of the test area.

    FIGURE  4. The process of 3D modeling
    FIGURE  4. The process of 3D modeling
    FIGURE  5. Raw data retrieved from the test area with FGI’s ROAMER system
    FIGURE  5. Raw data retrieved from the test area with FGI’s ROAMER system
    FIGURE  6. Reconstructed 3D scene of the test area
    FIGURE  6. Reconstructed 3D scene of the test area

    To import the final 3D models to a mobile phone, the size of an individual model is restricted to less than 100 kb. To optimize model size, a row of buildings is divided into several building blocks.

    Multi-Sensor Positioning

    As long as open-sky satellite-signal conditions are available, there are no problems to locate a mobile user with the built-in GPS receiver of a smartphone with a positioning accuracy of a few meters. However, most popular location-based services occur in GNSS-degraded environments such as in indoor environments and urban canyons. Locating a mobile user seamlessly any time anywhere under any circumstance is still a very challenging task, especially to implement such an indoor/outdoor positioning solution in a digital signal processor (DSP) platform.

    FGI is now developing a DSP-based multi-sensor positioning platform to approach a seamless indoor/outdoor locating solution. The platform consists of a GPS module, a 3D accelerometer, and a 2D digital compass (Figure 7). A DSP is embedded in the GPS module. All sensors are integrated to the DSP that hosts a core software for real-time sensor data acquisition and real-time processing to estimate user’s location.

    FIGURE  7. Hardware platform
    FIGURE  7. Hardware platform

    The multi-sensor platform provides opportunities to investigate the positioning solutions with a GPS/Reduced-INS (Inertial Navigation System) combination or GPS/PDR (Pedestrian Dead Reckoning) combination. The Reduced-INS combination is defined as a combination of a 3D accelerometer and a 2D digital compass, and is a very low-cost approach of sensor augmentation. The GPS/Reduced-INS implementation is implemented in a loosely coupled Kalman filter, while the GPS/PDR algorithm is based on pedestrian-targeted dead reckoning, with heading error and step length estimation methodology.

    Preliminary tests analyzing both GPS/Reduced-INS and GPS/PDR solutions have been carried out in a sports field on a 400-meter running track. In order to simulate a GPS outage situation, the GPS measurements were ignored for one minute. During this one minute “outage,” the traveling trajectories are estimated with the Reduced-INS solution and the PDR solution. Figure 8 shows the trajectory of the Reduced-INS solution, while Figure 9 shows that of the PDR solution.

     FIGURE  8. Trajectory estimation for the 1-minute GPS outage using Reduced-INS approach
    FIGURE  8. Trajectory estimation for the 1-minute GPS outage using Reduced-INS approach
    FIGURE  9. Trajectory estimation for the 1-minute GPS outage using the PDR approach
    FIGURE  9. Trajectory estimation for the 1-minute GPS outage using the PDR approach

    The Reduced-INS approach provides a reasonable result with a positioning accuracy of about 20 meters at the end of the forced 1-minute GPS outage. The PDR approach provides a better prediction in this case, resulting in only a couple of meters of error after the 1-minute outage of absolute location input from the GPS, because the heading errors are modeled carefully utilizing previous training with data from a previous run along the same track as well as accurate step detection estimation.

    Conclusions

    The prototype system will be tested and demonstrated at the 2010 World Expo in Shanghai, implemented with a smartphone software package: anyone with a Nokia phone (S60 with built-in GPS and WLAN/BT) can experience the 3D personal navigation and LBS service in the Expo area by downloading and installing the 3D models. The prototype has so far met these challenges: the high performance required of real-time 3D visualization in a smartphone; high positioning availability with acceptable accuracy in indoor and outdoor environments; and the demanding requirements of the 3D models for a small phone, including small model size, high accuracy, and good visual appearance.

    Manufacturers

    The multi-sensor positioning platform consists of a Fastrax iTrax03 GPS module, a VTI SCA3000-D1 3D accelerometer, and a Honeywell HMC6352 2D digital compass. The ROAMER mobile mapping system consists of a Faro LS 880HE80 terrestrial laser scanner, two AVT Oscar F-810C cameras, and a NovAtel SPAN geo-reference system.


    RUIZHI CHEN is a professor and head of the Department of Navigation and Positioning at the Finnish Geodetic Institute, where Heidi Kuusniemi is a specialist research scientist, Juha Hyyppä is a professor and head of the Department of Remote Sensing and Photogrammetry, Risto Kuittinen is director general, Yuwei Chen is a specialist research scientist, and Ling Pei, Lingli Zhu and Jingbin Liu are senior research scientists.

    JIXIAN ZHANG is a professor and president of the Chinese Academy of Surveying and Mapping, where Yan Qin and Zhengjun Liu also work as the director of the Department of Research and Development and the group leader in the Institute of Photogrammetry and Remote Sensing, respectively.

    JARMO TAKALA is a professor and head of the Department of Computer Systems at Tampere University of Technology in Finland, where Helena Leppäkoski is a researcher.

    JIANYU WANG is a professor at the Shanghai Institute of Technical Physics, Chinese Academy of Sciences.


  • Testing Software Receivers

    To meet the challenges inherent in producing a low-cost, highly CPU-efficient software receiver, the multiple offset post-processing method leverages the unique features of software GNSS to greatly improve the coverage and statistical validity of receiver testing compared to traditional, hardware-based testing setups, in some cases by an order of magnitude or more.

    By Alexander Mitelman, Jakob Almqvist, Robin Håkanson, David Karlsson, Fredrik Lindström, Thomas Renström, Christian Ståhlberg, and James Tidd, Cambridge Silicon Radio

    Real-world GNSS receiver testing forms a crucial step in the product development cycle. Unfortunately, traditional testing methods are time-consuming and labor-intensive, particularly when it is necessary to evaluate both nominal performance and the likelihood of unexpected deviations with a high level of confidence. This article describes a simple, efficient method that exploits the unique features of software GNSS receivers to achieve both goals. The approach improves the scope and statistical validity of test coverage by an order of magnitude or more compared with conventional methods.

    While approaches vary, one common aspect of all discussions of GNSS receiver testing is that any proposed testing methodology should be statistically significant. Whether in the laboratory or the real world, meeting this goal requires a large number of independent test results. For traditional hardware GNSS receivers, this implies either a long series of sequential trials, or the testing of a large number of nominally identical devices in parallel. Unfortunately, both options present significant drawbacks.

    Owing to their architecture, software GNSS receivers offer a unique solution to this problem. In contrast with a typical hardware receiver application-specific integrated circuit (ASIC), a modern software receiver typically performs most or all baseband signal processing and navigation calculations on a general-purpose processor. As a result, the digitization step typically occurs quite early in the RF chain, generally as close as possible to the signal input and first-stage gain element. The received signal at that point in the chain consists of raw intermediate frequency (IF) samples, which typically encapsulate the characteristics of the signal environment (multipath, fading, and so on), receiving antenna, analog RF stage (downconversion, filtering, and so on), and sampling, but are otherwise unprocessed. In addition to ordinary real-time operation, many software receivers are also capable of saving the digital data stream to disk for subsequent post-processing. Here we consider the potential applications of that post-processing to receiver testing.

    FIGURE1. Conventional test drive (two receivers)
    FIGURE1. Conventional test drive (two receivers)

    Conventional Testing Methods

    Traditionally, the simplest way to test the real-world performance of a GNSS receiver is to put it in a vehicle or a portable pack; drive or walk around an area of interest (typically a challenging environment such as an “urban canyon”); record position data; plot the trajectory on a map; and evaluate it visually. An example of this is shown in Figure 1 for two receivers, in this case driven through the difficult radio environment of downtown San Francisco.

    While appealing in its simplicity and direct visual representation of the test drive, this approach does not allow for any quantitative assessment of receiver performance; judging which receiver is “better” is inherently subjective here. Different receivers often have different strong and weak points in their tracking and navigation algorithms, so it can be difficult to assess overall performance, especially over the course of a long trial. Also, an accurate evaluation of a trial generally requires some first-hand knowledge of the test area; unless local maps are available in sufficiently high resolution, it may be difficult to tell, for example, how accurate a trajectory along a wooded area might be.

    In Figure 2, it appears clear enough that the test vehicle passed down a narrow lane between two sets of buildings during this trial, but it can be difficult to tell how accurate this result actually is. As will be demonstrated below, making sense of a situation like this is essentially beyond the scope of the simple “visual plotting” test method.

    FIGURE 2. Test result requiring local knowledge to interpret correctly.
    FIGURE 2. Test result requiring local knowledge to interpret
    correctly.

    To address these shortcomings, the simple test method can be refined through the introduction of a GNSS/INS truth reference system. This instrument combines the absolute position obtainable from GNSS with accurate relative measurements from a suite of inertial sensors (accelerometers, gyroscopes, and occasionally magnetometers) when GNSS signals are degraded or unavailable. The reference system is carried or driven along with the devices under test (DUTs), and produces a truth trajectory against which the performance of the DUTs is compared.

    This refined approach is a significant improvement over the first method in two ways: it provides a set of absolute reference positions against which the output of the DUTs can be compared, and it enables a quantitative measurement of position accuracy. Examples of these two improvements are shown in Figure 3 and Figure 4.

    FIGURE 3. Improved test with GPS/INS truth reference: yellow dots denote receiver under test; green dots show the reference trajectory of GPS/INS.
    FIGURE 3. Improved test with GPS/INS truth reference: yellow
    dots denote receiver under test; green dots show the reference
    trajectory of GPS/INS.
    FIGURE 4. Time-aligned 2D error.
    FIGURE 4. Time-aligned 2D error.

    As shown in Figure 4, interpolating the truth trajectory and using the resulting time-aligned points to calculate instantaneous position errors yields a collection of scalar measurements en. From these values, it is straightforward to compute basic statistics like mean, 95th percentile, and maximum errors over the course of the trial. An example of this is shown in Figure 5, with the data (horizontal 2D error in this case) presented in several different ways. Note that the time interpolation step is not necessarily negligible: not all devices align their outputs to whole second boundaries of GPS time, so assuming a typical 1 Hz update rate, the timing skew between a DUT and the truth reference can be as large as 0.5 seconds. At typical motorway speeds, say 100 km/hr, this results in a 13.9 meter error between two points that ostensibly represent the same position. On the other hand, high-end GPS/INS systems can produce outputs at 100 Hz or higher, in which case this effect may be safely neglected.

    FIGURE 5. Quantifying error using a truth reference
    FIGURE 5. Quantifying error using a truth reference

    Despite their utility, both methods described above suffer from two fundamental limitations: results are inherently obtainable only in real time, and the scope of test coverage is limited to the number of receivers that can be fixed on the test rig simultaneously. Thus a test car outfitted with five receivers (a reasonable number, practically speaking) would be able to generate at most five quasi-independent results per outing.


    Software Approach

    The architecture of a software GNSS receiver is ideally suited to overcoming the limitations described above, as follows.

    The raw IF data stream from the analog-to-digital converter is recorded to a file during the initial data collection. This file captures the essential characteristics of the RF chain (antenna pattern, downconverter, filters, and so on), as well as the signal environment in which the recording was made (fading, multipath, and so on). The IF file is then reprocessed offline multiple times in the lab, applying the results of careful profiling of various hardware platforms (for example, Pentium-class PC, ARM9-based embedded device, and so on) to properly model the constraints of the desired target platform. Each processing pass produces a position trajectory nominally identical to what the DUT would have gathered when running live. The complete multiple offset post-processi
    ng (MOPP) setup is illustrated in Figure 6.

    FIGURE 6. Multiple Offset Post-Processing (MOPP).
    FIGURE 6. Multiple Offset Post-Processing (MOPP).

    The fundamental improvement relative to a conventional testing approach lies in the multiple reprocessing runs. For each one, the raw data is processed starting from a small, progressively increasing time offset relative to the start of the IF file. A typical case would be 256 runs, with the offsets uniformly distributed between 0 and 100 milliseconds — but the number of runs is limited only by the available computing resources, and the granularity of the offsets is limited only by the sampling rate used for the original recording. The resulting set of trajectories is essentially the physical equivalent of having taken a large number of identical receivers (256 in this example), connecting them via a large signal splitter to a single common antenna, starting them all at approximately the same time (but not with perfect synchronization), and traversing the test route.

    This approach produces several tangible benefits.

    • The large number of runs dramatically increases the statistical significance of the quantitative results (mean accuracy, 95th percentile error, worst-case error, and so on) produced by the test.
    • The process significantly increases the likelihood of identifying uncommon (but non-negligible) corner cases that could only be reliably found by far more testing using ordinary methods.
    • The approach is deterministic and completely repeatable, which is simply a consequence of the nature of software post-processing. Thus if a tuning improvement is made to the navigation filter in response to a particular observed artifact, for example, the effects of that change can be verified directly.
    • The proposed approach allows the evaluation of error models (for example, process noise parameters in a Kalman filter), so estimated measurement error can be compared against actual error when an accurate truth reference trajectory (such as that produced by the aforementioned GPS/INS) is available. Of course, this could be done with conventional testing as well, but the replay allows the same environment to be evaluated multiple times, so filter tuning is based on a large population of data rather than a single-shot test drive.
    • Start modes and assistance information may be controlled independently from the raw recorded data. So, for example, push-to-fix or A-GNSS performance can be tested with the same granularity as continuous navigation performance.

    From an implementation standpoint, the proposed approach is attractive because it requires limited infrastructure and lends itself naturally to automated implementation. Setting up handful of generic PCs is far simpler and less expensive than configuring several hundred identical receivers (indeed, space requirements and RF signal splitting considerations alone make it impractical to set up a test rig with anywhere near the number of receivers mentioned above). As a result, the software replay setup effectively increases the testing coverage by several orders of magnitude in practice. Also, since post-processing can be done significantly faster than real time on modern hardware, these benefits can be obtained in a very time-efficient manner.

    As with any testing method, the software approach has a few drawbacks in addition to the benefits described above. These issues must be addressed to ensure that results based on post-processing are valid and meaningful.

    Error and Independence

    The MOPP approach raises at least two obvious questions that merit further discussion.

    • How accurately does file replay match live operation?
    • Are runs from successive offsets truly independent?

    The first question is answered quantitatively, as follows. A general-purpose software receiver (running on an x86-class netbook computer) was driven around a moderately challenging urban environment and used to gather live position data (NMEA) and raw digital data (IF samples) simultaneously. The IF file was post-processed with zero offset using the same receiver executable, incorporating the appropriate system profiling to accurately model the constraints of real-time processing as described above, to yield a second NMEA trajectory. Finally, the two NMEA files were compared using the methods shown in Figure 4 and Figure 5, this time substituting the post-processed trajectory for the GPS/INS reference data. A plot of the resulting horizontal error is shown in Figure 7.

     FIGURE 7. Quantifying error introduced by post-processing.
    FIGURE 7. Quantifying error introduced by post-processing.

    The mean horizontal error introduced by the post-processing approach relative to the live trajectory is on the order of 2.5 meters. This value represents the best accuracy achievable by file replay process for this environment.

    More challenging environments will likely have larger minimum error bounds, but that aspect has not yet been investigated fully; it will be considered in future work. Also, a single favorable comparison of live recording against a single replay, as shown above, does not prove that the replay procedure will always recreate a live test drive with complete accuracy. Nevertheless, this result increases the confidence that a replayed trajectory is a reasonable representation of a test drive, and that the errors in the procedure are in line with the differences that can be expected between two identical receivers being tested at the same time.

    To address the question of run-to-run independence, consider two trajectories generated by post-processing a single IF file with offsets jB and kB, where B is some minimum increment size (one sample, one buffer, and so on), and define FJK to be some quantitative measurement of interest, for example mean or 95th percentile horizontal error. The deterministic nature of the file replay process guarantees FJK = 0 for j = k. Where j and k differ by a sufficient amount to generate independent trajectories, FJK will not be constant, but should be centered about some non-negative underlying value that represents the typical level of error (disagreement) between nominally identical receivers. As mentioned earlier, this is the approximate equivalent of connecting two matched receivers to a common antenna, starting them at approximately the same time, and driving them along the test trajectory.

    Given these definitions, independence is indicated by an abrupt transition in FJK between identical runs ( j = k) and immediately adjacent runs (|j – k| = 1) for a given offset spacing B. Conversely, a gradual transition indicates temporal correlation, and could be used to determine the minimum offset size required to ensure run-to-run independence if necessary. As shown in Figure 8, the MOPP parameters used in this study (256 offsets, uniformly spaced on [0, 100 msec] for each IF file) result in independent outputs, as desired.

    M-8TOP
    M-8BOT

    FIGURE 8. Verifying independence of adjacent offsets (upper: full view; lower: zoomed top view)


    One subtlety pertaining to the independence analysis deserves mention here in the context of the MOPP method. Intuitively, it might appear that the offset size B should have a lower usable bound, below which temporal correlation begins to appear between adjacent post-processing runs. Although a detailed explanation is outside the scope of this paper, it can be shown that certain architectural choices in the design of a receiver’s baseband can lead to somewhat counterintuitive results in this regard.

    As a simple example, consider a receiver that does not forcibly align its channel measurements to whole-second boundaries of system time. Such a device will produce its measurements at slightly different times with respect to the various timing markers in the incoming signal (epoch, subframe, and frame boundaries) for each different post-processing offset. As a result, the position solution at a given time point will differ slightly between adjacent post-processing runs until the offset size becomes smaller than the receiver’s granularity limit (one packet, one sample, and so on), at which point the outputs from successive offsets will become identical. Conversely, altering the starting point by even a single offset will result in a run sufficiently different from its predecessor to warrant its inclusion in a statistical population.

    Application-to-Receiver Optimization

    Once the independence and lower bound on observable error have been established for a particular set of post-processing parameters, the MOPP method becomes a powerful tool for finding unexpected corner cases in the receiver implementation under test. An example of this is shown in Figure 9, using the 95th percentile horizontal error as the statistical quantity of interest.

    M-9TOP

    M-9BOT
    FIGURE 9. Identifying a rare corner case (upper: full view; lower: top view)


    For this IF file, the “baseline” level for the 95th percentile horizontal error is approximately 6.7 meters. The trajectory generated by offset 192, however, exhibits a 95th percentile horizontal error with respect to all other trajectories of approximately 12.9 meters, or nearly twice as large as the rest of the data set. Clearly, this is a significant, but evidently rare, corner case — one that would have required a substantial amount of drive testing (and a bit of luck) to discover by conventional methods.

    When an artifact of the type shown above is identified, the deterministic nature of software post-processing makes it straightforward to identify the particular conditions in the input signal that trigger the anomalous behavior. The receiver’s diagnostic outputs can be observed at the exact instant when the navigation solution begins to diverge from the truth trajectory, and any affected algorithms can be tuned or corrected as appropriate. The potential benefits of this process are demonstrated in Figure 10.

    M-10TOP

    M-10BOT
    FIGURE 10. Before (top) and after (bottom) MOPP-guided tuning (blue = 256 trajectories; green = truth)

    Limitations

    While the foregoing results demonstrate the utility of the MOPP approach, this method naturally has several limitations as well. First, the IF replay process is not perfect, so a small amount of error is introduced with respect to the true underlying trajectory as a result of the post-processing itself. Provided this error is small compared to those caused by any corner cases of interest, it does not significantly affect the usefulness of the analysis — but it must be kept in mind.

    Second, the accuracy of the replay (and therefore the detection threshold for anomalous artifacts) may depend on the RF environment and on the hardware profiling used during post-processing; ideally, this threshold would be constant regardless of the environment and post-processing settings.

    Third, the replay process operates on a single IF file, so it effectively presents the same clock and front-end noise profile to all replay trajectories. In a real-world test including a large number of nominally identical receivers, these two noise sources would be independent, though with similar statistical characteristics. As with the imperfections in the replay process, this limitation should be negligible provided the errors due to any corner cases of interest are relatively large.

    Conclusions and Future Work

    The multiple offset post-processing method leverages the unique features of software GNSS receivers to greatly improve the coverage and statistical validity of receiver testing compared to traditional, hardware-based testing setups, in some cases by an order of magnitude or more. The MOPP approach introduces minimal additional error into the testing process and produces results whose statistical independence is easily verifiable. When corner cases are found, the results can be used as a targeted tuning and debugging guide, making it possible to optimize receiver performance quickly and efficiently.

    Although these results primarily concern continuous navigation, the MOPP method is equally well-suited to tuning and testing a receiver’s baseband, as well its tracking and acquisition performance. In particular, reliably short time-to-first-fix is often a key figure of merit in receiver designs, and several specifications require acquisition performance to be demonstrated within a prescribed confidence bound. Achieving the desired confidence level in difficult environments may require a very large number of starts — the statistical method described in the 3GPP 34.171 specification, for example, can require as many as 2765 start attempts before a pass or fail can be issued — so being able to evaluate a receiver’s acquisition performance quickly during development and testing, while still maintaining sufficient confidence in the results, is extremely valuable.

    Future improvements to the MOPP method may include a careful study of the baseline detection threshold as a function of the testing environment (open sky, deep urban canyon, and so on). Another potentially fruitful line of investigation may be to simulate the effects of physically distinct front ends by adding independent, identically distributed swaths of noise to copies of the raw IF file prior to executing the multiple offset runs.


    Alexander Mitelman is GNSS research manager at Cambridge Silicon Radio. He earned his M.S. and Ph.D. degrees in electrical engineering from Stanford University. His research interests include signal quality monitoring and the development of algorithms and testing methodologies for GNSS.
    Jakob Almqvist is an M.Sc. student at Luleå University of Technology in Sweden, majoring in space engineering, and currently working as a software engineer at Cambridge Silicon Radio.
    Robin Håkanson is a software engineer at Cambridge Silicon Radio. His interests include the design of optimized GNSS software algorithms, particularly targeting low-end systems.
    David Karlsson leads GNSS test activities for Cambridge Silicon Radio. He earned his M.S. in computer science and engineering from Linköping University, Sweden. His current focus is on test automation development for embedded software and hardware GNSS receivers.
    Fredrik Lindström is a software engineer at Cambridge Silicon Radio. His primary interest is general GNSS software development.
    Thomas Renström is a software engineer at Cambridge Silicon Radio. His primary interests include developing acquisition and tracking algorithms for GNSS software receivers.
    Christian Ståhlberg is a senior software engineer at Cambridge Silicon Radio. He holds an M.Sc. in computer science from Luleå University of Technology. His research interests include the development of advanced algorithms for GNSS signal processing and their mapping to computer architecture.
    James Tidd is a senior navigation engineer at Cambridge Silicon Radio. He earned his M.Eng. from Loughborough University in systems engineering. His research interests
    include integrated navigation, encompassing GNSS, low-cost sensors, and signals of opportunity.
  • The Smartphone Revolution

    Seven technologies that put GPS in mobile phones around the world — the how and why of location’s entry into modern consumer mobile communications.

    By Frank van Diggelen, Broadcom Corporation

    Exactly a decade has passed since the first major milestone of the GPS-mobile phone success story, the E-911 legislation enacted in 1999. Ensuing developments in that history include:

    • Snaptrack bought by Qualcomm in 2000 for $1 billion, and many other A-GPS startups are spawned.
    • Commercial GPS receiver sensitivity increases roughly 30 times, to 2150 dBm (1998), then another 10 times, to 2160 dBm in 2006, and perhaps another three times to date, for a total of almost 1,000 times extra sensitivity. We thought the main benefit of this would be indoor GPS, but perhaps even more importantly it has meant very, very cheap antennas in mobile phones. Meanwhile:
    • Host-based GPS became the norm, radically simplifying the GPS chip, so that, with the cheap antenna, the total bill of materials (BOM) cost for adding GPS to a phone is now just a few dollars!

    Thus we see GPS penetration increasing in all mobile phones and, in particular, going towards 100 percent in smartphones.

    This article covers the technology revolution behind GPS in mobile phones; but first, let’s take a brief look at the market growth. This montage gives a snapshot of 28 of the 228 distinct Global System for Mobile Communications (GSM) smartphone models (as of this writing) that carry GPS.


    Back in 1999, there were no smartphones with GPS; five years later still fewer than 10 different models; and in the last few years that number has grown above 200. This is that rare thing, often predicted and promised, seldom seen: the hockey stick!

    The catalyst was E-911 — abetted by seven different technology enablers, as well as the dominant spin-off technology (long-term orbits) that has taken this revolution beyond the cell phone.

    In 1999, the Federal Communications Commission (FCC) adopted the E-911 rules that were also legislated by the U.S. Congress. Remember, however, that E-911 wasn’t all about GPS at first.

    It was initially assumed that most of the location function would be network-based. Then, in September 1999, the FCC modified the rules for handset technologies. Even then, assisted GPS (A-GPS) was only adopted in the mobile networks synchronized to GPS time, namely code-division multiple access (CDMA) and integrated digital enhanced network (iDEN, a variant of time-division multiple access).

    The largest networks in the world, GSM and now 3G, are not synchronized to GPS time, and, at first, this meant that other technologies (such as enhanced observed time difference, now extinct) would be the E-911 winners. As we all now know, GPS and GNSS are the big winners for handset location. E-911 became the major driver for GPS in the United States, and indirectly throughout the world, but only after GPS technology evolved far enough, thanks to the seven technologies I will now discuss.

    Technology #1. Assisted GPS

    There are three things to remember about A-GPS: “faster, longer, higher.” The Olympic motto is “faster, stronger, higher,” so just think of that, but remember “faster, longer, higher.”

    The most obvious feature of A-GPS is that it replaces the orbit data transmitted by the satellite. A cell tower can transmit the same (or equivalent) data, and so the A-GPS receiver operates — faster.

    The receiver has to search over a two-dimensional code/frequency space to find each GPS satellite signal in the first place. Assistance data reduces this search space, allowing the receiver to spend longer doing signal integration, and this in turn means higher sensitivity (Figure 1). Longer, higher.

    FIGURE 1. A-GPS: reduced search space allows longer integration for higher sensitivity.
    FIGURE 1. A-GPS: reduced search space allows longer integration for higher sensitivity.

    Now let’s look at this code/frequency search in more detail, and introduce the concepts of fine time, coarse time, and massive parallel correlation. Any assistance data helps reduce the frequency search. The frequency search is just as you might scan the dial on a car radio looking for a radio station — but the different GPS frequencies are affected by the satellite motion, their Doppler effect. If you know in advance whether the satellite is rising or setting, then you can narrow the frequency-search window.

    The code-delay is more subtle. The entire C/A code repeats every millisecond. So narrowing the code-delay search space requires knowledge of GPS time to better than one millisecond, before you have acquired the signal. We call this “fine-time.”

    Only two phone systems had this time accuracy: CDMA and iDEN, both synchronized to GPS time. The largest networks (GSM, and now 3G) are not synchronized to GPS time. They are within 62 seconds of GPS time; we call this “coarse-time.” Initially, only the two fine-time systems adopted A-GPS. Then came massive parallel correlation, technology number two, and high sensitivity, technology number three.

    #2, #3. MPC, High Sensitivity

    A simplified block diagram of a GPS receiver appears in Figure 2. Traditional GPS (prior to 1999) had just two or three correlators per channel. They would search the code-delay space until they found the signal, and then track the signal by keeping one correlator slightly ahead (early) and one slightly behind (late) the correlation peak. These are the so-called “early-late”correlators.


    FIGURE 2. Massive parallel correllation
    FIGURE 2. Massive parallel correllation.

    Massive parallel correlation is defined as enough correlators to search all C/A code delays simultaneously on multiple channels. In hardware, this means tens of thousands of correlators. The effect of massive parallel correlation is that all code-delays are searched in parallel, so the receiver can spend longer integrating the signal whether or not fine-time is available.

    So now we can be faster, longer, higher, regardless of the phone system on which we implement A-GPS.

    Major milestones of massive parallel correlation (MPC):

    • In 1999, MPC was done in software, the most prominent example being by Snaptrack, who did this with a fast Fourier transform (FFT) running on a digital signal processor (DSP). The first chip with MPC in hardware was the GL16000, produced by Global Locate, then a small startup (now owned by Broadcom).
    • In 2005, the first smartphone implementation of MPC: the HP iPaq used the GL20000 GPS chip. Today MPC is standard on GPS chips found in mobile phones.

    #4. Coarse-Time Navigation

    We have seen that A-GPS assistance relieves the receiver from decoding orbit data (making it faster), and MPC means it can operate with coarse-time (longer, higher).

    But the time-of-week (TOW) still needed to be decoded for the position computation and navigation: for unambiguous pseudoranges, and to know the time of transmission. Coarse-time navigation is a technique for solving for TOW, instead of decoding it. A key part of the technique involves adding an extra state to the standard navigation equation, and a corresponding extra column to the well known line-of-sight matrix.

    The technical consequence of this technique is that you can get a position faster than it is possible to decode TOW (for example, in one, two, or three seconds), or you can get a position when the signals are too weak to decode TOW. And a practical consequence is longer battery life: since you can get fast time-to-first-fix (TTFF) always, without frequently waking and running the receiver to maintain it in a hot-start state.

    #5. Low Time-of-Week

    A parallel effort to coarse-time navigation is low TOW decode, that is, lowering the threshold at which
    it is possible to decode the TOW data. In 1999, it was widely accepted that -142 dBm was the lower limit of signal strength at which you could decode TOW. This is because -142 dBm is where the energy in a single data bit is just observable if all you do is integrate for 20 ms.

    However, there have evolved better and better ways of decoding the TOW message, so that now it can be done down to -152 dBm. Today, different manufacturers will quote you different levels for achievable TOW decode, anywhere from -142 to -152 dBm, depending on who you talk to. But they will all tell you that they are at the theoretical minimum!

    #6, #7. Host-Based GPS, RF-CMOS

    Host-based GPS and RF-CMOS are technologies six and seven, if you’re still counting with me. We can understand the host-based architecture best by starting with traditional system-on-chip (SOC) architecture. An SOC GPS may come in a single package, but inside that package you would find three separate die, three separate silicon chips packaged together: A baseband die, including the central processing unit (CPU); a separate radio frequency tuner; and flash memory. The only cost-effective way of avoiding the flash memory is to have read-only memory (ROM), which could be part of the baseband die — but that means you cannot update the receiver software and keep up with the technological developments we’ve been talking about. Hence state-of-the-art SOCs throughout the last decade, and to date, looked like Figure 3.

    FIGURE 3. Host-based architecture, compared to SOC
    FIGURE 3. Host-based architecture, compared to SOC.

    The host-based architecture, by contrast, needs no CPU in the GPS. Instead, GPS software runs on the CPU and flash memory already present on the host device (for example, the smartphone). Meanwhile, radio-frequency complementary metal-oxide semi-conductor (RF-CMOS) technology allowed the RF tuner to be implemented on the same die as the baseband. Host-based GPS and RF- CMOS together allowed us to make single die GPS chips.

    The effect of this was that the cost of the chip went down dramatically without any loss in performance.

    Figure 4 shows the relative scales of some of largest-selling SOC and host- based chips, to give a comparative idea of silicon size (and cost). The SOC chip (on the left) is typically found in devices that need a CPU, while the host-based chip is found in devices that already have a CPU.


    FIGURE 4. Relative sizes of host-based, compared to SOC
    FIGURE 4. Relative sizes of host-based, compared to SOC.

    In 2005, the world’s first single-die GPS receiver appeared. Thanks to the single die, it had a very low bill of materials (BOM) cost, and has sold more than 50 million into major-brand smartphones and feature phones on the market.

    Review

    We have seen that E-911 was the big catalyst for getting GPS into phones, although initially only in CDMA and iDEN phones. E-911 became the driver for all phones once GPS evolved far enough, thanks to the seven technology enablers:

    • A-GPS >> faster, longer, higher
    • Massive parallel correlation >> longer, higher with coarse-time
    • High-sensitivity >> cheap antennas
    • Coarse time navigation >> fast TTFF without periodic wakeup
    • Low TOW >> decode from weak signals
    • Host-based GPS, together with
    • RF-CMOS g single die.

    Meanwhile, as all this developed, several important spin-off technologies evolved to take this technology beyond the mobile phone. The most significant of all of these was long-term orbits (LTO), conceived on May 2, 2000, and now an industry standard.

    Long-Term Orbits

    Why May 2, 2000? Remember what happened on May 1, 2000: the U.S. government turned off selective availability (SA) on all GPS satellites. Suddenly it became much easier to predict future satellite orbits (and clocks) from the observations made by a civilian GPS network. At Global Locate, we had just such a network for doing A-GPS, as illustrated in Figure 5. On May 2 we said, “SA is off — wow! What does that mean for us?”And that’s where LTO for A-GPS came from.

    FIGURE 5. Broadcast ephemeris and long-term orbits
    FIGURE 5. Broadcast ephemeris and long-term orbits.

    Figure 5 shows the A-GPS environment with and without LTO. The left half shows the situation with broadcast ephemeris only. An A-GPS reference station observes the broadcast ephemeris and provides it (or derived data) to the mobile A-GPS receiver in your mobile phone. The satellite has the orbits for many hours into the future; the problem is that you can’t get them.

    The blue and yellow blocks in the diagram represent how the ephemeris is stored and transmitted by the GPS satellite. The current ephemeris (yellow) is transmitted; the future ephemeris (blue) is stored in the satellite memory until it becomes current. So, frustratingly, even though the future ephemeris exists, you cannot ordinarily get it from the GPS system itself.

    The right half of the figure shows the situation with LTO. If a network of reference stations observes all the satellites all the time, then a server can compute the future orbits, and provide future ephemeris to any A-GPS receiver. Using the same color scheme as before, we show here that there are no unavailable future orbits; as soon as they are computed, they can be provided. And if the mobile device has a fast-enough CPU, it can compute future orbits itself, at least for the subset of satellites it has tracked.

    Beyond Phones. This idea of LTO has moved A-GPS from the mobile phone into almost any GPS device. Two of most interesting examples are personal navigation devices (PNDs) in cars, and smartphones themselves that continue to be useful gadgets once they roam away from the network. Now, of course, people were predicting orbits before 2000 — all the way back to Newton and Kepler, in fact. It’s just that in the year 2000, accurate future GPS orbits weren’t available to mobile receivers. At that time, the International GNSS Service (IGS) had, as it does now, a global network of reference stations, and provided precise GPS orbits organized into groups called Final, Rapid and Ultra-Rapid. The Ultra-Rapid orbit had the least latency of the three, but, in 2000, Ultra-Rapid meant the recent past, not the future.

    So for LTO we see that the last 10 years have taken us from a situation of nothing available to the mobile device, to today where these long-term orbits have become codified in the 3rd Generation Partnership Project (3GPP) and Secure User Plane Location (SUPL) wireless standards, where they are known as “ephemeris extension.”

    Imagine

    GPS is now reaching 100 percent penetration in smartphones, and has a strong and growing presence in feature phones as well. GPS is now in more than 300 million mobile phones, at the very least; credible estimates range above 500 million.

    Now, imagine every receiver ever made since GPS was created 30 years ago: military and civilian, smart-bomb, boat, plane, hiking, survey, precision farming, GIS, Bluetooth-puck, personal digital assistant, and PND. In the last three years, we have put more GPS chips into mobile phones than the cumulative number of all other GPS receivers that have been built, ever!


    Frank van Diggelen has worked on GPS, GLONASS, and A-GPS for Navsys, Ashtech, Magellan, Global Locate, and now as a senior technical director and chief navigation officer of Broadcom Corporation. He has a Ph.D. in electrical engineering from Cambridge University, holds more than 45 issued U.S. patents on A-GPS, and is the author of the textbook A-GPS: Assisted GPS, GNSS, and SBAS.
  • CSR Completes SiRF Acquisition

    England’s CSR plc and U.S.-based SiRF Technology Holdings, Inc., have completed their merger, ending years of speculation over what may become of SiRF, a pioneering maker of GPS receivers that had become financially troubled during the current economic downturn.

    “In bringing together the combined capabilities and broad range of CSR and SiRF technologies and platforms, we have created a new force in the industry and a world class organization with the commercial, technical and operational scale to build on CSR and SiRF’s existing customer relationships and deliver the next generation of connectivity and location enabled products,” said Joep van Beurden, CSR CEO. “Our strategic goal is to address the existing and emerging needs of our combined customer base for connectivity and location technologies. The potential applications and benefits to the end user of connectivity plus location are only just starting to open up, and these exciting new opportunities will be driven by our unique combination of leading location technologies and connectivity solutions.”

    SiRF co-founder Kanwar Chadha echoed those sentiments. “CSR and SiRF have a shared vision of using innovation to bring the benefits of wireless connectivity and location to mainstream consumers and enterprises and to enable new and exciting user experiences,” said Chadha, now a CSR board member and chief marketing officer. “We believe that through this merger, our customers and consumers will derive benefits from a much stronger player whose focus is on delivering best in class connectivity and location platforms.”

    For CSR’s customers, the merger with SiRF means CSR’s Connectivity Centre products are augmented by GPS technologies, including assisted GPS (A-GPS), dead reckoning, and location centric platforms, the companies said. Meanwhile, SiRF’s customers will see enhancements to SiRF’s location platforms with CSR’s Connectivity Centre capabilities.

    The enlarged CSR group will have its global headquarters in Cambridge, United Kingdom, with SiRF’s headquarters remaining in San Jose, California, which will also serve as CSR’s U.S. headquarters. The combined CSR group is now among the top 10 fabless semiconductor companies, with a combined customer list including six of the top seven handset manufacturers, the top five personal navigation device makers, the top two automotive telematics suppliers, and other auto and consumer electronics providers, CSR said.

  • CSR and SiRF Complete Merger

    CSR plc of Cambridge, UK, and SiRF Technology Holdings Inc., of San Jose, California, on June 26 completed the merger between SiRF and a wholly owned subsidiary of CSR. The merger resulted in “creating a provider of connectivity and location platforms and a company with the scale, technology, and strategy to enable its customers to address the exciting and emerging opportunities in mobile markets,” according to a company statement.

    The company said that customers of the enlarged CSR group will be able to deliver new user experiences of connectivity and location technologies in a diverse range of devices such as mobile phones, personal navigation devices, in-car navigation and telematics systems, laptop and netbook PCs, mobile internet devices, digital cameras, gaming machines, cellular accessories, and consumer electronic devices.

    “In bringing together the combined capabilities and broad range of CSR and SiRF technologies and platforms, we have created a new force in the industry and a world-class organization with the commercial, technical and operational scale to build on CSR and SiRF’s existing customer relationships and deliver the next generation of connectivity and location enabled products,” said Joep van Beurden, CEO of CSR. “Our strategic goal is to address the existing and emerging needs of our combined customer base for connectivity and location technologies. The potential applications and benefits to the end user of connectivity plus location are only just starting to open up, and these exciting new opportunities will be driven by our unique combination of leading location technologies and connectivity solutions.”

    “CSR and SiRF have a shared vision of using innovation to bring the benefits of wireless connectivity and location to mainstream consumers and enterprises and to enable new and exciting user experiences”, said Kanwar Chadha, co-founder of SiRF and newly appointed board member and chief marketing officer of CSR. “We believe that through this merger, our customers and consumers will derive benefits from a much stronger player whose focus is on delivering best in class connectivity and location platforms.”

    “Technology innovation represents the foundation for both CSR’s and SiRF’s success in the market place,” said James Collier, co-founder, board member and Chief Technology Officer of CSR.  “We look forward to combining the complementary expertise of our teams to take innovation to the next level in our multifunction radio and system platforms to address emerging customer and market needs.”

    For CSR’s customers, the merger with SiRF means CSR’s Connectivity Centre products are augmented by GPS technologies that are well respected and enjoy widespread adoption, the company said, while SiRF brings to CSR a strong IP portfolio in GPS and assisted GPS (A-GPS), dead reckoning, and location centric platforms. 
The enlarged CSR group will have its global headquarters in Cambridge, UK, with SiRF’s headquarters in San Jose becoming CSR’s U.S. headquarters.

  • The Business: SiRF, CSR to Merge; Kanwar Chadha’s Perspective

    » MASS MARKET OEM

    SiRF, CSR to Merge; Kanwar Chadha’s Perspective

    SiRF Technology Holdings, Inc., of San Jose, California, and CSR plc, formerly Cambridge Silicon Radio, headquartered in Cambridge, United Kingdom, will merge in a stock-for-stock transaction to create a new company, which will automatically assume a competitive, leading position in global connectivity and location markets. The companies expect the transaction to close in the second quarter of 2009.

    “Financially, strategically, and commercially, this is a compelling transaction,” said Joep van Beurden, CEO of CSR — and analysts would almost universally agree. SiRF has been under the financial microscope since troubles surfaced in Q1 2008, and speculation about an acquisition had been rife.

    Further, SiRF has been locked in a patent battle with Broadcom, the latter involved through its July 2007 acquisition of Global Locate.

    CSR has made its mark in the Bluetooth connectivity sector, combining multiple connectivity technologies, while SiRF has long pioneered GPS location with multifunction system-on-chip (SoC) location platforms for consumer handhelds and cell phones. In January 2007, CSR purchased GNSS software receiver innovator NordNav.

    Chadha Says. “From a strategy viewpoint,” SiRF founder and vice president of marketing Kanwar Chadha told GPS World, “multi-function radios is something we have been talking about for two years. Market opportunities became much larger in the last six months, with Nokia driving loction into every mobile phone.

    “When you see a market opportunity in front of you, it’s better to combine best-of-class than to build a solution from scratch.

    “We have a strong customer base in automotive and PNDs, while we are expanding into wireless. CSR is compelementary: strong now in wireless, and so on.

    “In easy times, you can build your own solution. In tough times, trying to build an additional platform of technology, if we start from scratch, that may take four to five years to prove out; that’s very difficult. Both of us tried to do that, by the way. They need GPS, we need Bluetooth.

    “Now, our multimode AGPS with their EGPS, and the economies of scale enjoyed by a now close to a billion-dollar company, we feel very good about that. Bluetooth in hands-free mobile phones, that has a 50 percent penetration in handsets. It is much deeper than GPS today, although GPS is catching up.

    “Their [CSR’s] world is very mobile-phone centric. We are more location-platform centric, more diverse in our view. It will be very interesting. GPS-Bluetooth-FM: for our customers, the handset vendors, this is their most requested combination. There are two ways to integrate these function: integrate GPS with a modem, as Qualcomm does, or integrate it into  what CSR calls a connectivity center, of short-range wireless technologies.”

    Lines Drawn. A significant market battle continues between the big four in the mass market OEM GPS chip sector: Broadcom, Qualcomm, CSR, and TI, formerly Texas Instruments — with Sony and Panasonic quietly going about their own business, making GPS chips for brand devices, but in a position to supply others, if they are not doing so already. The new ST-NXP Wireless joint venture with Ericsson (see story page 18) will also play in that arena.

    Chadha does not expect to see competition from manufacturers in Taiwan and China, at least not immediately. “These are complex radio technologies, not simple digital technologies.”

    Brand. “The SiRF brand won’t go away, it’s very strong,” he concluded. “We’ll continue to build on it. the location platform will be our recognizable art of the new company , and of course we’ll continue applying our expertise there.”

    On a pro forma basis, the two companies combined would have had 2008 sales of approximately $927 million. The combination will create the single largest pure-play provider of integrated connectivity and location platforms and will be one of the top 10 fabless semiconductor companies in the world, according to a joint statement. Customers include four of the top five handset makers, the top five PND makers, the top two auto-telematics suppliers, and other leading electronics providers. CSR and SiRF will have design and customer-support centers around the world.

    On closing of the transaction, SiRF stockholders are expected to own 27% and CSR shareholders are expected to own 73% of the combined company. CSR’s board will add SiRF interim CEO Dado Banatao and Chadha. The combined company, with CSR’s Van Beurden as CEO, will be based in Cambridge, and San Jose will serve as U.S. headquarters.

    » TELECOMMUNICATIONS

    Ericsson and STMicro Complete Mobile Merger

    STMicroelectronics and Ericsson have closed their agreement merging Ericsson Mobile Platforms and ST-NXP Wireless into a 50/50 joint venture. The deal was completed on the terms originally announced on August 20, 2008.

    The new company is designed for long-term stability and to become an industry leader in product research, as well as design, development, and the creation of mobile platforms and wireless semiconductors. The joint venture begins as a major supplier to four of the industry’s top five handset manufacturers, who together represent about 80 percent of global handset shipments, as well as to other industry leaders.

    Ericsson contributed $1.1 billion net to the joint venture, out of which $0.7 billion was paid  to STMicro. Before the closing of the transaction, STMicro exercised its option to buy out NXP’s 20 percent ownership stake of ST-NXP Wireless.

    Alain Dutheil, CEO of ST-NXP Wireless and chief operating officer of STMicroelectronics, will lead the joint venture as president and chief executive officer.Employing about 8,000 people — roughly 3,000 from Ericsson and 5,000 from STMicro — the new wireless technologies company is headquartered in Geneva, Switzerland.

    » MILITARY & GOVERNMENT

    Honeywell T-Hawk Micro Vehicle Heads for U.K.

    Honeywell received an order for six T-Hawk micro air vehicle (MAV) systems from the U.S. Navy, the contracting agency for the U.K. Ministry of Defence (MOD) for the T-Hawk MAV system procurement, in a contract valued at USD $5.7 million.

    The new U.K. order comes in addition to the Navy’s existing T-Hawk contract with Honeywell, announced in November 2008, for 90 systems. The T-Hawk MAV will be used by joint force EOD (Explosive Ordinance Device) units in Iraq and Afghanistan, among other locations.

    The circular vehicle, weighing 17 pounds and 14 inches in diameter, can fly down to inspect hazardous areas for threats without exposing warfighters to enemy fire. The T-Hawk MAV can take off and land vertically and fly more than 40 minutes, at more than 40 knots of airspeed, operating at altitudes of more than 10,000 feet.

    An eye-in-the-sky for battlefield surveillance, the Honeywell MAV carries video cameras to relay real-time data and a GPS device. It identifies improvised explosive devices (IEDs) and can inspect suspected bomb sites in areas inaccessible by ground robots.

    » MASS MARKET OEM

    Epson, Infineon Develop Tiny Single-Chip Receiver

    Seiko Epson Corporation of Tokyo, Japan, and Infineon Technologies AG of Neubiberg, Germany, have developed a GPS single-chip design, the XPOSYS, which is optimized for mobile devices for the consumer market — especially cellular phones with navigation features.

    Compared to existing solutions in the market, the XPOSYS, which is manufactured in a 65-nanometer process technology, provides increased performance and new levels of user experience, the companies said.

    Sensitivity has been increased from -160 dBm to -165 dBm, allowing for pinpoint positional accuracy when indoors or in urban canyons. Power consumption has been reduced by 50 percent, increasing the battery life of products in which it is included. The footprint has been reduced to 2.8 x 2.9 millimeters, which the companies claim is 25 percent less than the smallest GPS chip available elsewhere.

    u-blox Launches Cards for Mobile Computers

    A GPS PCI Express Mini card from u-blox (Thalwil, Switzerland) enables next-generation laptop, netbook, mobile internet device and Ultra Mobile PC OEMs to provide GPS and location-based services (LBS) such as personal navigation, services and people finders, and geo-tagging.

    “With the explosive potential of next-generation GPS applications and services for mobile PCs, it is the right time to introduce a robust PCI Express mini card supporting location-based services,” said Thomas Nigg, Vice President Product Marketing at u-blox.Sales of mobile PCs with integrated GPS are projected to grow from 3 million units in 2007 to 45 million units in 2011, according to u-blox.

    Qualcomm Launches Chipset for Low-Cost Smartphones

    Qualcomm, Inc., has launched the Mobile Station Modem MSM7227 chipset designed to enable high-performance, sub-$150 smartphones. The MSM7227 chipset features integrated Bluetooth 2.1 and GPS, a 600-MHz applications processor with a floating point unit, 320-MHz application DSP, 400-MHz modem processor, hardware-accelerated 3D graphics, 8-megapixel camera, and 30-fps WVGA video encode and decode and display support.

    The MSM7227 chipset is designed to provide advanced processing and multimedia while using HSDPA/HSUPA for broadband data speeds over 3G networks. It also can support all leading mobile operating systems including Android, Symbian S60, Windows Mobile and BREW Mobile Platform, according to the company.

    The MSM7227 chipset has a 12 x 12 millimeter footprint and lower power consumption than previous MSM7xxx-series chips. It is sampling now, and commercial smartphones based on the chip are expected to launch later this year.

    Broadcom Combos GPS, Bluetooth, and FM Radio System-on-Chip

    Broadcom Corporation of Irvine, California, has released BCM2075, a new, integrated GPS, Bluetooth, and FM radio in a single-chip design, targeting location-based services (LBS) applications. The processor reduces the host and application processing required by competing combo solutions, enabling greater adoption in mass market handsets, according to the company.

    The BCM2075 integrates four radios (Bluetooth, GPS, FM receive, and FM transmit), enabling the radios to operate simultaneously and with minimal interference.

    The company expects the chip to drive key handset applications that network operators and consumers are looking to adopt, furthering the cause of LBS and advanced multimedia available on mid-range mobile phones. The GPS core uses a host-based integration architecture that splits the processing duties between the BCM2075 and the host CPU system and provides low GPS power, delivering a reported 50 percent better power performance compared to other chips, the company said. Broadcom’s GPS technology, stemming largely from its July 2007 purchase of Global Locate, enables a fast time-to-first-fix and provides integrated support for other positioning technologies, such as Wi-Fi positioning.


  • SiRF and CSR to Merge

    SiRF Technology Holdings, Inc., based in San Jose, California, and CSR plc, formerly Cambridge Silicon Radio, headquartered in Cambridge, UK, will merge in a stock-for-stock transaction to create a new company, which will automatically assume a competitive/leading position in global connectivity and location markets. The companies expect the transaction to close in the second quarter of 2009.

    “Financially, strategically and commercially, this is a compelling transaction,” stated Joep van Beurden, CEO of CSR — and analysts would almost universally agree. SiRF has been under the financial microscope since troubles surfaced in Q1 2008, and speculation about an acquisition had been rife.

    Further, SiRF has been locked in a patent battle with Broadcom, the latter involved through its July 2007 acquisition of Global Locate.

    CSR has made its mark in the Bluetooth connectivity sector, combining multiple connectivity technologies, while SiRF has long pioneered GPS location with multifunction system-on-chip (SoC) location platforms for consumer handhelds and cell phones. In January 2007, CSR purchased GNSS software receiver innovator NordNav.

    For the moment, Qualcomm CDMA sits on the sidelines, but a significant and long-going market battle continues between (now) the big three in the mass market OEM GPS chip sector: Broadcom, Qualcomm, CSR — with Sony and Panasonic also quietly going about their business, primarily making GPS chips for their own brand devices, but certainly in a position to supply others, if they are not doing so already.

    Based on CSR’s and SiRF’s results for fiscal year 2008, on a pro forma basis, the combined companies would have had sales of approximately $927 million. The combination will create the single largest pure play provider of integrated connectivity and location platforms and will be one of the top 10 fabless semiconductor companies in the world, according to a joint statement by the two. Customers of the combined company include four of the top five handset manufacturers, the top five personal navigation device makers, the top two auto-telematics suppliers, and other leading auto and consumer electronics providers. CSR and SiRF will have design and customer support centers around the world.

    Under the terms of the agreement, SiRF stockholders will receive 0.741 of a CSR share for each share of SiRF common stock they own. Based on the closing stock price for CSR on February 9, this consideration would be equivalent to $2.06 of CSR stock for each SiRF share, representing total consideration of $136 million. This represents a premium to SiRF stockholders of approximately 91% over SiRF’s closing stock price on February 9. On closing of the transaction, SiRF stockholders are expected to own approximately 27% and CSR shareholders are expected to own approximately 73% of the combined company. The transaction is expected to be tax-free for SiRF stockholders.

    SiRF, listed on the NASDAQ exchange, generated revenues of $232 million in 2008, and had gross assets of $195 million as of December 27, 2008.

    CSR is listed on the London Stock Exchange. CSR’s customers include industry leaders such as Audi, Ford, LG, Motorola, NEC, Nokia, Panasonic, RIM, Samsung, Sharp, Sony, TomTo,m and Toshiba. CSR has its headquarters and offices in Cambridge, UK, and offices in Japan, Korea, Taiwan, China, India, France, Denmark, Sweden, and both Dallas and Detroit in the USA.

    According to the companies, the transaction proffers the following benefits to both the companies themselves and their stockholders:

    Combined Product Roadmap for Next-Generation Chips. The combined company will have significant R&D resources to deliver a broader portfolio of location and connectivity solutions to customers. R&D efforts will continue to support each company’s existing product lines and will also be focused on the delivery of additional multifunction radio chips, which combine CSR’s Bluetooth and other connectivity capabilities with SiRF’s GPS and GNSS technologies.

    Growing Market Opportunities and Revenue Synergies. The combined company will benefit from significantly increased scale to meet the demand for both connectivity and location services in a broad range of products spanning mobile phones, automobiles, personal computers, mobile Internet devices, digital cameras, mobile gaming, and other consumer electronics products. The companies expect to achieve significant additional revenue synergies beginning in 2010 and beyond through a combination of cross-selling opportunities, deeper penetration of existing customers, new product offerings combining complementary technologies, and access to new markets.

    Financial Synergies. The companies expect that annual cost synergies of at least $35 million in savings from gross margin improvements and reduced R&D, sales and marketing, and overhead costs can be achieved through steps that can be implemented within 60 days post completion of this transaction.

    Financial Strength and Flexibility. The combined company is expected to have a strong balance sheet and cash position. At the end of fiscal year 2008, on a pro forma basis, the combined company had $378 million in cash and no bank debt.

    Following the close of the transaction, CSR’s board of directors will be expanded to add two members of the SiRF board, interim CEO Dado Banatao and co-founder and VP of marketing Kanwar Chadha. Van Beurden will lead the combined company as CEO with the remaining leadership to be comprised of executives from both SiRF and CSR. The combined company will be headquartered in Cambridge (United Kingdom), and SiRF’s San Jose, California, headquarters will become the headquarters for CSR’s U.S. operations.

    The transaction is subject to regulatory approvals and the approval of SiRF and CSR shareholders.

    More information can be found at www.csr.com.