Category: Applications

  • Discussing the new North American-Pacific Geopotential Datum of 2022 — Part 1

    Discussing the new North American-Pacific Geopotential Datum of 2022 — Part 1

    On April 24-25, 2017, the National Geodetic Survey (NGS) hosted the 2017 Geospatial Summit in Silver Spring, Maryland, to discuss its plans for replacing the North American Datum of 1983 (NAD 83) and the North American Vertical Datum of 1988 (NAVD 88) in 2022.

    The summit was a day and a half long and provided an opportunity for NGS to share updates and discuss the progress of projects related to National Spatial Reference System (NSRS) Modernization. Stakeholders across the federal, public and private sectors also provided feedback and impacts of New Datums on their products and services.

    The absolute differences between the new vertical reference frame, North American-Pacific Geopotential Datum of 2022 (NAPGD2022), and NAVD 88 are going to be large but, in most regions of the country, the relative differences over small areal extents will be small.

    NGS is developing geodetic routines and tools to transform heights from NAVD 88 to NAPGD2022, and to facilitate the incorporation of geodetic leveling data into NAPGD2022 to establish NAPGD2022 heights. To prepare for the new datums and develop implementation plans, stakeholders should obtain an understanding of the differences between NAPGD2022 and NAVD 88.

    My previous columns provided figures that demonstrated the approximate differences between NAPGD2022 and NAVD 88 heights at a national level. (See figure 1.) This column will provide feedback from stakeholders that participated in the Geospatial Summit and, using NGS’ GPS on BMs dataset, a discussion on the differences between NAPGD2022 and NAVD 88 (and NGVD 29) at a local level.
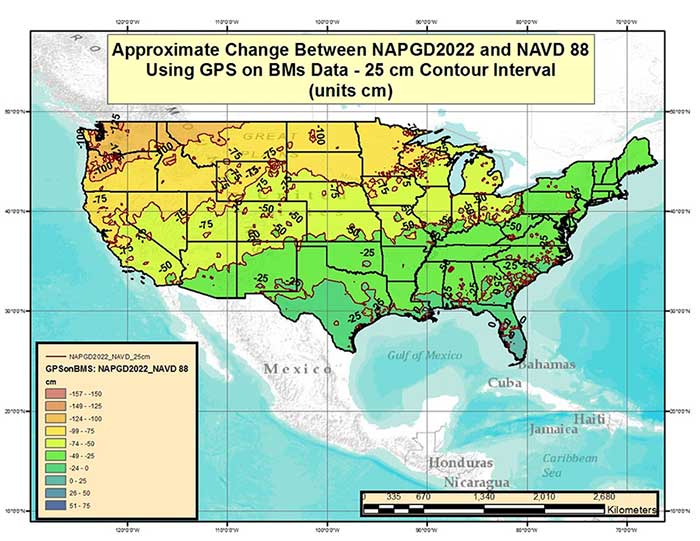
    Figure 1 – Approximate Change Between NAPGD2022 and NAVD 88 Using GPS on BMs Data (units = cm). (Image: National Geodetic Survey)
    Figure 1 – Approximate Change Between NAPGD2022 and NAVD 88 Using GPS on BMs Data (units = cm). (Image: National Geodetic Survey)

    Information about the summit and Summit Documents can be downloaded here.

    Read an excerpt from website here.

    If you check on the tab titled “Summit Documents” you can download the agenda and documents provided to participates. Read excerpts from the summit here.

    The first day consisted of presentations by NGS leadership and personnel providing updates and discussing the progress of projects related to the NSRS modernization. The presentations by NGS employees can be downloaded from NGS’ presentations library at this web link. View an excerpt from NGS’ presentations library here.

    The afternoon of day 2 were presentations by partners and stakeholders. (See box titled “Excerpt from NGS 2017 Geospatial Summit Agenda – Afternoon of Day 2.”)

    Excerpt from NGS 2017 Geospatial Summit Agenda – Afternoon of Day 2
    Day 2 Afternoon Agenda from NGS’ 2017 Geospatial Summit
    Day 2: Tuesday, April 25, 20171:30 – 3:05 Impacts of New Datums on Programs and Partners (Part 1)
    Coastal Mapping Program and VDatum: Mike Aslaksen and Stephen White, NOAA/NGS
    Federal Emergency Management Agency (FEMA): Kimberly Pettit, FEMA
    U.S. Geological Survey (USGS): Kari Craun, USGS
    U.S. Army Corps of Engineers (USACE): Jim Garster, USACE
    National Geospatial-Intelligence Agency (NGA): Stephen Malys, NGA
    3:05 – 3:25 Break
    3:25 – 4:55 Impacts of New Datums on Programs and Partners (Part 2)
    Geospatial and Remote Sensing Customers: Amar Nayegandhi, Dewberry
    Geographic Information System (GIS) Customers: Kevin Kelly, Esri
    Global Navigation Satellite System (GNSS) Equipment Customers: Hamid Mahmoudabadi, Trimble Kyle Snow, Topcon
    State Government Partners: Gary Thompson, N.C. Department of Public Safety
    Local Government Partners: Vickie Anglin, Fairfax County Government, Virginia; Patrick Simon, Baltimore County Land Survey, Maryland
    4:55 – 5:00 Wrap-up and closing

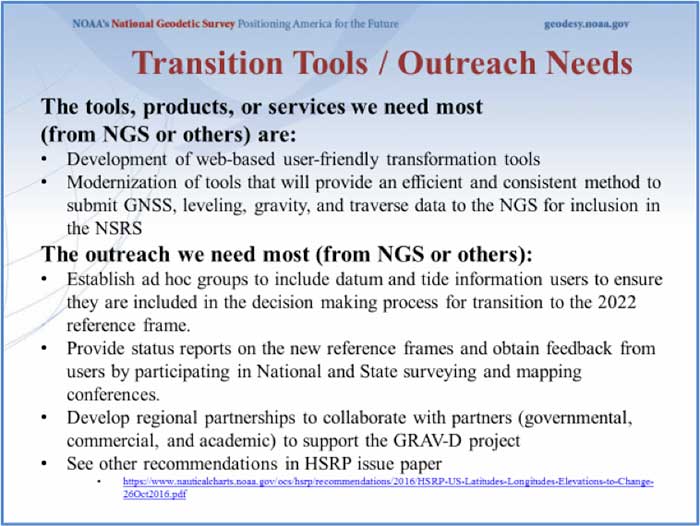
    In order for consistency, NGS provided guidance and a set of template slides for guest presenters to use. Guest presenters were allotted 10 minutes to present and limited to four slides. The presentation by the guest presenters are not on NGS’ Presentations Library but I’ve been told that they will be available on the Summit website later this year. Gary Thompson, Chief of the North Carolina Geodetic Survey (NCGS), provided me a copy of his slides and gave me permission to include them in this column. (See box titled “Power point Slides Presented by Gary Thompson, Chief of NCGS, at the NGS 2017 Geospatial Summit.”) North Carolina has been very proactive in addressing the impacts of the new datums on NC products and services. North Carolina Geodetic Survey has established a North Carolina Geodetic Survey Advisory Committee that reviews NCGS products and services, and they have established the North Carolina 2022 Reference Frame Working Group to prepare for the new datums.

    Slide: National Geodetic Survey
    Slide: National Geodetic Survey

    Powerpoint slides presented by Gary Thompson, chief of NCGS, at the NGS 2017 Geospatial Summit

    All of the presentations by the invited guest speakers were interesting, and everyone followed NGS’ guidance which helped to focus the Summit on the main issues associated with a datum change. As expected, each stakeholder had their own set of issues and concerns about transitioning to a datum. The following are some common themes that I heard from the participants:

    (1) There are a lot of products and services that will be effected by a datum change,
    (2) An official transformation model between the old and new datum(s) published by NGS is critical for a successful transition to a new datum,
    (3) Guidance documents that are “easily” understood by “non-geodesists” is required for a smooth implementation of a new datum, and
    (4) More frequent geospatial summits and webinars are needed to provide updates on the status of the projects associated with NSRS modernization and to ensure user involvement in the process.

    I contacted a couple of the guest presenters to discuss their feedback on the New Datums. As NAVD 88 Program Manager, I collaborated with many of them during the development and implementation of the NAVD 88. As in the transition from NGVD 29 to NAVD 88, it’s not the conversion of coordinates that’s a problem; a good transformation tool should meet that requirement. Saying that, it was stated that many users rely on commercial and open source software to convert their data, so they would like NGS to collaborate with others to ensure that these software suppliers are using the appropriate algorithms/information in their products. The integration with legacy data referenced to older datums may be complicated for some products and services; therefore, the process of transforming each product and service will need to be addressed individually. If all data are in digital form with the appropriate metadata, then the transformation should be relatively easy to accomplish and maps with new contour lines or new base flood elevations referenced to the new datum could be generated. However, how these new maps are integrated with old maps is a different issue. I will address some of these potential issues in future columns.

    To prepare implementation plans, users must obtain a working knowledge of the differences between the old and new datums. As previous mentioned, the absolute differences between the new vertical reference frame, NAPGD2022, and NAVD 88 are going to be large but, in most regions of the country, the relative differences over small areal extents will be small. To evaluate the relative differences at the local level, the differences between NAPGD2022 and NAVD 88 (and NGVD 29) were computed for bench marks in the NGS’ GPS on BMs dataset. The NAD 83 (2011) latitude, longitude, and ellipsoid height of each station was transformed to the IGS08 reference frame using NGS’ HTDP web tool, and then the GNSS-derived orthometric height was computed using the following formula:

    Approximate NAPGD2022 GNSS-Derived Orthometric Height
    Equals
    IGS08 Ellipsoid Height minus xGeoid16b Geoid Height (referenced to IGS08).

    Figure 1 is a plot of the difference between the approximate NAPGD2022 height and the published NAVD 88 height for bench marks that are part of the GPS on BMs dataset and have the published attribute of “Adjusted.” It should be noted that these are only estimated changes because the final NAPGD2022 reference frame will not be exactly the same as the current IGS08 reference frame, but these estimates should serve the purpose of providing approximate changes for users to develop transition plans.

    Since some users are still converting NGVD 29 heights to NAVD 88 heights, the approximate change between NAPGD2022 and NGVD 29 is provided in figure 2. VERTCON values were used to convert the NAVD 88 published heights to NGVD 29 heights, and then the difference between the approximate NAPGD2022 orthometric height and the NGVD 29 orthometric height was computed.
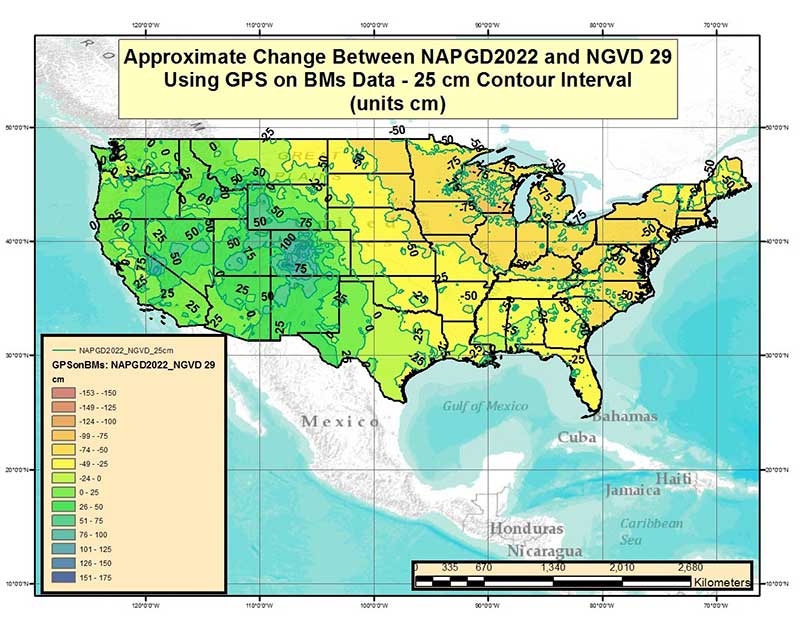
    Figure 2 – Approximate Change Between NAPGD2022 and NGVD 29 Using GPS on BMs Data (units = cm). (Image: National Geodetic Survey)
    Figure 2 – Approximate Change Between NAPGD2022 and NGVD 29 Using GPS on BMs Data (units = cm). (Image: National Geodetic Survey)

    As shown in figure 2, the absolute differences between the new vertical reference frame, NAPGD2022, and NGVD 29 are also going to be large but, once again, in most regions of the country, the relative differences over small areal extents will be small.

    What does this look like in a local area? Figure 3 is a plot of the approximate change between NAPGD2022 and NAVD 88 in North Carolina and surrounding states, and figure 4 is plot of the approximate change between NAPGD2022 and NGVD 29 in North Carolina and surrounding states.
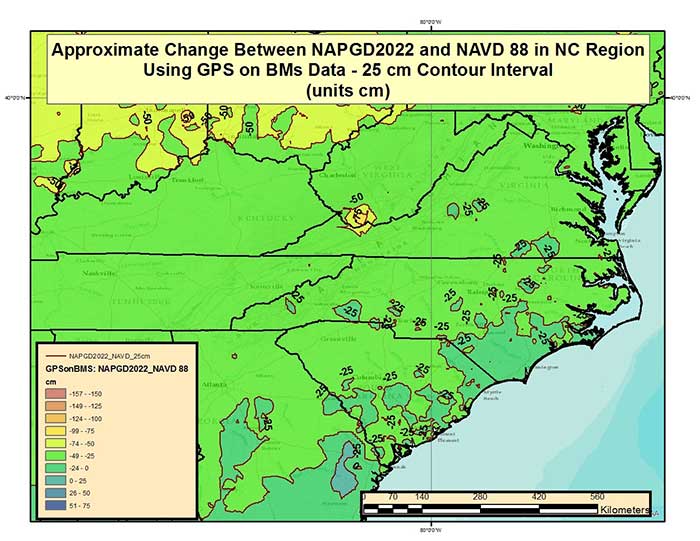
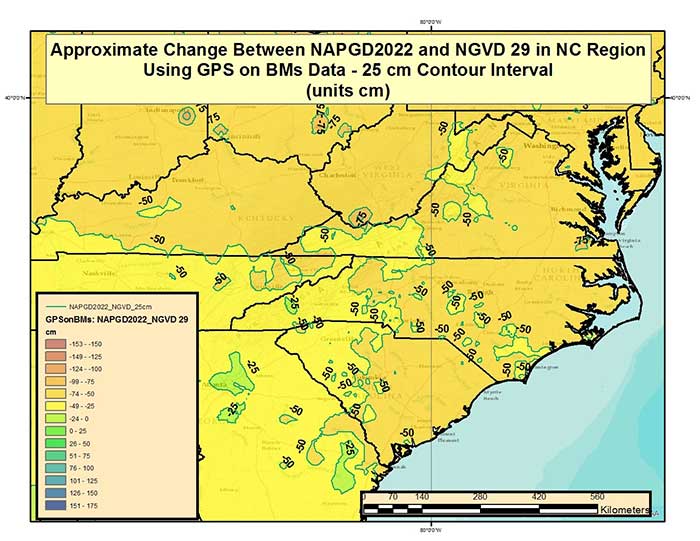
    Figure 3 – Approximate Change Between NAPGD2022 and NAVD 88 in North Carolina and Surrounding States Using GPS on BMs Data (units = cm). (Image: National Geodetic Survey)
    Figure 3 – Approximate Change Between NAPGD2022 and NAVD 88 in North Carolina and Surrounding States Using GPS on BMs Data (units = cm). (Image: National Geodetic Survey)
    Figure 4 – Approximate Change Between NAPGD2022 and NGVD 29 in North Carolina and Surrounding States Using GPS on BMs Data (units = cm). (Image: National Geodetic Survey)
    Figure 4 – Approximate Change Between NAPGD2022 and NGVD 29 in North Carolina and Surrounding States Using GPS on BMs Data (units = cm). (Image: National Geodetic Survey)

    Figure 5 provides a more detailed depiction of the change between NAPGD2022 and NAVD 88 along the North Carolina Atlantic Coast. The differences appear to vary by several centimeters but some of these differences are due to errors in published heights (both ellipsoid and orthometric). These differences can be used to develop a transformation model but the user will need to know the accuracy of the model, globally and locally.
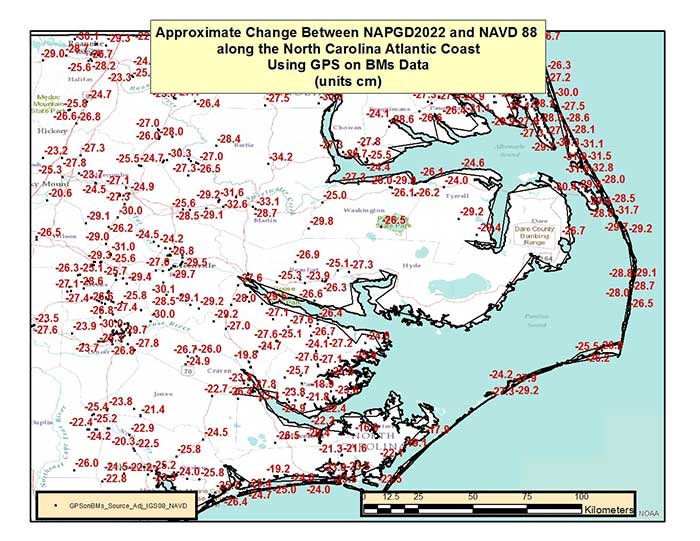
    Figure 5 – Approximate Change Between NAPGD2022 and NAVD 88 along North Carolina Atlantic Coast Using GPS on BMs Data (units = cm). (Image: National Geodetic Survey)
    Figure 5 – Approximate Change Between NAPGD2022 and NAVD 88 along North Carolina Atlantic Coast Using GPS on BMs Data (units = cm). (Image: National Geodetic Survey)

    Figure 6 is a detailed depiction of the change between NAPGD2022 and NGVD 29 in the same area as shown in figure 5. Comparing figures 5 and 6, the reader should notice that the differences between NAPGD2022 and NGVD 29 are about 30 cm larger (more negative) than the differences between NAPGD2022 and NAVD 88.
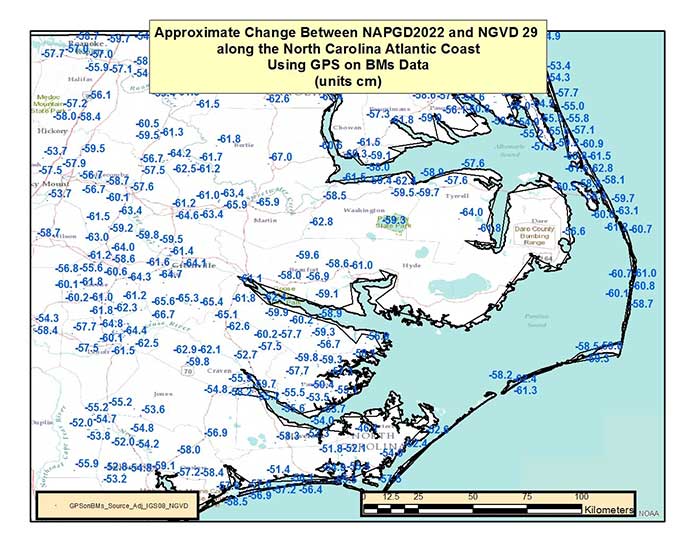
    Figure 6 – Approximate Change Between NAPGD2022 and NAVD 29 along North Carolina Atlantic Coast Using GPS on BMs Data (units = cm). (Image: National Geodetic Survey)
    Figure 6 – Approximate Change Between NAPGD2022 and NAVD 29 along North Carolina Atlantic Coast Using GPS on BMs Data (units = cm). (Image: National Geodetic Survey)

    Figure 7 is the difference between NAPGD2022 and NAVD 88 in western North Carolina. The local difference in the NC mountains is around -35 cm which is about 10 cm different from the NC Atlantic Coast. Questions that users need to address include: What is the accuracy of the transformation model? And What is the accuracy of the product or service being transformed? The transformation model will not replace the original survey results but may be useful for transforming some products and services.
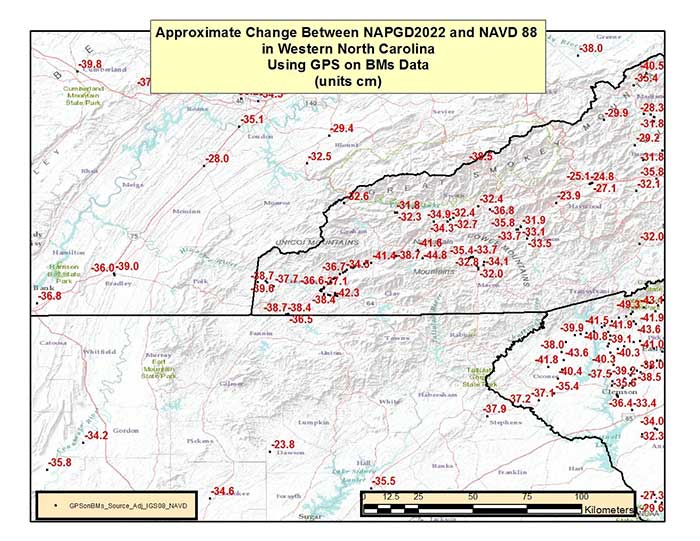
    Figure 7 – Approximate Change Between NAPGD2022 and NAVD 88 in the Western North Carolina Using GPS on BMs Data (units = cm). (Image: National Geodetic Survey)
    Figure 7 – Approximate Change Between NAPGD2022 and NAVD 88 in the Western North Carolina Using GPS on BMs Data (units = cm). (Image: National Geodetic Survey)

    Table 1 provides the average difference between NAPGD2022 and NAVD 88 (and NGVD 29) by State using the GPS on BMs dataset. This table shows that there are large differences between NAPGD2022 and both NGVD 29 and NAVD 88. No matter which datum the product or service is referenced to, it will probably need to be transformed to NAPGD2022.
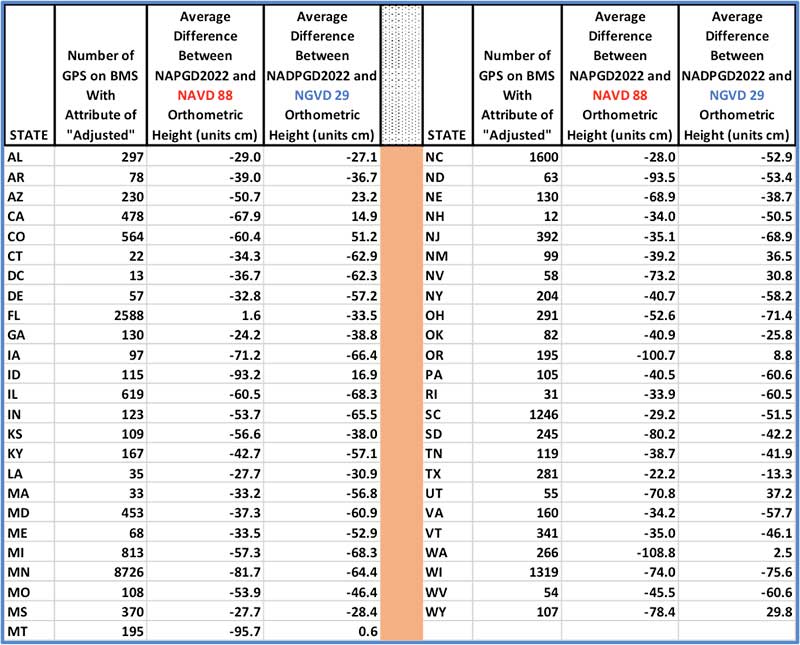
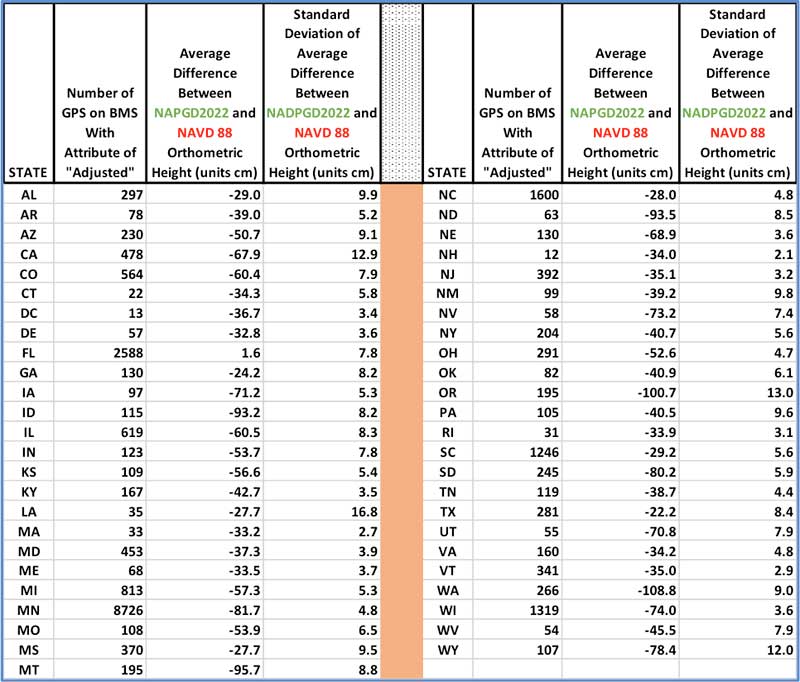
    Table 1 – Average Difference Between NAPGD2022 and NAVD 88 (and NGVD 29) by State Using GPS on BMs Dataset (units = cm). Click to enlarge. (Date: National Geodetic Survey)
    Table 1 – Average Difference Between NAPGD2022 and NAVD 88 (and NGVD 29) by State Using GPS on BMs Dataset (units = cm). Click to enlarge. (Date: National Geodetic Survey)
    Average Difference Between NAPGD2022 and NAVD 88 by State Using GPS on BMs Dataset (units = cm). Click to enlarge. (Date: National Geodetic Survey)
    Average Difference Between NAPGD2022 and NAVD 88 by State Using GPS on BMs Dataset (units = cm). Click to enlarge. (Date: National Geodetic Survey)

    Table 2 provides the standard deviation of the average difference between NAPGD2022 and NAVD 88 by State. For example, North Carolina has a sample size of 1600 stations and its average difference is -28 cm with a standard deviation of 4.8 cm. Looking at figures 5 and 7, there appears to be a difference of 10 cm across the State. The States in the northwestern region of the United States have a larger difference between NAPGD2022 and NAVD 88 as well as a larger standard deviation. Oregon has a sample size of 195 stations and its average difference is -100.7 cm with a standard deviation of 13.0 cm, and Washington has a sample size of 266 stations and its average difference is -108.8 cm with a standard deviation of 9.0 cm. Figure 8 is a plot of the approximate change between NAPGD2022 and NAVD 88 in the northwest region of the United States.

    As mentioned previously, these differences will vary from station to station because of a bias and trend between the two datums and due to remaining errors in published heights (both ellipsoid and orthometric). As I have noted in previous columns, many of the large relative differences between stations in a local area could be due to an invalid NAVD 88 published height because the bench mark moved since the last time the height of the bench mark was adjusted and published, and/or an undetected error in an ellipsoid height due to a weak GNSS project design. Either way, in my opinion, most of these stations with large relative differences don’t accurately represent the current NAVD 88. NGS’ modernization of the NSRS will provide a more accurate and consistent reference frame, and improve the user’s ability to obtain a current and accurate orthometric height.
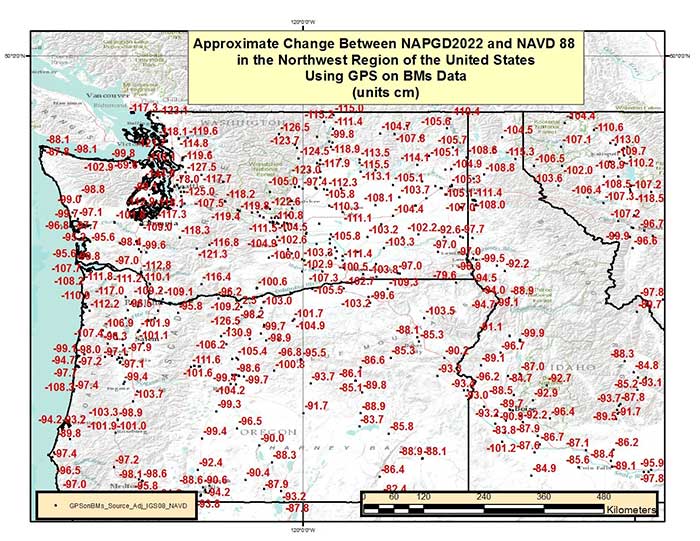
    Figure 8 – Approximate Change Between NAPGD2022 and NAVD 88 in the Northwest Region of the United States Using GPS on BMs Data (units = cm). (Image: National Geodetic Survey)
    Figure 8 – Approximate Change Between NAPGD2022 and NAVD 88 in the Northwest Region of the United States Using GPS on BMs Data (units = cm). (Image: National Geodetic Survey)

    This column highlighted some of the feedback provided by guest presenters at the NGS’ 2017 Geospatial Summit held on April 24-25, 2017, in Silver Spring, Maryland. The column also provided a discussion on the approximate differences between NAPGD2022 and NAVD 88 (and NGVD 29) at a national and local level. To prepare for the new datums and develop implementation plans, users should obtain an understanding of the differences between NAPGD2022 and NAVD 88. This column is the first in a new series of columns addressing topics associated with transitioning to the new North American -Pacific Geopotential Datum of 2022 (NAPGD2022).

  • NASA tests next phase of UAS traffic management system

    NASA tests next phase of UAS traffic management system

    NASA’s UAS Traffic Management System was tested May 25 at the Nevada UAS Test Site. (Credit: Drone America)

    On May 25, the Federal Aviation Administration (FAA)-designated Nevada UAS Test Site and its NASA partners flew five different unmanned aerial vehicles (UAVs) to test NASA’s Unmanned Aircraft System Traffic Management (UTM).

    The flights demonstrated multiple operational scenarios, including parachute-initiated emergency supply deliveries and aerial survey operations.

    The UAVs were flown beyond the pilot’s visual line of sight using strategically placed visual observers and sophisticated command and control, communication and detect-and-avoid technologies.

    The test is part of a three-week national campaign, which NASA is leading in close collaboration with the FAA and industry partners on a more complex version of its UTM technologies at six different UAS Test Sites around the nation.

    The Technology Capability Level 2 (TCL2) National Campaign began May 9 with the Nevada UAS Test Site as the first of six UAS Test Site to begin UTM operations this year.

    The partners not only demonstrated drone flight capability, but also tested UAS traffic mapping, sensor and radar technology, all of which were connected through a NASA UAS service supplier network to NASA Ames Research Laboratory.

    Six FAA UAS Test sites and industry partners integrate their technologies with NASA’s UTM research platform and test the UTM concept in a range of conditions representative of those in the U.S. Airspace, explaind Tom Prevot, UTM project manager.

    “For the Nevada NASA Team, we flew the longest multi-faceted NASA UTM flights to date in Nevada,” Prevot said. “The beyond-line-of-sight missions we completed over a distance of 13 miles north of Reno, Nevada, and the multiple aerial parachute package-delivery missions performed were a first in the National Airspace System under the NASA UTM.”

    Current testing of the UTM TCL2 Test marks the second year in a row NASA has taken its UTM technologies on the road to further assess and refine their capabilities. During April 2016, NASA and its partners tested TCL1, which involved line-of-sight operations, and then began the first phase of TCL2 demonstrations in October 2016.

    Two more phases, TCL3 and TCL4, each progressively more complex and involving flying drones with specific tasks over increasingly populated areas, are scheduled for 2018 and beyond.

    The aerial parachute package-delivery missions performed were a first in the National Airspace System under the NASA UTM. (Credit: Drone America)

    “Our Nevada NASA partners did an amazing job in extending the body of airspace management and sense-and-avoid knowledge under the UTM and across the UAS Industry,” said Chris Walach, director of the Nevada UAS Test Site. “The National Campaign data provided to NASA from our two-week operation will go a long way toward advancing the UTM for the FAA and the UAS Industry.”

    “At AirMap, we consider UTM to be a critical ingredient for a thriving drone ecosystem,” said Steve Willer, business development manager for AirMap. “The TCL 2 trials demonstrate that technologies for geofencing, data exchange, and more can enable safe and sophisticated drone operations, even beyond line of sight. Along with NASA, the FAA, and NIAS we’re excited to show how UTM can chart a safe course for the drone ecosystem.”

    Drone America is a proud participant in a Nevada Institute for Autonomous Systems (NIAS) led NASA Unmanned Traffic Management (UTM) program at the Reno Stead Airport,” said Mike Richards, president and CEO of Drone America. “The safe integration of Unmanned Aerial Systems (UAS) into the National Airspace System (NAS) is critical to the future of this industry. Drone America is fortunate to call Nevada our home. Working in a state that is very supportive and business friendly makes a tremendous difference to our future sustainability. Our partnership with NIAS and NASA will not only contribute to successful testing, this partnership will pave the way for future generations to experience the true value of autonomous systems.”

    Carbon Autonomous Systems of Reno, in conjunction with their partner SmartPlanes of Skellefteå, Sweden, successfully took part in the planning, coordination, and flying in the most recent TCL2 NASA / NIAS UAS/UTM exercises conducted at the Reno Stead Airport UAS Test Range of the Nevada FAA UAS statewide test complex,” said John Hammond, chief pilot for Carbon Autonomous.

    NIAS was also supported by Delair-Tech and SensoFusion who provided UAS and drone detection UAS technologies, which were also tested during this NASA UTM TCL 2 Test.

    “We have been designing, manufacturing, and operating UAVs in the civilian airspace for almost 10 years in 100 countries,” said Benjamin Benharrosh, co-founder and head of Delair Tech North America. “This landmark agreement with NIAS, and the associated data collected for the UTM system designed by NASA at the Reno UAS Test Site will push our traffic management technology to a new level of precision and insight. We are thrilled to collaborate with NIAS on solutions that represent a new era for the commercial UAV market and a better presence of Delair-Tech in the U.S.”

    “We’re excited to be shaping the future of air traffic management as an official partner of the NIAS by providing our counter-UAS solution, AIRFENCE, in the ongoing NASA UTM project. AIRFENCE is playing an active role in detecting, locating, and tracking UAS as part of the project, providing rich data to NASA as they develop their UTM system,” said Kaveh H. Mahdavi, Sensofusion VP of operations.

    “NASA is one of Nevada’s most valuable partners. We appreciate the opportunity to support NASA’s UTM development. It is truly cutting-edge technology and will be instrumental in integrating UAS into the national airspace,” said Tom Wilczek, Aerospace & Defense Industry Representative for the Nevada Governor’s Office of Economic Development.

  • eLoran and Loran testing underway in late June

    eLoran and Loran testing underway in late June

    The Loran sites at Havre, Montana; George, Washington; and Fallon, Nevada, will continuously broadcast from 0900 (MST) June 20  through 1200 (MST) on June 30. The sites will operate on the 5990 rate but occasionally may operate at other rates.

    Only the site at Fallon will operate as an eLoran site. The sites at Havre and George will operate as Loran-C sites synchronized to UTC.

    Differential eLoran operation concept (graphic courtesy Ursanav).

    For further information on eLoran, tune into the free webinar on June 15, “Alternative PNT Services.” One of the four presentations will be by Steve Bartlett, executive vice president of UrsaNav, who will provide a brief overview of eLoran technology and performance characteristics with a focus on timing in critical infrastructure applications. Other presentations will cover a new Satellite Time and Location service and indoor timing with a terrestrial beacon system.

    UrsaNav is engaged in a Cooperative Research And Development Agreement with the U.S. Department of Homeland Security, the U.S. Coast Guard and Harris Corporation to research, evaluate and document eLoran technology as a candidate for providing position, navigation and timing (PNT) information. eLoran is being evaluated as a potential complementary system to GPS. UrsaNav believes that there is a potentially viable market, in both the public and private domain, for an alternative PNT service that is independent of GPS signal reception or which can be used in GPS-denied environments.

    For further background on eLoran, see GPS World’s 2015 Innovation column, “Enhanced Loran: A Wide-Area Multi-Application PNT Resiliency Solution.

  • Exhibitors at GEOINT to launch range of new products

    Exhibitors at GEOINT to launch range of new products

    A number of geospatial intelligence companies are exhibiting at the GEOINT 2017 Symposium, which is taking place June 4-7 at the Henry B. Gonzalez Convention Center in San Antonio, Texas.

    Hosted and produced by the United States Geospatial Intelligence Foundation (USGIF), the annual GEOINT Symposium is the nation’s largest gathering of industry, academia, and government to include defense, intelligence and homeland security communities as well as commercial, federal, civil, state and local geospatial intelligence stakeholders.

    The event annually attracts more than 4,000 attendees from all over the world, with more than 250 exhibiting organizations and more than 50 hours of training sessions for attendees.

    The theme for GEOINT 2017 is “Advancing Capabilities to Meet Emerging Threats.”

    Companies planning to exhibit:

    TerraGo will be demonstrating its R3 mobile app, customized for the missions of reconnaissance, response and recovery and built entirely using TerraGo Magic, a zero-code platform that enables customers to build apps tailored to their unique operations with web services, custom map products, imagery, forms and workflows.

    TerraGo’s exhibition will be located at Booth 1567. Attendees can schedule a live demonstration.

    Red Hen Systems will showcase its surveillance technology. The company’s Digital Mapping Reconnaissance Toolkit Exportable (DMRT-EX) and MediaMapper Mobile Android app have been used by law enforcement military and civilian members around the world for anti-narcotics operations, vegetation management and other surveillance missions.

    Visit Booth 333 at GEOINT to see the company’s equipment in action.

    Descartes Labs Inc., a cloud-based geospatial analytics company, will unveil its global-scale machine learning platform. The platform powers geographic and temporal analysis of remote-sensing data to identify objects, forecast change and deliver high-performance intelligence solutions.

    GEOINT attendees can learn more about Descartes Labs at booth #1325 in the GEOINT Exhibit Hall. Descartes will also present a Lightning Talk at GEOINT Forward on Sunday, June 4, and a training workshop on Tuesday, June 6.

    The Polaris TLS by Teledyne Optech

    Teledyne Optech will showcase the advanced capabilities of the award-winning ALTM Galaxy T1000, now featuring a 1-MHz laser PRF, PulseTRAK and SwathTRAK technologies for a universal sensor that surpasses larger systems with consistent, ultra-dense data and measurement precision and accuracy.

    In addition, visitors will see the new Polaris Terrestrial Laser Scanner (TLS) for ground-based survey applications. With an integrated high-resolution camera, inclinometers, compass, GPS receiver, and weather-proof housing, the Polaris can be deployed in many environments and orientations.

    Visit Booth 1767, where sustaining USGIF Member Teledyne Optech will be joined by Teledyne DALSA, Teledyne Imaging Sensors, and Teledyne Brown Engineering to represent a broader range of Teledyne’s capabilities and solutions for GEOINT/ISR applications, including lidar, EO, IR and hyperspectral imaging.

    Esri will be showcasing mission-focused enhancements using the ArcGIS platform for defense, intelligence and national security workflows.

    ArcGIS provides high-performance 2D and 3D analysis for defense, intelligence, and national security. It is a complete and open platform for managing, analyzing, and sharing data and data products. ArcGIS leverages big data, web technologies, and integrated apps to make location-based data easy to use, more accessible, and collaborative.

    “GEOINT and geographic information system [GIS] technologies have never been more important to the intelligence community,” said Ben Conklin, Esri head of industry, defense, and intelligence. “We are looking forward to the annual GEOINT Symposium, since it gives us a great opportunity to demonstrate the latest advances in GIS technology. The event also gives analysts access to tools that provide quick, responsive, and interactive experiences for increased productivity and support of decision-making and operations at every level.”

    Esri will offer the following demonstrations at Booth 615:

    • Advancing The Science of Where
    • Reveal Deeper Insight through Analytics
    • Unlock Your Data with Apps
    • Open Platform for Intelligence

    The Esri Presentation “Geospatial Intelligence Using a Web-Enabled GIS” takes place Tuesday, June 6, 2 p.m., 007C River Level.

    East View Geospatial (EVG), a provider of content-rich cartographic products, continues to enhance the accuracy of automated feature identification using its newly developed training data sets in supervised machine learning applications. The early results pertained to automated recognition of building structures in an ongoing pilot project in Papua New Guinea (PNG).

    “Our goal is to create a state-of-the-art process that produces the highest quality training data available for the users and developers of supervised machine learning technology,” said Rod Buhrsmith, business eevelopment at EVG. “In just a few months, we have made significant progress and expect to push the accuracy even higher.”

    EVG will be available to discuss the PNG pilot in private meetings at GEOINT (contact Rod Buhrsmith at [email protected] or Mark Knapp at [email protected] or call 1-952-252-1205.)

    Sample data sets are being offered at no charge.

  • Galileo boosts GNSS corrections services

    Trimble’s RTX-based correction services now support the Galileo constellation. As a true five-constellation technology that uses GPS, GLONASS, BeiDou, QZSS and now Galileo satellites, Trimble RTX delivers improved real-time positioning performance to its users worldwide.

    With accessibility to the Galileo constellation, users now have visibility to more satellites, which can be advantageous for extreme latitudinal positions or in environments where line-of-sight may be limited.

    Surveyors, farmers, mapping and GIS professionals now have a more versatile and robust correction solution wherever they may work, even in the most challenging terrain locales.

    Benefits of adding Galileo to Trimble RTX correction services includes:

    • Increasing the number of in-view satellites, improving the accuracy and reliability of corrections
    • Improving positioning integrity using observations from additional satellites to better mitigate errors
    • Operating at higher cut-off angles, delivering better performance in urban canyons and other less than optimal environments
    • Minimizing multipath and interference through the addition of available satellite signals

    “Trimble is continually investing in its correction service technology to remain at the forefront of the industry,” said Mark Richter, marketing director for Trimble’s Networks and Services business. “Our focus is to ensure that the latest GNSS developments are leveraged to continue to deliver productivity improvements for our customers across the globe.”

  • TerraGo Edge version 4 uses iOS, Android flexibility

    TerraGo Edge version 4 uses iOS, Android flexibility

    The profession of land surveying has taken advantage of many technological location and measuring advancements, yet most of the data collectors used today are still based upon aging proprietary data collectors and even older operating system platforms.

    A common tool for most surveyors is the smartphone or tablet, so TerraGo developed an application that takes advantage of the nimble programming of iOS and Android.

    The TerraGo Edge 4 mapping application utilizes all the best features of today’s mobile technology, according to TerraGo. Besides an intuitive interface, Edge 4 allows users to customize how their data is collected and presented, including overlays on Google and Apple maps.

    Depending on the user’s needs, Edge 4 can use the device’s Bluetooth connection to an external GNSS receiver for greater accuracy.

    Sharing is also easy with publishing and ArcGIS exporting plug-ins, all in a mobile environment most users are familiar with using every day, the company said.

    GPS and GIS features include:

    • Sub-meter and centimeter precision
    • Real-time GPS monitor
    • Full NMEA GPS metadata display and capture
    • GPS accuracy settings
    • RTK support
    • Dynamic BT device list
    • Auto-record GPS Lines and Polygons
    • Import and export Esri file geodatabase, Shapefile, KML, CSV, JSON
    • OGC GeoPackage (SQLite) vector and raster

    Learn more on the TerraGo Edge features page.

    TerraGo Edge version 4.0 offers a completely redesigned app based on customer feedback, field user observations and task-centered design cycles, as well as a host of new features including the addition of Google and Apple basemaps.

    “The new interface is so much more than just a ‘look and feel’ change; it will allow us to more efficiently execute projects and improve data quality in less taps and less time, which is a force multiplier when you’re talking about thousands of data points per day,” said Scott Riccardella, director of oil and gas business development at Structural Integrity Associates. “Having the right tool is essential to getting any job done right, and TerraGo is ahead of the game when it comes to giving my field teams the best possible tool for the fastest, most accurate and highest-quality asset inspections.”

    “We have completely rebuilt the mobile user interface from the ground up to improve all aspects of the app’s performance, and while users will notice the stunning graphics and aesthetics, the real value is that the feature or data you need is always just one tap away,” said Dave Basil, vice president of product development at TerraGo. “By incorporating the latest native design elements like tabbed navigation, responsive split screens and adaptive list views, we found ways to improve the speed and efficiency of the work our customers do every day.”

    TerraGo Edge’s latest features include:

    • Reimagined user experience: Rebuild of the Edge mobile user interface incorporating both years of user feedback from the field and interactive design cycles with live users.
    • Google and Apple maps: Standard, satellite and hybrid maps are available for data collection and are paired with new precise location pin icons for a cutting edge data collection experience.
    • Tabbed app navigation: With the new, easier to reach tabbed navigation, it’s easier to collect data in the field.
    • Quick capture button: Allows users to create notes, complete forms, take photos, drop points and draw lines/polygons from virtually anywhere in the app, with only one tap.
    • Unlimited attachments: Now users can attach as many forms, photos or videos as you would like to a single note.
    • Responsive split screen view: When holding a tablet or larger mobile device in landscape mode, new split screens will automatically allow userse to view lists/maps or lists/details on one screen.
    • Detailed list view: The new detailed list view shows more of the important note data making it easier to find notes, and enables one-tap actions directly from the list.
    • One-tap forms and maps lists: Now users can view all the form templates, and instantly create notes using them, or view all your offline maps and directly access them, from one master list.
    • Precise location: Users can capture a more accurate location when creating notes by using the center crosshair target and coordinate level accuracy for dropping points and drawing lines/polygons.
    • Filter by map extent: This new feature keeps the notes on a map and in a list dynamically in sync.
    • Quick basemap preview: Preview online and offline basemaps in real-time from the selection screen to choose a map with one tap and no toggling back and forth.
    • Arc2Edge plug-in: ArcGIS Desktop users can directly share maps and features with mobile users, allowing them to roundtrip updates and new features from the field back to ArcGIS.
  • u-blox, SIM Technology terminate asset purchase agreement 

    u-blox and SIM Technology Group Limited of Shanghai, China, have announced that u-blox will not be acquiring the SIMCom cellular module product line as previously planned.

    Despite best efforts on the part of SIM Technology Group and u-blox, the companies could not close the deal as originally intended and were unable to find alternatives that worked for both while sustaining the intended benefits. Both parties have therefore decided to  terminate the Asset Purchase Agreement and Technology Assignment Contract with all ancillary agreements.

    “While we are disappointed that the deal has not come to fruition, u‑blox and SIM Technology Group Limited continue to have a good relationship and expect to find other ways of working together in the future,” said u-blox CEO Thomas Seiler.

    “Our strategy for cellular products remains focused on growth,” Seiler said. “For some time now we have been working on adapting our product range to achieve a stronger geographical diversification mainly for the Asian markets, where we make 50 percent of our global revenue. The strong move to LTE based connectivity will naturally open new strategic windows. Our strong focus and investment in our own chipset development especially for IoT applications is a key part of our strategy. Our guidance indicates a continued strong growth.”

    As a result of this situation, u-blox has revised its guidance figures for 2017 back to levels as provided on Jan.11, 2017, and foresees for FY 2017 continued growth in all regions expecting revenues of between CHF 410 and 425 million, with EBIT in the range of CHF 60 to 65 million.

  • Upgrades to monitoring stations support EGNOS

    Upgrades to monitoring stations support EGNOS

    Upgrades to the monitoring stations underpinning Europe’s EGNOS satnav augmentation system will support its evolution, said the European Space Agency.

    The current 40 Ranging and Integrity Monitoring Stations (RIMS) sites across Europe and beyond are the bedrock of the European Geostationary Navigation Overlay Service (EGNOS), supplying highly accurate and robust satnav information that can be relied on for safety-critical purposes.

    Thales EGNOS V3 RIMS rack.

    Once a second, these stations gather raw satnav data to transmit information on signal quality and range measurements to the GPS satellites, allowing EGNOS to identify and remove any error in the signals.

    The resulting corrections are then passed to users via a trio of geostationary satellites, delivering a several-fold increase in precision plus “integrity” — a guarantee of navigation service — for safety-of-life applications.

    The result is that the EGNOS-augmented signals are guaranteed to meet the extremely high performance standards set out by the International Civil Aviation Organisation standard, adapted for Europe by Eurocontrol, the European Organisation for the Safety of Air Navigation.

    The signals from space can therefore be relied on routinely for safety-critical tasks, such as vertically guiding aircraft during landing approaches.

    “These current RIMS V2 stations have some inherent limitations, which we’ve sought to tackle in this upgraded V3 design,” said Didier Flament, ESA’s EGNOS programme manager.

    Airbus EGNOS V3 RIMS rack.

    “For instance, our current stations work only with GPS frequencies L1/L2 P(Y), while the future post-2020 EGNOS system will be operating on a multi-constellation basis, additionally employing modernized GPS signals, notably on both the L2 (L2C) and L5 frequency bands, as well as other signals from Galileo, on the similar E1 and E5 frequency bands.

    “Our experience working with RIMS has emphasized the significance on performance of factors such as signal scintillation — caused by the ever-changing ionosphere, the electrically active layer of the upper atmosphere — as well as other environmental threats such as interference and multipath signal reflection.

    “So this upgraded design increased robustness to these factors, based on more stringent development and operating standards, along with innovative radio-frequency environment monitoring.

    “It also includes upgraded receiver technology to accurately monitor potential GPS and Galileo signal distortion — ‘evil waveform’ signal anomalies — in full compliance with international standards.”

    The RIMS V3 stations will be based in the same or similar secure location as today’s stations — typically airports or space-based telecommunication sites.

    Dual tracking antenna concept incorporated in EGNOS V3 RIMS design.

    The individual RIMS antennas themselves can be relatively compact, about 50 cm high, with links to receiver and computing equipment.

    Most of the RIMS V2 station antennas are currently surrounded by dedicated protection structures that limit the impact of interference and multipath local effects.

  • Trimble to acquire Müller-Elektronik for precision agriculture

    Trimble has signed an agreement to acquire privately held Müller-Elektronik, a German company specializing in implement control and precision farming solutions.

    The transaction is expected to close in the third quarter of 2017, subject to customary closing conditions and clearance or expiration of the waiting period under the German Act Against Restraints of Competition. Financial terms were not disclosed.

    With more than 375 employees, Müller is precision farming company known for developing, producing and selling electronic control units and embedded software that provides vehicle and implement control for tractors, combine harvesters, field sprayers, drill machines, seeders, spreaders and slurry tankers to improve the management of inputs such as seed, fertilizer and pesticides.

    Müller was a key contributor in the development of the ISOBUS communication protocol, which allows one terminal to control several implements and machines, regardless of manufacturer. ISOBUS standardizes the control settings, reduces downtime and minimizes installation and interface challenges, simplifying data exchange and machine control. The implement control solutions developed by Müller have now become widely adopted by leading agriculture OEMs and aftermarket channels.

    Combining the technology and strengths of Trimble and Müller will enable the development of new and exciting solutions for farmers worldwide, who often struggle to integrate and use disparate hardware and software products across various brands of agricultural equipment. The addition of Müller-Elektronik will enable the creation of an ecosystem where farmers, advisors and retailers can easily build field prescriptions and transfer that prescription to the implement, enabling farmers to more easily adopt precision agriculture solutions.

    “Our planned acquisition of Müller-Elektronik recognizes the growing importance of the implement in variable rate application solutions as well as the importance of an integrated platform that is agnostic to equipment brand,” said Darryl Matthews, Trimble senior vice president. “Müller’s ISOBUS solutions are already compatible with a significant range of equipment manufacturers. This capability, together with existing Trimble competencies, will enable us to expand our role in the growing market for variable rate applications. We plan to continue to fully support existing Müller customers and partners.”

    “Trimble is a leading provider of precision agriculture hardware and farm management software,” said Christian Müller, managing director for Müller-Elektronik. “Bringing Trimble together with Müller’s leading ISOBUS solutions will create an industry-changing opportunity to deliver a system-wide integration that is uniquely available through the combination of the companies. Our systems, combined with farm management software, will enable OEMs to provide integrated plug-and-play solutions straight from the factory, while also helping the growing aftermarket channel looking to support its customers with mixed fleet operations with an ISOBUS solution.”

    The acquisition of Müller-Elektronik will include the company’s other operations, WTK Elektronik, a German-based company, ME-France, ME Sudamerica, an Argentina-based company, and Mueller Electronics Inc., a North American-based company. The Müller-Elektronik businesses will be reported as part of Trimble’s Resources and Utilities Segment.

  • Hydrographic surveys to improve maritime safety in Papua New Guinea

    Papua New Guinea

    Fugro has been awarded six contracts by the National Maritime Safety Authority (NMSA) of Papua New Guinea. The hydrographic survey packages are expected to contribute to capacity development in the country, which has more than 5,000 kilometers of coastline.

    The surveys will be conducted using a combination of Fugro’s Airborne Lidar Bathymetry (ALB) and multi-beam echo sounder (MBES) sensors, and a seamless dataset will be delivered to the NMSA.

    “As a pioneer of ALB development, Fugro has a solid track record in applying this advanced technology for mapping shallow water environments safely and cost- effectively,” said Paul Seaton, Fugro’s regional business development manager for Asia Pacific.

    The surveys in deeper waters will be performed by vessel, and Fugro will also conduct a comprehensive tides campaign throughout the survey area.

    The contracts are part of the Asian Development Bank-funded Maritime Waterways Safety Project that aims to improve the safety and efficiency of the country’s international and national shipping in coastal areas and waterways. By improving the maritime environment and making coastal shipping safer, the project will facilitate travel, trade and tourism for rural communities.

    Fugro has also begun a hydrographic survey encompassing an area of Norwegian waters of 15,000 square kilometers. The contract was awarded by the Norwegian Hydrographic Service and has a value of 34.5 million NOK (approximately €3.8 million).

    The survey is part of the MAREANO program, for which Fugro has successfully completed a number of surveys since 2006. The Norwegian program maps depth and topography, sediment composition, contaminants, biotopes and habitats. It takes place in the Barents Sea with various areas located above the 78th parallel and typical water depths ranging from 80 to 3,500 meters.

  • USGS proposed budget focuses on core science and efficiency

    President Donald Trump has proposed a $922.2 million Fiscal Year 2018 (FY18) budget for the U.S. Geological Survey. The proposed FY18 request reflects a savings of $137.8 million in appropriated funds from the FY 2017 CR baseline and a continued commitment to the bureau’s core mission.

    The USGS proposed budget provides science support for disaster alerts and rapid response, producing high-resolution geospatial data, addressing new and emerging invasive species and disease, tackling water challenges and supporting development for the Landsat 9 satellite ground system.

    According to a USGS press release, the request ensures that the USGS will continue to focus on conducting leading-edge research and providing impartial scientific data to key stakeholders and decision-makers to help promote stewardship of public lands and waters and protect the health, safety and prosperity of the nation.


    The USGS will also conduct work on environmental impacts of resource extraction and understanding how mineral resources interact with the environment to affect human and ecosystem health.

    The agency will also continue to develop and apply new methods to forecast, detect and understand health implications of toxins produced by harmful algal blooms. Additionally, the USGS will continue research to understand contaminants and pathogens related to drinking waters.

    The USGS budget also places strong emphasis on assessing the occurrence, quality, supply and use of energy and critical mineral resources. The FY18 budget request for the USGS Energy and Minerals Resources Mission Area is $74.4 million.

    The agency will continue to assess energy resources and provide publicly available scientific data and tools to inform energy policy discussions as well as to support science-based decisions that facilitate responsible resource management, including oil, gas, coal, geothermal, uranium and gas hydrate energy resource activities. This request will also allow the USGS to focus on understanding the genesis and distribution of the nation’s critical mineral resources, particularly in Alaska, mid-continent and southeast regions of the United States.

    The USGS FY 2018 Budget Justification is available here, and additional details on the President’s FY 2018 Budget are available on the department’s website.

  • Oscilloquartz unveils dual-antenna GNSS SyncReach for small cells

    Oscilloquartz has launched the OSA 5405 SyncReach, an integrated PTP grandmaster and GNSS receiver with a patent-pending dual antenna and receiver to enable the mass roll out of small cells.

    The new technology has been specifically engineered to provide accurate and affordable phase synchronization for the rapidly growing small-cell market and meet the stringent timing requirements of 4.5G and 5G connectivity.

    With the OSA 5405, operators can migrate from legacy GNSS RF antennas and cables to standard, cost-effective copper and fiber Ethernet cabling, reducing capital expenditure and operating expenses, Oscilloquartz said.

    Available in both indoor and outdoor variants, the OSA 5405 can be deployed in challenging environments, including urban canyons where GPS signals fail. The OSA 5405’s miniscule form factor also enables it to be positioned on indoor windows to avoid multipath signal interference from objects within the building.

    The OSA 5405 uses a unique dual GNSS antenna and receiver algorithm to mitigate interference from multipath signals that can affect accuracy, particularly in urban canyons, according to the company.

    “We’re at the start of a new era. With the internet of things (IoT) connecting more wireless devices and 5G just around the corner, small cells will have a big role to play,” said Gil Biran, general manager at Oscilloquartz. “This market is set to grow exponentially in the next few years. Small cells will soon be everywhere and that makes precise synchronization essential. Operators urgently need a way to reliably and affordably deliver new levels of phase accuracy.

    “We’ve created our OSA 5405 to effectively deliver small cell synchronization in any environment and eliminate all restrictions,” Biran said. “Our new technology radically simplifies GNSS antenna installation. The use of PTP removes the need to compensate for cable delay and extends the reach of GNSS. It enables operators to forget about archaic and expensive RF cables and use simple copper cabling or optical fiber for longer distances. And, with variants that can be positioned in almost any location, it provides strictly accurate timing precisely where it’s needed.”

    The compact design and power-over-Ethernet capabilities of the indoor- or outdoor-mounted OSA 5405 enable synchronization at the edge of the mobile network. This creates dramatic reductions in complexity and power requirements as well as lower costs for installation and operation.

    Another feature of the new technology is IP connectivity, so that synchronization becomes another element of the internet of things.

    The OSA 5405’s highly precise GNSS-sourced synchronization is supported by network-based Sync-E and PTP backups. In high-rise buildings it can also deliver synchronization recovered from the GNSS smart receiver over optical fiber.

    The ADVA FSP Network Manager with comprehensive Syncjack assurance guarantees efficient operation.

    “Make no mistake; the launch of our OSA 5405 is a major milestone in the progress towards mass-scale small cell deployment,” said Nir Laufer, product line director at Oscilloquartz. “With its plug-and-play simplicity, miniscule form factor and multiple timing functions in a single device, this is a key technology for 5G networks and the IoT.

    “Currently deployed in trials with major carriers, it will shortly be available to all operators looking to harness next-generation synchronization precisely where it’s needed,” Laufer said.