My fellow geospatial editor, Art Kalinski, wrote about BIM (building information modeling) earlier this week in the GeoIntelligence Insider newsletter. I’ve touched on the subject before. All too often we think of GIS as it relates to outdoor infrastructure: street maps, utility systems, parcel maps, timber harvesting, land management, environmental management, etc.
Last summer at the Esri Surveying and Engineering Summit, I attended a talk presented by Stuart Rich, chief technology officer of Penobscot Bay Media, LLC. He presented on understanding, documenting, and building systems to support spatial data infrastructure’s security requirements as well as initiatives to move GIS inside the building footprint.
He said he was involved in using terrestrial LiDAR inside buildings to collect massive amounts of data. So much, in fact, that “the value of measurement is trending very close to zero” using very high-volume data collection at 250,000 points/second.
Stuart’s Factoid: Only 16% of cities are mapped, with a big vacuum being building interior maps in urban areas.
He also discussed the lack of attention to underground infrastructure mapping.
Another example of BIM detail, as provided in Art’s article, is a building wall which, in most GIS, if it exists at all, is a single polyline, maybe two polylines in rare cases. Thinking in a GIS sort of way, a building wall ”could contain more than six layers of data: paint, drywall, framing, blocking, fire stops, insulation, etc.” Think about this for a minute. Imagine how the quality of decisions would improve if the building owner was considering renovating his building and had this sort of information and software tools available. The decisions about which walls to leave or take down and future layout, for instance, would likely change if this information was readily available.
Honestly, for building design, and most kinds of design for that matter, CAD isn’t the right tool if you think about it. It doesn’t have the database or analysis tools behind the various points, lines, and polygons to make the best decisions. This is the foundation of the GeoDesign concept being promoted these days.
Although I didn’t set out to write about GeoDesign, it’s very fitting. According to Wikipedia, “GeoDesign brings geographic analysis into the design process, where initial design sketches are instantly vetted for suitability against a myriad of database layers describing a variety of physical and social factors for the spatial extent of the project. This on-the-fly suitability analysis provides a framework for design, giving land-use planners, engineers, transportation planners, and others involved with design the tools to leverage geographic information within their design workflows.”
Of course, as Stuart mentions and as I’ve written about before, a highly related topic is underground infrastructure (sewer, water, electric, gas, telecom). That’s a whole other subject and one that I’m close to as I spend quite a bit of time working with landscape architects who deal with underground infrstructure on a daily basis in their projects. For them, as opposed to “what’s inside the wall,” a landscape architect has to ask “what’s under the ground.” If he or she doesn’t know until the construction crew starts tearing down and digging, then the project risk increases substantially.
A good example and story I read this week was a short interview that Directions magazine published about the San Bruno gas pipeline explosion which killed nine people. You can read the interview here. Essentially, it’s a lesson in spatial data management with respect to underground infrastructure, with spatial data accuracy being the primary theme.
Data, Data, Data
In the world of real estate, it is said the three most important features of real-estate property are location, location, and location. I think you can say that the three most important feature of a GIS are data, data, and data. It’s not the software tools we are lacking, it’s the data. That’s why revenue from GIS data over the past eight years has grown at a compound annual growth rate (CAGR) of ~15 percent, while GIS software has grown considerably less, according to research firm Daratech, Inc.
Where Is the Data Coming From?
Data collection technology is changing rapidly. Look at two key sources of geospatial data: remote sensing and GPS. Remote sensining, in particular, is well-suited for building interior data collection.
At the same Esri Surveying and Engineering conference I mentioned above, Lawrie Jordan, director of Imagery at Esri, said that this is the most exciting time to be involved in imagery during his 40-year career.
Commercial satellite imagery quality and availability is the best it’s ever been. It wasn’t that long ago that three-year-old, one-meter-pixel resolution, black/white imagery was the norm. Today, GeoEye, DigitalGlobe, RapidEye, and Spot Image are delivering an amazing amount of digital imagery at even more amazing resolutions. Jordan stated that in less than five years, every square inch of the Earth will be imaged (by satellites) constantly. He said we are already half-way there.
Another form of remote sensing that’s busting at the seams is 3D scanning (terrestrial LiDAR). We’ve seen a lot of development in 3D scanning over the past 10 years. The equipment used to be pretty expensive, but the prices are coming down as the technology gains acceptance. I recall using the technology a number of years ago (circa 2003). I was tasked with an accident reconstruction project. Part of the task was to create a 3D model of a wrecked automobile. Traditionally, one would use a surveying total station and measure shot-by-shot at key points on the automobile. Even measuring 1,000 points on the automobile wouldn’t result in enough data points to create a reasonable 3D model. We decided to use a 3D scanner. We were able to scan the automobile in under two hours and collect a tremendous amount of detailed data.
The good news is that we had a tremendous amount of detailed data to work with. The bad news was the same, we had a tremendous amount of detailed data to work with. I think it took us four weeks to produce a deliverable from the data. However, keep in mind that this was nearly eight years ago and software tools have come a long way since then (Safe Software, Leica Geosystems, Trimble, Topcon, all have software tools for dealing with 3D scan data), so the process in producing a deliverable today is more efficient.
I’ve written and said this many times over: geospatial data fuels the GIS software engine. Esri and other GIS software developers are making very powerful GIS engines. In fact, the GIS software engines far exceed the quality of the geoespatial data we have to work with. BIM is a great example of that. There’s a substantial lack of BIM data, but with 3D scanning and other geospatial data collection technology advancing rapidly today
, that will change. GIS will move indoors.
The recent Mobile World Congress in Barcelona had a record 60,000 attendees. Many industry companies were either exhibiting or attending to kick tires to see how the international location-based services market is faring. Industry observers are saying the focus of the trade show has gone from European-centric markets to a broader view, particularly as new technology and standards evolve and mature.
The recent Mobile World Congress in Barcelona proved that the market for location-based services is on a worldwide stage — and not sequestered to certain regions. Clay Babcock, Rand McNally director of advanced navigation technology, says the Mountain World Congress traditionally focused on European markets.
“The MWC, and the 3GSM show that preceded it, were primarily European affairs that highlighted the latest hardware in the GSM world. While the shining stars came from places like Espoo, Finland, and Stockholm Sweden, even the second-tier players were European, with Bosch, Siemens, Alcetel, Sendo, and Phillips all making phones for the growing market,” he said. “For the most part, the North American and Asian players sat on the sidelines. A possible exception was Motorola, who had two brief moments in the sun with their Startac and then Razr phones. Asian companies seemed content to make phones for the proprietary Japanese and Korean markets.”
Several technology events have changed the market—and the key part of the shift has been the dominant role that software, ecosystems, and the well-used line of ‘user experience’ now plays a major part in the world of mobile telephony, Babcock said.
“And with it, the center of the mobile world has moved to the west coast of the United States. The rise of the Apple iOS, Google Android–and now a lesser degree Microsoft WM7–has created new opportunities for many, but has also caught some big players off guard,” he said. “Nokia, for all its brilliance in making hardware, has been forced to drop its long-in-the-tooth Symbian OS in favor of WM7. This has angered many in the installed user base, but they miss the point. Nokia had to make a move, and a move to Android would have been a fatal step.”
Babcock contends that with Microsoft, Nokia at least gets an OS partner that they can look upon as equals. “That was never going to happen with Google. The state of affairs is so dire at Nokia that for the second year in a row, they failed to display at the show,” he said.
Missing at MWC is Apple, which Babcock says never comes anyway–and says that absence opened the door wide for Android. “The Android booth was a buzz of activity and excitement. Following a theme with other large booths at the show, a large section of the floor space was dedicated to partners’ applications and solutions,” he said. “The show is really all about software.”
As GPS World reported, the Nielsen Company said that Android appears to be pulling ahead of RIM Blackberry and Apple iOS in the market share battle for smartphone operating systems. But an analysis by manufacturer shows Research in Motion and Apple to be the winners compared to other device makers since they are the only ones creating and selling smartphones with their respective operating systems.
Location Just a Feature?
As for location-based services, they are maturing, becoming ubiquitous in the hardware, Babcock said. “Companies are starting to understand that location is a feature, not a business. This will affect business models that were once designed as end-user plays,” he said. “Everybody still can get paid, but maybe not by entities you first thought would pay.”
Babcock said that while the focus was on software at MWC, there was brilliant hardware on display. “The new Samsung Galaxy S II features a dual core 1-GigHz CPU and 4.3 inch super AMOLED display. Motorola, who like Sony-Ericsson is thriving after switching to Android, announced a new phone with an array of amazing accessories, one that turns the phone into a mini-laptop,” he said.
Babcock said that, even on his cab ride to the airport to return home, there was a poster for a mobile taxi application that would locate customers and dispatch a car to their location — and let them know the estimated time of arrival. “Neat, maybe not earth-shattering, but the platforms it supported were Android, iOS and Research in Motion. The new world of phone operating systems, were found in the back of a Barcelona taxi,” he said.
A number of such LBS industry companies as Navteq, ALK Technologies, deCarta and other entities had large presences or meeting rooms at MWC. Show organizers say the crowd topped out at 60,000, which was significantly higher than in 2010 or 2009. Like the Consumer Electronics Show in January, it appears that trade show attendance is up for the first time since 2008. It will be interesting to see if this trend continues for this month’s CTIA in Orlando.
Foursquare Expands Language Capability
In other MWC news, Dennis Crowley, CEO and co-founder of Foursquare, delivered a mini-keynote at the trade show about “Making Apps Smarter Through Location/Localization.” The company has made rapid expansion throughout the past year—and now has check-ins from nearly 200 countries.
Foursquare recently announced that its service is available in French, Italian, German, Spanish, and Japanese. Users can update Foursquare on their Blackberry, iPhone, or Android, to switch to the default language of the device.
In other LBS news:
TCS said that U.S. Cellular has extended its agreement to offer the company’s Your Navigator service on BREW phones. Your Navigator is an LBS application for GPS-enabled mobile phone, offering personal navigation and real-time, turn-by-turn visual and audio directions. TCS, which has worked with U.S. Cellular since 2007, signed a two-year software licensing agreement extension.
After watching this video (5:33 in length), you may feel like buying stock in Corning Glass!
How important are graphic displays to the geospatial professional? I’d say vital. I’m not sure about all the consumer glass stuff they show in the video, but it does show where glass technology is heading. I was at a municipal transportation advisory meeting last night and I can imagine a dual-purpose whiteboard/mointor in a city planner’s conference room where one could display the City GIS for detailed discussions instead of the dated, static maps taped up on the wall. The only question is cost. Given the cost reduction of large, high-resolution monitors in the past two years, Corning’s vision, at least for geospatial apps, may not be that far off.
Augmented Reality
Hmmm…do you see a trend here? Tablet computers, glass displays, augmented reality software.
It’s pretty clear where things are heading. You can already see this on mobile phones today.
A couple of weeks ago, I mentioned that I bought a Samsung Galaxy S (Epic 4G) phone. It’s screen is large enough (4″ display) that you can use it like a tablet computer. The touch screen display is such that I use it like you saw in the Corning video using Swype or similar technology.
I have not found a better one-minute video than the one below that exemplifies the beauty of augmented reality. It’s truly an example of technology integration as GPS and digital compass data are used to correctly position the mobile device.
iPad 2
Although it hasn’t panned out to be the geospatial tool it could have been, the iPad has given the tablet industry some mojo. It’s pure speculation on my part, but I think it’s safe to say that more tablets have been introduced in the past year than in the previous five years, thanks to the iPad.
What does the the iPad 2 offer?
33% thinner, 15% or so lighter, faster processor, front and rear cameras. Nice features, but it’s more of an update than an upgrade. Still no support for Bluetooth SPP (Serial Port Profile), so you still can’t interface it to external GPS receivers.
This week I’m following up on my article from a couple of weeks ago about the potential effects of LightSquared’s plans. As a user of high-precision GPS receivers (particularly GPS L1 sub-meter, but also dual-frequency), you should be particularly concerned about this issue. I’ll tell you why. Also, I have a note on recent the solar activity.
The reasons you should be concerned about LightSquared’s plans are two-fold:
1. Consumer GPS receivers and professional-grade GPS receivers designed for higher performance (mapping, surveying, etc.) aren’t necessarily designed the same way. High-performance GPS receivers use a wider bandwidth radio design.
For example, the GPS L1 frequency is 1575.42 MHz. Many high-performance GPS receivers use a wide bandwidth radio that scans +/- 20 MHz from 1575.42 MHz. That equates to a range of 1555 MHz to 1595 MHz. LightSquared’s frequency spectrum is 1525 MHz to 1559 MHz. Clearly, there’s overlap, which is another word for interference. On top of that, LightSquared plans on a broadcast strength of 1,500 watts from a tower located down the street. The GPS broadcast signal strength is about 30 watts from a satellite located some 19,000 kilometers away in outer space. Who’s going to win that battle?
I’m not an aerospace engineer or an RF (radiofrequency) engineer, but I don’t think it takes one to see the potential impact of LightSquared’s service on high-performance GPS receivers. At the very least, it warrants an in-depth technical study.
2. Neither the policymakers nor LightSquared know about or understand the user community of high-performance GPS receivers comprised of hundreds of thousands of high-end GPS receivers. They think the GPS user community is comprised of auto navigation and mobile-phone users. They don’t understand that we are the infrastructure people. We use GPS in a way that they don’t understand, but is so critical to our infrastructure. It’s not their fault, but you can’t assume they know, so it’s up to us to inform them. You have to speak up.
Here’s a perfect example. Click on the following link to view a report presented by LightSquared last week in Taipei, Taiwan, at a 3GPP conference.
The best part about this report is the following statement from the Executive Summary:
“Although results have been provided to date of a limited number of devices (6), LightSquared proposes to close the study at this stage as a more comprehensive study, covering a wider variety of GPS receivers than those involved in cellular applications, has now been initiated under the auspices of the FCC [2]. This study will be conducted by a cross-industry group led by LightSquared and USGPSIC, the reports of the study having complete public visibility.”
Granted, I understand the Taipei conference was focused on the impact of LightSquared’s plan on mobile phones using GPS, but if this is the extent of their testing, it’s alarming. Furthermore, it’s relatively easy to acquire and operate an inexpensive consumer GPS receiver. Can you picture LightSquared attempting to test a sub-meter GPS L1 receiver or a RTK setup? GPS, GLONASS, SBAS, DGPS, real-time, post-processing, and the myriad of receivers on the market need to be tested. Although it’s likely not possible to test all equipment on the market, it’s not prudent to leave anything to chance. If, one year from now, you wake up and find out your $10,000 RTK receiver doesn’t work like it used to, it will be too late to do much about it. It takes very little time to voice your concern now to your elected officials so the appropriate attention is given to high-precision users.
The good news is that Trimble Navigation is involved, along with the Federal Aviation Administration, with the U.S. GPS Industry Council and will be working closely with LightSquared in a Technical Working Group to better understand the impact that LightSquared’s system would have on GPS. Trimble and the FAA aren’t the only parties involved in the working group, but they are the parties that understand the needs of the high-precision user.
The Technical Working Group’s first report is due March 15, 2011. Time is short, so don’t delay.
Use these guidelines to take action. It is a call to action from Dr. Joe Paiva, veteran of surveying since the 1980s with whom many of you are familiar.
Solar Activity
As you’ve probably heard, we’re entering the next solar cycle, which is due to peak in May 2013.
I want to periodically touch on this subject as the solar activity is going to increase over the next few years, and if the solar activity (geomagnetic storms, not sunspots) is severe enough, it will have an effect on GPS accuracy and tracking. Regardless of what you’ve heard in the mainstream media in recent months, the last event serious enough to affect GPS operations was in December 2006. That’s not to say that things aren’t heating up.
But the recent activity does highlight the fact that “the Sun has become, somewhat suddenly, more eruptive,” according to Joe Kunches, of NOAA’s Space Weather Prediction Center. “We’ve been fortunate so far, in that the terrestrial effects — and impacts to GPS — have been very minimal. The most obvious sign of this has been the brilliant auroras up north.”
“The video shows a large prominence eruption — billions of tons of plasma being strewn off the Sun. Some of it is drawn by gravity and rains back to the surface — the rest of it escapes. It’s the blown-away plasma that forms the coronal mass ejections that, when properly pointed, go by the Earth and cause problems for GPS,” said Kunches.
Click on the following image to view a 15-second video of a solar flare that occured on February 24, 2011.
Credit: NASA/GSFC/SDO
From NASA:
When a rather large-sized (M 3.6 class) flare occurred near the edge of the Sun, it blew out a gorgeous, waving mass of erupting plasma that swirled and twisted over a 90-minute period (Feb. 24, 2011). This event was captured in extreme ultraviolet light by NASA’s Solar Dynamics Observatory spacecraft . Some of the material blew out into space and other portions fell back to the surface. Because SDO images are super-HD, we can zoom in on the action and still see exquisite details. And using a cadence of a frame taken every 24 seconds, the sense of motion is, by all appearances, seamless. Sit back and enjoy the jaw-droppi
ng solar show.
Last year, the first GPS IIF satellite was launched. It became the first GPS satellite to broadcast the new L5 civilian signal/frequency. At 1176 MHz, it is further separated from L1 and L2 and located in the protected Aeronautical Radionavigation Services band, so there is no possibility of commercial interference like we see today with theLightSquaredcontroversy. The availability of GPS L5 will usher in a new era of inexpensive, accurate GNSS receivers and will be the future of high-precision GNSS receivers, and quite possibly single-frequency receivers. I will also discuss the international support of L5 from other GNSS in development such as Galileo, Compass, QZSS, as well as SBAS (WAAS/EGNOS/MSAS).
I’ll be presenting some interesting new material in the webinar such as graphics illustrating how many satellites (GPS and others) are projected to be broadcasting L1 and L5 just four years from now. It will be well worth 60 minutes of your time.
The presence of different types of devices, spanning multiple GNSS receiver types, configurations, hardware, software, and consequent widely varying capabilites, among a user mix of vehicles, cyclists, and pedestrians, poses several engineering challenges for a V2X scheme in which all road users share data with each other and with the road infrastructure.
The use of location awareness for transportation safety, efficiency, and security — a major area of research and development for academics, automotive manufacturers, and organizations such as the U.S. Department of Transportation — has focused attention on enabling communication between vehicles and other road user entities in a concept know as V2X, a term encompassing both vehicle-to-vehicle (V2V) and vehicle-to-infrastructure (V2I) systems, so that they can share location and other status information. As a result, any road user entity may see all others around it. This capability is almost always built on GNSS technology.
Future V2X systems will be able to include all road user entities, ranging from vehicles to cyclists to pedestrians, in this information-sharing system. While it sounds natural for everyone to talk to each other and share data for collective benefit, the presence of different types of devices among this user mix poses several engineering challenges. As an example, a V2X device in a vehicle may have a built-in GNSS receiver with a roof-mounted antenna and another vehicle may have a retrofitted V2X device with a passive antenna and relatively limited accuracy capabilities. As the GNSS technology further develops, some vehicles may have multiple-frequency GNSS capability compared to legacy single-frequency devices. In essence, all compatible V2X devices will have to be carefully designed to ensure their interoperability with the rest of the system.
This article investigates positioning challenges arising from multiple GNSS receiver types, configurations, hardware, and software in a V2X operational environment. This produces a clear need to have minimum performance standards for V2X-capable GNSS receivers. The article further investigates the implications of land-based visibility obstructions on relative positioning, and implications on standalone position accuracy both as a result of limited GNSS satellite visibility and WAAS satellite visibility.
V2X Background
V2X systems rely on two critical enabling technologies: communications and positioning. Organizations and industry collaborations have developed and demonstrated various V2X systems over the last few years. These efforts have produced interoperable prototype V2V and V2I systems and over-the-air (OTA) messaging standards.
Figure 1 illustrates the general concept of combined V2V and V2I, or V2X. In a fully operational system, all vehicles and other road users carry short-range communication and positioning technology. At present, these technologies are expected to be based on dedicated short-range communication (DSRC) and GNSS, respectively. This enables each user to be location-aware and capable of sharing their location with others. Vehicles may use built-in systems, retrofitted devices, or those based on the occupant’s personal mobile device. Infrastructure elements and other road users such as pedestrians also form part of the V2X user community.
V2X Relative Positioning. Relative positioning of all communicating entities with respect to a given user is a required functional capability of a V2X system. To enable this functionality, positioning information from all communicating entities must be exchanged. For automotive V2X applications, Society of Automotive Engineers (SAE) J2735 DSRC Message Set Dictionary serves as the primary standard for message definitions. Current version of the messages consists of a basic safety message (BSM) , an optional variable rate message (VRM), and an option for including proprietary messages.
With BSM and VRM, vehicle position, speed, heading, and GNSS measurements can be communicated to others. GNSS relative positioning techniques such as real-time kinematic (RTK), code-based differential, or individual position differing (that is, distance between the positions reported by individual vehicles) can be used for relative positioning. The latter method, also known as DPOS, is a particular focus of this article.
Given the above, a system developer may develop a V2X relative positioning system that can operate based on techniques that can be broadly classified as position-based techniques, which include DPOS, and measurement-based differential techniques, including RTK and others.
The Simpler Approach. The SAE J2735 BSM accommodates the simpler approach of using the DPOS method, as it enables the sharing of critical state parameters. This approach is very attractive as it requires minimal OTA data volume compared to sending GNSS measurements. Secondly, DPOS relative position estimation process requires only a fraction of the processing resources required compared to measurement-based differential processing. Thirdly, any GNSS receiver in the market today is capable of outputting a position solution and most of the critical GNSS state parameters required for the V2X BSM. In contrast, most low-cost devices do not output measurements required for other methods.
However, there are quite a few challenges associated with DPOS. A vehicle or any other road-user entity, such as a location-enabled handheld device, will share its location information via BSM only. A relative positioning engine in each entity will use this information to provide lane-level and road-level data (relative distance, speed, and orientation) for its V2X applications. The challenges associated with DPOS method arise from multiple stages in this process.
The presence of many road-user types brings in the possibility of thousands of GNSS receiver types, models, hardware, and software in the user group. Thus the system must be interoperable with devices with a wide range of performance characteristics.
Secondly, each entity will transmit BSM only. This OTA information offers no information about the constellation the GNSS device sees or how the solution was derived in terms of filtering or applied constraints.
Thirdly, the position accuracy reported by each entity is a GNSS device-dependent variable, an estimate of the actual error as derived by a user device.
Finally and most importantly, V2X applications expect relative positioning information for each communicating entity classified in one of three possible accuracy categories: Which Road, Which Lane, or Where-in-Lane (see “Is GNSS up to the V2X Challenge?” GPS World, October 2010). The V2X system must be able to reliably identify this accuracy classification for each communicating entity with the limited information provided via the BSM.
Study Goals. To illustrate the impact of these challenges, several GNSS receiver types, configurations, and operational scenarios were investigated.
Between multiple receiver types: In a V2X environment, vehicles and other road user entities may have different GNSS receiver types and makes: dual-frequency, single-frequency, and so on.
Same receivers using different parts of visible constellation: In an urban canyon, it is possible for two adjacent vehicles to see two different parts of the GNSS constellation, due to obstructions.
WAAS-enabled and non-WAAS receivers.
Data Collection
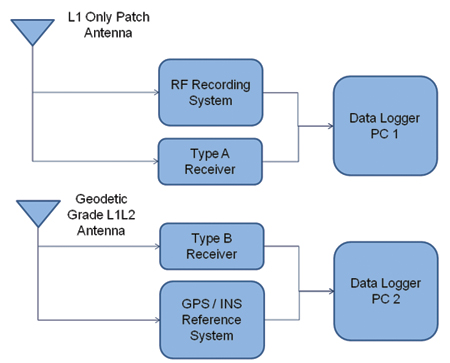
This data is a combination of field-data collections and a series of RF record playbacks. The field vehicle-mounted test setup included two GPS receivers, a GNSS L1 RF data recording device, and a high quality GPS/INS reference system (Figure 2). Type A receiver is a hi
gh-sensitivity enabled, automotive-grade GPS L1 receiver using a patch antenna, WAAS-capable although WAAS usage was disabled in the real-time data collection. Type B receiver is a high-quality L1/L2 receiver using a geodetic-grade antenna, used with WAAS enabled. The GPS/INS system was connected to the geodetic-grade antenna. The RF recording system was also connected to the automotive-grade GPS L1 antenna.
Figure 2. Vehicle test set-up.
The data was collected on a test route in Detroit, Michigan, that included durations of urban and deep urban canyon (40 miles per hour (mph) or less), freeway (55–70 mph), and suburban/local (30 mph) driving.
The RF data were subsequently replayed to GNSS receivers that were not a part of the field set-up. RF data was also replayed to receivers with forced sky-visibility obstructions and various WAAS settings. For limited sky-visibility tests, certain satellites were removed from each receiver’s view by receiver-specific configuration software. The satellite selection and restriction was done to mimic typical sky-view obstructions encountered in normal driving.
Type A receiver was chosen to illustrate the impact of visibility differences. A total of 13 satellites were visible in the entire data set (Figure 3). To create obstructed sky-view scenarios, two Type A receivers were configured to not use certain satellites in their position solutions. These configurations were:
Configuration 1 (C1): PRNs 7, 10, and 13 blocked
Configuration 2 (C2): PRNs 6, 16, 21, and 31 blocked
C1 mimics a vehicle/receiver with no visibility in the Northwestern part of the sky, whereas C2 mimics a receiver without visibility in the East/Northeastern part of the sky. Sky visibility restrictions do not vary with the heading changes of the vehicle. For example, for C1 receiver, Northwestern sky is always obstructed regardless of the vehicle orientation.
Figure 3. Sky view during the test.
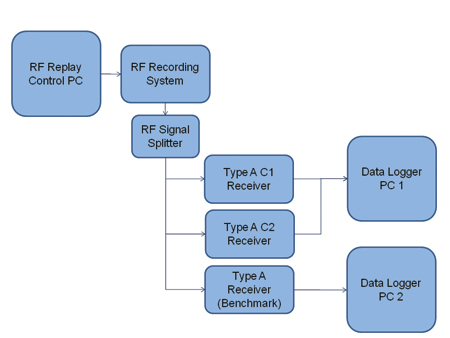
Figure 4 shows an example RF data replay setup. The record and replay system was controlled through a PC and the recorded data was also stored in the controller PC. The output RF signal was split into multiple outputs such that multiple receivers can be tested at the same time. For each replay of the RF data, a benchmark receiver was also used to verify that there is no run-to-run difference as a result of the RF replay.
Outputs from each GPS receiver from field and replay runs were logged to PCs using receiver specific binary formats. The recorded output from each receiver included its position, position error estimate, velocity, satellite-specific measurements and indicators such as pseudorange, carrier phase, and signals-to-noise ratio.
Figure 4. RF data replay set-up.
Data Processing and Analysis
The data was first decoded from the receiver-specific formats to a common format, then corrected for antenna offsets. To simplify the process, the reference system position solution was translated to the position of the test antenna using the known between-antenna distance and orientation of the vehicle as measured by the reference system. As a result, all the receivers and the reference system are reporting the location of the test antenna. Then, data fields such as position and velocity for each receiver were time-matched with the reference solutions, and the actual error was calculated.
For a limited dataset, additional measurement-level differential processing was done to show the difference between a DPOS and an RTK or a code-based differential relative position solution.
Figure 5 shows a plot of the 2D position error observed from each receiver during the test as a function of driving environment. Overall, Type B receiver shows better accuracy as expected from a dual frequency high quality receiver. However, it shows spikes of large error increases at times, mostly observed in the freeway scenario with large error excursions. With Type A receivers, relatively larger errors are observed with the limited-constellation receivers.
Figure 5. Position error (2D) of each receiver as a function of driving environment.
Figure 6 shows the number of satellites used by each receiver in the same environments as in Figure 5. Overall, Type A receiver tracks and uses on average 2–3 satellites more compared to the Type B receiver, likely due to its high-sensitivity capability. Type A C1 and C2 receivers also track and use 2–3 satellites fewer compared to the all-in-view Type A receiver.
Figure 6. GPS satellites used by receivers.
Freeway Data. The vehicle heading in this segment was predominantly north or northwest. The sky view can be considered a combination of urban and open sky conditions. As highlighted in Figure 6, all-in-view Type A receiver was able to use up to 11 GPS satellites with an average of around 9 satellites. Type A C1 and C2 receivers used, on average, about 3 satellites fewer than the all-in-view receiver. All three receivers show satellite count drops down to 4 at certain times in this segment.
The satellite count of the Type B receiver shows the limitations of not using the high-sensitive tracking capability. The satellite count shows frequent drops below 4 satellites and on occasion down to no satellites used.
Although the satellite count difference between all-in-view Type A and C1/C2 receivers was forced by means of receiver configuration, short-term sky visibility restrictions that resemble these conditions are in fact possible. Examples include a passenger car driving next to a semi truck or the side wall of the freeway in below-ground road sections.
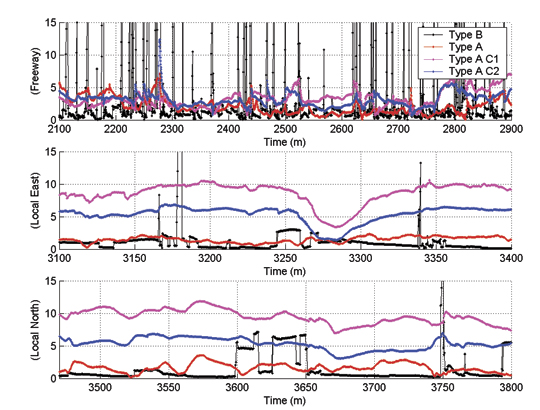
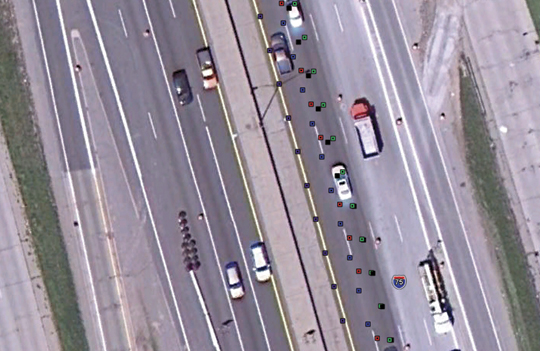
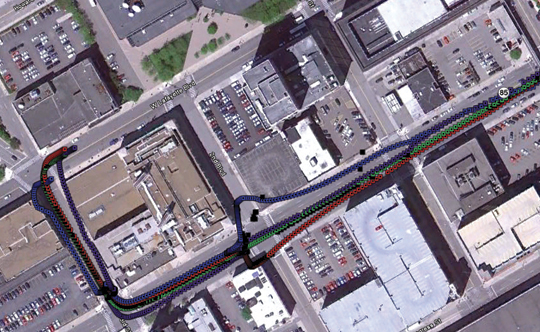
Figure 7 shows the position outputs of all four receivers on a satellite image of a short segment of the freeway. The true location (reference) is shown in green. Type A, Type B, Type A C1, and Type A C2 are shown in red, black, purple, and blue, respectively. These colors identify the four receiver types in all figures for the rest of this paper. While biases can be seen in the outputs of all four receivers with respect to the reference, the Type A C1 shows the largest offset with the magnitude of more than a lane width.
Figure 7. Freeway positioning accuracy.
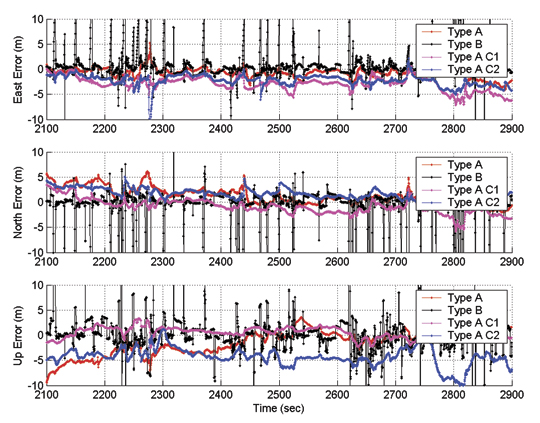
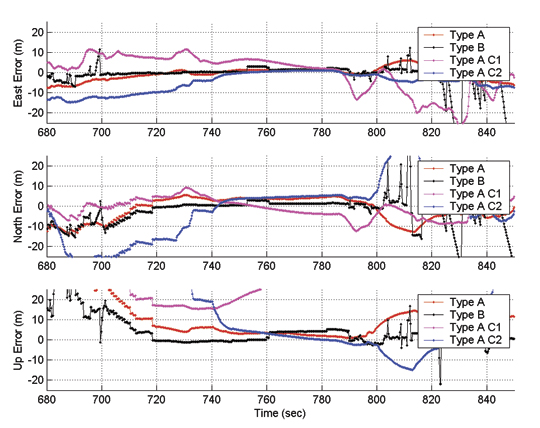
Figure 8 illustrates a time series of the positioning error components of all four receivers. It clearly shows error ramp-ups from the Type B receiver at frequent intervals. These coincide with the satellite count drops of Type B shown in Figure 6. No such error ramp-ups are observed for any of the Type A receivers, although relatively large biases of the order of few meters can be seen. As anticipated, larger errors are observed in the height direction.
Figure 8. Freeway positioning accuracy time series.
Local Road, Eastbound. This segment includes data gathered on an eastbound multi-lane local road with 40 mph posted speeds. As shown in Figure 6, a relatively larger number of satellites were continuously tracked in this segment as compared to the freeway. Therefore, this segment is considered to be an open-sky scenario with very limited number of obstructions. As shown in Figure 6, Type B receiver has used about 6 satellites on average, whereas the Type A has used around 3 more satellites most of the time. Type A C1 and C2 have also used around 3 satellites less compared to the all-in-view Type A receiver.
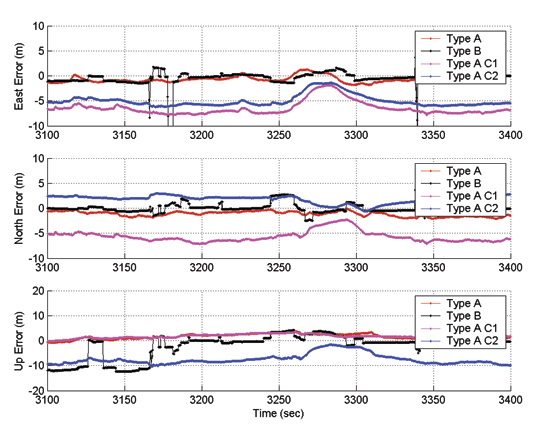
Figure 9 shows the vehicle position as reported by all three receivers and the reference system output for a short road segment in this drive. It clearly illustrates the lateral offsets of both C1 and C2 solutions. The C2 receiver (Blue) generated about a lane width offset towards north whereas the C1 receiver output is biased by around two lane widths to the south. Figure 10 presents a time series look of the positioning biases evident in Figure 9. It clearly shows large (more than 5 meter) biases in North and East position error components for C1 and C2 receivers.
Figure 9. Local (east) positioning accuracy.Figure 10. Local (east) positioning accuracy time series.
Local Road, Northbound. In roadway characteristics, this resembles Local Eastbound. Figure 6 shows the sky view remained almost unchanged for Type A receivers. For Type A C1, the count remained at 6 throughout. C1 and C2 receivers tracked 2–3 satellites fewer compared to all-in-view Type A. Interestingly, Type B experienced two dropouts of 4 or fewer satellites during the run. Figure 11 shows the position output of all receivers on a short road segment. As in the case of Local (East), significant biases can be readily observed in the output of C1 and C2.
Figure 11. Local (North) accuracy.
Figure 11. Local (North) accuracy.
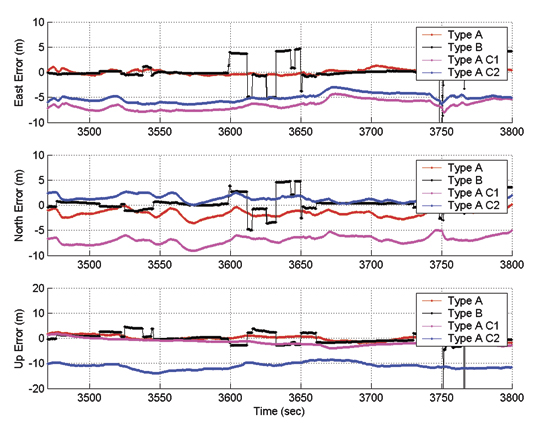
Figure 12 shows the time series view of the positioning error in this segment, confirming that the biases observed in Figure 11 are not short-term biases, but are in fact vehicle heading-dependent biases. The short-term biases seen in the Type B receiver output coincide with the change in the number of satellites used (shown in Figure 6). This illustrates the implications of different estimation methods used in the two receiver types. For instance, Type B receiver allows stepwise changes in its position estimate whereas Type A output tends to gradually converge to different states.
Figure 12. Local (North) positioning accuracy time series.
Urban Canyon. Results of the urban canyon segment of the drive are shown in Figures 13 and 14. A statistical analysis is not presented for this segment, as receiver type and configuration dependent biases and errors are difficult to isolate from the errors that are the result of multipath and measurement noise. In Figure 14, much larger biases in the order of 10 meters or more can be seen for all three Type A receivers. In comparison, Type B receiver tends to output a relatively accurate position solution whenever it has sufficient satellites visible. In the case of less than optimal satellites availability, Type B receivers tend to show rapidly degrading positioning accuracy, which may be reliably detected using its quality indicators.
Figure 13. Urban canyon accuracy.
Figure 14. Urban canyon positioning accuracy time series.
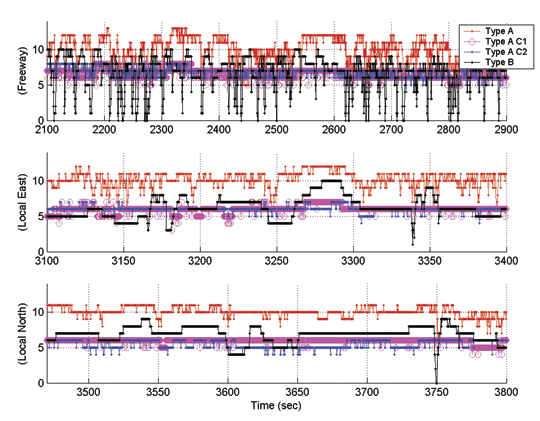
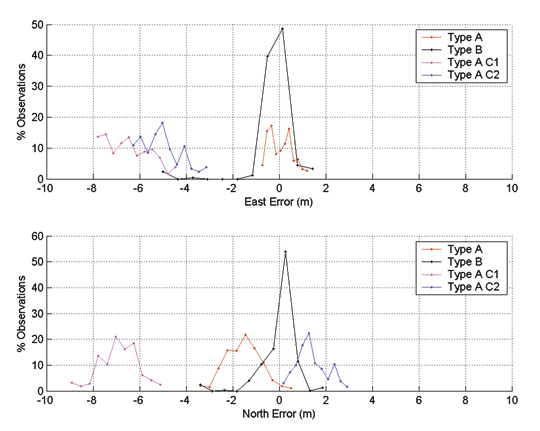
Position Error Distributions
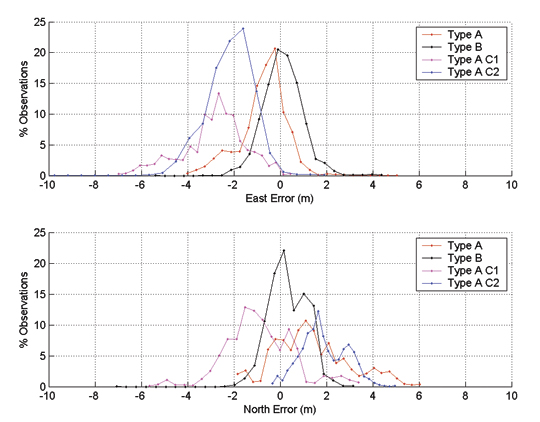
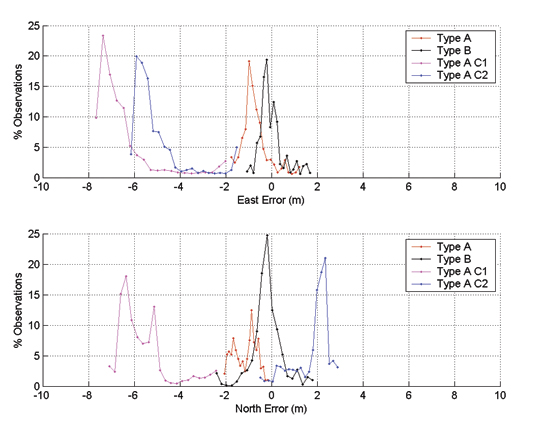
Position error probability distribution functions were generated for the first three road segments using the time series data above. Figures 15-17 show these functions for Freeway, Local (East), and Local (North) segments, respectively. They lead to these general conclusions:
Based on the mean and the spread of the distributions, Type B receiver has consistently provided the most unbiased and accurate positioning performance out of all the receivers considered. Overall, the output appears to be unbiased, as should be the case for a high quality dual frequency receiver with WAAS capability.
Type A all-in-view receiver shows the next best overall accuracy statistics with some biases in certain cases. These biases can be time-of-day-dependent and may differ for different times of the day or if observed over a longer time.
Type A C1 and C2 receivers show very significant vehicle-heading-dependent biases/errors. This is with very limited sky view obstructions (that is, C1 only restricts less than 1/8 of the entire sky view whereas C2 covers around 1/4) and with the same type of the receiver.
Although enabling WAAS should theoretically help minimize the biases observed in these tests, the availability (open line-of-sight) of WAAS satellites for automotive applications in these environments must be taken into consideration for WAAS accuracy benefits to be applicable. For these datasets, WAAS signals availabilities for a Type B receiver were 58 percent of total driving time in urban canyon, 60 percent in the freeway scenario, 95 percent and 99 percent in the local road scenarios.
Figure 15. Freeway position error distribution.Figure 16. Local road (east) position error distribution.Figure 17. Local road (north) position error distribution.
Velocity Domain Performance. For each test segment, velocity estimates from each receiver were logged at the default data rate of 4 Hz. For analysis purposes, North and East velocity readings from each receiver were converted to 2D speed estimates. These were used with reference system speed estimates to generate 2D speed error statistics (Table 1).
Based on Table 1, no significant biases or errors were observed from any particular receiver or configuration. The only exception was the increased errors in the Urban Canyon segment, particular for C1 and C2. This is expected .to be a result of limited satellite availability in a challenging environment with additional forced satellite eliminations.
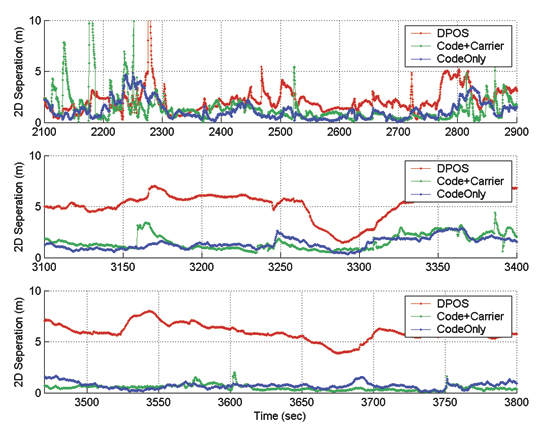
Virtual Two-Vehicle Analysis. Assume that Type A and Type A C1 receivers were located in two vehicles. Ideally, both receivers should report the same location, as they were both connected to the same antenna on a single vehicle, creating a zero-baseline scenario. However, as shown in the previous section, a meter-level separation was observed between the two solutions.
In this virtual two-vehicle scenario, relative position of one receiver (Type A) with respect to the other (Type A C2) was estimated by three methods, using GNSS data processing software in post-mission. The methods were:
Differenced Positions (DPOS). Latitude and longitude reported by each vehicle were time-matched; distance between the two points was calculated.
Code and Carrier. Single frequency (L1) GPS RTK positioning with float ambiguity estimation.
Code Only. GPS code measurements generated a relative position solution.
The 2D receiver separation results of this processing are shown in Figure 19 as three subplots for freeway (top), local/east (middle), and local/north (bottom) scenarios. The 2D separation results for local scenarios show clear performance benefits for the GNSS measurements-based methods. In both east and north local scenarios, around a 5-meter bias is observed in the DPOS solution whereas this is reduced to around a meter in both code-only and code and carrier methods. The freeway scenario shows relatively smaller difference potentially due to measurement noise, multipath, and frequent interruption of sky view. Table 2 shows mean values of these results.
Figure 18. Position separation for processing methods.Table 2. Mean Accuracy (meters) using processing methods.
Discussion
OTA transfer of certain GNSS measurement data elements appears to be a critical requirement for reliable lane-level positioning capability. However, the method must be capable of supporting a certain level of performance even in challenging environments for GNSS. The solution for such challenging environments is likely to be GNSS integration methods with vehicle-based sensors (that is, GNSS/INS) for the foreseeable future.
Given these facts, a reliable and accurate V2X relative position method will require the OTA transfer of a combination of critical vehicle states which include the vehicle location, a confidence measure, and certain GNSS measurement data elements. With its ability to support all of these needs, the SAE J2735 provides a basic framework for further refinement of relative positioning technologies for automotive applications.
A reliable position confidence measure broadcast over-the-air is also a critical need, particularly if GNSS measurement data is not broadcasted on a regular basis. This also holds true for conditions under which a vehicle may be operating in a GNSS and vehicle sensor integrated mode or with less than optimal number of satellites in view. However, estimating such a parameter that can be trusted with high degree of confidence can be challenging given the presence of various biases that can depend on the environment, vehicle, GNSS receiver, and sensors and methods used. Potential examples are time-of-day, vehicle heading, vehicle speed, GNSS receiver/sensor type, model, and configuration. However, developing a parameter similar to the RTCA Horizontal Uncertainty Level (HUL) for automotive applications is an important consideration.
While there are many other candidate receivers to be considered for a study of this nature, only two receiver types were used in this analysis. Analysis of more receiver types can be beneficial to identify the desired characteristics for a certain applications. A consideration could be achieving a desirable balance between accuracy and the sensitivity of the GNSS receivers, as increased sensitivity often produces higher solution availability at the cost of degrading accuracy.
Another area to investigate in related work is the benefits of using WAAS under the test conditions given in this paper. The general expectation is to see less bias in the position solution with WAAS as the ranging errors are likely to be smaller as a result of WAAS corrections. However, for automotive applications in particular, availability of WAAS signals to land vehicles need to be investigated.
CHAMINDA BASNYAKE is a senior research engineer at General Motors Global Research and Development and GNSS technology expert for GM OnStar. He leads GNSS-based vehicle navigation technology R&D efforts at GM and holds a Ph.D. in geomatics engineering from the University of Calgary.
An Assisted-GNSS Solution Uses the EGNOS Data Access Service
By Kevin Sheridan, Tomas Dyjas, Cyril Botteron, Jérôme Leclère, Fabrizio Dominici, and Gianluca Marucco
For use in billing drivers in road-user charging schemes, onboard units employing GNSS must meet stringent reliability and availability requirements, and at the same time, be based on low-cost equipment systems. The SIGNATURE unit includes an assistance service which provides ephemeris data and corrections from EDAS, optimized for user location.
As roads become more congested, governments and regional authorities seek better ways to manage their existing networks. Road-user charging (RUC) is increasingly promoted to tackle the congestion challenge: charging drivers a fee, perhaps on a monthly billing basis, derived from the distance their vehicles have traveled, time of travel, and whether congested roads were used.
Recording trip information with a GNSS receiver in an onboard unit (OBU) provides a convenient and flexible means to support automated fee collection. For GNSS positioning to be used as the basis for billing drivers, however, it must meet stringent reliability and availability requirements, and at the same time be based on low-cost equipment.
We have developed a prototype to provide both the positioning availability and integrity required for this application. The Simple GNSS Assisted and Trusted Receiver (SIGNATURE) includes an assistance service that provides ephemeris data and corrections from the European Geostationary Navigation Overlay Service (EGNOS) Data Access Service (EDAS), optimized for the user location. Assistance messages are sent to OBUs that can either host an experimental receiver or a commercial-off-the-shelf (COTS) receiver. Data from the receiver is processed with application-specific navigation algorithms on the OBU that aim to improve the integrity of the position solution relative to standard solutions.
Field trials have assessed the contribution that assistance can make to positioning performance, and illustrate options for enhancing standard assistance solutions. Enhancements to assistance encompass modifications to the message content and alternative means of communications, showing the benefits and feasibility of a broadcast service. The impact of including EGNOS corrections through a broadcast assistance service in urban areas is also under investigation.
GNSS Road-User Charging
RUC has the potential to reduce congestion, lower vehicle emissions, and generate revenue streams for infrastructure improvement. It can ensure that revenues are based on actual road usage, creating a financial incentive for changing driving behavior. This might include lower overall use of private cars and, in particular, reducing peak-time travel levels in urban areas by effectively spreading out the morning and evening rush hour. RUC can also encourage commuters to use alternative forms of public transport.
To automate the process of collecting charges, electronic fee-collection (EFC) systems have been developed based largely on dedicated short-range communications (DSRC). In a DSRC solution, a simple tag on the vehicle receives a signal when it passes a roadside beacon and a charge is computed accordingly. Cameras with automatic number-plate recognition (ANPR) technology are also widely used, mainly as an enforcement tool.
Both technologies rely on fixed roadside infrastructure. As charging schemes to date have focused on specific areas (individual cities) or road infrastructure (major motorways, tunnels, and bridges) this type of technology provides an adequate solution.
To meet future policy goals, however, this is not feasible. More extensive charging schemes covering greater areas, more road types, more classes of vehicle, and which will vary charges depending on location and time of day require a far more flexible solution. Flexible schemes require the positioning element to be onboard the vehicle. GNSS-based devices, possibly augmented with other sensors, have been identified as the best option to achieve this.
Using GNSS, the OBU tracks the location of the vehicle, and this is matched against the road network to calculate a charge. A GNSS solution can support many different charging strategies including time distance and place (TDP) based charging for road sections, geographic areas, and cordon schemes. While GNSS offers great potential, several operational and performance limitations have prevented more widespread adoption. Operationally, OBUs are relatively expensive, fraud prevention is potentially complex, and charging schemes must also accommodate infrequent users. GNSS performance is limited in terms of the ability to provide sufficiently accurate positions with high availability and integrity in all operating conditions.
To be fully flexible and to target congested areas, OBUs must work in all environments including urban areas. Urban-canyon problems, with satellite signals blocked and reflected, are well documented. In some cases, not enough signals are available to determine a position, and when there are enough satellites, the ranges will be prone to errors and the geometry is likely to be poor. Signals are more likely to be available in the longitudinal direction of the street, but with few or no satellites on either side of the vehicle. Signal blockage is a particular problem when the GNSS receiver is started up, and it attempts to decode satellite ephemeris data. This requires around 30 seconds of uninterrupted tracking with a relatively strong signal for each satellite, and in an obstructed urban environment it may take many minutes to determine the first receiver position.
Charging schemes typically aim to charge for at least 99 percent of road usage. If a typical journey length is 30 minutes, this means that only 18 seconds with no usable position solution can be tolerated and hence time to first fix (TTFF) must be below 18 seconds, and ideally much lower.
When positions can be determined, they must be sufficiently accurate to identify the correct road segment that the vehicle was on, and they must be reliable. Reliability, or integrity, becomes critical if road users are to be charged on the basis of GNSS-derived positions. Users must have confidence that they are being charged correctly for schemes to be effective and to gain public acceptance.
Whilst GNSS-based solutions are entering the market, for example in Germany and Slovakia for heavy goods vehicles, barriers to wider adoption remain. Many countries are considering GNSS-based road pricing, and they all face similar challenges in ensuring the accuracy, integrity, and availability of a GNSS-based solution for nationwide deployment.
SIGNATURE Solution
The principal objective of the SIGNATURE project is to prototype a GNSS-based solution for flexible road-user charging that can provide the required high integrity and high availability in a cost-effective and scalable manner.
This robust, high-availability, high-integrity solution is delivered firstly through providing reliable assistance (A-GNSS) data from EDAS to optimize receiver acquisition and tracking capabilities and reduce TTFF, and secondly through implementation of embedded GNSS reliability algorithms into an OBU, providing assurance of positioning information (Figure 1, at top).
These features are intended to make a positive contribution in terms of the key RUC performance criteria, as defined by the GNSS Metering Association for Road User Charging:
Accuracy: right cost per trip
Integrity: probability and amount of overcharging
Availability: amount of charged usage.
Assistance Server. An assistance service supplying suitably equipped OBUs is one means to maintain rapid TTFF and meet the requirement for high positioning availability. The most significant contribution assistance can make to TTFF is to provide the
ephemeris data, which takes around 30 seconds to download from a satellite signal. Assistance data can also reduce the frequency search space when a receiver is acquiring signals, as the expected Doppler frequency can be computed from the approximate receiver and satellite positions.
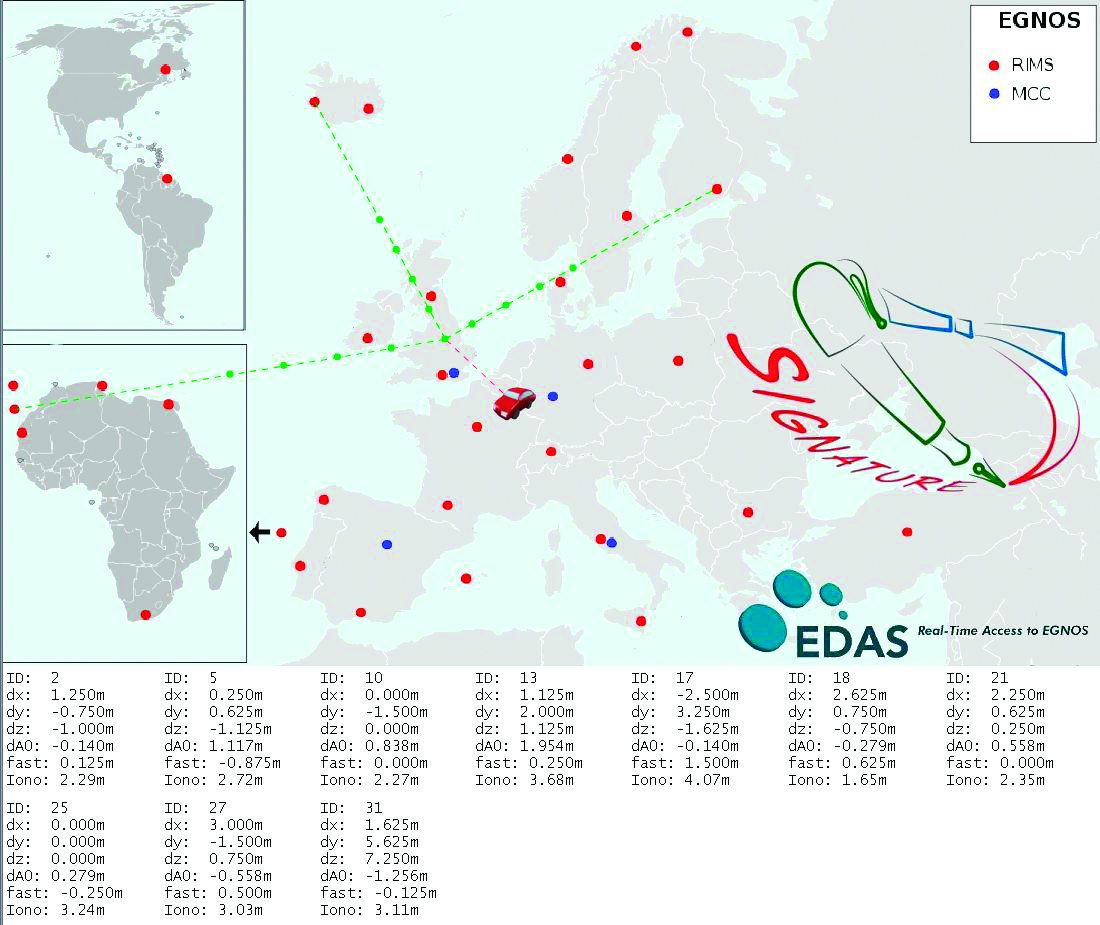
The assistance server in SIGNATURE is based on EDAS, currently available as a beta version. EDAS allows a user to plug into EGNOS to receive the data collected by all the current EGNOS Ranging and Integrity Monitoring Stations (RIMS). This makes it possible to access EGNOS data when there is no clear sight to the EGNOS geostationary satellites, which can often be the case in urban areas, particularly at higher latitudes. As well as supplying EGNOS messages, EDAS also provides GPS observation and navigation (broadcast ephemeris) data, the key component as far as an assistance service is concerned. By recording the ephemeris data received at the extremities of the monitoring network, it is possible to ensure that the current ephemeris for any GPS satellite in view to users over Europe is available and can be supplied in an assistance message. Other data streams provided by EDAS can also be used to enhance the assistance solution.
The main enhancement tested in SIGNATURE was the use of EGNOS corrections within the assistance message. EGNOS today consists of a space segment of three geostationary satellites broadcasting correction and integrity information in the L1 band. Three sets of corrections are broadcast to users:
Fast corrections: used to compensate short-term disturbances in GPS signals, generally attributable to satellite clocks;
Long-term corrections: used to compensate for the longer-term drift in satellite clocks and the errors in the broadcast satellite orbits
Ionospheric corrections: broadcast as a grid of vertical delays (GIVD) from which a user receiver can determine a slant correction to be applied on each range measurement to compensate for the delay experienced by the signal as it passes through the ionosphere.
Fast and long-term corrections are added to the ephemeris data in the assistance message. Rather than relaying the GIVD data to the OBU and letting the receiver reconstruct the ionospheric grid and calculate slant corrections, this is done within the assistance server. A slant correction is provided for each satellite that will be in view at the user location. This approach is valid provided the OBU updates the corrections regularly enough to take account of the changing satellite elevations and ionospheric conditions. It provides a significant saving in terms of processing and memory consumption at the OBU, while still delivering the accuracy benefit of the EGNOS ionospheric data. To correct for the tropospheric delay, a zenith value (ZTD) determined from the RTCA model is also included in the assistance message. Mapping this zenith value to a slant correction to be applied to satellite ranges is a straightforward process easily accommodated on the OBU.
Figure 2 shows how data from EGNOS RIMS is collected at the assistance server at NSL in Nottingham, UK, and then used to generate messages. In this case, the assistance data was provided for trials conducted in Brussels. The figures at the bottom of the plot are the EGNOS correction values provided for all 10 GPS satellite in the positioning solution.
Figure 2. Schematic of assistance solution.
Further enhancements are also possible using the GPS observation data provided through EDAS. Firstly, for areas close to RIMS, a local differential solution can be applied using standard DGPS techniques to provide pseudorange corrections rather than wide-area EGNOS corrections. This has the potential to give greater accuracy for certain areas and is under investigation. By combining EDAS data sources, a GNSS performance monitoring and prediction service has also been created (Figure 3). This provides an assessment of GPS and GPS+EGNOS positioning performance (accuracy, availability of corrections, integrity) at known reference stations as well as monitoring the availability of EDAS data from its central server. Monitoring of this kind can be used as a further tool to identify system-level problems that might significantly degrade user positioning solution, perhaps to a level at which charges could not confidently be applied. It can also aid the enforcement process, as a diagnostic tool to identify if missing or misleading data from an OBU could be due to a system-wide fault or to a more localized source.
Figure 3. GNSS performance monitoring using EDAS.
This approach relies on the approximate user position being known at the assistance server. To maintain the validity of the corrections, it would also require a receiver to update its assistance data at a much high rate than would usually be the case. For a large-scale operation this would be unfeasibly expensive using cellular communications (GSM/GPRS), however it would be possible using a broadcast assistance approach. Using a radio data service (RDS) broadcast for example, ephemeris data and EGNOS corrections could be provided on a continuous basis. RDS is an auxiliary signal to the FM radio broadcast system and is used routinely for supplying travel information to in-car navigation systems. As data is broadcast from known locations and over a definable coverage area, messages can be generated that are applicable for all users receiving data from a given transmitter. A drawback of RDS is that it has a relatively low bandwidth, and it takes approximately 3.5 seconds to broadcast an ephemeris message for a single satellite. A further argument against RDS as a long-term solution is that analog radio signals are progressively being phased out in favour of digital alternatives. With the far greater bandwidth of digital audio bßroadcasting (DAB), ephemeris data for 12 satellites could be broadcast in less than 1 second.
We are evaluating alternative message content and transmission options to determine if real benefits can be gained by providing additional content, other than the ephemerides, in the assistance message.
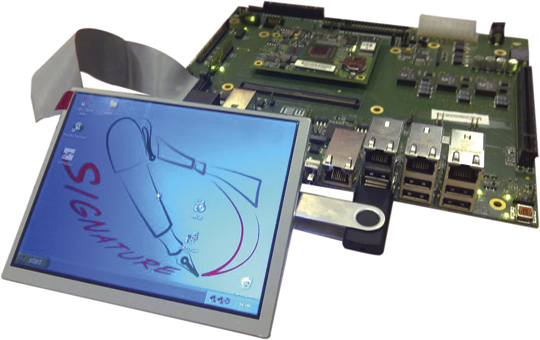
Onboard Unit. The SIGNATURE OBU (Figure 4) is based on a single-board computer (SBC) offering a high degree of flexibility. Developed by ISMB, it can host alternative receivers and positioning algorithms and manipulate different assistance data with a high degree of configurability. It is a powerful platform for developing and assessing OBU devices and their component parts, particularly as it allows lots of useful diagnostic data to be logged.
Figure 4. SIGNATURE Prototype Onboard Unit (OBU).
The OBU hosts a bespoke receiver which exploits the continuous availability of assistance data available through a high-speed data packet access connection and does not attempt to decode navigation data directly from satellite signals. This allows its design to focus on rapid signal acquisition with high sensitivity and to achieve a rapid TTFF even in areas where conventional receivers struggle. The SIGNATURE prototype has been designed using the well known SAT-SURF & SAT-SURFER platform.
The receiver, developed by the EPFL, implements massive parallelization by making use of the fast Fourier transform, leading to a processing power equivalent to approximately 650,000 equivalent correlators. The minimum sensitivity in acquisition is –145 dBm, obtained using coherent and non-coherent integrations. Thanks to the massive parallelization and the assistance, TTFF at –145 dBm is still below 3 seconds.
Positioning Algorithms. The OBU hosts positioning algorithms designed by NSL to provide high accuracy, availability, an
d integrity through exclusion of outlying measurements and provision of quality metrics (horizontal protection levels or HPLs). Numerous positioning algorithms and outlier detection strategies are being investigated. These include consistency checks applied to raw measurements and computed positions and receiver autonomous integrity monitoring (RAIM). EGNOS corrections are applied to improve accuracy and integrity indicators (user differential range error indices) are used as coarse fault-detection barrier. Consistency checks on measurements include differencing pseudoranges between epochs and checking that this rate is below a defined threshold. A RAIM algorithm is then applied to detect and exclude outliers before measurements enter the main navigation filter. Positions and velocities determined by the filter are then checked again as a further fault barrier. Checks at this stage identify if speeds are within expected ranges for the application and whether height changes are reasonable, for example.
The RAIM algorithm is based on the maximum normed residual method. For the detection procedure, the test statistic is calculated based on weighted sum of the squares of the residuals. This test statistic undergoes a globaltest (chi-square distribution), and is tested against thresholds that are computed based on the probability of false alarm (Pfa) and degrees of freedom (number of measurements minus number of unknowns). The exclusion procedure is based on an outlier detection technique also known as data-snooping, which is based on normed residuals and applied within the range domain. This technique uses measures of internal and external reliability, where the internal reliability gives estimates of how reliable the outlier detection procedure is, while the external reliability gives estimations of the influence of an outlier.
In the final step of the exclusion procedure, the maximum normed residual is tested against a critical value based on the normal inverse cumulative distribution, which in turn depends on the Pfa, and a decision is made on whether or not to exclude measurements. Having performed fault detection and fault exclusion until no further outliers are found, an HPL is calculated. This is the maximum horizontal position error that is guaranteed by the algorithm not to be exceeded, in accordance with the required probabilities of missed detection and false alarm. HPL is a function of visible satellites, expected error characteristics, and user geometry. Measurements which have been screened using the RAIM fault detection and exclusion are then processed in a Kalman filter.
Within the project, many alternative algorithms and configurations are being tested. As well as using RAIM in a snapshot mode to screen measurements entering the Kalman filter, fault detection can also take place within the innovation sequence of the filter itself. Weighting strategies that consider signal-to-noise ratios (SNR) as well as satellite elevations are also being used. This combined weighting is useful in reducing the impact of measurements affected by multipath in urban areas where simple elevation dependent models are often not applicable. The ultimate aim is to produce a robust GNSS positioning solution optimized for RUC in urban areas that balances the requirements of providing high availability with high integrity.
Test Methodology
The SIGNATURE end-to-end solution was tested in a series of field trials in the UK and Italy between April and July 2010. Trials took place in a range of operating conditions from rural areas with open skies to dense urban environments. In all trials, assistance data was provided from the service center in Nottingham, with messages tailored for the designated test area. The OBU recorded real-time position solutions as well as logging all raw measurements. Journey records can be sent back to the service center over a GPRS connection or can be downloaded back at the office. This allowed alternative solutions to be applied to the original datasets in post processing.
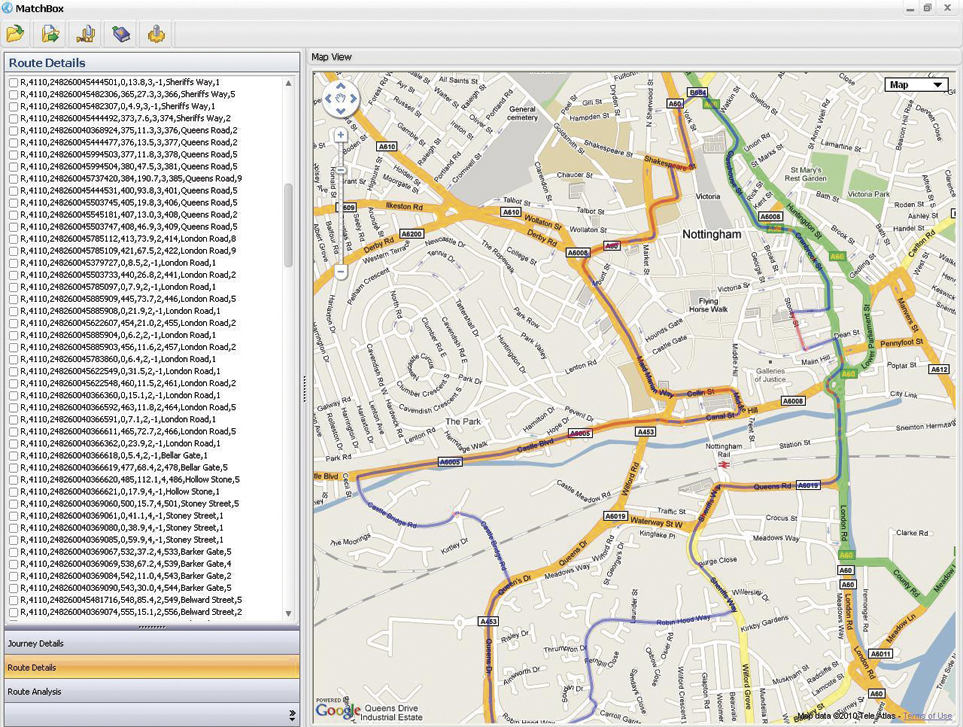
The position solutions were assessed through comparisons with high-accuracy GNSS reference solutions provided by additional onboard equipment and through processing with a map matcher (NSL’s Matchbox). Each journey record from a trial was compared against the known reference journey record to determine charging availability, accuracy, and integrity.
Using this approach, it is possible to assess whether improvements in the OBU position output are significant in terms of matching the vehicle location correctly to more road segments and with higher confidence. From direct comparisons between OBU positions and a high-accuracy reference solution alone, it is not possible to determine the significance of any changes in the OBU output in terms of final charging performance. Extensive trials of GNSS OBUs in London, for example, did not observe a relationship between location error (from OBUs) and performance at road segment level (map-matching) as map-matching can compensate for many errors. A strong relationship was observed between data availability and performance, though. Ultimately it is important to consider how successfully vehicle position can be related to charging objects, be they road segments, cordons or virtual toll-gates.
The objectives of the field tests were to:
Demonstrate that all elements of the end-to-end solution work as expected.
Assess the impact of assistance on TTFF.
Evaluate benefits of EGNOS data.
Investigate alternative positioning algorithms to optimize availability and integrity.
Demonstrate the feasibility of broadcast assistance using RDS.
Results
Field trials around Nottingham and Torino tested all elements of the solution. The tests confirmed the successful generation, transmission and use of assistance data, including EGNOS corrections. Position solutions determined onboard were transferred back to the service centre and processed with a map matcher. Figure 5 shows an example from a test in Nottingham city center, correctly identifying all the road segments travelled on.
Figure 5.Journey record view from Nottingham test. (Click to enlarge.)
Assess Impact of Assistance on TTFF. To examine the benefits of assistance, a series of trials were conducted to compare the TTFF of a consumer-grade receiver typically used in road applications against the performance of the SIGNATURE receiver that is assisted in all cases. They assessed TTFF for the COTS receiver in the following modes:
Hot Start: receiver has up-to-date almanac and ephemeris information so only needs to obtain timing/ranging information from each satellite to return its position fix;
Warm Start: receiver has the almanac information stored in its memory, but it does not have any ephemeris information. It also has approximate time and position knowledge. It can use this information to search for satellites but will then need to demodulate the ephemeris data from acquired signals;
Assisted: ephemeris provided over OMA-SUPL standard channel.
Table 1 shows the results from testing the receivers in open sky and urban conditions, specifically chosen to assess an extreme acquisition environment. In these tests when no valid ephemeris is available on a receiver at start-up, it takes an average of 28 seconds to determine a first position fix in open sky conditions. This increase to an average of more than 2 minutes in the worst-case urban environment as the receiver struggles to decode the navigation message on weak, noisy, and intermittent signals. With assistance, the SIGNATURE receiver maintains a rapid TTFF, outperforming the COTS receiver. The slower TTFF in the assisted COTS case may be partly due to the OMA-SUPL standard procedure
which is based on a more complex than the simple data transfer used in the SIGNATURE procedure. The COTS receiver is also decoding navigation subframes to determine signal transmission time. This can take up to 6 seconds depending on the point in the transmission cycle that acquisition begins.
Tests have also been carried out using a signal generator to control the strength of the received signal to assess acquisition and tracking sensitivity. At –145 dBm, the SIGNATURE receiver takes an average of 1.1 seconds to acquire 4 satellites and determine a first fix, and 5.1 seconds to acquire 12 satellites.
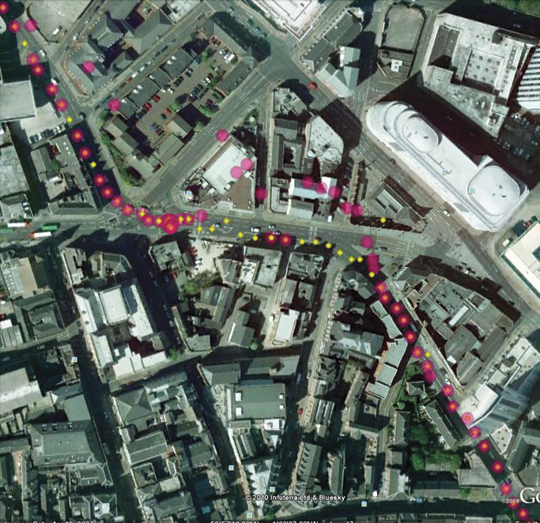
Positioning Algorithms. A variety of configurations have been investigated in the positioning algorithms, including applying outlier-detection routines at different stages of the solution and comparing snapshot and filtered approaches. Figure 6 shows a simple example of how the RAIM algorithm has been effective in detecting and excluding outlying measurements contaminated by multipath. By removing these meaurements and re-computing the OBU location, better position estimates are obtained.
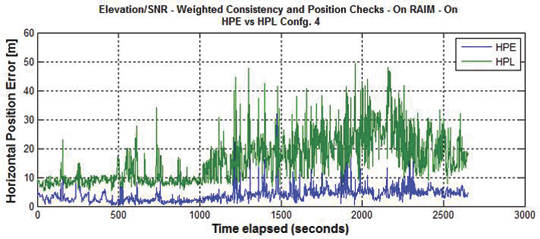
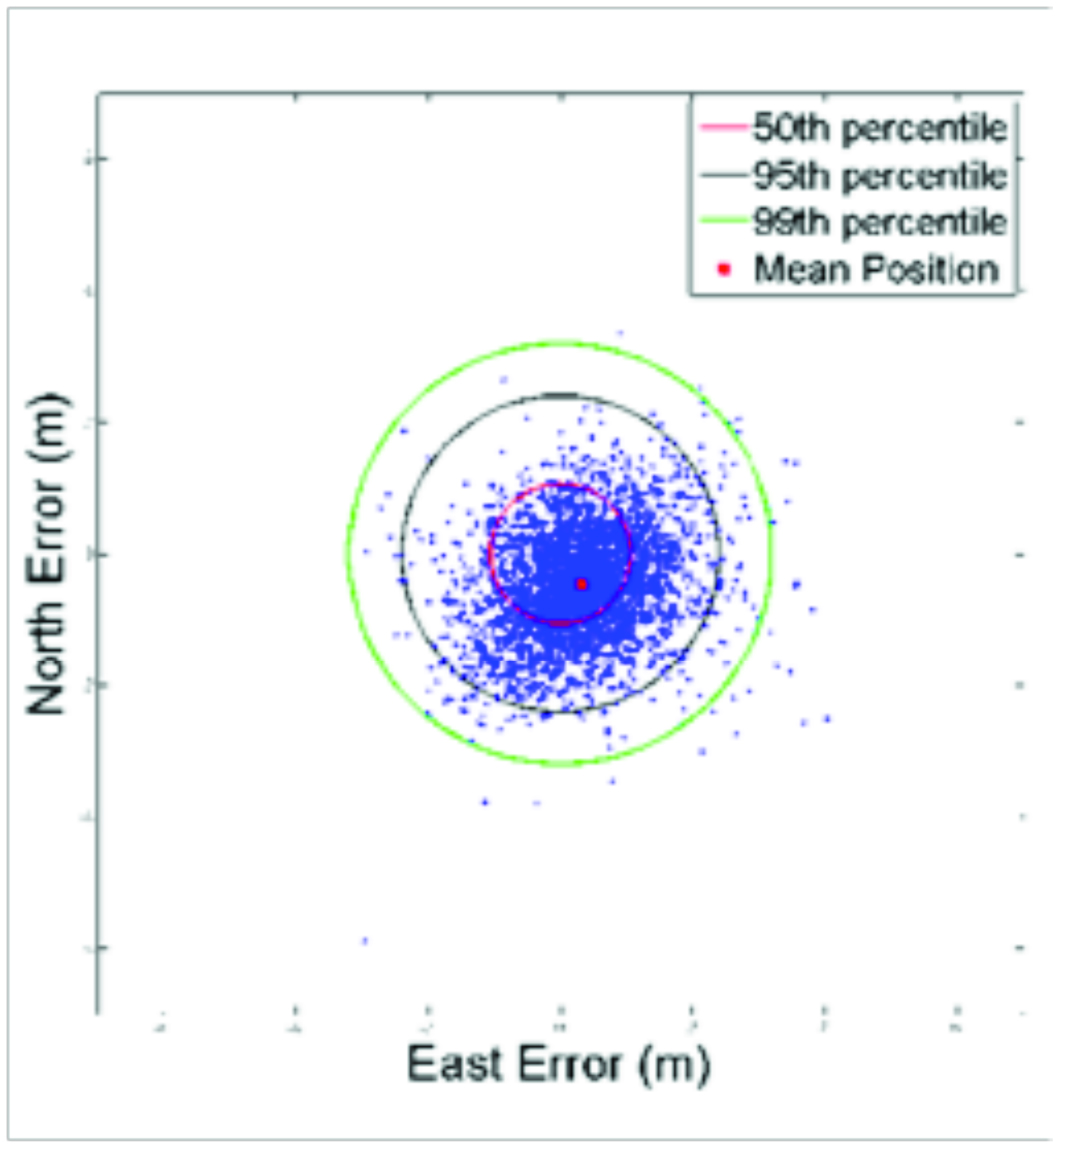
Figure 7 shows the accuracy and integrity of the SIGNATURE solution assessed using a high-grade GNSS/INS reference in Nottingham city center. In this case, the horizontal accuracy is 4.4 meters (95 percent), and the computed protection level is shown to bound the actual position error with the required confidence.
Figure 7. Position error and protection level, Nottingham city center.
In rural, semi-urban, and urban (Nottingham) conditions, a positioning solution has been demonstrated that supports all charging accuracy, integrity, and availability requirements.
Further tests were also conducted in the center of London, in a worst-case obstruction environment. In this area the current solution falls just short of the requirements defined for this project. In such cases, better performance could be obtained using a hybrid solution making use of additional sensor inputs, but this will increase equipment costs and potentially installation costs, too. A more practical approach may be to simplify charging schemes in the densest urban environments, using zones and cordons rather than using more detailed approaches that require a continuous high-performance positioning solution to be maintained in all conditions.
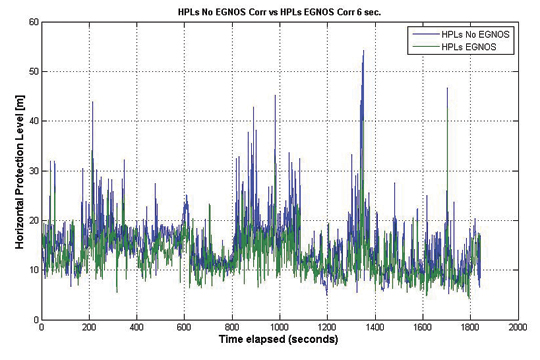
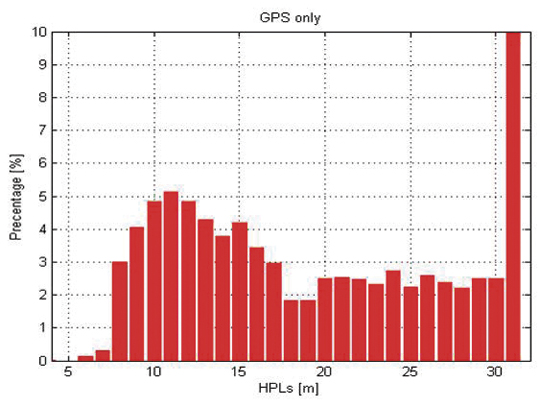
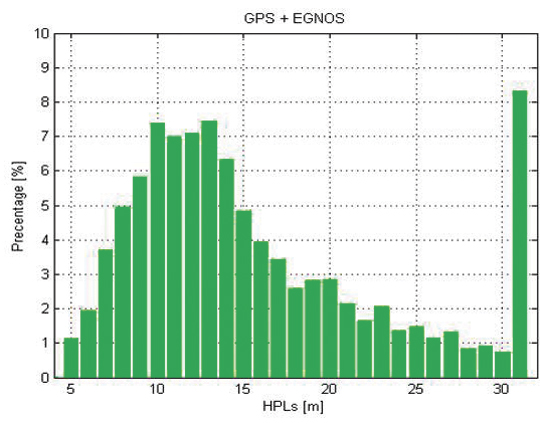
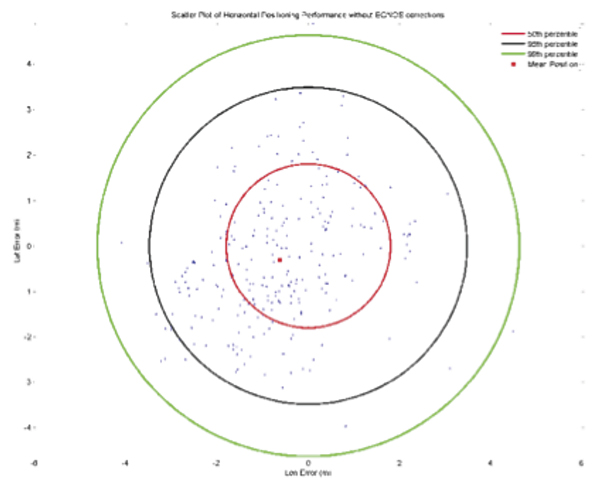
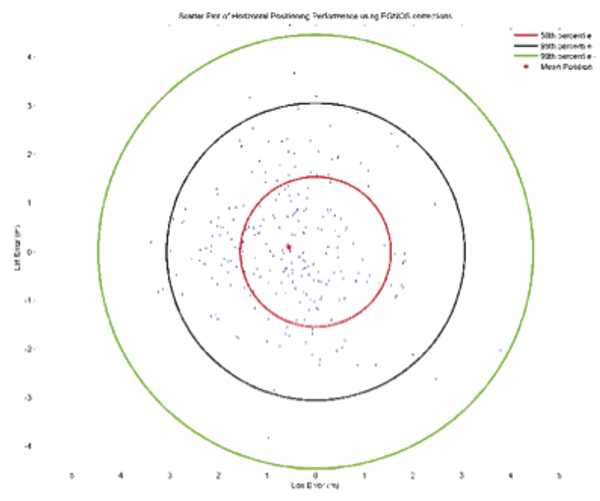
Benefits of EGNOS Data. The SIGNATURE solution has the ability to provide EGNOS data to positioning algorithms on the OBU and to vary the rate at which this information is updated and used. Field tests have assessed the potential benefits of this source of data in various environments, starting from the case in which EGNOS messages are continuously available for the positioning solution and then investigating how any beneficial effects lessen as the data is provided less frequently. The greatest benefit from EGNOS was derived by applying corrections prior to performing the RAIM FDE algorithm. This led to more consistent measurements and produced lower HPL values. Figure 8 shows a comparison for a Nottingham test in which a GPS-only solution is compared against an EGNOS solution in which a full set of corrections is provided.
Figure 8. HPL GPS vs GPS + EGNOS.
This reduction in HPL values through the application of EGNOS corrections is clearer when the distribution of HPL values falling into discrete bins is assessed (Figures 9 and 10). Similar levels of relative improvement have been found through using this approach in all test datasets. The significance of these improvements can only be judged against the detailed specifications of a particular charging scheme.
Figure 9. HPL distribution GPS.Figure 10. HPL distribution GPS + EGNOS.
Conclusions
Using an assistance service based on EDAS, it is possible to achieve a TTFF of a few seconds, which supports the high availability requirements of RUC. Field trials showed that providing EGNOS information over the assistance data link had an integrity benefit. Applying corrections prior to a RAIM algorithm leads to more consistent measurements and reduces HPLs. Robust positioning solutions have been developed and implemented on the OBU, and a test methodology has been put in place to assess the impact on charging availability, accuracy, and integrity. Results indicate that GNSS-based road charging offers the performance and flexibility to meet current and future requirements, provided availability and integrity issues are properly taken into account.
Acknowledgments
The SIGNATURE project has received funding from the European Community’s Framework Programme (FP7/2007-2013) under Grant Agreement No. 228237 and is supervised the European GNSS Supervisory Authority (GSA). Full details of the project can be found at www.gnsssignature.org. Any views expressed here are entirely those of the authors and do not necessarily represent the EC.
Manufacturers
The SIGNATURE receiver is based on the Terasic Altera DE3 System with a high-density Stratix III FPGA (EP3S260), and on the Rakon GRM8652 high-performance front end.
Kevin Sheridan is technical manager at Nottingham Scientific Limited (NSL),where he works on development of robust GNSS positioning solutions for urban applications. He has a Ph.D. from University College London.
Tomas Dyjas is a navigation engineer at NSL where he develops and tests positioning algorithms for an experimental OBU for road-user-charging (RUC) and evaluating novel integrity approaches for aviation.
Cyril Botteron manages research and project activities of the GNSS and UWB research subgroups at the Ecole Polytechnique Fédérale of Lausanne (EPFL) in Switzerland. He received a Ph.D. from the University of Calgary.
Jérôme Leclère is a Ph.D. student at EPFL. His research focus is on acquisition and high-sensitivity GNSS receivers.
Fabrizio Dominici is the head of technologies for Galileo/EGNOS applications and embedded systems at Istituto Superiore Mario Boella (ISMB). He received a master’s degree in communications engineering from Politecnico di Torino.
Gianluca Marucco received a master’s degree in electronics engineering from Politecnico di Torino. His research interests include multipath mitigation techniques for future Galileo receivers and real-time performance monitoring services for EGNOS.
The team installs a HARNS in the southern province of Basra. Since 2005, Iraqi engineers have attempted to recover HARNS, but many were destroyed by locals who thought they indicated buried treasure.
As a geodetic surveyor, I served in the U.S Army for 10 years. During that time, my team and I developed a nationwide GPS infrastructure system called the Iraqi Geospatial Reference System (IGRS). We installed Continuously Operating Reference Stations (CORS) and High Accuracy Reference Network Stations (HARNS), the first Iraqi owned and maintained system of its type.
As a native Arabic speaker, my role was to train the Iraqi engineers to install additional CORS, as well as update and maintain the IGRS as a part of the International GNSS Service (IGS) network to sustain the accuracy of engineering and mapping projects. The IGRS was critical to other major infrastructure projects in the effort of rebuilding the battered nation, such as telecommunications, public works, and natural resource management to name a few.
Some of the CORS we installed have Virtual Reference System (VRS) capability, a technology newly developed to establish real-time corrections in the field by using CORS as a base station for real-time kinematic (RTK) data collection.
Key coordinators for the installation included Wisam Al-Hassani of the Iraq Ministry of Water Resources, Paul McKenzie of the Canadian Army, Linda Allen of the U.S. State Department, and myself, representing the U.S. Army, in addition to representatives from National Geodetic Survey (NGS), National Geospatial-Intelligence Agency (NGA), and Trimble Navigation.
In addition to developing the IGRS, we performed several critical projects to assist in the rebuilding efforts as well as providing force protection, navigation, and mapping. My topographic engineering unit was responsible for providing coalition forces with GIS analysis, map production, and geodetic surveys.
GPS equipment collecting data on a reference benchmark used to monitor the deformation of the Haditha Dam.
For my second tour in Iraq (2007–2008), I was the platoon sergeant, which is equivalent to a project manager in a surveying firm. During the 15-month deployment, my team performed various survey projects including: 10 airport obstruction surveys, a dam deformation survey, more than 30 artillery and target-acquisition radar surveys, base-camp designs, site layouts, and ground-truth data collection for photogrammetry and remote sensing projects. We also established a nationwide database of all survey control stations in Iraq. The CORS was installed using Trimble NetRS receivers and Zephyr geodetic antennas. Trimble GPSNet and GPSBase software were used to process the continuous satellite data, for inclusion in the worldwide CORS network for public use. Field survey operations were conducted using Trimble 5700 GPS equipment.
Traveling in Iraq was a major obstacle for survey operations. We had a choice: either fly on helicopters or drive military vehicles. Flying in helicopters with survey equipment was a challenge because we could never fit all our personnel and equipment. However, it was much safer than ground transportation through the dangerous roads of Iraq. In one incident, we were building a bridge in Baiji to help Iraqis and coalition forces cross the Tigris River after the original bridge was destroyed during the 2003 invasion. Our vehicle hit an improvised explosive device (IED). Some of the survey equipment was damaged, but we went back the next day and eventually built the bridge.
Anas Malkawi served 10 years in the Army as a geodetic surveyor and senior technical engineer. He is currently enrolled in Old Dominion University’s Civil Engineering program while working at Transocean International Corporation as the Iraq program manager.
The initial plan of IGRS and placement of CORS/HARN through the Southern provinces.Soldiers establish geodetic control for an airport aeronautical survey.Soldiers survey airport navigational aids that require high geodetic accuracy.Malkawi discusses installation of Iraqi operated and maintained CORS with Al-Hassani.The result of traveling in military vehicles over roads infested with IED.Key coordinators for the installation of the first Iraqi owned and maintained Continuously Operating Reference Station (CORS.) From left are Hussein, Malkawi, McKenzie, and Allen.The 2005 U.S./British IGRS Team. Despite the difficulties, the soldiers I am honored to have served with stayed motivated and performed exceptionally every day by providing accurate data that saved lives.
Don Jewell, our intrepid Defense editor, finally stopped traveling long enough to catch up with Robert “Bob” Canty, the Raytheon vice president and program manager for the GPS OCX program. They managed to find time for a very interesting and uplifting conversation concerning the history, current status, and way ahead for the next-generation GPS operational ground control segment. Uplifting because, incredibly, this critical space program is actually on schedule and on budget. Alert the media and roll the presses!
DJ (Don Jewell): Bob I really appreciate you taking the time to sit down with GPS World and talk about OCX which is the future GPS Operational Ground Control Segment located at Schriever AFB in Colorado.
BC (Bob Canty): Don, I am always happy to talk about OCX. The program is doing extremely well and it is a good space story to tell.
DJ: Great, Bob. Now, historically, exactly how long has the Raytheon OCX team effort been in place? By that I am referring to the fact that Raytheon was required to prepare some amount of operational software for the last demo phase during the OCX competition, before contract award, that would supposedly be used at a later date. Are you making use of that software, and if you count that time during the competition phase, exactly how long have you or your team been working the OCX program?
BC: Don, what’s interesting is that we (Raytheon) were involved all the way back in the SARD (System Architecture and Requirements Definition) days, the early 2000s. I have personally been involved since the SARD days as well when we were supporting the Spectrum Astro and the Boeing teams. Then, after the SARD phase, the Spectrum Astro team joined the Lockheed Martin team, so then we were supporting Lockheed Martin (LMCO) and Boeing in that phase. When the space and control segment competitions were separated we had a PRDA (Program Research and Development Announcement) team, and consequently our team has been together since 2005. So our team has been around GPS a long time…when we came into the last phase, which was Phase A, of the program our team had a very mature design and a very mature approach. The Raytheon team was integrated and had many of the process steps behind us when we came into Phase A.
Essentially, we designed in Phase A the ability to be able to reuse that software in Phase B, so 97 percent of the software we developed in Phase A is being reused now in Phase B. Now, because of our reuse heritage, we have reuse from many different programs. We were able to incorporate that experience into Phase A and deliver a significant amount of code. Just from a DSLOC (Delivered Source Lines of Code) standpoint, on the order of 40 percent of the Block 1 code is completed and integrated together. When you look at equivalent source lines of code, or how much effort it took us to put that DSLOC together, it was about 75,000 lines of code. So when I take a look at all the code that AEP/LADO (Architecture Evolution Plan [current GPS ground control system]) has as delivered source lines of code, our final program will have less than half the lines of code than are currently in operations with the AEP/LADO program.
Now to get back to your original question about Raytheon’s longevity with the OCX program. In November 2007, Raytheon won a $160 million Phase A System Design and Risk Reduction contract. In February 2010, just 12 months ago, Raytheon was awarded a 73-month, $886 million contract for Blocks 1 and 2 of the GPS Advanced Control Segment (OCX). Raytheon has been working the next-generation GPS control system for more than 10 years. Now the Raytheon team, as such, has been in place since the PDRA phase so we have worked together for over five years. By establishing our technical approach and processes prior to Phase A, we were able to move very quickly into maturing our system design. This allowed us to develop software that is reusable in Phase B.
DJ: That’s great Bob, but why the smaller overall amount of code? Are you just utilizing a more modern and efficient software development language?
BC: Right, Don, it has to do with the overall efficiency of the code and the way it is architected and designed. There are many things we are doing with this particular code. Specifically we build functionality once and use it in many places in the architecture. By understanding the complete construct of what we have to deliver, we can get a tremendous amount of efficiency by the way we architect the overall SW and reuse pieces. We build once and deploy in several different places.
DJ: That sounds like very efficient code, Bob. What exactly is the primary software development language the Raytheon team is using?
BC: It is primarily C++ and Java.
DJ: So that must make it easier to follow sequences and find errors and problems in the code.
BC: It does, and from an integration standpoint, the overall modularity approach of a Service Oriented Architecture (SOA), facilitates integration. An SOA done right, and they aren’t all designed correctly, partitions code into much smaller modules with standard interfaces that makes it easier to integrate and test. Plus, in older architectures, you had to integrate all the code together before you could find problems among modules. In today’s OCX architecture you can really isolate problems down to different layers in the architecture, which also makes it much simpler to integrate and test.
DJ: It certainly sounds like OCX software will be easier to maintain. And I think you mentioned to me before that there will be no reuse of the AEP software in the OCX code.
BC: Right. We have no AEP code in our architecture at all. We are, however, reusing some parts of the LADO (Launch and Early Orbit, Anomaly Resolution, and Disposal Operations) software. Some of the software code that Braxton has, especially for modeling and simulation — and I will talk more about that in a minute — is being validated in our modeling and simulation framework. We are bringing all that reuse of Braxton software into our overall offering.
Essentially, Don, the entire OCX architecture was designed to easily evolve to accommodate new functionally, automation and changes in the mission CONOPS (Concept of Operations). It is also a very efficient design. Our design will use less than half the lines of code as AEP/LADO with twice the capability. As I said, we purposely did not reuse any AEP software. We have taken advantage of Braxton’s validated LADO IIR, IIR-M, and IIF models. Raytheon is also taking advantage of our Eclipse Command and Control and Equinox Mission Management product suites. ITT reuses designs from its GPS IIR, GPS IIR-M, and GPS IIIA , and Raytheon’s NCS (Network Centric Systems) brings reuse from the FAA’s (Federal Aviation Administration) Wide-Area Augmentation System better known as WAAS.
DJ: I guess that makes sense, and it’s obviously more economical for cost and schedule to automate and reuse software where you can. And since you mentioned LADO, many of the 2SOPS (2nd Space Operations Squadron) operators tell me that they prefer to use the Braxton LADO system and software because so much of it is automated. It does away with human interpretation and is less prone to fat fingering errors, especially during times of high-operations tempo on the operations floor at Schriever AFB.
BC: Absolutely. In our system going forward, we are bringing more automation into play. As you start bringing in NAVWAR (Navigation Warfare) in Block II, the overall goal is to have the same or a fewer number of operators than are on the GPS operatio
ns floor today. We are essentially doubling the operational capacity with the same or a fewer number of people. We are introducing much more automation into OCX program, more even than the Braxton LADO program has today.
DJ: We’ve talked a lot about software and procedures, but is the OCX program also about hardware?
BC: You’re right, Don. Although the GPS OCX contract is primarily a software development effort, there is a significant amount of hardware. Approximately 20 percent of the effort is hardware. In addition to the computer equipment that will support operations at the primary and alternate Master Control Stations (AMCS), we will be installing new GPS receivers in 17 globally distributed monitoring stations to monitor all GPS signals, and upgrading the ground antennas at all four legacy ground antenna (GA) locations. Most of it is COTS (commercial off the shelf) hardware, the only exception being the receivers that we put in the monitoring stations. They are custom built receivers in order to get the performance we are looking for. Since we are incorporating the M-Code (military-only code) capability into the receivers, we are required to go through an intensive information assurance (IA) accreditation process. So that is really the only custom piece of hardware out there as far as OCX is concerned.
DJ: Does that mean that you are going to have to certify all new hardware to prove that it will operate with OCX?
BC: Actually, no, there are only two segments of the hardware program that are going to have to be certified, and that is the GPS monitors/receivers and the key management system.
DJ: Key management… Does that mean that you are currently working the SAASM (Selective Availability Anti-Spoofing Module) OTAR (over the air re-keying) and OTAD (over-the-air delivery) piece of the GPS control system as well within the OCX program?
BC: Correct.
DJ: And now the question that everyone wants answered; is the OCX program still on schedule? Will it be delivered on time?
BC: We are on schedule and on cost. Since contract award in February 2010, we have successfully completed our Technical Baseline Review, Integrated Baseline Review, Software Specification Review, and Hardware Preliminary Design Review. We are on track for a successful system PDR in the second quarter of calendar year 2011 (2Q11). We just completed software iteration version 1.2 integration and test. We have started software iteration version 1.3 design activities so we are right on schedule. As I mentioned before, since we had a lot of code reuse coming out of Phase A, we were able to incorporate 97% of it into our iteration version 1.2 of the software baseline. We will progress all the way to version 1.7 in our software iterations for Block 1, so essentially we are currently a little less than a third of the way through our software development activity. We completed iteration 1.2 right on the day it was scheduled in our original operational baseline schedule. Starting this week we are beginning our iterative software design for iteration version 1.3 and that is scheduled to complete in the fall of 2011. So, yes, right now on the software development side we are right on schedule.
DJ: Bob, anyone familiar with the OCX and GPS IIIA programs has heard about a supposed gap or lack of synchronization between the two programs. Is there still a gap between the OCX FOC (full operational capability) date and the proposed launch date for the first GPS IIIA satellite? If so, how large is that gap and is it getting bigger or smaller?
BC: Don, the first GPS IIIA satellite is currently scheduled to launch in May 2014, and the OCX Block 1.0 Ready To Operate (RTO) date is August 2015. Over the past six months, we have worked closely with the GPS Directorate and GPS IIIA contractor Lockheed Martin (LMCO) to align our schedules and ensure OCX is ready to support the first IIIA launch. This has required the introduction of a streamlined Launch and Checkout System (LCS) designed to:
Reduce schedule risk for OCX Block 1.0 RTO through early completion of GPS IIIA integration, test, exercises, and rehearsals.
Provide earliest GPS IIIA-1 operational availability.
Provide opportunity for discovery of potential IIIA-1 design issues.
LCS will provide Block 1.0 Initial Checkout Capability in April 2013, On-Orbit Checkout Capability (spacecraft only) in March 2014, and Full Checkout Capability (spacecraft and navigation payload) in March 2015 (in time for the scheduled IIIA-2 launch). With LCS we have essentially closed the gap between GPS IIIA launch and OCX Block 1.0 delivery.
DJ: Great. You have theoretically closed the gap as long as LCS comes to fruition. Barring that, if required, could LADO launch the first GPS IIIA satellite?
BC: The LADO system does not currently support the IIIA vehicle and, ultimately, it is not about launching GPS IIIA as much as it is about bringing it into operations. OCX is the only system that can bring GPS IIIA into operations. Raytheon feels the current LCS approach significantly reduces the operational risk to GPS IIIA.
DJ: Now, Bob, as we mentioned earlier Raytheon has put together a team. You are not doing this alone, so please remind us of who your initial teammates were and are they all still on board? Have any new teammates been added and what does each teammate specialize in as far as OCX support is concerned?
BC: Actually, we maintain the same team today with which we started the OCX contract. Raytheon‘s teammates include Boeing, ITT Corporation, Braxton Technologies, Infinity Systems Engineering, and the Jet Propulsion Laboratory. Details on each partner and its role in the GPS OCX program are as follows:
DJ: Is the Raytheon team going to design a new Kalman filter for OCX? [Editor: for those who aren’t aware, a Kalman filter is not a hardware device but rather a set of sophisticated processing algorithms.] And if so, how do you envision the transition process progressing? Is this an area of special concern? And would Raytheon build the Kalman filter or would it be one of your teammates? If so, which one and why?
BC:I think you just asked me six rapid-fire questions about the Kalman filter.Yes, we are designing new Kalman filter algorithms for OCX. Our Jet Propulsion Laboratory (JPL) teammate, with extensive experience in this area, is responsible for developing the Kalman filter algorithms and ITT Space Systems is integrating the algorithms into the OCX navigation solution. Based on past experience, we are developing a very robust and flexible transition plan in which the Kalman filter can be operated in parallel and switched in and out even after long periods of operations. We believe this will facilitate a smooth transition from the current GPS AEP OCS to OCX.
DJ: Bob, if you don’t mind, I would like to go back to the gap issue for just a moment, just to make sure there are no misunderstandings. According to LMCO, the GPS IIIA program is continuing to move to the left, so much so that the first IIIA launch might take place before the last IIF launch. Will this cause OCX any special problems?
BC: Don, as stated before, the first GPS IIIA launch is scheduled for May 2
014 and we do not anticipate any schedule problems.
DJ: That’s great. Not to beat a dead horse, but that is a question we get a lot at GPS World, and I just wanted to make sure we had it covered. Now to move on, have there been any major surprises in the program so far, good or bad?
BC: I have been very pleased with the collaboration efforts among the GP (GPS Directorate), SE&I (Systems Engineering and Integration), GPS IIIA, and OCX contractors. The cooperation, data sharing, and teaming are outstanding. Bringing in a diversity of views and solutions is really enhancing the program.
DJ: Bob, is there a particular aspect of the OCX program of which you as the PM (program manager) are particularly proud?
BC: There is. As identified earlier, we are proud to be on schedule and on cost. We have an outstanding team that is executing to meet the customer’s needs. The strong relationship we have built with our teammates, with Lockheed Martin, the GPS IIIA contractor, and our SMC customer has been vital to the success of the program to date. In addition, we believe the ability to design a solution that leverages significant software reuse has proven invaluable to reducing cost, schedule, and technical risk on the program.
DJ: Sounds like the A-Team motto, “I love it when a plan comes together.” But what about the future, the way ahead for OCX? Is the government continuing to add requirements as you go along?
As you know many PMs have seen their well-planned programs fail because of continuous government change requests.
BC: Actually, Don, the requirements have been very stable on Block 1 and 2 for OCX. As for the future of OCX, the net-centric features that will be enabled by OCX will revolutionize future GPS services. We anticipate new capabilities such as:
Net-centric GPS user equipment will enable delivery of future GPS OCX net-centric services (e.g., situational awareness, augmentation, differential GPS) directly to end-users.
Net-centric user equipment and the future ISR (intelligence, surveillance, reconnaissance) sensor “cloud” will close the loop for GPS forward monitoring for assured delivery of PNT services and for identifying, locating and reporting sources of interference.
Collaborative, effects-based decision support tools and ad hoc planning coupled with an integrated space/ground network will tighten the NAVWAR and integrity timeline.
Combined planning of space, air, and ground-based L-band augmentation assets for assured PNT (position, navigation and timing).
Secure, cross-domain collaboration and GPS mission situational awareness will provide efficient user help-desk services and automation for constellation management.
Standards-based developer’s toolkits will speed delivery of new capabilities to users and ensure future interoperability.
DJ: OK, Bob, OCX may be flashy, new, on schedule and on budget as well as being projected to be more efficient. But as the PM what do you consider to be the most impressive or critical new capabilities that OCX brings to the GPS control system and to the warfighters?
BC: GPS OCX consolidates all ground system operations into a single, flexible, service-oriented architecture (SOA) solution that meets the needs of both legacy and future satellites. GPS OCX offers the capability to optimize across all elements of the space segment and provides net-centric interfaces and services to improve civil and commercial capabilities and enhance warfighter effectiveness well into the future.
GPS OCX will act as a service bridge between space and user segments, enabling a more innovative, user-centric system including:
Improved availability of signals from space
Increased accuracy of data
Flexible modern software that is easier to maintain and modernize
Timely clock and calendar updates
Enhanced anti-jam and interference performance
Increased capacity for satellite support
Increased Situational Awareness for GPS operators
Syncs with current satellites and future satellites
Performance continuity with existing GPS devices.
GPS OCX will revolutionize command and control (C2) and mission capabilities for U.S. armed forces and our allies, transforming the focus of GPS operations from satellite C2, to user-oriented, effects-based operations. The program will increase operational efficiency by supporting network-centric capabilities, navigation warfare, and effects-based operations (EBO), while providing the war fighter secure, actionable and predictive information to enhance situational awareness, real-time decision-making, and responsiveness.
DJ: Bob, what can you tell us about the new Raytheon GPS collaboration facility that is scheduled to open sometime this month in El Segundo, California? What part will that facility and its capabilities play, if any, in the OCX process going forward?
BC: Don, bringing new GPS capability on-line is directly related to when the control segment (OCX) can transition the capability to everyday operations. We recognize that close collaboration is necessary for enterprise success. The GPS Collaboration Center will be used for OCX development and deployment in addition to demonstrating future GPS capabilities from across the Raytheon Corporation and the OCX team.
DJ: Well Bob I’m certainly impressed and I want to thank you once again for your time today. This is an impressive story. There aren’t many space programs today that are on their cost and schedule budget or anywhere near it for that matter. That in itself is an amazing achievement. Any closing comments or important questions we forgot?
BC: Don, I appreciate the opportunity to talk about the OCX program and in closing I want to say that GPS OCX, the next-generation operational gateway service, is designed to provide secure, accurate, and reliable navigation and timing information to effectively support military, commercial, and civil users. GPS OCX will act as the service integrator for ground, space, and user segments to enhance mission command and control, and situational awareness capabilities, while seamlessly supporting millions of users around the world.
Raytheon IIS brings more than four decades of high-availability, precision-based, and command and control systems experience to GPS OCX. In addition, Raytheon IIS understands the need to move from a platform-centric to a user-centric system, and is able to deliver capability upgrades in an asynchronous environment and support the government’s desire to operate as a systems integrator. As the prime contractor for the GPS OCX program, Raytheon will continue to ensure that the solution is delivered on time, and on budget.
It is a significant first, an iconic moment, a big deal. You will want to remember where you were when you heard that smartphones started to outsell personal computers. According to a report by market research company IDC, consumer electronics makers shipped 100.9 million smartphones worldwide in the last three months of 2010, an 87 percent jump from a year earlier. PC shipments didn’t do as well, edging up just three percent to 92.1 million. The falling prices of smartphones have contributed to this trend. The numbers are skewed by the longer life of a computer compared to a smartphone, which frequently is replaced within two years. For many of us, one doesn’t supplant the need for the other.
Are car companies and content providers allowed to wed? At the Navigation Strategies, USA, conference, it was a striking new world with the automotive industry anxious to engage with application providers. Some of the interesting tweetable snippets from leading automotive and content providers:
“There is a three year development cycle with automotive. But now you can integrate an app into a vehicle in four weeks.”
“Maps used to an end onto itself, but now it is a way to organize information.”
“People will pay for connectivity in the vehicle, but may only be willing to pay during the time when it is needed.”
“People will pay for traffic, but you need to educate them on what it has done for them. This month you saved x money in gas, this amount of time navigating around traffic.”
“No one needs a map for their commute. They need their alarm clock to wake them early when their commute route is congested.”
“Content providers can only avoid the ‘free monster’ with value added services.”
“Navigation is now about smartphones and how to integrate with the car.”
Augment my reality. I’m not the only one charmed by Wikitude (no, not WikiLeaks) from Austrian-based Mobilizy. I took a walk around a hotel parking lot with Wikitude’s Philipp Breuss-Schneeweis imagining the possibilities of Wikitude Drive, augmented-reality navigation for vehicles or pedestrians. Intended as a heads-up display, it is currently shown as a smartphone mounted on a dashboard that displays the scene ahead of you, exactly as you see it with your eyes. However, the navigation route is drawn on top of the real scene. There is an option, particularly important at night, to switch out of augmented reality to see the route as a street map. Wikitude Drive was the grand prize winner of the 2010 NAVTEQ Global LBS Challenge. World Browser, another product by Wikitude, identifies objects around you. Point your phone and it will (try to) identify your surroundings, such as landmarks, mountains, or buildings.
Location-based social networks. I recently hosted a webinar on location-based social networks (LBSN). It is a hot topic: I had registrants from 42 countries. LBSNs are mobile apps based on developing a social community that broadcasts a user’s location and other content. LBSNs have an element of gaming that fuels and rewards usage, helps people find their friends or make new friends that share the same interest and proximity, and often provide offers and coupons from brands. A hallmark of many of these applications are check-ins, which is a manual or automated process of letting one’s community know one’s location: “I’m at Frankie’s Pizza.” There are too many LBSNs to list, but they include Booyah!, Whrrl, foursquare, Gowalla, SCVNGR. If you are interested, the webinar is available for download.
My webinar guests were Brian Cho of Booyah!, maker of MyTown, and Chad Reed of Pelago, maker of Whrrl. MyTown is an LBSN game that proves the concept with 3.7 million users. Sessions average 55 minutes a day and at its peak had 1.1 million daily sessions. Advertisers drop items into the game that may depend on the player’s location and sometimes a clue cannot be unlocked without a visit to a retail location. MyTown drove more than 800,000 visits to H&M, a clothing retailer.
Wirrl focuses on building affinity societies, and currently has 5,000 special interest societies, such as mountain biking, the Red Bull Society, and Mexican food lovers. Society members make recommendations to other members of their affinity group and a sophisticated algorithm builds up individual preferences. Whrrl’s revenue comes from brands that offer contests and prizes that match society members’ interests and locations. Reed says they use contests, instead of coupons or offers, to allow brands to control costs and add excitement.
Making money. I’m often asked for advice from content providers on making money when consumers are increasingly expecting applications to be free, and some applications, such as navigation or mapping, are getting dangerously close to becoming a utility. One strategy is to add value in a way that is challenging for other companies to cookie cut. An example is Navx, a company based in Paris that provides fuel prices for up to 100,000 gas stations with hourly updates. Consolidating the data isn’t a fully automated process so it is unlikely that companies like Google, or the like, will want to get their hands dirty. Navx also identifies parking spaces, speed traps, and charging stations for electric vehicles.
Probe sharing. Adding live connectivity to enable traffic and other services is critical for personal navigation device (PND) providers that are competing for market with smartphones. The recently announced TomTom GO 2505 is stepping up with improved traffic (updated every two minutes) from probe and traditional sources, as well as local search, fuel prices, and weather. TomTom is anxious to get its users hooked and is providing a 12-month trial subscription out of the box. Part of the traffic data set is provided by its own users, and Tom Murray of TomTom reports that more than 90 percent of its customers opt-in to contribute the data.
The World Mobile Conference is under way. It’s looking like it is all about smartphones and tablets. More later.
Sometimes a market niche appears to be heading toward better things — even if the economy is not. This year’s Transportation Research Board’s Annual Meeting had its highest attendance ever. While intelligent transportation systems meetings have been shunned in the last few years as being too government-focused, some forward-thinking companies are using the Washington, D.C.-based meeting as a springboard for their enterprise location-based services offerings.
WASHINGTON — While enterprise and government markets are not as sexy as traditional friend-finding location-based services, a lot can be said about companies trying to make inroads in this developing marketplace. At the recent Transportation Research Board Annual Meeting here, such companies as TomTom are leveraging its community input options from its consumer navigation devices and map-building to government and enterprise markets.
While saying the portable navigation device will endure for a long time — and will never disappear — Maarten van Gool, TomTom’s Licensing Business Unit managing director, said that the company is looking at providing navigation and location products on multiple platforms. “For decades, we have delivered location and map content to the government and enterprise markets and we work with such companies as ESRI and Pitney Bowes Business Insight and federal, state, and local government agencies,” he said.
Van Gool said that government experts and policy-makers need detailed and reliable decision-making support tools to make timely and cost-effective decisions on changes to their local traffic management programs. “The intelligent transportation systems market can benefit from accurate and comprehensive information about travel times, traffic speeds, local accessibility, and travel patterns, which are the basic building blocks for forming cohesive traffic management plans,” he said.
Also at TRB last month, TomTom announced a partnership with PTV where PTV will be able to deliver TomTom traffic content, via TomTom Traffic Stats, to its customers in the transportation sector. “We are really only at the beginning of what we can offer and we look forward to delivering additional products for the government and enterprise markets based upon our vast historical traffic database and real-time traffic capabilities; these will become available over the course of 2011,” van Gool said. “The total [government] market size is yet to be quantified, and as the technology innovation in this space expands, we are on track to support it. We believe we can revolutionize traffic information by utilizing our assets and capabilities and we are working to educate the market before its full potential is reached.”
In other TomTom news, if you haven’t seen it already, it looks as if the company is phasing out the Tele Atlas name at trade shows. Most company personnel are now wearing TomTom badges during this transition.
In one of the big TRB announcements, the U.S. Department of Transportation’s Research and Innovative Technology Administration announced the Connected Vehicle Technology Challenge. The new competition seeks industry ideas for using wireless connectivity between vehicles.
RITA, through the competition, is soliciting ideas for products or applications that use dedicated short-range communications, which will be the basis for a future system of connected vehicles that will communicate with each other as well as the surrounding infrastructure, such as traffic signals, work zones and toll booths.
According to a National Highway Traffic Safety Administration report, wireless vehicle-to-vehicle (V2V) and vehicle-to-infrastructure (V2I) communications can potentially address 81 percent of all unimpaired vehicle crashes. Selected prize recipients will be fully funded to present their ideas for connected vehicle technology.
The competition, which runs through May 1, is open to all companies, not just those involved in transportation. More information can be found at www.challenge.gov.
Qualcomm Makes LBS News with Neer
Concentrating on privacy as a market driver, Neer, which is a subsidiary of Qualcomm Services Labs, allows a users to determine where, when, and who their location information is sent to. The company says applications include not only allowing family members to know where a loved one is, but business users to schedule information to co-workers.
Privacy is what Neer, which had a strong presence in the Qualcomm booth at last month’s Consumer Electronics Show, hopes separates it from the Foursquare, Gowalla, Twitter, and Facebook Places of the world.
“First and foremost, Neer was not designed to broadcast your location to vast numbers of people. Instead, Neer allows you to selectively choose the people, places, and times you are comfortable sharing your location,” said Ian Heidt, Neer director of services strategy. “And because we enable private sharing only with those you are most close to, we have seen growing acceptance of sharing places such as one’s home or work, places that have typically been taboo in other apps. We also wanted Neer to fit in more naturally with how people behave, so Neer works simply, securely, and automatically — there is no need to ‘check in’ like other apps. And because we believe that people want to keep this information securely within their control, there are no means to share location outside Neer.”
Right now, Heidt said that Neer is free, with no charges or advertising. “In the future, we may explore ways of including relevant ads, but for now, it is totally free on both Android and iPhone,” he said. “We are looking into numerous ways that we can monetize Neer by connecting people to the places they go. But in all cases, our primary goal is to preserve the trust that Neer is both helpful to your day and under your control.”
It’s easy to jump ahead and talk about the exciting things happening today and on the horizon in the geospatial industry. Rich 3D visualizations, complex databases, sophisticated analysis, high-tech data collection equipment, etc. But what about the thousands, maybe hundreds of thousands, of people who could benefit from just being able to take the first step of importing basic information and coordinates into a mapping program.
Last week, a reader sent me a small dataset of simple lat/lon coordinates in Excel and asked me the best way to import them into some sort of mapping software. My first inclination was to use ArcGIS.com or Google Earth, or something online to avoid having to download, install and maintain software on local computers. But alas, that was not to be. After a quick post to the ArcGIS Resource Center Forum, I quickly found out that ArcGIS.com was not going to work.
“Nelson” responded to my post with the following:
Hey Eric,
Unfortunately, there is no direct way to add layers, csv files, etc., to ArcGIS.com; however, Esri has noted on a couple of occasions that they are exploring the possibility of this functionality.
Hmmm….I briefly considered Google Earth, but my experience has not been great with Earth or Earth Pro. It’s ok, but still a little cheesy for my tasted.
When I suggested that my back-up plan was to investigate ArcGIS Explorer, Nelson responded:
ArcExplorer is definately the route you should take.
There are a number of advantages to it:
1) The points can be imported very easily using the GUI.
2) If they ever do decide to shift to a GIS, the layers in ArcExplorer can be shared using Layer Packages or KML files.
3) The Google Earth interface is not as user friendly as ArcExplorer and you also have the ability to change to a number of Basemaps on the fly — ArcGIS Online (Imagery, Topographic, Streets) Bing and OpenStreetMap with 2D/3D rendering.
Lastly, if you yourself are an ArcGIS user, it will probably make your life a little bit easier to work with a format that is well organized and familiar to you.
Cheers,
P.S. At the Federal User Conference, Esri announced there is going to be tons more functionality built in to ArcExplorer over the course of the year.
At that point, I committed to trying ArcGIS Explorer. Please note that I’m the last person to open a manual for this kind of software. I really think it should be straight-forward enough to figure it out in a few minutes. The only reference I used was the online ArcGIS Explorer Desktop FAQ and I accessed the Help file once. Of course, I used the ArcGIS Explorer Forum, which is very good.
Here is a screenshot of the data I had to work with. it was 62 records long, a subset of the actual dataset.
I spent the most time making sure the coordinates were formatted correctly. The original spreadsheet had N/S/E/W to indicators instead of positive and negative. For example, instead of -17 04.201, it was formatted as 17 04.201s, with the “s” denoting south latitude. For your reference, north latitude is positive values, south latitude is negative, east longitude is positive, and west longitude is negative. This had to change. With only 62 records, I could do it by hand in a couple of minutes. If I had to change 600 or 6,000 records, I would have used a more automated method.
The other item I needed to figure out were the attributes. None were provided in the spreadsheet, so I inserted a description number and a title for each point.
Once the spreadsheet was formatted correctly, the rest was very quick and straight-forward. After installing ArcGIS Explorer, this is what you see when you run the program.
If any of you had used ArcExplorer in years past like I did, this is totally different, and refreshing.
I saved the Excel spreadsheet as a CSV file (Comma-delimited text file).
To import into ArcGIS Explorer, simply select Add Content/Text Files.
Once you select the CSV file, it reminds me of importing a CSV file into Excel in that you have to define what each spreadsheet column means, although ArcGIS Explorer does recognize some of the fields automatically. For example, if the top of a column is labeled lat, latitude, y, y-coord, y-coordinate, ArcGIS Explorer automatically assumes the data in the column contains latitude data. The same goes for the longitude and elevation fields. For a good description of importing text files, click here.
First text import screen:
Second text import screen:
After clicking on Finish, the data is imported and displayed in ArcGIS Explorer.
The background imagery is automatically displayed and there are a number of display and analysis options.
To query a particular feature, simply click on it. A window is displayed as follows:
The pop-up window could display a number of things such as hyperlinks, photos, videos, etc.
Once your data is imported, other map data can be added to customize the final to your liking.
Finally, there is a 3D view that I tried, but it didn’t work for me. I suspect it had to do with my laptop video card or video memory, but I would like to have seen it work. That would have been cool to see, especially if a rough terrain surface was visible.
Alas, there is an online version of ArcGIS Explorer I didn’t try. There was some discussion about it at the 2011 Esri Federal User Conference (FedUC) a couple of weeks ago. Click here to see what’s coming in future updates of ArcGIS Explorer Online.
Thanks, and see you next week.
<
span style=”font-size: 11px; color: rgb(82, 82, 82); line-height: 16px; font-family: Arial;”>Follow me on Twitter at http://twitter.com/GPSGIS_Eric
Using the Augmentation System with GPS-Equipped Mobile Phones
By François Boullete, Boris Kennes, Michaël Mastier, and Lee Banfield
GPS corrections from the European Geostationary Navigation Overlay Service can improve the positioning accuracy and user experience of GPS-enabled mobile phones, even if EGNOS satellites are not visible and even when the GNSS chipset in the phone does not support satellite-based augmentation systems.
Today, more than 20 percent of mobile phones in use in Europe include a GNSS chipset, and the penetration is expected to exceed 50 percent in the next 5 years. Despite its success in other sectors such as agriculture since the launch of its Open Service in October 2009,
EGNOS has received limited adoption in location-based services (LBS) and consumer applications, due to two main obstacles. First, the signals from the three EGNOS geostationary satellites that are easily received in open-sky environments are difficult to receive in cities, due to masking by buildings. Second, most GNSS chipsets embedded in today’s mobile phones are GPS-only without SBAS support, or use SBAS for ranging only, a function not supported by EGNOS at this stage.
The European GNSS Agency (GSA) and the European Commission (EC) supported the work described here to provide mobile phone operating system and application developers with a library of functions to allow them to benefit from EGNOS in all their applications. It works by receiving correction data via mobile communication networks when EGNOS satellites are not visible to the user device and even when using a standard GPS chipset, overcoming these two main obstacles for adoption.
Targeted mobile operating systems now include Nokia Maemo, Google Android, and Microsoft WinMobile. Further work will extend to this list to other compatible platforms.
This article demonstrates the feasibility and shows the performance of a software-based EGNOS solution and seeks to create awareness among mobile operating system and application developers on EGNOS.
User Benefits and Constraints
Although the sources of GPS positioning errors in urban areas are mainly due to multipath and GPS satellites availability, SBAS corrections on GPS satellites clocks and orbits and ionospheric correction model can still add value in case of moderate multipath environment characteristics. Although GPS stand-alone accuracy is nowadays generally sufficient, it is expected to degrade in the next couple of years as solar activity increases. Availability of free EGNOS corrections delivered via the mobile communication network will help maintain accuracy during these high solar activity periods.
The limited visibility of EGNOS satellites in urban areas requires the use of the mobile communication network to retrieve the EGNOS corrections. This can be perceived at the first sight as a drawback to the proposed solution as it involves communication costs. However, the required bandwidth is negligible compared to today’s mobile applications such as music and video streaming; further, mobile operators increasingly offer smartphones with unlimited data-access packages.
Implementation Overview
Implementation of EGNOS in current-generation mobile phones requires the introduction of a new library of functions at the software level that will allow application developers to get the best possible accuracy in their application regardless of the underlying algorithms used for position calculation. Such a library of functions can eventually be integrated directly in the application programming interface (API) of the phone operation system. At this point, application developers will simply request a position using the API, and the API will return the EGNOS improved position.
The main computations performed by this EGNOS library (see Figure 1) can be summarized as:
Reception: the GPS user position, satellites used, and their elevations and azimuths in NMEA format are requested to the phone’s GPS chipset, and the EGNOS correction message and Klobuchar ionospheric model parameters are received from a distant server (for example, EGNOS Data Access Service EDAS) using the communication link available at the mobile phone;
Preparation: collected input data are decoded and prepared for next step;
Calculation: the new position corrected by EGNOS is calculated by re-creating the line-of-sight or design matrix (using user position and satellite geometry), applying the EGNOS fast, long-term (including clock), and ionospheric corrections (included in the EGNOS message) and subtracting the Klobuchar ionospheric correction that was (assumed to be) applied at chipset level;
Output: the EGNOS corrected position is encoded in NMEA format and returned to the application.
Figure 1. Overview of EGNOS library implementation.
Data Access via the Internet
The EGNOS correction message and Klobuchar ionospheric model parameters are requested by the mobile phone to a distant server. Although the parameters and ephemeris data are stored on the phone’s GPS chipset once it has decoded the messages from GPS satellites, this data is not made available to other phone applications, hence the need to recover it from a remote source. Today, two alternative servers are available: the EGNOS Data Access Server (EDAS) developed by the EC and Signal-in-Space through the Internet (SISNeT) developed by the European Space Agency (ESA).
SISNeT’s advantage is the simplicity of the message (hundreds of bits per second) and the availability of specific functions that allow requesting all the necessary data for our application. However, SISNeT messages are produced from EGNOS signals in space, not from the ground segment: an EGNOS receiver installed at ESA’s ESTEC center receives the signals, demodulates them, extracts the correction message, and re-broadcasts it via the Internet. The reliability and availability of this approach depend upon the good reception of EGNOS signals at this site. Interference or EGNOS broadcast failure could disrupt service.
Unlike SISNeT, EDAS takes the EGNOS correction message directly from the EGNOS system, which guarantees higher service reliability and availability. Nevertheless, the EDAS message is complex and contains much more than the data required for the present application (hundreds of kilobits per second). Therefore a direct connection to EDAS would be inadequate. As a result an EDAS proxy needs to be interfaced between the EDAS server and the mobile platform in order to filter the data flow and extract only the required data. This proxy provides the same kind of messages and functions as SISNeT, whose specifications are ideal for such an application, however it is using data directly from the EGNOS system and not from EGNOS signals in space, improving reliability. In addition, planned EDAS improvements include the provision of such a simplified service directly from the server, removing the need for a proxy.
Independently of the data server used, the mobile platform must retrieve the EGNOS correction messages, and the Klobuchar ionospheric model parameters. The correction message is composed of a number of different message types (MT) as defined in the SBAS standard established by the International Civil Aviation Organization. For our application, the most important messages are:
MT1, the PRN mask that shows to which satellites (PRN) the data contained in the other, subsequent messages are related;
MT2-5, containing data to correct rapid variations in the ephemeris and clock errors of the GPS satellites. The important bits for us in these messages are the fast corrections for each satellite used to calculate the user position;
MT25, with data to correct long-term vari
ations in the ephemeris errors and clock errors of the GPS satellites;
MT18, the ionospheric grid points (IGP) mask that associates ionospheric corrections in MT26 with the IGPs to which they relate;
MT26, providing data to compute the ionospheric corrections for the IGPs present in the IGP mask. In particular it contains the grid ionospheric vertical delay.
The eight Klobuchar ionospheric model parameters must also be obtained from the distant server (using, for example, the GPS_IONO request with SISNeT).
Corrections from GNSS Chipset
The correction algorithm on the phone takes the original position provided by GNSS chipset and identifies the GPS satellite measurements which were used in this computation. It then determines a pseudorange correction for each of the GPS satellites used, and using knowledge of the user-satellite geometry, translates these to a combined position-domain correction.
Most mobile phones’ operating systems allow access to the NMEA sentences from the GNSS chipset using native API functions, for example, onNmeaReceived() with Google’s Android. In order to apply the EGNOS correction algorithms developed in this paper, the minimum required NMEA sentences are GGA, GSA, and GSV.
To construct pseudorange corrections, the Design matrix containing of line-of-sight vectors to the satellites is reconstructed using the elevation and azimuth data. All EGNOS corrections for the satellite orbit and clock errors and the ionospheric delay are applied in this range domain. The algorithm assumes that the Klobuchar model will have been applied to correct for the ionospheric delay in the original GNSS chipset positioning solution. Therefore it provides an adjustment to this original correction to exploit the greater accuracy of the EGNOS ionospheric data. Finally these range corrections are propagated into the position domain using the Design matrix. This provides a 3-dimensional position shift to apply to the original chipset position.
Implementation with Google’s Android
To obtain NMEA strings from an Android phone requires the ‘onNmeaReceived’ function, a function of the LocationManager class. The LocationManager uses the function ‘requestLocationUpdates’ to get a continuous update of the position input, which in this case is GPS. To implement the LocationManager, a LocationListener must be implemented either by the current activity or as a variable. The ‘onNmeaRecieved’ function will be called every second from the instant the Android’s GPS is switched on. The function provides the NMEA strings with a timestamp using the phone internal clock. This timestamp is not derived from GPS and should be used only for logging.
The HTC Legend produces the $GPGSV, $GPGGA and $GPGSA messages that are needed for the application. The Legend also produces $GPRMC and $GPVTG strings. The $GPGSV provides the elevations and azimuths needed for the algorithm, the $GPGGA provides the time, original position and number of satellites in the fix and the $GPGSA provide the PRN numbers of the satellites used in the fix.
For the present testing, necessary data are received via a TCP/IP connection to the SISNeT server (the EDAS proxy server described previously can be used in exactly the same way). For a snapshot solution a continuous connection is not needed and all the information is collected via ‘GETMSG’ and ‘GPS_IONO’ calls. ‘GETMSG’ calls get the last of a specific message type going back up to 30 messages. The types 0,1,2,3,4,5,18,24 and 26 were needed to provide the information for the position domain correction matrices. Only the last message types 0,1,2,3,3,4,5 were needed with type 18 needing 4 and many more of type 24 and 26.
The ‘GPS_IONO’ message gets the current Klobuchar values. By asking for all of the specific message types, almost instantly all the information is gained without having to wait for the 3 minutes Ionospheric grid cycle (message types 18 and 26) and the variable speed, dependant on number of satellites, complete slow correction set. Once the data has been downloaded from the server the connection is closed.
A streamed input could be used with the above approach by continuing to receive data after the initial connection and not closing the connection until the application using the service requested. This would require a continuous stable connection to a high speed mobile network and a limited use of the internet from other applications. As mobile technology improves this will not be a problem but is difficult to achieve with GPRS and 3G networks at present.
Figure 2 shows the current application running on the HTC Legend phone with corrected positions displayed alongside the original GPS positions.
Figure 2. Application running on HTC Phone.
Test Results
Before testing the implementation of the concept on a mobile platform, some initial tests were performed on an offline basis in order to assess the impact of the position correction and verify the approach. This was achieved through the use of 30s data recorded at continuously operating IGS reference stations, freely available over the internet. The data was processed using an in-house PVT engine designed to be representative of LBS implementations, in order to produce stand-alone and conventional EGNOS solutions. The algorithm described in this paper was then applied to the stand-alone solutions, after downloading EGNOS data from ESA’s EGNOS Message Server (EMS) which allows access to past broadcast messages, to produce a third set of solutions. The accuracy of each solution set was then computed based on the precise coordinates of the reference station made available by the IGS. Whilst this approach replicates the mobile phone correction algorithm it should be noted that there is less uncertainty involved in this offline approach as we can ensure that the assumptions made regarding the original PVT solution are valid. We must assume that the phone chipset PVT is a snapshot solution (no filtering) using the Klobuchar ionospheric model and an elevation-dependent weighting scheme.
The plots from Figures 3, 4, and 5 show the errors in position estimates obtained from a 24-hour dataset recorded at the HUEG IGS station in Huegelheim, Germany on May 5, 2010. Table 1 shows the statistics associated with the figures.
Figure 3. Stand-alone GPS horizontal positioning performance over 24 hours at HUEG IGS station.Figure 4. Conventional EGNOS horizontal positioning performance over 24 hours at HUEG IGS station.Figure 5. Position domain EGNOS horizontal positioning performance over 24 hours at HUEG IGS station.TABLE 1. Horizontal positioning performance statistics from 24hr HUEG IGS station analysis.
The results demonstrate that the conventional EGNOS solution improves the horizontal positioning performance of GPS, with an improvement in the 95th percentile of around 2 meters in this example. Importantly, it can be seen that the position domain EGNOS algorithm achieves a similar level of performance to conventional EGNOS. This can be seen more clearly by comparing the instantaneous horizontal error over this period from the three alternative solutions, as shown in Figure 6. It is clear that the position-domain EGNOS correction shown in yellow reduces the horizontal error of the GPS solution (red) in a similar way to conventional EGNOS (blue).
Figure 6. Time series of horizontal positioning errors for stand-alone GPS, conventional EGNOS, and position domain EGNOS solutions at HUEG IGS station.
Similar behavior was found in other datasets tested. With the ability of the algorithm to replicate conventional EGNOS performance verified, we assessed the performance when integrated on an HTC Legend phone. The key differences here were the real-time connection to the EGNOS data server and the uncertainty in the assumptions made regarding the chipset positioning algorithm.
Testing began by assessing the performance of the application over a static point. Two precisely surveyed points were used for this purpose at four separate time periods. The test method simply involved holding the phone over the point (vertical accuracy was not assessed) and requesting a corrected solution from the application, along with the original GPS chipset solution. The chipset applies stand-still detection to avoid generating multiple GPS positions for a single user location which would be unnecessary in typical phone applications. To generate a sample of position estimates therefore the phone was repeatedly moved away from the reference point then returned to it over the test period. This makes the collection of very large datasets over extended periods impractical. The samples from the four test periods were combined in order to generate results with greater statistical significance. 261 samples were collected to produce the results shown in Figures 7 and 8, and the statistics in Table 2.
Figure 7. Stand-Alone GPS Horizontal Positioning Performance from online static point testing.
Figure 8. Position Domain EGNOS Horizontal Positioning Performance from online static point testing.TABLE 2. Horizontal Positioning Performance from online static point tests.
The results indicate a small improvement in horizontal accuracy as a result of the position domain EGNOS correction. The statistical significance of these results is perhaps questionable given the limitations of the test method and relative small sample size. The reduced level of improvement compared to the offline tests is thought to be due to imperfect assumptions made about the chipset positioning algorithm. The correction algorithm must make many assumptions about the way in which the original GPS position has been computed by the phone chipset. These include assumptions on the measurement weightings used, an assumption that a filtered solution is not applied, assumptions that no additional sensors or systems (accelerometers, digital compass or cellular positioning) influence the computed position, and also assumptions that all information reported in the NMEA strings is accurate. Further work seeks to determine if the algorithm can be improved to better replicate the processes applied in the initial GPS solution in order to make a more significant improvement.
The phone GPS positioning achieves similar levels of accuracy to processing single-frequency data collected at an IGS station. This level of accuracy would be more than adequate for most LBS applications in which the main requirement is to be able to reliably relate a user location to a map or imagery feature. With increasing solar activity over the next few years, leading to larger ionospheric delays on satellite signals, the performance of standard GPS solutions will degrade, making the benefits of the more accurate and timely EGNOS corrections more significant.
Conclusions and Way Forward
By a relatively simple translation method, EGNOS data may be mapped into the position domain, allowing a user position solution to be corrected for signal-in-space (satellite orbit and clock) and ionospheric errors detected and predicted by EGNOS. User position solution provided by the phone chipset may be corrected in near-real time based on data downloaded from a distant server.
The method replicates conventional EGNOS performance (corrections applied at the pseudorange level) when all assumptions regarding the stand-alone GPS user position are valid. Ongoing work seeks to determine if the correction algorithm can be enhanced to provide a greater level of improvement to GPS positions on the phone platform. Ideally, it should be able to provide improvements similar to those produced when EGNOS data is applied in a conventional manner in the position solution. Developers would need to judge the significance of any potential improvement for their intended application.
The EC has launched a project to port this EGNOS library to other mobile platforms and complement it with additional functions that are needed by the application developers and that can bring user benefits. The software library can be obtained free upon request to [email protected].
Acknowledgments
Special thanks to Nottingham Scientific Ltd. for its work on this topic and cooperation in preparing this paper. This article is based on a paper presented at ION-GNSS 2010.
François Boullete was market development officer at the European GNSS Agency at the time of this work. He holds a diploma in project management from HEC and a diploma in engineering from Ecole Centrale.
Boris Kennes is R&D and market monitoring officer at the European GNSS Agency. He has a background in engineering and strategy consulting.
Michaël Mastier is policy officer at the European Commission in the Galileo/EGNOS applications unit. He has an engineering education and diploma in public works from ENTPE in Lyon, and a computer science post-graduate diploma from Saint-Etienne University, France.
Lee Banfield is a software engineer at Nottingham Scientific Limited (NSL) in the UK. He has developed applications which use EDAS data to provide EGNOS corrections, GNSS assistance messages and GNSS performance metrics for a range of road and LBS applications.