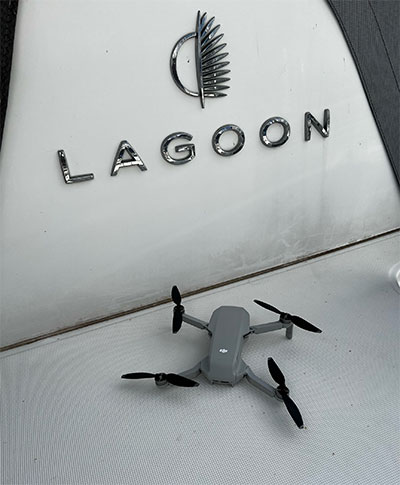
AnimaMundi is a not-for-profit organization based in Geneva, Switzerland. Its proprietary technology interprets photo and video records to extract a single-use plastic bottle count. The information can be captured via an app using still photography as well as images from drones. The data is automatically uploaded, processed and stored on the company’s servers. The data will enable decisions to facilitate environmental investments and measure the impact of waste-management initiatives.
The process begins with DJI drones piloted by sailors taking place in the Atlantic Rally for Cruisers (ARC), which started from Las Palmas in the Canary Islands, on Nov. 21. DJI provided drones to Lagoon, a sailing catamaran cruiser maker, to measure plastic waste on beaches around the Caribbean.
Of the more than 300 million tons of plastic produced every year, at least 8 million tons end up in the ocean, making up 80% of all marine debris, from surface waters to deep-sea sediment. About 33,000 single-use plastic bottles are dumped in the ocean every minute of every day, affecting every coastline.
Matt Cooper, founder and CEO, AnimaMundi is driven by the need for accurate real time data to ensure investment decisions are made correctly with measurable impact. “Just before COP26 began, world leaders admitted that an annual $100-billion climate finance goal will not be reached until 2023,” Cooper said. “The need for urgent climate action is met with the need to ensure adequate and effective financing solutions. Big data like this will help to determine priorities for action.”
Lagoon has been a partner of the ARC rally since 2005. Through its Club Lagoon, the company encourages its owners to sign up to this program aiming at reducing plastic waste in our oceans thanks to data collected by drones.
“Lagoon is proud to be partnering with AnimaMundi in this exciting data collection initiative using our ‘Club Lagoon’ as part of the solution,” said Thomas Gailly, Lagoon brand director. “We have more than 6,000 of our catamarans sailing around the world, and we can feel that our customers are more and more willing to play a role in such initiatives. It’s stimulating to think that the Lagoon owners’ community could be involved in capturing this much needed data in a highly efficient way. This partnership is the perfect complement to our own policy of respect for the environment and all the work undertaken to reduce the environmental impact of our activities.”
DJI, the global leader in developing and manufacturing civilian drones and aerial imaging technology for personal and professional use, has provided repurposed drones to capture images of the Caribbean coastline that would otherwise be out of reach. “Our drones and cameras empower people to capture amazing photos, video, and high-end professional imagery in every corner of the world,” said Olivier Mondon, senior communication manager at DJI Europe. “Each day, we learn how drones benefit society as a whole, and we are proud to have our drones embark on this environmental journey with experienced sailors who will be able to work using repurposed products to enable invaluable data capture.”
Initially targeting the Caribbean islands, AnimaMundi is also finalizing a partnership with the International Union for Conservation of Nature (IUCN) and its Plastic Waste-Free Islands (PWFI) initiative to generate weekly total island coastal plastic waste profiles covering Grenada, St. Lucia, Antigua and Barbuda.
In 2019, with the support of the Norwegian Agency for Development Cooperation, IUCN launched the PWFI project in the Caribbean, the Mediterranean and Oceania, seeking to promote a circular economy and demonstrate effective, quantifiable solutions to address plastic leakage from small island developing states.
Trimble has established a scholarship program to honor Gladys West, a pioneer in mathematics, minority advancement and the advent of the Global Positioning System — one of the most widely used innovations throughout the world.
Gladys West. (Photo: Trimble)
Supported by the Trimble Foundation, a donor-advised fund, the Dr. West scholarship program will enable Virginia State University, North Carolina A&T State University and Florida International University to award a four-year scholarship to one student each year. These universities were carefully chosen to reflect Dr. West as a woman of color and science, and to align with two of the Trimble Foundation’s key support pillars: female education and empowerment and diversity, equity and inclusion.
Known today as the hidden figure who helped invent GPS, West knew from a young age that education would be the key to moving forward from her family farm in rural Virginia. A scholarship recipient herself, she earned a bachelor’s and master’s degree in mathematics.
She was offered a position in 1956 with Virginia’s Naval Proving Ground — now called the Naval Surface Warfare Center. Hired as a mathematician, she was one of only four African American employees at the time and only the second woman of color.
With her intelligence and computational skills recognized, she quickly climbed the ranks and became project manager for the Seasat radar altimetry project in the 1960s. Knowledge gained through that work enabled her to program an IBM computer to calculate an accurate geodetic Earth model — the detailed mathematical model of the shape of the Earth that is the essential building block for GPS.
That tenacity, talent and enterprising fortitude encapsulates the spirit of Trimble’s scholarship program designed to honor West’s contributions to science and the geospatial industry.
“It’s fitting to announce this special scholarship program following West’s 91st birthday,” said Rob Painter, Trimble CEO, “a woman who helped pave the path to GPS — the technology that was not only core for Trimble’s early business but provided the catalyst to create the geospatial industry. This path to innovation has given us the tools to not only navigate and model our world, but to transform work in our lives every day. Just as West viewed education as the pathway for the future, we are excited by the opportunity to support a new generation of stars to help them pursue their educational journey.”
“We must appreciate our past, learn in the present and prepare those behind us for the future,” West said. “We must encourage our youth to pursue a higher level education so that they will be equipped to change the world. We must be willing to use our talents and strengths to work for the betterment of the world.”
Virginia State University — West’s alma mater and a Historically Black College and University (HBCU) — will award the Dr. Gladys West “Constellation” Scholarship from Trimble to a student in the College of Engineering and Technology. The VSU scholarship is also being matched by an anonymous donor.
North Carolina A&T State University — a top-ranked public HBCU — will award the Dr. Gladys West HBCU Scholarship from Trimble to a student in the College of Engineering.
Florida International University — a minority-serving institution — will award the Dr. Gladys West Trimble Technology Lab Scholarship to a first-generation student in the College of Engineering & Computing. The scholarship is also being matched. FIU is the home to the recently established Trimble Technology Lab, which provides students hands-on access to Trimble technologies within the Moss Department of Construction Management.
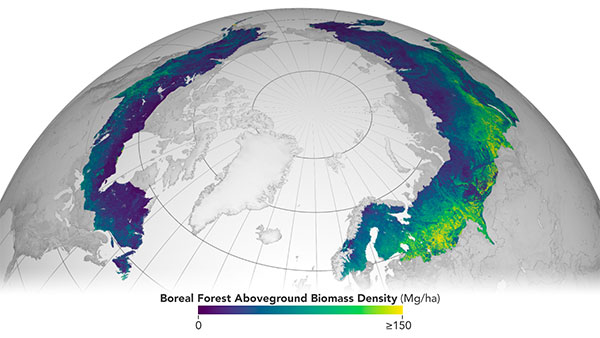
The European Space Agency (ESA) and National Aeronautics and Space Administration (NASA) have publicly released a globally harmonized assessment of aboveground biomass — information vital for managing global climate change.
The Multi-mission Algorithm and Analysis Platform (MAAP) provides seamless access to aboveground biomass information from both NASA and ESA Earth observation data. The open-science tool is now fully operational and accessible online.
Circumboreal forest biomass density mapped at high spatial resolution (30 m) with NASA’s ICESat-2, the joint NASA/USGS Landsat-8 and ESA Copernicus Digital Elevation Model (DEM) data. This provisional product is representative of 2020 conditions and is an open-source science product created on the NASA-ESA MAAP platform that will be validated in the coming months. (Image: NASA/ESA)
MAAP is the culmination of a two-year NASA and ESA effort and reflects the cooperation between the two agencies under the NASA and ESA Joint Program and Planning Group (JPPG) Joint Working Group (WG) on Ground Segment and Operations.
The MAAP platform enables international scientists and researchers to collaboratively develop algorithms and code as well as analyze and visualize large datasets acquired from sources including satellite instruments, the International Space Station, and airborne and ground campaigns. The large data and high-performance computing required for MAAP, along with a shared code repository and catalog, are stored and managed in the cloud. MAAP capabilities are supported and shared between NASA and ESA.
“Biomass is the first ESA mission with open-source algorithms,” said Clement Albinet, ESA’s Biomass data quality manager. “Thanks to that, the community will be able to access all the source code, the test data and all the documentation, and will be able to contribute in a collaborative way to the improvement of the biomass products. MAAP will allow scientists to easily work with large datasets at a global scale and to finally focus on science.”
The initial application of MAAP focuses on aboveground biomass to help determine the size and carbon content of Earth’s forests. These data are vital for informing our understanding and forecasting of climate change, including regular updates to the Intergovernmental Panel on Climate Change (IPCC).
While biomass is the first application of MAAP, it can be adapted for collaborative exploration across the breadth of science data and scientific disciplines available through NASA, ESA and similar research agencies.
MAAP includes data from missions such as NASA’s Global Ecosystem Dynamics Investigation (GEDI) and the joint NASA/ESA AfriSAR campaign, and will eventually support data from upcoming NASA and ESA missions such as the joint NASA/Indian Space Research Organization SAR (NISAR) and ESA’s Biomass mission.
Several projects are producing continental to global biomass maps for 2020, including ESA’s Climate Change Initiative Biomass and JPSs global map, both at 100 m, as well as NASA’s GEDI 1-km map. GEDI, the Global Ecosystem Dynamics Investigation, is a spaceborne laser instrument that measures the structure of Earth’s forests in high resolution and three dimensions.
The world’s Earth observation biomass community is undertaking an exercise on MAAP aimed at resolving discrepancies between those products and producing harmonized estimates of biomass and uncertainty at a policy-relevant, jurisdictional-level scale.
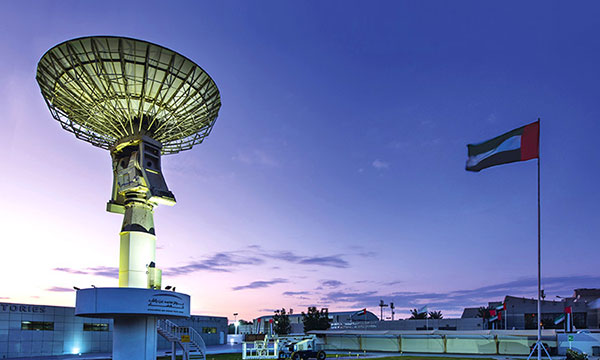
The Mohammed Bin Rashid Space Center builds and operates Earth observation satellites. (Photo: MBRSC)
The Mohammed Bin Rashid Space Center (MBRSC) in the United Arab Emirates (UAE) will use a RUAG Space GNSS navigation receiver to determine the position of its new satellite. Founded in 2006, MBRSC is home to the UAE National Space Program.
RUAG Space’s LEORIX receiver will precisely determine the satellite’s position in orbit, with an accuracy of about 1 meter. The high accuracy is achieved through simultaneously processing of multi-frequency signals from GPS and Galileo satellites.
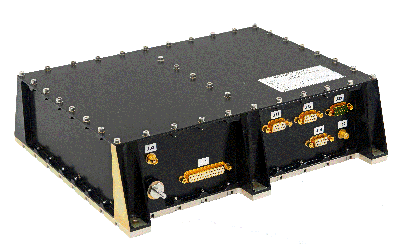
The LEORIX receiver from RUAG Space. (Photo: RUAG Space)
Based in Switzerland, RUAG Space offers three types of space-hardened navigation receivers. The LEORIX for low Earth orbit, the GEORIX for geostationary Earth orbit and the PODRIX for precise orbit determination are all based on the European Space Agency’s latest GNSS processing technology.
The PODRIX receiver had its maiden flight to space in November 2020 and precisely determines the position of the European environmental satellite Sentinel-6. The LEORIX receiver flew for the first time in space in March 2021. In total, more than 80 receivers of the latest receiver generation (LEORIX, GEORIX and PODRIX) have been ordered by customers in Asia, Europe, the Middle East and the United States. They will be launched for different low-Earth and geostationary orbit missions within the next months and years.
The MBRSC builds and operates Earth observation satellites, offering imaging and data analysis services to clients around the world. The center launched the first Emirati-made satellite, KhalifaSat, in 2018, and the DubaiSat-1 and DubaiSat-2 satellites in 2009 and 2013 respectively. MBRSC is also responsible for the Emirates Mars Mission Hope probe, the first Arab interplanetary mission, which is collecting data from the Red Planet.
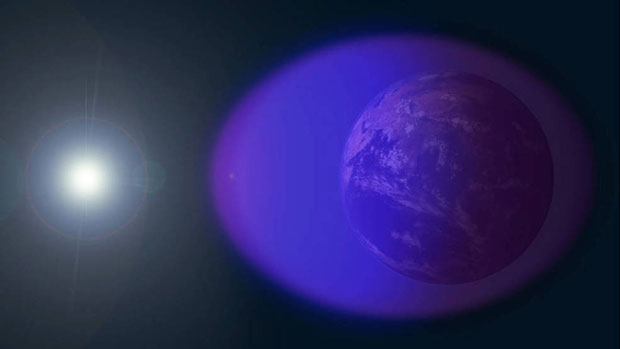
The ionosphere is shown in purple and not-to-scale in this image. (Image: NASA’s Goddard Space Flight Center/Duberstein)
Researchers have developed a new mathematical model to more accurately capture how ionospheric scintillation interferes with GNSS signals, reports EOS.
The new model uses a Markov chain. The model’s parameters were drawn from data on actual signal disruptions caused by ionospheric scintillation above Hong Kong on March 2, 2014. The researchers compared its predictions with real-world data and found it accurately emulated the timing and duration of the actual signal disruptions and did so more accurately than an earlier model that did not use a Markov chain approach.
Citation: “Markov Chain-Based Stochastic Modeling of Deep Signal Fading: Availability Assessment of Dual-Frequency GNSS-Based Aviation Under Ionospheric Scintillation” by Andrew K. Sun, Hyeyeon Chang, Sam Pullen, Hyosub Kil, Jiwon Seo, Y. Jade Morton and Jiyun Lee, Published in Space Weather, June 24, 2021. https://doi.org/10.1029/2020SW002655
The team’s findings also suggest that dual-frequency GNSS signals can significantly counteract the disruptive effects of strong scintillation, specifically for aircraft navigation.
In the future, this new modeling approach could be extended to improve understanding of other effects of ionospheric scintillation on GNSS signals, as well as their effects at other latitudes.
A new data source to help scientists better understand the ionosphere and its potential impact on communications and positioning, navigation and timing (PNT) is now available to the public.
The data, which was collected by sensors on GPS satellites in 2018, was released through a collaborative effort by Los Alamos National Laboratory and the National Oceanic and Atmospheric Administration (NOAA).
“Radio signals from satellite or ground-based transmitters can travel through the ionosphere or bounce off of it, so ionospheric conditions have the potential to disrupt communications depending on the density of electrons,” said Erin Lay, a remote-sensing scientist at Los Alamos who was a technical lead on the project. “This new set of data will help us better model and predict the behavior of the ionosphere and possibly improve the reliability of our communications and positioning, navigation, and timing services, which are critical for both everyday life and national security.”
The ionosphere is the boundary between Earth’s atmosphere and space, stretching 40 to 250 miles above Earth’s surface. It is composed of tenuous atmosphere and charged particles (ions and electrons) that interact with traversing radio waves. The behavior of the ionosphere reacts to weather on Earth, such as thunderstorms, wind, and hurricanes, as well as space weather created by solar winds impacting Earth’s magnetic field.
“NOAA’s Space Weather Prediction Center (SWPC) serves a huge customer base interested in space weather effects on communications and GPS-reliant technologies,” said Bill Murtagh, program coordinator at SWPC. “We expect access to these Los Alamos data sets to improve the development, validation, and testing of models used at SWPC for characterizing and forecasting ionospheric disturbances.”
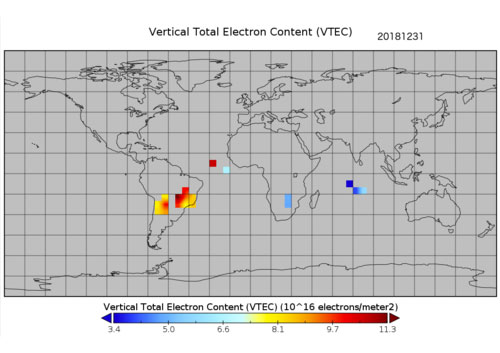
Preview graphic. (Image: NOAA)
The new data comes from unique measurements of lightning events, each of which produces a flash of radio waves that gets dispersed through the ionosphere before it is detected on satellite receivers. Each measured flash provides a snapshot of the ionospheric conditions at that instant, and many lightning measurements accumulated over time provide a unique view of ionospheric weather. This is the first-ever global set of ionospheric electron density data to use a naturally occurring source phenomena.
Before this release, the data available to feed ionosphere models was primarily from arrays of ground-based receivers, which are limited because they only monitor fixed locations. According to Lay, “the new data is gathered from lightning that happens all over the world and will give scientists the opportunity to study the ionosphere in ways previously not possible.”
The release of underutilized data sets was a priority established in the 2019 National Space Weather Strategy and Action Plan. Los Alamos processed the data from its radio-frequency sensors that are onboard GPS satellites and used for nuclear treaty monitoring, and then worked with a government interagency group, called the Space Weather Operations, Research and Mitigation (SWORM), to facilitate public release.
NOAA’s National Centers for Environmental Information will host the data on existing sites that serve terrestrial weather and space weather resources.
The ionosphere is shown in purple and not-to-scale in this image. (Image: NASA’s Goddard Space Flight Center/Duberstein)
The National Geospatial-Intelligence Agency launches Phase 4a of MagQuest Challenge to advance NASA’s ability to measure Earth’s magnetic field
The National Geospatial-Intelligence Agency (NGA) has launched the Demonstration Phase (Phase 4a) of its MagQuest Challenge to develop novel data-collection approaches for the World Magnetic Model.
The WMM ultimately ensures the accuracy of navigation, because it corrects for differences in magnetic forces at a user’s location. The model is used by thousands of systems for mobile navigation apps and is critical for military and commercial uses around the world.
Produced since 1905, the WMM originated with data collection from two ships surveying 500,000 miles of ocean. Today, the data is collected by satellites operated by the European Space Agency that will eventually reach the end of their useful life.
NGA’s MagQuest Challenge is promoting the development of miniaturized solutions to determine whether they can produce data useful to support WMM production. NGA has an extensive network of government partners collaborating on the WMM production, including the National Oceanic and Atmospheric Administration (NOAA), the British Geological Survey, the Federal Aviation Administration (FAA), the Department of Defense (DOD), the United States Geological Survey (USGS), and the United States Naval Observatory (USNO) among others.
As part of its core mission, NGA provides geospatial intelligence products and services to decision makers, military service members, and first responders.
The MagQuest Demonstration Phase 4a will take place on HeroX, a social network platform for crowdsourced solutions.
Three winning teams from Phase 3 of MagQuest each proposed a magnetometer design to measure the Earth’s magnetic field. In this new phase, the teams will receive several million dollars in awards, including a $1.55 million incentive prize purse, to develop their proposed magnetometers. NASA Goddard Space Flight Center will conduct independent testing on each team’s prototype.
Following Phase 4a, successful teams will integrate their magnetometers into their satellites and launch their systems, acquire data and share their results with NGA.
“Our ultimate goal is for all three teams to successfully develop a magnetometer, each of which can be sent into orbit to determine viability for WMM production,” said Mike Paniccia, NGA program manager for the World Magnetic Model. “We want to test as many innovative and groundbreaking magnetometers as possible to ensure that NGA has a robust set of data suppliers to support the future of the WMM. We intend to have a competitive procurement for a data-buy contract following MagQuest and hope that these three teams, in addition to others from industry, will be able to supply comprehensive data sets to support the future of the WMM.”
Three of the teams that participated in Phase 3 were selected to participate in Phase 4:
Iota Technology, the first-place Phase 3 winner, works alongside experienced teams from Oxford Space Systems and AAC Clyde Space. Their combined expertise in sensor technology, deployable structures and mission design informed the design of their SIGMA solution — a 3U CubeSat featuring a novel deployable boom and a 3D magnetometer array.
University of Colorado Boulder is one second-place Phase 3 winner, and their solution, COSMO, leverages recent innovations in CubeSat technology and novel magnetometer technology. The University of Colorado Boulder team includes experts and faculty from the Department of Aerospace Engineering Sciences, the Department of Mechanical Engineering, and the Laboratory for Atmospheric and Space Physics, and they operate their missions entirely at the university, including using their own ground stations.
Spire Global and SBQuantum formed a partnership with a promising approach to become the other second-place Phase 3 winner. SBQuantum’s novel diamond-based quantum magnetometer technology is coupled with Spire’s expertise and existing infrastructure in satellites, ground stations and data processing to produce a unique solution.
“This MagQuest Challenge is a testament to the power of the crowd,” said Kal K. Sahota, CEO, HeroX. “We are pleased to be part of securing the future of geomagnetic data collection and consequently contributing to the resilience and continued crucial work of the WMM.”
“Seen & Heard” is a monthly feature of GPS World magazine, traveling the world to capture interesting and unusual news stories involving the GNSS/PNT industry.
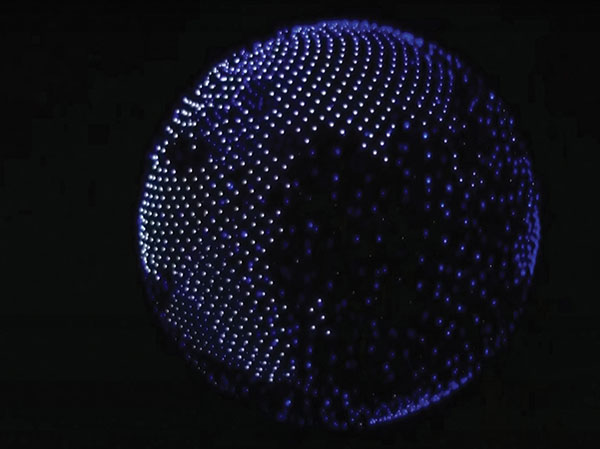
Screenshot: Global News video
Our Spinning Globe
A highlight of the opening ceremony at the Tokyo 2021 Olympics was a revolving globe above the Olympic stadium. The 1,824 Intel Shooting Star 3 drones formed a complex set of geometrical shapes before transitioning into the games’ emblem, and then a 3D representation of Earth. The Intel Shooting Star 3 drones are designed for entertainment purposes. Each drone weighs 340 grams, is equipped with four extremely bright LEDs, and features real-time kinematic (RTK) GPS for the increased positional accuracy needed for high-resolution animations, sharp imagery and dynamic 3D animations.
Illegal coffee plantations have appeared inside Bukit Barisan Selatan National Park in Indonesia, a key habitat for the endangered Sumatran tiger and other species. Conservationist Matt Leggett noticed in satellite images the declining size of the forest, and sent a team of researchers on an undercover operation on dirt bikes with cameras and GPS receivers, reports the Aug. 11 New York Times Magazine. Leggett’s team mapped hundreds of small coffee farms and investigated the complex chain of custody, which ends with major brand names. No solution has been found, though some farmers have promised to replant the forest over the next 15 years, while others continue to clear park land.
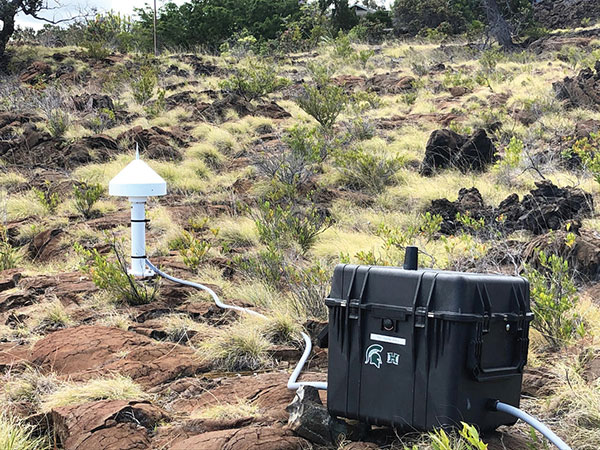
Seven scientific-grade GPS stations are joining a network of 65 that the USGS Hawaiian Volcano Observatory operates on the Hawaiian Islands. As Hawaiian volcanoes erupt and grow, they add weight to the Earth’s surface, causing the Pacific Plate to flex downward and possibly causing the shelf to splinter. Earthquakes this spring in Hawaii likely were related to weight on the underlying crust and mantle from eruptions. Collecting years of data from these stations should help scientists better understand motions of the Pacific Plate, according to researcher Jeff Freymueller, Michigan State University. The first three GPS stations were installed in May; others are being installed this summer.
Nikon could be launching a consumer camera equipped with GNSS instead of only GPS, providing a major upgrade for the geolocation coordinates provided with photo metadata. Filings with the governments of Russia and Indonesia describe a camera dubbed N2014, which will be equipped with GNSS as well as Wi-Fi and Bluetooth. A number of Nikon CoolPix digital cameras have built-in GPS, while other cameras — Nikon D-SLRs and select Nikon 1 — can use optional accessory GPS devices.
A GNSS receiver is scheduled to land on the Moon in 2023, sent by NASA and the Italian Space Agency (ASI). The innovative GPS and Galileo receiver, provided by Qascom, will experiment with satellite-based positioning on the lunar surface.
The project, dubbed NEIL (Navigation Early Investigation on Lunar surface), is at the center of an agreement between ASI and NASA, linked to the CLPS 19-D mission (NASA’s Commercial Lunar Payload Service, Task Order 19).
The NEIL payload will be integrated into the Lunar GNSS Receiver Experiment (LuGRE), an ASI/NASA cooperation framework to develop activities in lunar and cislunar environments.
For the first time in history, GNSS positioning will be tested at almost 400,000 kilometers from Earth. The previous limit was a distance of 200,000 kilometers, tested in the Magnetospheric Multiscale (MMS) project.
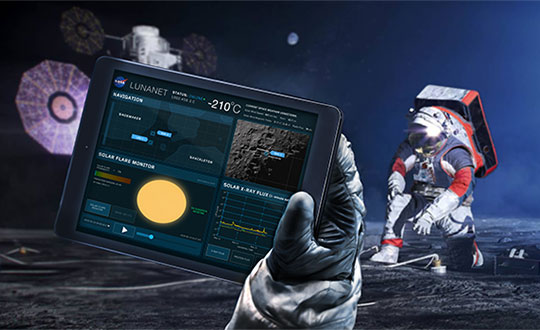
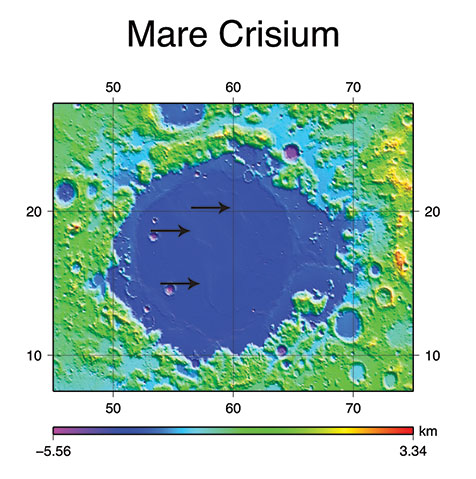
NEIL will be integrated on the NASA’s Blue Ghost lunar lander in 2022. In addition to the NEIL payload, nine other experiments will land on the Moon. The mission is expected to be launched via a SpaceX Falcon 9, and the lander with aim for the Mare Crisium basin.
Image: NASA/Resse Patillo
Moon-Hardened Receiver
Under an ASI contract, Qascom will develop the dual-frequency GPS and Galileo receiver, as well as the entire radiofrequency chain (antenna, LNA, filters), all of which can withstand the extreme environmental conditions of the Moon.
The GPS and Galileo signals received from NEIL will be extremely weak due to the distance from Earth, and will be processed with specific algorithms allowing to calculate position and time, even if with reduced accuracy, both during the Moon transfer orbit and on its surface.
Image: NASA
“This experiment is of strategic importance for Italy, since it will bring our technology to the Moon surface,” stated the Italian Space Agency. “It contributes to strengthening the competitiveness of the Italian space sector and consolidates the strong collaboration between the Italian Space Agency and NASA in the satellite navigation segment as well as in the future Moon and Mars missions.”
NEIL provides also an important technical and scientific contribution to study how GPS and Galileo could be used for positioning and timing in future Moon missions, including for example the deployment of lunar satellite constellations, lunar rovers, the lunar space station Gateway and the infrastructures that are going to be developed in the frame of Artemis programs. The raw measurement collected will be used by the research community to study the lunar and cislunar environment and evaluate the future use of GNSS to support permanent missions.
Soon, global navigation will no longer suffice. Humanity is preparing to return to the Moon after more than half a century. U.S., European, Chinese, Indian, Japanese and Russian governments and companies want a slice of the “eighth continent.”
NASA’s Artemis program, which aims to put astronauts on the Moon’s south pole in 2024, will explore more of the lunar surface than ever before. Robots and humans will search for, and potentially extract, resources such as water, which also can be converted into other usable resources, including oxygen and fuel.
Astronauts searching for spots where robotic spacecraft have pointed to the ice on the lunar map and for equipment sent on ahead of them will need precise navigation guidance. So will astronauts and ground controllers operating the Gateway outpost in Moon orbit and the Orion spacecraft. This will require extending the reach of our Earth-centric positioning, navigation and timing (PNT) systems to cover our planet’s nearest neighbor.
A permanent and reliable source of PNT on the Moon will reduce the amount of gear each mission will have to develop and carry, making more funding and rocket-lift capabilities available for scientific equipment. It also will free bandwidth on NASA’s communications networks, which have historically provided navigation services near the Moon.
NASA and the European Space Agency (ESA) are laying the foundations for this navigation system. Their efforts include the development of a special receiver able to pick up GPS signals that, already very weak on Earth, are extremely so on the Moon; NASA’s LunaNet communications and navigation architecture; ESA’s public-private Pathfinder satellite navigation and communication mission, due to launch into lunar orbit by the end of 2023; and ESA’s Moonlight initiative, which will establish lunar communication and navigation services.
Studies already have proven that it is possible to navigate between Earth and the Moon, as well as on the latter’s surface, using the side lobes of the signals from GNSS satellites. In 2023, the Lunar GNSS Receiver Experiment (LuGRE), developed in partnership with the Italian Space Agency, will demonstrate and refine this capability on the Moon’s Mare Crisium basin. NASA will use data gathered from LuGRE to refine operational lunar GNSS systems for future missions.
Besides the low signal power, other challenges to using GNSS satellites for Moon navigation include geometry, with all the signals coming from a relatively small portion of the sky; the fact that in polar regions the Earth would be low on the horizon and therefore GNSS signals could easily be blocked by hills or crater rims; and the complete occultation of the signals when moving beyond the side of the Moon always facing Earth. Meeting this last challenge will require at least a couple of Moon-orbiting satellites. (Artificial satellites orbiting our planet’s natural satellite as a supplement to the artificial satellites orbiting our planet…)
The Moon will be our steppingstone to Mars. I bet it will not be long before the Institute of Navigation establishes a Planetary Navigation division!
Spire Global, a global provider of space-based data and analytics, has announced the continuation of its participation in NASA’s Commercial Smallsat Data Acquisition (CSDA) Program with a $6 million contract extension.
The contract continuation, Task Order 6 (TO6), is a subscription data solution that includes radio occultation (RO) data, grazing angle GNSS-RO, total electron content (TEC) data, precise orbit determination (POD) data, soil moisture and ocean surface wind speed GNSS reflectometry (GNSS-R) data and magnetometer data.
This data will be available to all federal agencies, NASA-funded researchers and, more broadly, to all U.S. government-funded researchers for scientific purposes.
Under CSDA Program TO6, Spire will deliver a comprehensive catalog of data, associated metadata and ancillary information from its Earth-orbiting small-satellite constellation. The company operates its constellation in low Earth orbit and collects upwards of 10,000 radio occultations per day with consistent global coverage.
For TO6, Spire will provide rolling access to 12 months of radio occultation data with a 30-day latency. This data will be archived and maintained by NASA under the CSDA Program’s SmallSat Data Explorer (SDX) database.
“Programs like CSDA highlight the incredible potential of private-public partnerships in the federal government to drastically accelerate our ability to confront some of the greatest challenges of our time, such as climate change,” said Peter Platzer, CEO of Spire. “With the end-user license agreements, our data is now available to all federal agencies and the larger NASA scientific community to help support Earth observation research across fields.”
The program includes end-user license agreements (EULAs) to enable broad levels of dissemination and shareability. All federal agencies and U.S. government-funded researchers will have access to Spire’s data for scientific purposes under TO6 and will be able to request access to the data via the CSDA Program’s Commercial Datasets webpage.
“At NASA, the CSDA Program has continued to blossom as a valuable resource to our team for our Earth observation research and analysis. We are committed to growing the program as well as continuing the work we have started,” said Will McCarty, project scientist at the CSDA Program and research meteorologist at NASA Global Modeling and Assimilation Office. “Spire has been a valued partner through CSDA’s development since its inception, and with this additional task order, we are excited about the new insights and results that will come not only from within NASA, but also through broader collaboration through the domestic government scientific community.”
NASA has used Spire data in its research on water and sea-ice levels in the polar regions, the height of the planetary boundary layer (PBL), and the day-to-day variability of thermospheric density at flight level.
NASA also noted that Spire data has shown positive benefit to its GEOS Atmospheric Data Assimilation System, which uses space-based data to analyze the Earth’s atmosphere and assimilate the data into its Earth observation systems.
As one of the original vendors for the CSDA Program, Spire provides NASA yearly updates to the scope of work under this agreement to ensure alignment of data to the agency’s needs.
“Crime is common. Logic is rare. Therefore, it is upon the logic rather than upon the crime that you should dwell.”
“Data! Data! Data!” He cried impatiently. “I can’t make bricks without clay.”
— Sherlock Holmes, “The Adventure of the Copper Beeches,” Sir Arthur Conan Doyle
Watson is to Holmes what information is to intelligence. Watson could listen to the client story, observe the situation, and recite to Holmes all the relevant facts, but he lacked the ability to string together the seemingly random pieces of information into a coherent chain of events leading to the correct hypothesis. A computer can become a Watson, but it takes a human to be Sherlock; however, a human misguided by cognitive biases will end up as Inspector Lestrade, always coming to the wrong conclusion.
When it comes to data, the analogy of drinking from a fire hose is an understatement. Consider that a digital image can be terabytes in size and every day millions of images are taken. Facebook generates 4 petabytes of data daily, and each day there are 500 million tweets and 306 billion emails. Additionally, there are 20 billion connected devices. Combined, the world creates 2.5 quintillion bytes of data every day. If a grain of sand represents a byte of data, then every three days more data is created than there are grains of sand on the Earth, and it is only increasing.
Somewhere in all that data are signals. Real-time threat intelligence systems are looking for those signals before the next huge event occurs. It is a high-stakes hunt for Leviathan, except that Leviathan is only a packet of sand traveling at lightspeed through a cloud obscured by dust.
Nellis Air Force Base takes part in Red Flag 15-2 at its Combined Operations Center in 2015. (Photo: Senior Airman Thomas Spangler/U.S. Air Force.)
Interpreting a Signal
The massive volume, variety and velocity of continuously flowing data far surpasses the ability of humans to process. It exceeds the bandwidth most systems can handle. And it quickly overwhelms the capacity to store, manage and act on the information in a timely and cost-effective manner. Resources are not infinite. The best model to handle an overwhelming amount of data is the human brain. Humans are biological sensors. Every moment of every second of our lives, our bodies are receiving an endless stream of stimuli from internal and external sources. Most of this stimuli registers at an unconscious level, and as long as the stimuli is normal and expected, it goes unnoticed by the conscious mind. If, however, any discomfort is experienced, the conscious mind is notified. Then that becomes the focus until normalized. Externally, the same applies to computer data systems. Normal conditions are ignored, but if there is something unusual, such as a loud constant noise, or a colder than normal temperature, it draws all the processing attention.
In the realm of intelligence that is basically how things function. Algorithms are written to learn the normal patterns of life and to identify specific events, words, names, etc. As long as data is within normal parameters, it gets little attention, but as soon as an anomaly exceeds a threshold or something triggers the algorithm, it will immediately be brought to the attention of the intel center. An example can be viewed on the Global Incident Map dashboard. I encourage you to sign up for a free 72-hour membership. If you want to see what real news looks like, this would be a sampling. The number of real incidents that happen across the country and around the world that you never hear about, many of them hair-raising and all of them open source, add to the few stories the media has been able to tell about cyber attacks. Scroll down the page. There are many filters, but I recommend turning them all off to see the full extent of information. Clicking on an incident will drill down into the actual source so you can read about it more thoroughly.
Below is the U.S. Army’s real-time critical incident dashboard called the Joint Analytic Real-Time Virtual Information Sharing System (JARVISS). It tracks and monitors activity near U.S. Army installations and standalone assets of interest around the world.
Another dashboard for cyberattacks is Check Point, which shows just how aggressive cyberthreats are throughout world. Here, you can see the patterns of coordinated attacks. A war is underway. The soldiers are cyberwarriors. No country is safe. View the Live Cyber Threat Map.
JARVISS is designed to target criminal activity and provide natural disaster information in and around Army installations and stand-alone facilities, as well as COVID-19 threats. (Image: Steve Gardner/U.S. Army}
Fast Analysis in Real Time
Monitoring this information, analysts look for connections. If a plane veers off its flight path, the local operations center is notified. An automatic query shows if any critical-infrastructure assets or other important structures and facilities are in the area. The analyst can immediately find out the type of aircraft, the call sign, who the plane is registered to and who filed the flight plan. Weather radar can be overlaid to see if that is a possible reason for the deviation. Incident reports can be displayed in real time within the area of interest, along with social media feeds and other sources of communication. Traffic patterns can be displayed.
The important question that needs to be answered is whether this is a potential threat. Is there a connection to anything going on anywhere else? A dossier is developed on the person who filed the flight plan, the one who is assumed to be the pilot and the person or organization to which the plane is registered. All of this is being done in a matter of minutes, while the airplane either returns to its flight path or continues its diversion. The air traffic control tower is contacted to share information on the aircraft and its deviation. If the tower does not have an answer, it will radio the pilot for an answer. The passenger and crew manifest also are analyzed. All the data that can be pulled together — including the remaining fuel burn and the aircraft performance limitations — are analyzed.
Patterns emerge from the data. These patterns lead backwards to a cause and forward toward the end result. Finding those clues in the data requires a team of specialists from six primary intelligence disciplines.
An imagery intelligence analyst brings in the live-streams and remote sensing.
A human intelligence analyst seeks motivating factors and ways to deescalate the situation.
A measurements and signatures intelligence specialist defines the operating limitations and the mechanics and science particular to the scenario.
An open-source intelligence analyst accesses and queries open-source data sets to provide clues.
A signals intelligence specialist focuses on the communications and electronic signatures.
A geospatial intelligence analyst brings it all together and provides spatial context through the map the team uses that shows the events unfold in real time.
These analysts and sometimes many others will collect all these pieces of information and turn them into intelligence that decision-makers can use to take action. That is the purpose of intelligence; as CIA veteran Richard Heuer stated, “Intelligence seeks to illuminate the unknown.”
Fortunately, most alerts turn out to be false positives, but every one of them is treated as if it were “the one.” These false positives turn out to be excellent, real-world exercises that hone the skills of the team and wire the brain for speed. These events can last mere minutes or several hours. It’s an adrenaline rush.
To explore live streaming data feeds, Esri has a growing volume of data in its ArcGIS Living Atlas.
“My mind rebels at stagnation. Give me problems, give me work, give me the most abstruse cryptogram, or the most intricate analysis, and I am in my own proper atmosphere…”
— Sherlock Holmes, “The Sign of the Four,” Sir Arthur Conan Doyle
William Tewelow works for the Federal Aviation Administration. He is a graduate of a management fellowship program. While on special assignment to the U.S. Department of Transportation William led the project to crowdsource the National Address Database for the White House Open Data Partnership. He is a Geographic Information Systems Professional (GISP) and a Maryland Scholar STEMnet Speaker. He has a degree in Geographic Information Technology and Intelligence Studies from American Military University and is currently earning a degree in Organizational Leadership. William retired from the U.S. Navy after serving 23 years as a Geospatial and Imagery Intelligence Specialist, a Naval Aviator, a Meteorologist, and a Tactical Oceanographer. He was among the first in the nation to earn a Geospatial Specialist Certification from the U.S. Department of Labor while working at NASA Stennis Space Center in Mississippi. He is married, enjoys traveling, solving problems, playing with data, and fascinated by new technology and historical context. His favorite quote is, “A man’s mind changed by a new idea can never go back to its original dimension.” ~ Oliver Wendell Holmes