Category: Mapping

  • Tracking the Whirlwind: Mapping tornadoes using GIS

    Tracking the Whirlwind: Mapping tornadoes using GIS

    3:13 a.m. Pulsing alarms. NOAA weather alert: TORNADO WARNING! TAKE IMMEDIATE SHELTER!

    Without hesitation, the family awakened from their sleep, grabbed wallets, smartphones, car keys and hurriedly descended the stairs into the shelter. Doors sealed, the children crawled into their shelter beds.

    The mother and father, listening to the weather radio, heard their county’s name in the emergency broadcast. They looked at the smartphone’s weather map blinking with the text alert. A large swath of rain covered the area, painting yellows and reds inside a field of green. At the trailing edge of the storm, where skies were beginning to clear, the storm’s red tail began curling into a ball, moving directly toward them. Inside the ball, a dark red deepened into a growing magenta core. White pixels appeared within the magenta tail. Its path was unchanged and it was closing.

    The man and woman huddled together watching the storm radar app on his mobile device not thinking about how their situational awareness is a confluence of spatial wizardry and atmospheric thermodynamics. The WSR-88D NEXRAD (Level III) radar scans a 143-mile radius, sweeping 14 elevation angles every five minutes to create a composite view of the surrounding weather. Colors correspond to the intensity of reflected hydrometeors (forms of precipitation) ranging from 0 dBZ, light rain in blue and green, to 75 dBZ, hail in magenta, and at 95 dBZ, it is physical debris carried aloft showing as white. Assembling the radars from across the country creates a seamless national weather mosaic (weather.gov/Radar). The dot on the smartphone’s weather app marking their own position is GNSS, orbiting far above.

    In his hand both the NEXRAD and GNSS are blended in real-time as he watches the Tornado Vortex Signature (TVS) move toward his family and his house. Beyond the closed shelter doors, tornado sirens wail, mixed with peals of thunder. The warnings are no longer county names but names of towns. There are people for whom such a moment is not hypothetical. Scott Bagenzie knows exactly what comes next, not from imagination but from experience.

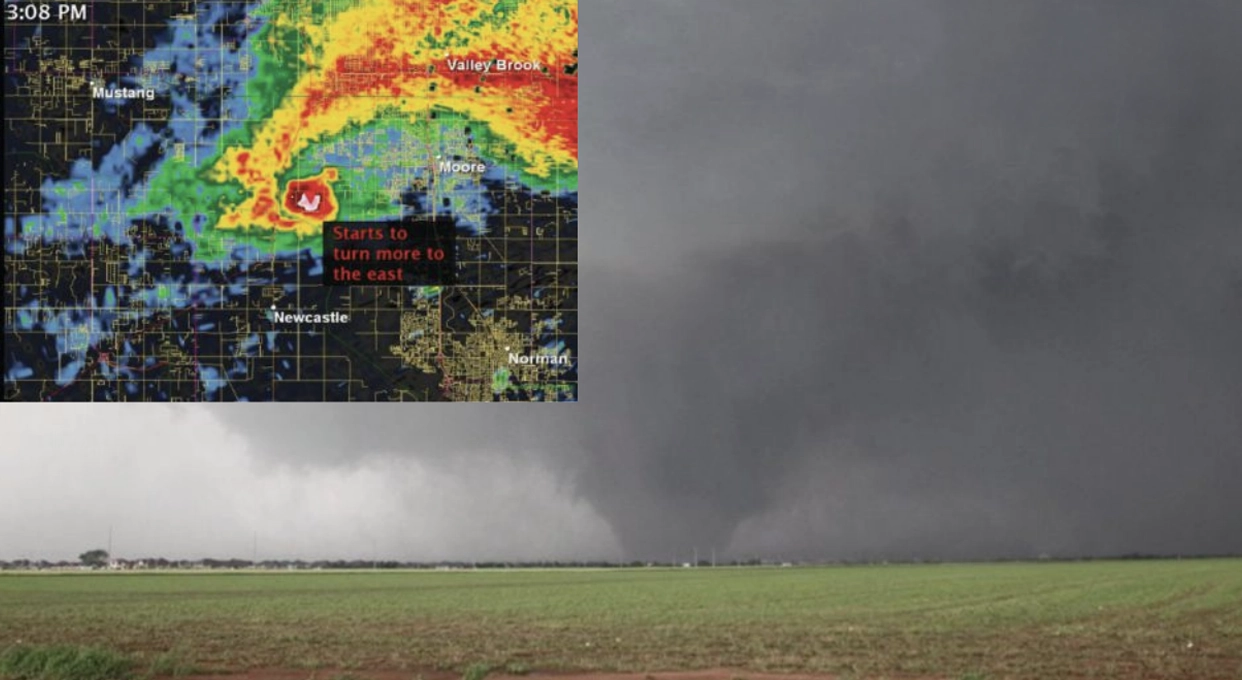
    On Monday, May 20, 2013, at 2:56 p.m. Central Time, an EF5 tornado touched down northwest of Newcastle, Oklahoma, rapidly intensifying as it carved a path to Moore. The tornado lasted 36 minutes and covered 17 miles (FIGURE 1). Scott was caught by it, and I had the privilege of hearing him tell me what it is actually like to be inside those moments of sheer terror the rest of us only read about. He left work at 2:15 p.m. despite National Weather Service warnings for the counties flanking Oklahoma City. As he closed his car door, the sirens at the Mike Monroney Aeronautical Center went off. Security tried stopping him. He drove anyway.

    “I was dodging cars left and right as people were taking pictures out to the southwest. I called Mari and said, hey, I’m running to the house to make sure the pets are taken care of. And she said, You crazy ***, take care of yourself.”

    He pulled into his driveway, secured two cats in the closet and the dogs in the front bathroom, then stepped outside to see where the tornado was. His neighbor, who had an underground shelter in his garage, called out from next door: Get in over here! Scott went. As soon as the latch clicked behind them, debris began hitting the house above.

    Weather as GIS

    Weather is the most common topic of greetings. It is often the front page on newspapers. Television news is incomplete without a weather report, and weather is among the most downloaded apps on smartphones.

    In many ways, the first GIS was weather, starting in the mid-1800s, long before computers, GNSS and GPS, hand-plotting data points, and then hand-drawing lines of equal pressure, temperature, humidity and winds on charts.

    In the 1990s as a U.S. Navy weather specialist, I drew these charts by hand, plus four upper air charts learning how 3D spatial volumes interact. That was manual GIS. Now, in 2026, weather continues leading geospatial innovation via phased array radars, dual-pole radars (horizontal and vertical scans), acoustic atmospheric sensors, and predictive modeling for weather and climate, all of them layering atmospheric data using complex algorithms to forecast a dynamic fluid medium moving over an irregular spinning sphere that is unevenly heated. It is remarkably accurate, pushing the edges of geospatial predictive modeling.

    The architecture of violence

    The primary driver of powerful tornadoes is atmospheric thermodynamics unique to North America. Dry air crossing over the Rockies, cold arctic air pulled south by the jet stream, and warm moist air drawn north from the Gulf of America converge in a cauldron that can boil a normal convective storm into a sustained mesoscale supercell producing EF-5 tornadoes, the most powerful on record. Even though they make up less than one percent of all tornadoes, it is rare for EF5 tornados to occur anywhere else on Earth.

    The Enhanced Fujita (EF) scale for measuring them was developed in 1971 by Theodore Fujita, a Japanese engineer whose forensic study of atomic bomb blast damage at Nagasaki and Hiroshima led to his damage-based framework for measuring tornado intensity.

    FIGURE 2 This NOAA chart shows a height of 250 millibars (mb) of pressure over Tornado Alley
in the U.S.  (Credit: William Tewelow | Chart from NOAA NWS)
    FIGURE 2 This NOAA chart shows a height of 250 millibars (mb) of pressure over Tornado Alley in the U.S. (Credit: William Tewelow | Chart from NOAA NWS)

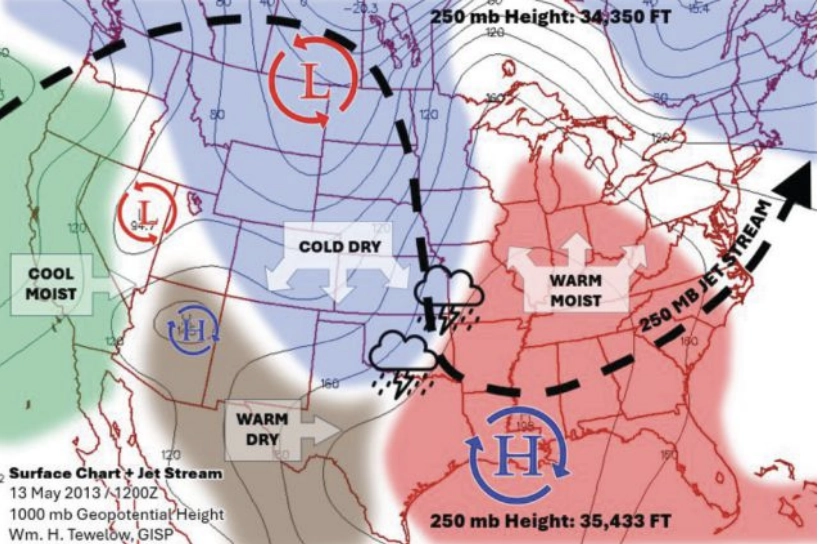
    The jet stream, a river of air riding a thermal pressure gradient in the upper atmosphere, creates vorticity as cold dense arctic air plummets south, wedging beneath the warmer Gulf air and forcing it upward along the frontal boundary, before the jet stream curves back north. FIGURE 2, the 300 mb (mb stands for millibars of pressure) chart, shows this process has caused a low pressure over Texas sitting in a 1,200-foot-deep ravine. A jet streak will form as air rushes into the ravine increasing the jet stream’s speed, which draws in rising convection currents that can spawn mesoscale storm cells and set up the potential genesis of severe tornadoes.

    When a funnel cloud forms, it is the visible physics of pressure dropping the temperature to the dew point causing condensation. The dropping pressure forms a bowl shape. Air flows into the dropping pressure, and the base of the cloud rotates cyclonically. As the rotation increases, centrifugal force of the colder dense rotating air pushes out the warmer higher-pressure air, further lowering the pressure at the core and deepening the bowl. That continues as the base descends into higher pressures at the surface, tightening the bowl into a cone. The difference in pressure between air outside the cone and what’s inside the vortex core can be 100 mb. That is basically a hole and wind rushes in to fill that void, but centrifugal force acts against the air. A tornado is born.

    Wraiths of destruction

    On May 31, 2013, 11 days after Moore, a multiple-vortex tornado formed near El Reno, Oklahoma. Along its periphery, small vortices spun around the rotating edge, circling, combining, breaking apart, vanishing and reforming, like wraiths of destruction dancing in a ring. The column darkened, descended and enveloped its own micro-vortices, forming the largest tornado ever recorded: 2.6 miles wide at its base.

    It grew so rapidly that experienced TWISTEX storm chasers attempting to place instrument disks behind it were consumed as it expanded from 1.6 miles to 2.6 miles wide. A father, his son, and a colleague were killed; their car was found eight miles away.

    Storm chasers are not thrill-seekers. WSR-88D NEXRAD, even at its lowest scan angle, already sits at 14,000 ft at its range limit because of the Earth’s curvature; spotters provide the ground truth radar cannot. Instruments such as Ground-based Local Infrasound Data Acquisition (GLINDA) extend that capability further: Tornadoes produce infrasound as low as 0.5 Hz, with a correlation between tornado size and frequency that may one day provide an early warning radar cannot.

    I asked Scott whether he felt the tornado before he heard it.

    “I couldn’t feel it,” he said, “but I could hear the sound of the train coming.”

    I pressed him to describe it beyond the cliché. He thought for a moment, then said, “It’s not a cliché. That is what it sounds like. It sounds like a freight train, and the sound of the house being torn apart.”

    The roar grows

    Back in the shelter, the physics unfolded exactly as Scott described. Unaware of the sensation, a deep groaning sound resonates miles ahead of the tornado. A low constant roar grows louder as it approaches. Explosions pop as transformers blow. The shelter is pitch black except for the phone screen, that small glowing window showing a white ball of catastrophe moving toward them. The roar grows louder. Ears pop. Temperature drops. The house shakes. The roar of the freight train is so loud the screams inside the shelter cannot be heard. The doors rattle. The whirlwind is trying to break in. Then the roar fades, almost to silence, an eerie quiet.

    In Scott’s shelter, the sequence was identical. His ears popped suddenly and painfully; they hurt for a full day afterward. In an EF5 tornado, pressure drops from roughly 950 mb in the surrounding air to 850 mb at the vortex core. The 100 mb passing over him was equal to a 3,000-ft pressure drop. It is the equivalent of instantly ascending two Empire State buildings stacked on top of each other, like falling straight up into the sky. Fighting against that force, Scott and his neighbor held shut the shelter latch as the doors bounced on their hinges.

    “I don’t know how well those are constructed. I didn’t take any chances.”

    Nearby, employees sheltering in a bank vault were physically holding the vault door closed as the tornado passed a thousand feet away. The vault’s timed lock could not engage. Five or six people leaned against a door designed to stop a robbery, fighting powerful thermodynamic forces.

    Then Scott no longer had to hold the latch. The truck on the other side of the garage wall had been pushed against the hatch from outside, pinning them in. When they finally forced it open and stepped out. There was nothing.

    “She just started screaming. She said, ‘No way, it didn’t do that.’ I told her, yeah, there’s nothing left.”

    The entire event, from first debris strike to silence, lasted roughly one minute. At 28 miles per hour, a tornado traverses one mile in two minutes, plowing through a neighborhood in seconds.

    Mapping the aftermath

    The question the rest of us ask from a safer distance is: What is the true pattern of destruction across time and geography? To answer it, I built a Tornado Severity Index (TSI) using National Weather Service tornado data. On average, there are 970 tornadoes per year, 81% are EF0 and EF1; 18% are EF2 and EF3; and the catastrophic EF4 and EF5 make up 1%.

    The NWS database reports the start and end coordinates, path width, magnitude, fatalities, injuries, and damages to property and crops. Working with the coordinate pairs, I calculated the distance and radial bearing of each path. But the EF scale alone tells only part of the story: A powerful tornado crossing an empty field and a moderate tornado crossing a dense neighborhood are not equivalent human events.

    I did not want the TSI to be another version of the EF scale, so the weighting was based entirely on the human toll. The formula is total fatalities (F) at 100% plus injuries (I) at 10%, =F + (I x 0.1) and normalized on a scale of 1 to 100. Economic damage was originally part of the equation, but the data are inconsistent and unreliable across reporting jurisdictions.

    FIGURE 3 The Tornado Severity Index (TSI) takes the human cost into account. (Credit: William Tewelow)
    FIGURE 3 The Tornado Severity Index (TSI) takes the human cost into account. (Credit: William Tewelow)

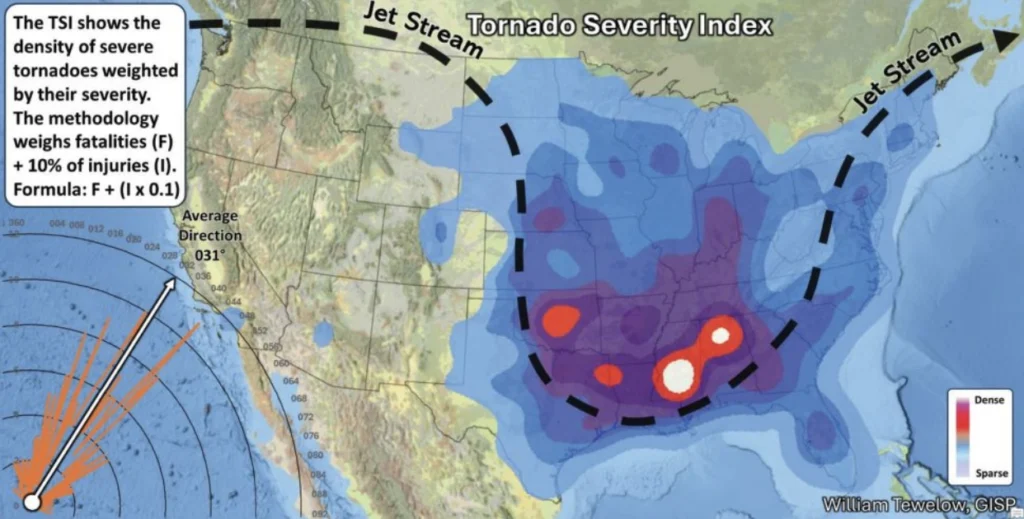
    The resulting composite doesn’t measure the strength of tornadoes, but rather their human impact (see FIGURE 3). The dataset of tornadoes from 1950 to 2024 is 71,813. Filtering it down to those tornadoes that had a human consequence where the TSI>1 reduced it to 2,362 tornadoes. I reduced it further to 1,625 including only those with one or more fatalities. This was made into a heatmap. The data were further reduced to 301, only filtering out all except where TSI>10. The heatmap color scale was weighted to the TSI Score. It shows where the highest concentration of intense tornadoes occurs.

    The results confirm Tornado Alley from Texas up through Oklahoma, and it also reveals Dixie Alley, an even more destructive corridor of severe tornadoes over Mississippi, Alabama and Tennessee. These areas align with the deep spring meridional jet stream discussed earlier. The northern side of the jet stream enhances cyclonic flow for storms in the area. The peak region of vorticity is where the jet stream turns back north again over Dixie Alley. Additionally, the rising terrain in that area causes orographic lifting and more rain, many times hiding the tornadoes within the pouring rain.

    GIS reveals what the physics predict: a narrow corridor of atmospheric geometry where conditions for catastrophic tornadoes are optimized, running through the same communities, year after year.

    For the sake of context, the Joplin, Missouri tornado on May 22, 2011, that caused 158 fatalities, 1,150 injuries, and damages of $2.8 billion ranks at the top of the TSI. The Moore tornado only scored 16.6 due to far fewer fatalities.

    The dataset reveals the physical signatures of severe tornadoes. On average, they peak in mid-May at 5:30 p.m. with a strength of EF4.2, carve a path 36 miles long and 2,073 feet wide, and each one causes 13 fatalities, 173 injuries, and losses of $71.5 million. Severe tornadoes do not travel west. They do travel a spectrum where most of them fall within a range from 016° to 060° with an average path of travel northeast at 031°. This is why Scott was right to question the reports of the El Reno tornado tracking southeast: What appeared to be southward motion was lateral growth. The tornado was not moving south; it was becoming enormous.

    “Pretty much sucking everything up,” Scott said, with confidence born out of his experience.

    The pattern and the person

    The TSI heatmap is a record of moments like Scott’s, representing a convergence of humans caught up in brutal atmospheric physics, where air becomes violent. The science explains the experience. It cannot prevent the next EF5; the thermodynamics will prevail.

    What GIS adds is pattern, memory and prediction. The TSI with directional analysis gives emergency managers, planners and underwriters insights for understanding where storm physics and humans intersect most acutely, and therefore where shelter codes and warning systems must be most robust.

    The family in their shelter, watching the white dot approach on the glowing screen, is experiencing the culmination of decades of geospatial and meteorological investment: NEXRAD networks, GNSS constellations, real-time data fusion in a consumer app. But as Scott will tell you, the most important instrument was the steel latch on the shelter door, and what mattered most was the neighbor who held it open for him as the tornado approached.

    Tornadoes are Earth’s thermodynamic engines of absolute chaos.

    “I’m not interested in tornadoes,” Scott told me. “Once burnt, you don’t play with the matches anymore.”

    Scott moved out of Oklahoma in 2013. The science is fascinating. People press right up to the edge of it, but the experience when science becomes personal is sheer terror.

    Live tracking tornadoes with GIS census tracts can know in real-time the impact on populations to immediately begin rescue operations, clean-up and recovery.

    GIS cannot capture the whirlwind, but it can track the most violent of them: northeast at 031°, seven football fields wide for 36 miles.

  • GNSS-IR aids in water-level research

    GNSS-IR aids in water-level research

    Cost-effective sensors from the University of Bonn are measuring water levels along rivers and coastlines in Africa and the Pacific region.

    Using a low-cost sensor and GNSS Interferometric Reflectometry (GNSS-IR), river water levels can be monitored around the clock. The water-level data are automatically transmitted via cellular networks to an analysis center.

    Researchers at the University of Bonn developed the method several years ago and tested it on the Lower Rhine. With support from the European Space Agency (ESA), the monitoring system is now also being used in Africa and the Asia-Pacific region.

    Researchers at the Institute of Geodesy and Geoinformation at the University of Bonn, led by Makan Karegar, have transferred water -level monitoring technology from the Rhine to Africa, Australia and the Philippines as part of ESA projects. Originally developed in the DFG Collaborative Research Center SFB 1502 (DETECT), the technology enables continuous, freely accessible monitoring of inland and coastal waters in data-poor regions worldwide.

    Active on three continents

    The technological centerpiece is the Raspberry Pi Reflector (RPR), a compact, solar-powered sensor developed at the University of Bonn. Using GNSS-IR, it measures water levels with centimeter-level accuracy.

    Only a portion of the signals emitted by the GNSS satellites is directly captured by the antenna. The rest is reflected by the water surface and reaches the receiver via this detour. When superimposed with the directly received signal, it forms specific patterns known as interference patterns. These can be used to calculate the distance from the antenna to the water surface.

    Each unit costs less than 800 euros, is powered by solar energy, and transmits data daily via mobile networks. “Modern gauge stations are prohibitively expensive, and conventional ones are highly vulnerable to flood damage,” said Makan Karegar, project manager. “These two factors together have left many countries in the global south with little to no ground-based water-level monitoring. The low-cost GNSS-IR sensor was developed precisely to address this gap.”

    CAMEO-WAGST Project

    The CAMEO-WAGST project (“Cameroon Advanced Measurements for Enhanced Observations of Water levels using Affordable GNSS-IR and Sentinel-3 & 6 Technology”) has established the first dedicated GNSS-IR network for monitoring water levels along coasts and rivers in Camroon and was funded by ESA. Between May and June 2025, researchers collaborated with Loudi Yap, director of the Research Laboratory in Geodesy at the National Institute of Cartography to install eight RPR sensors in Cameroon: two on the Sanaga River and six along the coast. “A lack of infrastructure for reliable hydrological and coastal monitoring in Cameroon has so far hindered effective flood risk management and early warning systems,” Yap said.

    This collaboration, under the umbrella of the EO Africa Research and Development Facility, is already bearing fruit, said Roelof Rietbroek, research coordinator at ESA’s EO Africa R&D Facility. “We hope this paves the way for more reliable monitoring of flood-prone regions in Africa.”

    St3TART-FO Project

    Building on this success, the follow-up project St3TART-FO also was launched in collaboration with ESA. A total of 17 RPR sensors will be installed in seven countries, including West Africa, Australia and the Philippines. “The goal is to create a freely accessible reference measurement network for calibrating satellite data,” Karegar said. For the first time, the network will provide continuous water-level data at previously unmonitored locations.

    The collaboration is based on years of scientific exchange between Africa and Europe. Partners include:

    • International Institute for Water and Environmental Engineering (2iE), Burkina Faso
    • National Institute of Cartography, Cameroon
    • Environmental Protection Authority (EPA), Ghana
    • Nigeria Hydrological Services Agency (NiHSA)
    • University of Maiduguri, Nigeria
    • Assane Seck University of Ziguinchor, Senegal
    • University of Southern Queensland, Australia
    • University of the Philippines Diliman.

    Technology Transfer and Capacity Building

    Both projects promote technology transfer and local capacity building through training, workshops and mentoring, enabling partner institutions to operate RPR networks independently. “We want to leave behind a sustainable monitoring capacity that is operated by local scientists and institutions, openly shared with the world, and maintained well into the future,” Karegar said.

    With financial support from the Transdisciplinary Research Area (TRA) “Sustainable Futures” at the University of Bonn, Karegar developed the open-access data platform gnss4surfacewater.com, which provides an independent, ground-based service for monitoring current and historical water levels using GNSS-IR. Also visit CAMEO-WAGST GitHub for code and field photos.

  • Update on NC 2022 reference frame working group: Preparing information for NC geospatial providers and users

    Update on NC 2022 reference frame working group: Preparing information for NC geospatial providers and users

    In my October 2025 GPS World Newsletter, I highlighted professional societies forming working groups for the new NSRS — the National Society of Surveyors (NSPS), the American Society of Photogrammetry and Remote Sensing (ASPRS), and the American Association for Geodetic Surveyor (AAGS). Under Gary Thompson’s leadership, the North Carolina Geodetic Survey also established the North Carolina 2022 Reference Frame Working Group (NC RFWG), which includes representatives from NC agencies that produce or use geospatial products and services. This newsletter spotlights several NC RFWG activities to inform and assist other agencies and working groups.

    As noted in my previous newsletter, NC RFWG agencies are proactively conducting self-assessments of their needs and processes to identify challenges and opportunities early, enabling a smooth transition and sustained operational efficiency. The working group meets monthly to review progress on activities.

    One key task of the working group was to develop a short online questionnaire. The goal was to open a dialogue with geospatial professionals and better understand their readiness for the upcoming modernization of the National Spatial Reference System (NSRS).

    The questionnaire was designed to address the following key questions:

    • Are you prepared to implement the new NSRS once the National Geodetic Survey (NGS) officially adopts it?
    • Do you have the necessary tools and resources in place to ensure a smooth transition?
    • Has your organization established a timeline for transitioning to the modernized NSRS?
    • What concerns do you have regarding the transition to the new NSRS?

    The section titled “Introduction of North Carolina Questionnaire” explains the purpose and background of the survey, while the section titled “North Carolina Online Questions” presents the list of questions included in the questionnaire.


    Introduction of the North Carolina Questionnaire

    This questionnaire seeks stakeholder input on the upcoming modernization of the National Spatial Reference System (NSRS). Your feedback is welcome on the proposed questions, as well as any concerns about the datum transition, tools (such as updated NCAT, OPUS, and SPCS2022), data transformation strategies, workflow impacts, and preparation needs.

    The National Geodetic Survey (NGS) is replacing the North American Datum of 1983 and the North American Vertical Datum of 1988 with new plate-fixed terrestrial reference frames (NATRF2022, PATRF2022, CATRF2022, and MATRF2022) tied to the International Terrestrial Reference Frame 2020, along with the new vertical datum, the North American-Pacific Geopotential Datum of 2022.

    In spring 2027, new horizontal and vertical datums will be implemented:

    Horizontal

    • North American Terrestrial Reference Frame (NATRF2022)
    • Replaces the North American Datum of 1983 (2011)

    Vertical

    • North American-Pacific Geopotential Datum of 2022 (NAPGD2022)
    • Replaces North American Vertical Datum of 1988

    Units

    • 14B NCAC 03 .0602 REQUIRED FOOT CONVERSION

    North Carolina Online Questions

    The section titled “Results of North Carolina Online Questionnaire” summarizes the survey responses collected as of April 27, 2026.

    [Note: NCPMA refers to the North Carolina Property Mappers Association, and LGUC refers to the North Carolina Local Government Committee.]


    Results of the North Carolina Online Questionnaire

    (April 27, 2026)


    This questionnaire solicited input from the North Carolina Property Mappers Association (NC PMA), the North Carolina Geographic Information Coordinating Council (GICC), and the North Carolina Local Government Committee (LGC). Although focused on North Carolina, the results may benefit other working groups. The NC working group is reviewing all feedback—especially regarding the Spring 2027 datum change—and will develop materials to address it.

    In addition to the questionnaire, the working group prepared a short guidance document on the new reference frames for local governments and state agencies. It outlines how to prepare for the 2027 datum change and covers:

    • Preliminary steps for transitioning when NGS and North Carolina officially adopt the new datums in 2027.
    • Actions users can take now to ready NSRS‑referenced data for the modernized NSRS and the shift from U.S. Survey Foot/International Foot.
    • Estimated coordinate changes with the 2027 adoption of:
      • North American Terrestrial Reference Frame (NATRF2022)
      • North American-Pacific Geopotential Datum of 2022 (NAPGD2022)
      • New national geoid model (Geoid2022)
      • North Carolina State Plane Coordinate System of 2022 (SPCS2022)
    • Current NC statewide digital orthoimagery acquisition cycle and statewide lidar collection schedule.
    • How the NC CORS and Real-Time Network (RTN) will support the modernized NSRS.
    • Web links to more detailed resources.


    The working group is developing a case study on preparing a FEMA Elevation Certificate using the modernized NSRS (NATRF2022 and NAPGD2022). It will be featured in upcoming newsletters. The North Carolina Geodetic Survey will host the materials on its website, and I’ll share the public link once it’s available.

  • Coloring the map to reduce visual drift in GNSS-denied navigation

    Coloring the map to reduce visual drift in GNSS-denied navigation

    Visual localization is widely used as a low-cost solution for autonomous driving, robotics, and mobile navigation. However, monocular systems remain vulnerable to illumination changes, weak texture, occlusion, motion blur and long-term drift.

    Existing map-based methods can reduce that drift by aligning camera observations with a prebuilt global map, yet many still struggle with redundant computation, weak cross-modal matching between camera images and point clouds, and optimization errors in large-scale or repetitive scenes.

    The challenge is especially important for lightweight platforms that cannot afford onboard lidar, inertial measurement unit (IMU) and heavy computing. Because of these problems, deeper research is needed on camera-only map-based localization that can stay accurate, efficient and stable in complex real-world environments.

    Overview of the proposed camera-only map-based localization framework. (Credit: Satellite Navigation)
    Overview of the proposed camera-only map-based localization framework. (Credit: Satellite Navigation)

    On April 20, researchers from Wuhan University and Chongqing University reported (DOI: 10.1186/s43020-026-00196-x) in Satellite Navigation a camera-only localization framework that uses prebuilt colored point cloud maps, a dual-sparsity matching strategy that retains high-gradient features in both the map and image observations, and hierarchical geometric–photometric optimization to improve both positioning accuracy and computational efficiency in GNSS-challenged environments.

    The system is built around two connected stages. First, the researchers generate a sparse colored point-cloud map from a denser map produced by lidar–IMU–camera mapping, keeping only high-gradient points that preserve visually salient structures while removing weak or redundant information.

    They apply a similar sparse selection process to online camera images, creating what the team calls “dual-sparsity matching” between map and observation. During localization, the method uses Lucas–Kanade optical flow to track sparse 2D image features and associates them with 3D map points, while hidden-point removal helps retain only the map points actually visible from the current viewpoint.

    The pose is then refined through an iterated error-state Kalman filter in two stages: a geometric PnP-style correction for stable coarse alignment, followed by photometric refinement using image intensity consistency for sub-pixel accuracy.

    Tests on the R3live and WHU-Motion datasets showed major gains over existing methods. Compared with direct sparse localization (DSL), the new approach cut absolute trajectory error (ATE) by 52% to 95% across challenging sequences, including a drop from 1.883 m to 0.152 m on R3live_5. It also improved accuracy by up to 76.6% over I2D-Loc++, reduced total processing time by as much as 47.7%, and remained robust in degenerate scenes where geometry-only localization deteriorated to 9.23 m while the proposed tracker held an ATE of 0.076 m.

    Ablation results further showed that colored maps, bidirectional sparsity, and hierarchical optimization each played a distinct role in achieving the final balance of speed, robustness, and precision.

    The authors said the main advance is not simply adding color to a map, but treating the global colored point cloud map as a continuous observation within the visual odometry framework. They said the framework shows that a monocular camera can localize far more robustly when paired with a prebuilt colored point cloud map and a coarse-to-fine optimization design that avoids poor local solutions.

    In their view, the study offers a practical middle ground between fully sensor-rich systems and fragile vision-only pipelines, preserving much of the accuracy benefit of map-based localization without demanding equally heavy hardware on the client platform.

    The work could have immediate value for indoor logistics robots, underground inspection platforms, warehouse vehicles, parking-garage navigation systems, and other low-cost autonomous agents operating where GNSS is weak or unavailable. Because the mapping can be completed offline and reused, the online platform needs only a monocular camera, which lowers sensing requirements while retaining strong global constraints.

    That makes the method especially attractive for scalable deployments in structured but challenging spaces such as tunnels, campuses, hospitals, and industrial facilities. More broadly, the study suggests that future navigation systems may become both lighter and more dependable by making better use of the information already shared between maps and images, rather than relying only on ever-larger sensor stacks.

  • Launchpad: Mapping applications, new IOT platform and more

    Launchpad: Mapping applications, new IOT platform and more

    A roundup of recent products in the GNSS and inertial positioning industry from the March-April 2026 issue of GPS World magazine.

    Surveying & Mapping

    Mapping Application: High-precision GNSS for IOS and Android smartphones

    Digital Mapping Group

    Image: Fastxy
    Image: Fastxy

    FastXY can transform standard mobile devices into professional-grade data collection tools for geospatial information systems (GIS) and architecture, engineering and construction (AEC) professionals. FastXY offers professionals the ability to collect point, line and polygon data, and delivers advanced capabilities including 3D basemaps, construction staking, topographic surveying, on-the-fly datum transformations and survey-grade elevations. A built-in Bluetooth data parser allows users to configure the app to collect data from virtually any instrument supporting BLE Bluetooth or RS-232 — including echosounders, radiation sensors, laser rangefinders, barcode scanners and more — and marry that data instantly with precise GNSS coordinates. Available in free and premium versions.

    Handheld scanner: Designed for BIM, indoor scanning and reality capture

    CHC Navigation

    Credit: CHC Navigation
    Credit: CHC Navigation

    The RS7 handheld SLAM (simultaneous localization and mapping) scanning solution was built for BIM documentation, indoor surveying, renovation planning and complex spatial analysis. It is designed to help professionals capture high-density 3D data efficiently and convert it into practical deliverables through CHCNAV’s software and cloud ecosystem. The RS7 integrates a next-generation lidar scanner capable of measuring up to 1.15 million points per second. Its wide field of view (360° x 189°) supports comprehensive coverage of floors, walls and ceilings, helping reduce the need for repeated passes and complex capture maneuvers in tight or cluttered spaces. The scanner also includes a high-precision inertial measurement unit with bias stability better than 0.5°/h. By combining lidar and inertial data, the system is designed to maintain stable motion estimation and consistent point-cloud quality in environments that challenge many mobile workflows, including long corridors, repetitive structures, and feature-limited interiors.

    Mobile scanner: All-in-one system offers SLAM, LIDAR, RTK and 360 degree imagery

    Emesent

    Credit: Emesent
    Credit: Emesent

    The GX1 is an integrated, highly accurate all-in-one mobile scanning system combining simultaneous localization and mapping (SLAM), lidar, real-time kinematic (RTK) georeferencing, cameras and software. It supports a seamless workflow, from capture to deliverable, and can reduce the time required to survey a site by up to 95%. The independently validated global accuracy of 5 mm to 10 mm
    delivers the precision needed for topographic and road surveying, scan to building information models, construction progress tracking, and more. These capabilities are supported by integrated RTK georeferencing with real-time quality monitoring, four 20MP cameras for 360° panoramic imagery, and a proven SLAM algorithm. The GX1 has four deployment modes — backpack, survey pole, vehicle mount and supported handheld.

    Quad-band GNSS rover: With support for Galileo high accuracy service

    SparkFun Electronics

    Image: SparkFun
    Image: SparkFun

    The SparkPNT TX2 quad-band GNSS rover combines an IP67-rated aluminum enclosure with support for Galileo’s High Accuracy Service (HAS) and standard RTK correction workflows. The receiver is built around the Quectel LG290P quad-band GNSS engine and supports multi-constellation tracking. Galileo HAS support provides sub-20 cm accuracy globally without subscription-based correction services, while RTK workflows via NTRIP or u-blox PointPerfect can achieve centimeter-level positioning. Battery life is rated at 50-plus hours, positioning the TX2 for multi-day field campaigns without recharging. The unit connects to iOS and Android devices via Bluetooth and WiFi, with compatibility reported for common GIS and data-collection applications. A notable design choice is the open-source firmware, which gives users visibility into how positioning data is processed and allows for customization and third-party integration. SparkFun has positioned this as an alternative to closed GNSS ecosystems where firmware and processing pipelines are not user-accessible.

    Mobile

    GNSS platform: Provides ultra-low power GNSS for all environments

    u-blox

    Image: u-blox
    Image: u-blox

    The u-blox F11 platform provides L1/L5 dual-band standardprecision GNSS to improve positioning accuracy while reducing power consumption to as low as 7 mW in typical configurations. It combines ultra-low power operation with intelligent signal management to meet the evolving demands of tracking, wearables, telematics and mobility applications — including micromobility solutions and drones. The platform enables device manufacturers to achieve longer battery life, faster and more reliable position fixes, and greater design flexibility. Its situationally aware GNSS architecture, with integrated geofencing and indoor detections, dynamically balance accuracy and power consumption. By selectively using dual band L1/L5 operation only when it helps maintain positioning performance, the platform reduces energy use while providing resilience and maintaining confidence in location data.

    IOT platform: Combines GNSS, SBD and LTE-M

    Iridium Communications

    Image: Iridium
    Image: Iridium

    The Iridium 9604 is a compact, threein-one internet of things (IoT) module that integrates Iridium short burst data satellite service, LTE-M cellular connectivity, and GNSS positioning into a single platform. The Iridium 9604 seeks to make dual-mode IoT connectivity viable for price-sensitive, high-volume deployments. Built on the u blox SARA-R5 platform, the module comes in a compact 16 mm x 26 mm x 2.4 mm form factor, suitable for dual-mode IoT deployments across industrial, infrastructure and mobility applications.

    L1+L5 GNSS modules: For trackers and high-precision IOT

    Telit Cinterion

    Image: Telit Cinterion
    Image: Telit Cinterion

    Two dual-band positioning modules built on Airoha’s AG3335 chipset series are available: the ultracompact SE873K5-D and the high-end SE869eK5-DRK. Both support space- and power-constrained IOT devices and use cases that require continuous, ultraprecise positioning. The modules provide a scalable path to adopt dual-band L1 + L5 GNSS.

    Timing

    Cesium-less clock: An alternative to cesium-accuracy holdover clocks

    Viavi Solutions

    Credit: Viavi
    Credit: Viavi

    The patent-pending Cesium-less ePRTC360+ holdover solution is designed to safeguard atrisk infrastructure against the increased threat of GNSS timing disruptions. It is the only alternative to Cesium clocks to meet ITU-T G.8272.1 standards. It can protect critical power grids; transportation, aviation and public safety systems; 5G mobile networks; and AI data centers. It meets the international ITU-T G.8272.1 standard and has been successfully tested across a range of livesky defense and commercial jamming/spoofing environments. It has been integrated into VIAVI’s SecurePNT 6200 product series and can maintain 100 ns accuracy during GNSS-denied threats through the resilient altGNSS GEO-L service with no time limit.

    Transportation

    MEMS IMU module: For vehicles, ships and drones

    Micro-Magic

    Credit: Micro-Magic
    Credit: Micro-Magic

    The U4930 series is a reliable and cost-effective six-axis microelectromechanical system (MEMS) and inertial measurement unit (IMU) module for navigation, control and measurement of vehicles, ships and drones. Applications include vehicle/ship
    attitude measurement, UAV attitude reference and trajectory control, mobile mapping, track inspection and underwater highprecision navigation. The U4930 series integrates high-performance MEMS gyroscopes and accelerometers within an independent structure. The three-axis MEMS gyroscopes sense the angular motion of the carrier, and the three-axis MEMS accelerometers sense the linear acceleration of the carrier. The system internally performs compensation for zero bias, scale factor, non-orthogonal error and acceleration-related terms across all temperature parameters, maintaining high measurement accuracy over a long period of time. The module supports custom communication protocols and provides synchronization for GPS/GNSS time data and pulse per second (PPS) signals.

    Underground navigation: For navigating mines and unmapped environments

    Advanced Navigation

    Image: Advanced Navigation
    Image: Advanced Navigation

    Chimera Land is a 3D laser velocity sensor (LVS) designed to solve the primary challenge for underground mining: maintaining precise vehicle positioning in deep,
    dark and unmapped environments where GPS cannot reach. When fused with an Advanced Navigation inertial navigation system (INS), Chimera Land allows underground vehicles to maintain stable navigation over extended distances and time. Instead of needing to query an external beacon or satellite for its location, the sensor uses specialized lasers to measure a vehicle’s ground-relative 3D velocity with high accuracy. By feeding this precise data into the vehicle’s INS, the sensor eliminates the drift that typically comes with standalone INS. Using AdNav Intelligence, the result is a resilient, high-performance, infrastructure-light positioning solution that excels in the highdust, zero-light conditions typical of underground mines.

    Simulators

    GNSS test tool: Provides real-world testing with signals from the field

    Spirent Communications

    Image: Spirent
    Image: Spirent

    The SimXTRACT GNSS test tool bridges the gap between field and laboratory. It enables signals captured in field environments to be comprehensively decomposed into individual, discrete signals and applied to lab simulation for realism at every stage of the development test cycle. Developers usually rely on either RF record-and-playback or lab simulation for testing and validation of PNT systems and devices. SimXTRACT takes real signals captured in field environments and performs complex signal decomposition, breaking down each received signal into discrete line-of-sight and multipath ray paths, along with metadata such as Doppler offset, code error, power level and angle of arrival. This decomposed environment is then automatically converted into fully controllable simulation scenarios for Spirent GNSS simulators.

    Autonomous

    Inertial measurement unit: For unmanned air, land and sea

    Honeywell Aerospace

    Image: Honeywell
    Image: Honeywell

    Honeywell launched the HGuide i700, an inertial measurement unit (IMU) that delivers high-accuracy performance for unmanned air, land and sea vehicles. By pairing near navigation-grade capability with a nolicense-required (NLR) classification, the HGuide i700 provides integrators worldwide with a new option for critical sensing and navigation. The HGuide i700 uses high reliability sensors and electronic architecture found in Honeywell’s HG3900 inertial measurement unit (IMU). Compact and low power, the HGuide i700 delivers near-navigationgrade accuracy and reliability while being optimized to support longer range navigation in GNSS-denied environments. The HGuide i700 offers strong GNSS-denied performance for by limiting maximum acceleration and spin rates in a license-free package. The latest in Honeywell’s HGuide suite of no-license inertial solutions, the HGuide i700 allows customers to streamline development cycles, simplify system architecture and transition to field deployment quickly. The HGuide i700’s rugged design, compact size and low-power profile make it suitable for diverse commercial, industrial and defense applications, including autonomous vehicles, mapping and surveying.

    Anti-jam antenna system: Provides multi-constellation, multi-frequency GNSS signal protection

    Hexagon | NovAtel

    Image: Hexagon
    Image: Hexagon

    The GAJT-AE3 protects all major GNSS constellations from jamming with full multiconstellation, multi-frequency coverage, ensuring reliable PNT in demanding airborne environments. Its antenna electronics mitigate interference by creating up to seven nulls per band in the direction of jammers, providing significant anti-jam protection even in dynamic multi-jammer scenarios. The output is a protected radio frequency signal, free from jamming and suitable for input to modern and legacy GNSS receivers. The GAJT-AE3 protects and supports all GNSS frequencies, including L-band corrections and Iridium PNT.

    OEM

    GNSS board: All-band multifrequency reception and HAS-ready

    Syslogic

    Credit: Syslogic
    Credit: Syslogic

    Syslogic’s new all-band GNSS expansion board for rugged embedded computers is powered by the u-blox X20 receiver. It supports all major GNSS constellations and frequencies, including L1, L2, L5, L6 and L-band, and enables the use of the Galileo High Accuracy Service (HAS). It provides centimeter-level positioning, opening up new applications across industries such as autonomous field management, operation of construction machinery in remote areas, or navigation of automated guided vehicles and autonomous mobile robots. The GNSS board is designed for worldwide use. The integrated u-blox receiver supports modern correction techniques such as RTK, PPP-RTK and PPP. For the first time, it has been fully optimized for PointPerfect Global, u-blox’s proprietary high-precision GNSS correction service, delivering centimeter-level positioning anywhere in the world. This is particularly useful in remote areas without cellular coverage.

    GNSS L1/L5 breakout: For meter-level positioning in embedded applications

    SparkFun Electronics

    Photo: SparkFun
    Photo: SparkFun

    The SparkFun GNSS L1/L5 Breakout – NEO-F10N (SMA) is a compact GNSS module designed for meter-level positioning accuracy in embedded applications. It uses dual-frequency L1 and L5 bands, with the L5 signal offering improved performance in urban environments due to reduced RF interference within the protected ARNS spectrum.


    The board supports concurrent reception of GPS, Galileo and BeiDou, and uses u blox dual-band multipath mitigation to enhance accuracy in challenging conditions. It features a single UART interface, with an onboard CH340 USB-to-serial converter for easy connection to a computer, and standard pin headers for integration with external systems.

    The module includes an SMA connector for secure antenna attachment and is configurable using u-blox u-center software.

  • UK scientists unite to map southwest coast seabed

    UK scientists unite to map southwest coast seabed

    The UK Centre for Seabed Mapping (UK CSM) will undertake a seabed mapping survey – CSM2026 – to explore and map the seabed along the UK’s southwest coastline.

    The research survey takes place between April 20 and May 19. It consists of two survey legs, starting in Lowestoft, Suffolk, and ending in Falmouth, Cornwall. Throughout the four-week survey, using cutting‑edge survey technology deployed from the Research Vessel Cefas Endeavour, a team of 26 scientists from across the field of maritime research began collecting vital hydrographic, geological and environmental data when they set sail from Lowestoft next week.

    The survey represents an unprecedented level of collaboration within the maritime sector. By combining skills and capabilities in a single survey, the team aim to secure data to deliver the UK government’s commitments and make advances in how the seabed is mapped, understood and managed.

    UK CSM includes more than 30 public sector organizations commited to collect and share high-quality marine data. For the coastline mapping project, the 11 involved are the Maritime and Coastguard Agency (MCA); the UK Hydrographic Office (UKHO); British Geological Survey (BGS); Centre for Environment, Fisheries and Aquaculture Science (Cefas); Department for Environment, Food & Rural Affairs (Defra), The Crown Estate; Historic England; Joint Nature Conservation Committee (JNCC); Agri-Food and Biosciences Institute, Northern Ireland (AFBI); Natural England and the Royal Navy.

    Over the course of the survey, the scientists on board will have the opportunity to work with experts from other public sector organizations, share skills, and source key seabed mapping data that supports a wide range of applications including offshore energy and infrastructure, marine ecosystem science, safety at sea, marine policy, and defense.

  • CHCNAV launches AlphaAir 6 long-range airborne lidar for UAV mapping

    CHCNAV launches AlphaAir 6 long-range airborne lidar for UAV mapping

    CHC Navigation (CHCNAV) has released the AlphaAir 6, a flagship airborne lidar system designed for UAV-based laser scanning, drone lidar mapping, and aerial surveying in high-relief and complex terrain.

    Combining prism scanning technology with a high-grade inertial navigation system (INS), the AlphaAir 6 delivers a maximum ranging capability of up to 2,100 meters and supports efficient data capture at typical flight altitudes of 400 to 600 meters above ground level.

    The AlphaAir 6 integrates an upgraded laser engine and a high-grade IMU with 0.3°/h bias stability to improve trajectory accuracy and point cloud quality. This design removes the need for pre-mission IMU calibration and supports stable, efficient data collection for topographic mapping, corridor mapping, and wide-area aerial survey workflows.

    The AlphaAir 6 combines fifth-generation real-time waveform processing with advanced multi-period technology to capture richer, denser, and more precise lidar data across complex terrain, vegetation, and built environments. According to CHCNAV, even at an ultra-high pulse repetition rate of 2,000,000 pulses per second, it continues to support real-time point cloud output, giving operators immediate in-flight visibility and a faster path to survey-grade 3D results.

    To meet different project requirements, the AlphaAir 6 is available in single-camera and dual-camera configurations. Both options use large-format CMOS sensors to deliver high-resolution imagery, while the dual-camera version adds an ultra-wide field of view to improve image coverage and increase mapping efficiency.

    With an integrated design and a weight of 1.35 kg, the AlphaAir 6 reduces payload burden on UAV platforms and helps extend flight endurance. Open interface protocols support integration with mainstream multirotor and fixed-wing UAVs, giving surveying and mapping professionals more flexibility across different mission types.

  • The GNSS revolution: From satellite signals to reality capture

    The GNSS revolution: From satellite signals to reality capture

    During a recent infrastructure survey, a handheld scanning system captured a multi-acre property in less than 15 minutes. As the operator moved through the site, the device continuously scanned the environment while maintaining centimeter-level positioning using satellite signals, inertial sensors and lidar.

    The result was a fully georeferenced three-dimensional dataset containing terrain, buildings, trees and infrastructure — captured in a fraction of the time required by traditional survey workflows. Technologies such as these illustrate how far positioning systems have evolved. What once required multiple instruments, control networks and extended field observation can now be accomplished through integrated sensing systems combining satellite navigation with reality capture.

    Yet, the foundation of these capabilities traces back more than six decades. Today, billions of devices depend on GNSS positioning. Smartphones, vehicles, aircraft, agricultural equipment and industrial systems rely on satellite signals to determine location and synchronize time. Within the geospatial industry, GNSS has evolved beyond navigation. It now serves as the spatial framework anchoring a growing ecosystem of sensors and measurement technologies capable of capturing the physical world in extraordinary detail.

    Receiver evolution and productivity

    While satellite constellations and positioning algorithms have steadily improved, many of the most noticeable changes for surveyors have occurred in the instruments themselves.

    Modern GNSS receivers are smaller and more efficient than earlier generations. Advances in electronics, antenna design, signal processing and battery technology have reduced size and power requirements while improving reliability and usability in the field.

    According to Chris Pappas, owner of Green Forest Surveys and a geospatial thought leader, recent GNSS receiver development has focused on usability rather than increases in raw positioning accuracy.

    “What I’ve seen lately is smaller receivers, longer battery life and smaller antenna sizes on the heads,” Pappas said. “The quality has basically remained the same.” These improvements may appear incremental, but they have meaningful impacts on field operations.

    Survey crews work in demanding environments such as steep terrain, construction sites, transportation corridors and remote infrastructure locations where equipment weight and power management affect productivity.

    “It’s portability. It’s fatigue from walking up a hill,” Pappas explained. “And the= longer battery life means you don’t have to constantly swap batteries or carry extras. You can take a single set with you and it’ll last all day.”

    Modern receivers also have benefited from advancements in satellite signals and correction services. Today’s survey-grade receivers routinely track multiple frequencies from multiple constellations.

    Miniaturization is not simply a reduction in size. Achieving multi-constellation tracking, multi-frequency processing and real-time correction required major advances in RF engineering and integrated circuit design.

    Capabilities that once required large, power-intensive hardware platforms are now integrated into compact receivers capable of operating an entire day on a single charge.

    Signal modernization, algorithms and the RTK engine

    While receiver hardware has become smaller and more power-efficient, some of the most significant advancements in GNSS performance have occurred in the algorithms and processing engines operating inside those devices.

    Modern receivers are specialized computing platforms designed to process signals from multiple constellations, frequencies and correction sources simultaneously. Tracking multiple constellations enables receivers to observe dozens of satellites while reducing ionospheric and multipath errors.

    The real breakthrough, however, has come from improvements in the RTK engine itself.

    RTK positioning relies on resolving the carrier-phase ambiguities — the unknown integer number of wavelengths between the satellite and the receiver. Earlier RTK systems often required extended initialization periods.

    Modern receivers use more sophisticated ambiguity resolution algorithms that leverage multi-frequency observations and improved statistical modeling. Initialization times have dropped, and solutions are more robust in difficult environments.

    Modern RTK engines incorporate advanced filtering techniques, stochastic modeling and automated outlier detection to maintain stable solutions when individual observations become unreliable.

    These improvements are particularly important as surveyors increasingly work in environments where GNSS conditions are less than ideal. Urban infrastructure, tree canopy and industrial facilities can obstruct satellite signals and introduce multipath errors.

    Advanced filtering architectures allow receivers to reject corrupted observations while maintaining stable positioning using valid measurements.

    Many modern receivers incorporate Kalman filtering frameworks that continuously estimate position, velocity, clock bias and measurement uncertainties.

    These filters allow GNSS measurements to be integrated with inertial sensors and motion constraints, creating more stable positioning solutions.

    Network-based correction services also have become increasingly common. Rather than relying solely on a nearby base station, many surveyors now use network RTK systems that aggregate observations from multiple reference stations across a region.

    These networks model atmospheric errors and deliver corrections through cellular or internet connections.

    Precise point positioning (PPP) techniques, which use precise orbit and clock information rather than local base stations, also have matured significantly. Modern PPP engines can now resolve centimeter level positioning in real time or near real time, something that only a few years ago could take up to an hour using satellite based augmentation.

    These advances have been enabled by the evolution of GNSS chipsets. Modern receivers integrate RF front ends, signal processors and navigation engines into compact system-on-chip architectures capable of tracking dozens of signals while running complex positioning algorithms in real time.

    The result is a positioning engine that is no longer confined to a single receiver mounted on a survey pole, but operates as the central reference system for a network of sensors capturing complex environments.

    The maturity of the modern positioning engine

    One of the less visible but most important developments in GNSS over the past decade is the maturation of the positioning engine itself. Early GNSS receivers were essentially signal trackers paired with simple navigation algorithms. Today’s receivers function more like specialized computing platforms optimized for real time estimation.

    At the core of these systems is an estimation framework that continuously evaluates the quality of each observation entering the solution. Carrier phase measurements provide the highest precision available from GNSS, but are highly sensitive to noise, multipath and signal interruptions.

    Modern RTK engines must balance precision with reliability. Rather than assuming every observation is equally valid, processing engines assign dynamic weights based on signal strength, satellite geometry, atmospheric models and measurement stability. These approaches allow receivers to maintain accurate positioning even when portions of the satellite environment become unreliable.

    Solar storms, such as this one in North Carolina, produce beautiful
auroras. They also cause signal disruption and interference for GNSS
systems. Many of the modern RTK engines now have the ability to
filter out this interference and maintain a fix.

    Solar storms, such as this one in North Carolina, produce beautiful auroras. They also cause signal disruption and interference for GNSS systems. Many of the modern RTK engines now have the ability to filter out this interference and maintain a fix.

    The introduction of multi frequency signals also has changed how ambiguity resolution is performed. Earlier RTK systems relied on dual-frequency measurements to estimate ionospheric delay and resolve integer ambiguities. With additional frequencies across multiple constellations, modern receivers apply more advanced ambiguity resolution strategies that improve convergence speed. In practical terms, this means surveyors spend less time waiting for initialization and more time collecting data.

    Modern receivers also incorporate tightly integrated filtering architectures. Extended Kalman filtering frameworks continuously estimate position, velocity, clock bias, atmospheric parameters and measurement noise. These models treat positioning as a dynamic estimation problem rather than a static calculation performed at each epoch. The result is a positioning engine capable of maintaining stable centimeter level solutions even when signal conditions fluctuate. For surveyors working in environments with partial satellite obstruction, intermittent multipath or complex site conditions, these improvements often determine whether a day in the field is productive or not.

    GNSS as foundational infrastructure

    Today, GNSS occupies a unique position in the technology landscape. It is both a mature infrastructure system and a platform for continued innovation. The fundamental architecture of satellite navigation has remained largely consistent for decades, while the ecosystem built around those signals has expanded dramatically.

    In many ways, GNSS has become invisible because it works so well. Surveyors, engineers and geospatial professionals interact with receivers, correction services and data products rather than with the satellites themselves. Positioning is expected to function, much like electricity or cellular connectivity. But under that routine operation lies one of the most sophisticated global infrastructure systems ever constructed.

    At the space segment level, multiple international constellations provide overlapping coverage. The United States’ GPS, Russia’s GLONASS, Europe’s Galileo and China’s BeiDou systems transmit modernized signals designed to improve accuracy, reliability and interoperability. Regional systems such as Japan’s QZSS and India’s NavIC further strengthen coverage.

    This multi-constellation environment represents one of the most significant changes in the GNSS landscape throughout the past two decades. Early survey grade receivers relied primarily on GPS signals, while modern receivers track four or more global constellations simultaneously.

    The impact extends beyond redundancy. Observing more satellites improves geometric strength and allows receivers to maintain robust solutions in environments where single constellation systems would struggle, including urban corridors, forested areas and complex infrastructure sites.

    Signal modernization has expanded the range of measurements available to positioning engines. Additional civilian frequencies such as GPS L5 and Galileo E5 allow better modeling of ionospheric effects and reduced measurement noise, contributing to more stable positioning solutions.

    The most important shift, however, is not in the satellites themselves, but in GNSS’s role within the broader measurement ecosystem.

    In the surveying and geospatial industries, GNSS has evolved from a standalone measurement technique into the spatial reference framework for modern data capture technologies. It now anchors measurement platforms capable of capturing millions of spatial observations.

    In traditional surveying, GNSS remains a primary method for establishing control networks and geodetic reference points, with RTK and post-processed kinematic techniques routinely achieving centimeter-level accuracy.

    In construction and machine control, GNSS enables automated positioning systems that guide heavy equipment using digital terrain models in real time.

    In agriculture, precision farming systems use satellite positioning to guide equipment along exact paths, reducing fuel consumption and optimizing inputs.

    GNSS also functions as the primary time synchronization system for critical infrastructure, including telecommunications, financial systems and power grids.

    For geospatial professionals, the most significant change is how GNSS interacts with emerging measurement technologies. Rather than acting as a standalone sensor, it now operates as the global reference frame for integrated systems.

    The satellite-derived position establishes a coordinate foundation that other sensors use to build dense spatial models. In a typical workflow, GNSS establishes the reference, inertial sensors track motion, lidar captures geometry and cameras record imagery. All observations rely on the GNSS reference frame to maintain spatial consistency.

    This enables a shift from discrete point measurement to continuous data capture. Instead of collecting individual points, modern platforms capture millions of observations that can be analyzed and extracted as needed.

    GNSS remains the backbone of this process. Even as new sensors emerge, the requirement for a stable global reference frame has not changed. GNSS provides that anchor.

    Sensor fusion and the expanding positioning stack

    While GNSS technology continues to evolve, some of the most significant advances in positioning are occurring through integration with other sensing technologies.

    Trees, such as this 150-year-old tulip poplar, were killers of previous-generation GNSS systems. Robust designs, the modern sensor stack, and powerful algorithms
can now fix reliably in heavy canopy, saving hours of traditional work.

    Trees, such as this 150-year-old tulip poplar, were killers of previous-generation GNSS systems. Robust designs, the modern sensor stack, and powerful algorithms can now fix reliably in heavy canopy, saving hours of traditional work.

    Modern positioning systems operate as part of a broader sensor ecosystem. Satellite observations provide the global reference frame, while inertial measurement units track motion and orientation, lidar sensors capture geometry and visual sensors analyze environmental features.

    Hybrid platforms extend GNSS capability into environments where satellite signals alone may struggle. Several manufacturers now offer handheld systems that combine GNSS receivers with lidar scanning and inertial navigation. Systems such as the CHC Navigation VLi100 integrate GNSS, lidar, inertial sensing and visual positioning into a single instrument. The VLi100 also incorporates the SureFix 2.0 engine, which uses lidar to stabilize the GNSS position for up to 60 ft after signal loss, extending positioning capability in obstructed environments.

    The Tersus S1 SLAM system similarly combines lidar-based mapping with GNSS positioning to capture dense spatial data in complex environments.

    The same principles drive mobile mapping systems designed for infrastructure-scale data capture. Trimble’s MX series, including the MX9 and MX90, combines GNSS positioning, high-accuracy inertial navigation and high-density lidar to capture detailed spatial data while in motion.

    “Sensor fusion is probably the biggest one right now,” said Justin Brooks, sales manager for reality capture at Trimble. “When you combine GNSS with lidar and inertial sensors, you’re not just collecting points anymore. You’re capturing entire environments.”

    Mobile mapping is increasingly used across the energy sector. According to Jason Rosbach, director, energy solutions at Trimble, large renewable energy projects such as utility scale solar and wind developments require rapid spatial documentation across thousands of acres. These systems allow survey teams to capture dense geospatial datasets while maintaining consistent positioning through tightly integrated GNSS and inertial navigation.

    Karl Bradshaw, director, product management, reality capture at Trimble, explained that GNSS remains the core reference.

    “In the MX systems, that GNSS position is the initial core point,” Bradshaw said. “Then the IMU interpolates the vehicle path between those GNSS fixes and provides heading, pitch and roll orientation. Every lidar pulse gets geolocated using that combined solution.”

    Reality capture and the GNSS positioning pyramid

    The convergence of GNSS positioning with lidar scanning, inertial navigation, and SLAM-based mapping is driving the broader adoption of reality capture workflows across the geospatial and infrastructure industries.

    At the core of these systems remains a GNSS-centric positioning pyramid. Satellite observations provide the spatial reference that anchors all other measurements. The additional sensors extend and stabilize that position when conditions become challenging.

    From point measurement to spatial data acquisition

    The integration of GNSS with modern sensing technologies has changed the scale of spatial data collection.

    For most of the 20th century, surveying workflows were based on discrete point measurements. Whether using optical instruments, total stations or early GNSS receivers, surveyors collected individual observations that were later combined to construct maps and models.

    This approach remains essential for control networks and boundary surveys, but many modern applications now operate at a fundamentally different level of data density.

    Lidar scanners, mobile mapping systems and handheld SLAM platforms can collect millions of measurements in minutes. Instead of selecting points, operators move through an environment while continuously capturing geometric observations. These datasets provide a far more detailed representation of the physical world.

    GNSS enables this transition by providing a stable global reference frame. Without it, large point clouds and reality capture datasets would exist only as isolated local models. GNSS allows these datasets to align with engineering design files, geographic information system (GIS) databases and previous survey measurements.

    This spatial consistency makes reality capture practical for large infrastructure projects. Transportation departments can compare roadway conditions over time, utilities can integrate asset models and construction teams can verify progress against design.

    In each of these workflows, GNSS provides the coordinate framework that keeps datasets aligned across time, sensors and project stages.

    The shift from point measurement to continuous data acquisition is one of the most significant changes in geospatial practice in decades.

    Even within these systems, positioning still begins with satellite signals. GNSS remains the foundation. Lidar captures geometry, inertial sensors measure motion and SLAM algorithms track environmental features, all fused with the GNSS position.

    These systems collect dense spatial observations continuously, allowing entire corridors, facilities and infrastructure sites to be captured rapidly. Because these datasets are anchored to GNSS positioning, they maintain consistent spatial reference over time.

    Looking ahead

    Another development drawing increasing attention across the positioning industry is the emergence of low Earth orbit (LEO) satellite constellations as potential complements to traditional GNSS systems.

    Unlike GNSS satellites operating at medium-Earth orbit altitudes of roughly 20,000 kilometers, LEO satellites orbit much closer to Earth. This proximity allows their signals to reach receivers with significantly higher signal strength and faster acquisition times.

    Because the satellites move rapidly across the sky, they also provide constantly changing geometry that can improve positioning performance in environments where traditional GNSS signals struggle.

    A number of research groups and commercial companies are now exploring how LEO constellations might augment existing GNSS infrastructure. Some approaches rely on signals from existing communications constellations, while others involve dedicated navigation payloads designed specifically for positioning.

    For surveyors and geospatial professionals, the potential benefit is improved positioning reliability in environments where GNSS signals are degraded. Urban corridors, industrial sites and areas with heavy canopy often limit satellite visibility and introduce multipath interference that complicates carrier-phase measurements.

    Additional signals from LEO satellites could provide stronger observations in these environments while also improving the redundancy of positioning solutions.

    The integration of LEO signals would not replace GNSS but rather expand the broader positioning ecosystem that already has begun to emerge through sensor fusion.

    Modern positioning systems increasingly combine GNSS, inertial navigation, lidar, camera and SLAMbased mapping into tightly integrated sensor stacks. GNSS provides the global reference frame, while the other sensors extend and stabilize the positioning solution when satellite visibility becomes limited.

    If LEO navigation signals become widely available, they will likely become another layer within that stack.

    The long-term result could be positioning systems capable of maintaining centimeter-level trajectories across environments that would have been extremely difficult for GNSS-only solutions just a decade ago.

    For the geospatial industry, this evolution represents a continuation of a trend that began decades ago: positioning systems becoming more robust, more integrated, and increasingly capable of capturing the physical world in unprecedented detail.

  • Society of Land Surveyors of Iowa annual meeting recap

    Society of Land Surveyors of Iowa annual meeting recap

    In my February GPS World newsletter, I highlighted that the National Geodetic Survey (NGS) staff participated in GeoWeek 2026 in Denver.  They engaged with geospatial product and service users and provided the latest updates on the status of the modernization.  On March 25, 2026, as President of American Association for Geodetic Surveying (AAGS), I participated in a GeoWeek webinar titled “NSRS Modernization is Here: What Surveyors Need to Know Now.”

    The webinar was based on presentations by NGS and others at GeoWeek 2026.  The webinar provided the status of NGS’s new modernized NSRS and the professional societies (AAGS, ASCE, ASPRS, and NSPS) addressed how they are helping others to prepare for the change. It is available to everyone under the “On-Demand Webinars” section of Geo Week News here: https://www.geoweeknews.com/webinars.

    This newsletter will highlight the 2026 Society of Land Surveyors of Iowa (SLSI) Annual Meeting, which I had the opportunity to attend at the SLSI 89th Annual Land Surveyors Conference, held on March 4-6, 2026, in Ames, IA.

    First, at the end of February’s newsletter, I shared my main thoughts and concerns that I believe NGS and the broader community should carefully consider before NGS adopts the new modernized NSRS.

    I encourage you to watch the GeoWeek Webinar mentioned above for the latest update from NGS on the modernized NSRS.

    I have already shared my concerns directly with NGS, but it’s important that they also hear from the user community. You can provide feedback via [email protected], user forums, or upcoming webinars and Q&A sessions.

    Although I covered these points in my last newsletter, I believe they remain important, so here’s a shorter version of my key thoughts and concerns:

    • Timeline uncertainty: Clearer, more frequent milestone updates (beyond the Track Our Progress page) would help manage expectations.
    • OPUS and processing continuity: NGS should commit to a longer grace period — or ideally a defined parallel support window — for legacy OPUS tools (particularly OPUS-Projects 5) after the official adoption of the modernized NSRS.
    • Data access and usability in the new DDS: The new web-based system needs to provide robust APIs or export options that are comparable to those in current datasheets/legacy tools.  
    • Transformation tools and legacy data handling: Users need confidence that transformations minimize errors, especially in deformation-prone areas.
    • Communication and outreach: Case studies, training resources, and FAQs that describe real-world practical examples, tailored to common workflows, need to be developed and documented.

    Again, I encourage anyone reading this (including NGS staff) to test the beta products actively, submit detailed feedback, and participate in forums/Q&As. The community input will make or break the success of this once-in-a-generation update


    Regarding the 2026 Society of Land Surveyors of Iowa (SLSI) Annual Meeting, I was grateful to receive the invitation and truly enjoyed attending. As always, I came away from this gathering of surveyors with valuable insights.

    The conference was exceptionally well organized, with plenty of time for meaningful interactions among attendees, exhibitors, and speakers. In total, 285 people attended.

    As expected, I presented on the new modernized NSRS. The topics I covered are listed in the box titled “Topics Addressed During my ½ Day Session on the New NSRS.”

    I was fortunate to have Ben Sullivan, Seiler Geospatial, set the stage for my presentation by providing a short introduction to the new modernized NSRS.  He provided an overview that addressed: (1) what the new national datum is, (2) how it will affect the geospatial community, and (3) how users can prepare for it once officially released by the NGS.


    Topics Addressed During My Half-Day Session on the New NSRS

    1. What to expect between NAD 83 (2011) and NATRF2022 in Iowa?
      • Why is NGS modernizing the NSRS and what are the expected coordinate changes in Iowa?
      • How are reference frames and datums defined?
      • What are the differences in CORS coordinates between the Multi-year CORS Solution 2 (MYCS2) and Multi-year CORS Solution 3 (MYCS 3) in Iowa?
      • What does NGS mean by time-dependent coordinates and why is it necessary for the new, modernized NSRS?
      • How will plate tectonics be handled in the new, modernized NSRS?
      • What’s the difference between NAD 83 (2011) epoch 2010.0 and NATRF2022 epoch 2020.0 in Iowa?
      • What are the differences between Reference Epoch Coordinates (REC) and Survey Epoch Coordinates (SEC)?
      • What’s the difference between ITRF2020 and NATRF2022 in Iowa?
      • How do you use NCAT to convert between reference frames and compute State Plane Coordinates?
      • Why is it important to have the appropriate metadata of your old projects for the implementation of the new, modernized NSRS?
    2. What to expect between NAVD 88 and NAPGD2022 in Iowa?
      • How will orthometric heights be determined in the new, modernized NSRS; that is, how will NAPGD2022 orthometric heights be determined in the new NSRS?
      • Review of Computing GNSS-Derived Heights
      • What’s the estimated difference between NAVD 88 and NAPGD2022 epoch 2020.0 in Iowa?
      • How will NAPGD2022 Orthometric heights be determined using GEOID2022?
      • What are the differences between GEOID2022 models and Hybrid Geoid Model GEOID18 in Iowa?
      • How will NAPGD2022 affect the National Flood Insurance Program and the Elevation Certificate?
    3. Updates from the National Geodetic Survey at GeoWeek 2026

    Many of the topics covered in my session have been addressed in previous newsletters. For example:

    • My June 2020 newsletter explained how NAPGD2022 orthometric heights will be determined using GEOID2022, and why NGS will require GNSS occupations on primary marks when submitting leveling projects.
    • My October 2022 newsletter discussed NGS’s Multi-year CORS Solution 3 (MYCS 3).
    • My August 2022 newsletter covered Reference Epoch Coordinates (REC) and Survey Epoch Coordinates (SEC).
    • My March 2026 GPS World newsletter addressed the updates from NGS presented at GeoWeek 2026.

    Whenever I attend conferences, I visit exhibitors to ask about the modernized NSRS. Many had heard of it, but only a few could explain the differences or how their company will adapt products and services to the new reference frames. Several said their company is aware of the change but couldn’t specify how or when they’ll respond. I encourage all users to contact their equipment and software providers and request a detailed plan for addressing the new NSRS.

    I want to highlight two sessions I found both very interesting and important for surveyors. They were presented by Todd Horton, PE, PLS of Meridian Geospatial.


    Meridian Geospatial Consulting   Todd Horton, PE, PLS, is the owner of Meridian Geospatial Consulting, LLC.  Todd has provided technician training and continuing education seminars for the land surveying industry since 2005.   Todd served in the US Air Force and with the Illinois Department of Transportation in planning, design, construction, surveying and maintenance of civil engineering projects including commercial structures, airfields, utility systems and highways.  He joined the full-time faculty at Parkland College in Champaign, IL, where he taught land surveying and construction management courses for 25 years. Todd founded the land surveying associate degree program at Parkland College in 2001.   Having retired from full-time teaching, Todd has joined Farnsworth Group Inc. as a part-time senior project land surveyor.  You can reach him at [email protected].   (From https://www.meridiangeospatial.com/)

    One of Horton’s presentations was titled “Professional Ethics.” In it, he highlighted how new technology is reducing the size of surveying crews and improving overall efficiency. However, this comes at the cost of reduced opportunities for mentoring the next generation of survey technicians and surveyors.

    I’ve recreated his diagram below to illustrate the issue.

    Crew Size vs. Mentorship

    Crew vs Mentorship. (Recreated from Todd Horton presentation)
    Crew vs Mentorship. (Recreated from Todd Horton’s presentation)

    As shown in Horton’s diagram, while new technology increases efficiency and allows for smaller survey crews, it also reduces the time available for surveyors to mentor technicians and the next generation of professionals.

    Training and mentoring are extremely important for the continued growth and development of individuals in the surveying and mapping community.

    He explained that the world consists of two types of individuals: specialists, who have a narrow skill set and limited opportunities, and generalists, who possess broader knowledge and skills, think multi-faceted, and are forward-looking.

    He emphasized that a professional surveyor typically needs 3 to 5 surveying technicians to successfully complete a project. While professional surveyors regularly attend training sessions (as evidenced by many participants at this conference), technicians often have little or no access to formal training.

    He advocated that technicians should be trained as generalists. This means equipping them not only with better tools and equipment, but also with a strong foundational knowledge and skill set — especially understanding the “why” behind the “how.” This deeper knowledge enables them to prevent problems before they occur and effectively troubleshoot issues when they arise.

    I addressed this same concern in my November 2022 newsletter, where I warned that the industry is creating a growing number of “buttonologists” — technicians who rely heavily on pushing buttons without deeper understanding.

    This trend concerned me then, and it still does today. That’s why I was especially pleased to hear Todd directly address the issue and offer a clear path forward for improving training and development for both technicians and surveyors.


    Excerpt from November 2022 GPS World Survey Scene Newsletter

    A participant at one of my workshops stated that “GPS has made geodesists out of all of us.” In my opinion, the advancements in GNSS equipment and processing software provided some users with a “false sense of knowledge or security” that they understood what was happening within the “black box.” One of my colleagues at NGS said that the new equipment and software programs were creating a field force of “buttonologists.”


    He highlighted that the surveying community needs more technicians than licensed professionals. As a result, we should prioritize training and development for technicians. This is a constant need and would help reduce turnover rates.

    He also emphasized the importance of growing future professionals from within the technical ranks. Doing so would increase technicians’ motivation and desire for advancement, making them more eager to take on greater responsibility and pursue professional growth.

    He provided the following training approaches:

    • On-the-job training
    • Self-guided study
    • Continuing education resources
    • Online content
    • College courses
    • Live skill training

    He noted that these investments in training will yield the following advantages in professional and organizational development:

    • Enhanced employee skills
    • Opportunities for career advancement
    • Stronger organizational performance
    • Sustained competitiveness via continuous learning
    • Increased productivity
    • Higher employee retention
    • A thriving culture of innovation

    Horton also discussed a training program he’s involved in that not only trains technicians but also includes training for the trainers. This “train-the-trainer” approach helps accelerate the program’s growth and impact.

    For more information, I encourage you to reach out to Horton directly for additional details about his programs and his ideas on improving technician training.

    Horton also gave a very good session on a very difficult subject, that is ALTA/NSPS “Relative Positional Precision (RPP).”  

    As a side note: see the box titled “Top 5 Key Changes in the 2026 ALTA/NSPS Standards” for the key changes in the 2026 ALTA/NSPS standards. Detailed information on the ALTA/NSPS 2026 document can be downloaded at the following NSPS weblink: https://nsps.us.com/page/2026ALTA.


    Top 5 Key Changes in the 2026 ALTA/NSPS Standards

    1. Precision (RPP): The clarification of RPP is a core technical change. While it does not alter how surveys are performed, it improves consistency and understanding of measurement quality expectations across the profession.
    2. Shift from “on the ground” to “practices generally recognized as acceptable” (Sections 5 & 6): This is one of the most significant forward-looking changes. It explicitly accommodates modern technologies such as drones, lidar and future tools (including AI), without locking the standards to specific methods.
    3. Expanded guidance on sourcing title evidence when a recent title commitment is unavailable: This change directly affects research responsibilities and risk management, especially on projects where title information is incomplete, delayed, or unconventional.
    4. Requirement to note evidence of possession or occupation along the entire perimeter: This materially broadens what must be considered and documented in the field, regardless of how close that evidence is to the boundary line – an important title-risk issue.
    5. Clarification that verbal (“parol”) statements must be noted when made: This adds explicit documentation requirements tied to conversations with landowners or occupants, which can be critical in dispute resolution and liability defense.

    Todd started his presentation by providing RPP as defined by ALTA/NSPS (2026):

    • Relative Positional Precision (RPP) is the acceptable indicator of measurement quality on an ALTA.NSPS Land Title Survey.
    • It is defined as the length of the semi-major axis, expressed in meters or feet, of the error ellipse of the line connecting the monuments or witnesses marking adjacent boundary corners of the surveyed property at the 95 percent confidence level.

    His session was organized into nine sections labeled RPP Keys for Success:

    1. Choose one equipment and a measurement method based on the accuracy needs of the project.
    2. Use well-adjusted instruments and procedures to eliminate systematic errors in measures.
    3. Make internal checks to detect blunders in measurements.
    4. Make redundant measurements to have a large degree of freedom.
    5. Access the quality of control that will be used.
    6. Avoid weak network geometry.
    7. Organize all field measurements for software input.
    8. Establish standard errors for all observation conditions.
    9. Adjust and analyze results.

    In these sessions, he covered fundamentals including:

    • precision vs. accuracy,
    • systematic vs. random errors, and
    • absolute vs. relative accuracy.

    Horton emphasized that systematic errors follow mathematical or physical laws and can usually be modeled or reduced with proper procedures, while random errors persist after blunders and systematic errors are addressed. By using improved equipment and proper procedures to detect, reduce, or remove errors, users lower the uncertainty in their results — reducing uncertainty should be a goal for any product or service. 

    Many people are familiar with the classic bow-and-arrow (or target) diagram that illustrates the difference between precision and accuracy.

    I recreated Horton’s diagram on this topic because it effectively highlights that our ultimate goal in surveying is to reduce uncertainty in our results.

    As the diagram shows, simply repeating observations can give the appearance of good precision, but it does not guarantee accuracy. The result can be high precision with low accuracy — and therefore a large remaining uncertainty.

    Precision vs. Accuracy

    Recreated from Todd Horton presentation

    Todd noted that most RPP values are derived from a properly weighted least-squares adjustment. Many manufacturers’ software packages now use least squares to estimate RPP, making it essential to provide accurate error estimates so the data are correctly weighted in the adjustment.

    To illustrate this point, he provided clear examples of the following concepts:

    • Determining the appropriate error estimates for data,
    • Measuring errors,
    • Degrees of freedom and redundancy,
    • Significance and confidence intervals,
    • Appropriate weights of measurements,
    • Propagation of errors, and
    • Statistical tests for analysis of data and results. 

    He explained how to compute the allowable RPP and offered practical advice on selecting the appropriate equipment and measurement methods, tailored to the accuracy requirements of the project.

    In my opinion, this topic can be challenging to grasp without a strong mathematical background. Todd did an excellent job explaining the concepts clearly while avoiding excessive mathematical detail.

    To illustrate the RPP, Todd presented two real-world examples of combined networks using GNSS and traverse data. The first example combined GNSS with an open traverse using EDM, horizontal, and zenith angles. The second example incorporated RTK GNSS vectors with a closed traverse using classical survey data.

    This was an excellent session. I highly recommend reaching out to Todd for more details about his programs and insights.

    I want to thank the organizing committee of the 2026 SLSI Annual Meeting for the kind invitation to participate in their conference. I truly enjoyed the experience and came away with many valuable insights from this excellent gathering of surveyors.

  • Digital Mapping Group launches high-precision GNSS mapping app FastXY

    Digital Mapping Group launches high-precision GNSS mapping app FastXY

    Digital Mapping Group, a pioneer in high-accuracy GNSS solutions for more than two decades, has released FastXY, a powerhouse mapping application for iOS and Android.

    FastXY is designed to transform standard mobile devices into professional-grade data-collection tools for geospatial information system (GIS) and architecture, engineering and construction (AEC) professionals.

    As the industry shifts away from bulky, proprietary hardware, FastXY offers professionals the ability to collect point, line and polygon data with the devices already in their pockets. Unlike “lite” mapping apps, FastXY delivers advanced capabilities including 3D basemaps, construction staking, topographic surveying, on-the-fly datum transformations, and survey-grade elevations.

    One of FastXY’s most disruptive features is its built-in Bluetooth data parser. This allows users to configure the app to collect data from virtually any instrument supporting BLE Bluetooth or RS-232 — including echosounders, radiation sensors, laser rangefinders, barcode scanners and more — and marry that data instantly with precise GNSS coordinates.

    “Our goal to create the most useful GNSS field data collection software for iOS/Android that uses the latest software tools,” said Ryan Skeele, software engineer. “The power of iOS/Android mobile devices increases every year, and we intend to iterate quickly to provide users more powerful solutions in the field.”

    Available in two versions: Free and Premium

    Essentials (free version)

    • High-accuracy ready. Works with device internal GNSS or Eos Positioning Systems’ Bluetooth receivers.
    • Offline-first approach. No internet connection required for field editing/data collection.
    • Rich visualization. 3D basemap featuring satellite, terrain and building overlays.
    • Smart logic. Attribute picklists with computational operations.
    • Survey-grade datum support. Real-time horizontal and vertical datum transformations.

    Professional powerhouse (premium version)

    • Advanced point staking, auto-topographic data collection and cross track navigation.
    • Hardware integration. Full support for Eos Positioning Systems’ Skadi Tilt compensation and Smart Handle hardware.
    • Sensor hub. Connect to echosounders, laser rangefinders, barcode readers, radiation sensors, and other instruments with the external instrument configurator.
    • Advanced field workflow. Import Trimble Data Dictionaries, CAD/GIS files, KMZ/KML, and drone-captured raster imagery.
    • Post-processing. RINEX data collection and direct OPUS submission for static post-processing.

    “We’re excited to offer an app for high-precision AEC users that runs on the mobile device in your pocket,” said Eric Gakstatter, principal GNSS consultant and former GPS World survey editor. “Separately, the unique Sensor Hub feature allows FastXY to consume data from almost any external instrument, combining it with high-precision GNSS data.”

    FastXY is available for download today on the Apple App Store and Google Play. For more information, visit fastxy.com.

    Digital Mapping Group

    Founded 24 years ago, Digital Mapping Group has deployed tens of thousands of high-accuracy GNSS solutions globally. Their expertise spans utilities, public works, AEC, environmental, transportation and government sectors.

  • GNSS-reflectometry data unlocks new insights into Arctic sea ice

    GNSS-reflectometry data unlocks new insights into Arctic sea ice

    In recent years, scientists have shown that detecting changes in navigation signals from GPS and Galileo after they bounce off Earth’s surface (GNSS reflectometry, or GNSS-R) can deliver valuable information on sea ice. Now research drawing on data from Spire Global has enabled the generation of Arctic-wide sea ice maps, marking a major step forward for the emerging technique.

    Spire Global‘s sea ice freeboard maps use data captured by Spire’s GNSS-reflectometry multipurpose listening constellation.

    The research — enabled by the Third Party Missions (TPM) programme of the European Space Agency (ESA) — suggests that harnessing reflected navigation signals could become an important complement to established ice-monitoring altimetry missions.

    The study leveraged Spire’s GNSS-R data to retrieve sea ice freeboard measurements across an entire winter season. The results show strong alignment with established altimetry datasets, including the ESA’s CryoSat mission, validating the complementary role of commercial satellite data alongside government missions.

    Arctic-wide sea ice freeboard map for January 2024
Arctic-wide sea ice freeboard map for January 2024. (Credit: ESA)
    Arctic-wide sea ice freeboard map for January 2024. (Credit: ESA)

    The study was led by Felix Müller at the Technical University of Munich (DGFI-TUM) and Robert Ricker at the Norwegian Research Centre, experts in GNSS-R.

    “The primary purpose of signals emitted from GNSS is to fix the location of a device at any point on Earth,” Müller explained. “However, when these signals bounce off Earth’s surface, their properties change. By analyzing these changes, we can infer information about the characteristics of Earth’s surface.”

    “Previous research has shown that this technique works well experimentally,” Ricker added. “Using the Spire constellation, we aimed to demonstrate whether it would hold up on a larger scale by generating an Arctic-wide map of sea ice freeboard, which is a measure of how far ice protrudes above the waterline.”

    Spire’s GNSS-R constellation

    Spire’s constellation was first used to sample the atmosphere for weather forecasting. Then scientists began exploring other applications. Spire started collecting reflected signals arriving at shallow angles using a technique called grazing-angle GNSS-R. This method is particularly well suited for ice monitoring.

    The research team analyzed data detected over the Arctic Ocean and surrounding seas between October 2023 and July 2024. The data was obtained via the TPM program, through which ESA disseminates data from a range of commercial and institutional partners on a free basis for research and development purposes.

    The team focused on one of the most critical challenges in sea ice altimetry: reliably identifying narrow openings in the ice pack, known as leads. These openings are reference points for determining sea surface height and, ultimately, sea ice freeboard.

    In turn, sea ice freeboard can be used to infer sea ice thickness — an essential parameter for tracking climate change, estimating sea level, and modeling ocean and weather patterns.

    Identifying leads in sea ice with GNSS-R data. (Credit" ESA)
    Identifying leads in sea ice with GNSS-R data. (Credit: ESA)

    Classifying surface properties

    “In the initial phase of the project, we used two complementary methods to identify surface properties based on GNSS-R data, with the aim of identifying leads,” Müller said.

    The first — known as the adaptive threshold technique — involved measuring the power of the reflected navigation signal to classify surface type as either water or ice. This method allows rapid processing of the entire GNSS-R dataset, while remaining robust to changes in signal conditions.

    The second method — known as unsupervised clustering — offers a more complex approach to classifying surface conditions. In addition to signal power, it considers multiple other signal features that tease out more nuanced information on surface type, including identifying thin or refrozen ice.

    Both methods were compared with co-located CryoSat surface-type classifications and Sentinel-1 imagery, confirming that the GNSS-R classifications were largely comparable against conventional satellite products.

    Mapping sea ice freeboard

    “Building on this classification work, we then took the research to the next step by producing Arctic-wide sea ice freeboard maps from GNSS-R data,” Ricker said.

    The team corrected ice surface height measurements generated from GNSS-R data for tidal variations, sea surface height, and atmospheric delays, which is standard practice in altimetry. A refined algorithm then identified where leads in the ice were likely to occur, with the lowest points in these areas revealing estimated sea surface height. Sea surface height estimates were then subtracted from ice surface heights to retrieve freeboard. Using this approach, monthly gridded freeboard products were generated for the full winter season.

    The team reported that the GNSS-R datasets showed strong agreement with CryoSat freeboard datasets across much of the Arctic, confirming that GNSS-R can reproduce large-scale patterns previously observed by dedicated altimetry missions. Independent validation against upward-looking sonar measurements in the Beaufort Sea further supported the accuracy of the retrieved freeboard values.

    However, as expected, the GNSS-R estimates became less reliable during spring, when surface melt alters reflection characteristics. This limitation is consistent with earlier GNSS-R and radar altimetry studies and remains an active area of research.

    The contribution of commercial data

    While GNSS signals have long been used for positioning, this research highlights how reflected signal analysis can extend their value into large-scale Earth observation applications, delivering persistent coverage independent of sunlight or weather conditions, said Theresa Condor, Spire Global CEO.

    “Advances in miniaturization, digital signal processing, and machine learning have fundamentally changed what’s possible in RF sensing,” Condor said. “Commercial constellations can now deliver persistent, high-quality RF data that complements traditional government systems with greater flexibility and cost efficiency.

    “As environmental monitoring requirements intensify, we’re seeing agencies increasingly integrate commercially sourced RF datasets into operational architectures, reflecting the continued maturation of this market and the growing role of commercial infrastructure in government missions.”

    “By producing analysis-ready gridded datasets, this work marks an important milestone in the progress of grazing angle GNSS-R from an experimental method to a reliable technique for mapping Arctic sea ice freeboard at scale,” said Matthieu Talpe, Remote Sensing Product Engineer, Spire Global. “In doing so, it strengthens the case for the grazing angle GNSS-R technique employed by the Spire constellation as a valuable complement to existing ESA and partner missions, helping to close observational gaps in one of Earth’s most rapidly changing regions.”

  • Topcon, GSSI to provide new subsurface intelligence solution

    Topcon, GSSI to provide new subsurface intelligence solution

    Topcon Positioning Systems and Geophysical Survey Systems, Inc. (GSSI) are collaborating to pair GSSI’s advanced ground penetrating radar systems with Topcon’s GNSS solutions and mass data workflow software. The new integrated solution will support applications across infrastructure and construction projects.

    “GSSI is a long-standing industry leader in ground penetrating radar (GPR) systems, and we are excited to work with them on providing industry professionals with an advanced, integrated solution,” said Ron Oberlander, head of the Topcon Geomatics Platform. “By combining GSSI’s GPR technology with Topcon’s HiPer XR GNSS receiver, Topnet Live correction services, and Collage Web mass-data workflow software, we are bridging subsurface detection and spatial context from field to analysis.”

    “Collaborating with Topcon allows us to unify GPR data and GNSS data to deliver visual, decision-ready insights, providing a more complete picture of the world above and below the surface,” said Chris Green, chief executive officer of GSSI. “Together, GSSI and Topcon are helping customers plan smarter, validate faster, and deliver higher quality outcomes with fewer surprises.”

    The new solution will be showcased in both the Topcon Positioning Systems booth and the GSSI booth at CONEXPO-CON/AGG, taking place March 3-7 in Las Vegas.