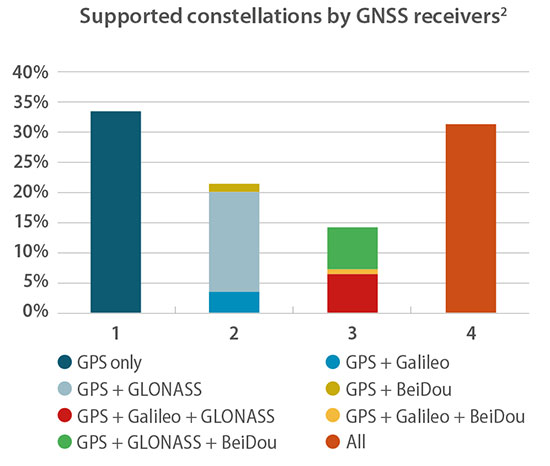
One remark in particular caught my eye as I read the press release précis of the European GNSS Agency’s 2018 GNSS User Technology Report. In point, “Today only around 30 percent of receivers use GPS only.”
“What?!?” methought. Incredulously, I downloaded the 92-page document, so easily done at www.gsa.europa.eu, and scrutinized it closely. Surely the GPS-only installed base out there is wider, vaster and deeper (it’s certainly older!) than could have been overtaken already by the wave of multi-constellation devices.
Yes, they are clearly the future. But is the past already gone? That golden age when GPS was all that anyone lived, positioned and navigated by — vanished into the mist?
Only earlier this very year was I upgraded from an iPhone 3 to an 8, with Galileo onboard for the first time. “Hip, but by the skin of my teeth,” I breathed.
Chart: GSA report
In the fine print on page 20 of the report lay clarification for my consternation. “For the analysis, each device is weighted equally, regardless of whether it is a chipset or receiver and no matter what its sales volume is. The results should therefore be interpreted as the split of constellation support in manufacturers’ offerings, rather than what is in use by end users.”
Of the roughly 500 chipsets and modules tallied by the GSA, 30 percent of those models are GPS-only. That’s a number of quite a different color. See the chart for fuller information.
Better minds than this can take a stab at how many devices in the hands end users on this day are still GPS-only. I’d put it above 50 percent.
The writing’s on the wall for the GPS-only artifact, but a good many of those veterans are still out there, working hard in the marketplace. Their reign as the majority may be limited, especially with the rising global tide of multi-constellation smartphones, but let’s honor them one last time before consigning them to the museum.
The GSA’s report, by the way, is a remarkably good and valuable read. No one can know it all, but this slim volume packs a remarkable and essential density of key facts, trends, issues, markets and more.
Dull, dirty and dangerous — those used to be the jobs relegated to autonomous systems. But a decade-plus of improvement in sensor and computing technology has brought autonomy into the mainstream as a defining technology of the future.
At September’s ION GNSS+ conference, I attended a panel titled “Autonomous Cyber-Physical Systems — The Way Ahead.” I came away astounded by how much is changing, and how fast, because of autonomous CPS.
The panel was chaired by John Raquet of the Air Force Institute of Technology and Zak Kassas of the University of California Riverside. It featured presentations covering topics such as the Columbus Smart City Challenge (Dorota Grejner-Brzezinska, The Ohio State University), benefits of precision agriculture (Steve Rounds, John Deere), robotic teammates on the battlefield (Brett Piekarski, U.S. Army), and UAV design and certification (Demoz Gebre-Egziabher, University of Minnesota).
Autonomous cyber-physical systems (CPS) include unmanned aerial vehicles, self-driving cars and unmanned underwater vehicles. The panel addressed the state of autonomous CPS as well as challenges that need to be addressed as we integrate these systems into our environment.
Rather than discuss a specific application, Michael Veth, CEO of Veth Research Associates, tackled a difficult question: Just how much autonomy do we give machines?
“Rigorous risk assessment is the most critical component of machine-controlled autonomous systems,” Veth said. He said the scope of the machine’s autonomous decisions should be limited to the minimum necessary — in other words, avoid the scenario depicted in the movie WarGames.
Another rule: “Don’t put beta software on the street,” he said, recalling the Tesla autosteer system that resulted in a death. Instead, follow DARPA’s example, with its extensive sandbox testing.
Summing up his presentation, Veth provided five guidelines for developing autonomous machines:
Perform rigorous risk assessments;
limit range of action to the minimum required;
use generative models whenever possible;
train and evaluate using maximum available data; and
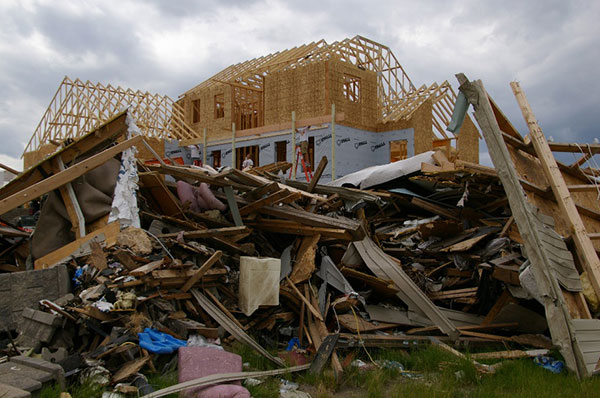
Another month, another hurricane in the southern United States. News channels showed drone-captured video of the mess left behind in Northern Florida, Georgia and the Carolinas. More useful is the video damage assessments UAVs are providing for first responders.
A basketball hoop and backboard hang forlornly while both front and back walls of a school gym are gone, huge buildings are nothing but matchsticks, fallen trees and powerlines blocking roads — familiar scenes from hurricane Michael’s devastation of Panama City and area — video provided by drones operating in the disaster zone.
Although the videos have now largely gone from the TV news, Panhandle residents will be living through this nightmare for months to come.
Photo: Glenn Fawcett/Customs and Border Protection/Handout)
Working with emergency teams — including the North Carolina Surf City Fire Department, Airborne Response, Florida FEMA Task Force and Missouri Task Force FEMA — Edgybees’ AR drone software was able to provide collaborative, real-time, situational visualizations of the areas affected by Michael. Status and location updates were available during critical missions, and key geographical data was provided to teams on the ground.
Beach Patrol
Another life-saving drone application comes from the other side of the Pacific – finding and deterring sharks which threaten bathers off the beaches of Australia.
An artificial intelligence application on-board a SharkSpotter UAV monitors for shark attributes as it overflies inshore areas where the predators are known to hunt. If there is a match for typical shark behavior — size, shape, color, and movements in the water — an alert is transmitted to enable lifesavers to respond. The drone can even drop a flotation device to swimmers in trouble. A number of beaches in New South Wales were patroled this past summer, and many more UAV beach patrols are planned to be added for the coming season.
SharkSpotter drone. (Photo: Ripper Group)
Other work is underway to deter the animals using devices in the water which create electric fields aimed at interfering with shark sensory systems. Another cell-phone application estimates the probability of the presence of sharks based on a number of environmental factors. Several U.S. agencies are keenly watching these developments as shark attacks have increased here, off both Atlantic and Pacific beaches.
Meanwhile, there has been another important step forward for drone integration into the US National Airspace System (NAS) and for integration in other countries’ airspace. Enabling drones to fly over people and property is a key part of potential airspace operations, and a safe recovery system which avoids possible injury to people is becoming essential. Most drones have a return-to-base fallback in the event of loss of the control signal, but this doesn’t help in the event of a fundamental mechanical failure.
Parachute Recovery Systems
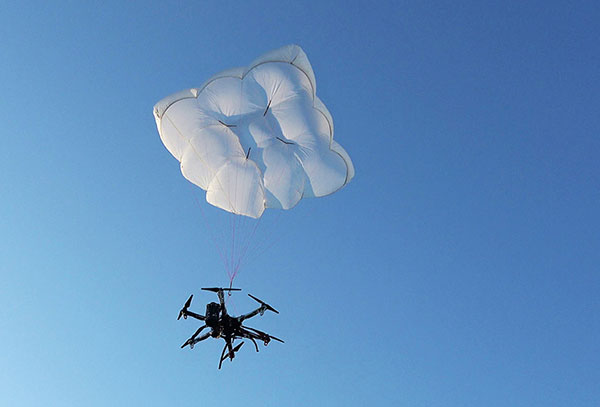
DJI Matrice 600 with DRS-10 rescue system. (Photo: Drone Rescue)
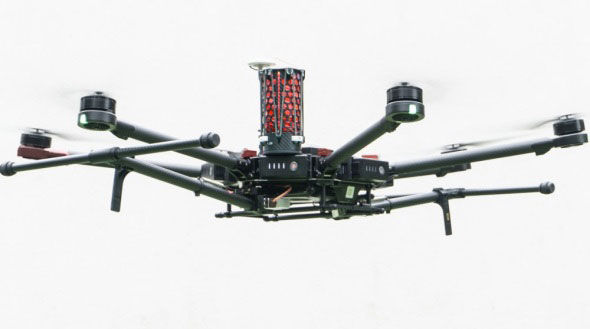
Effective auto-release parachute systems may be key to solving this problem. Another supplier has emerged with a lightweight automatic system for the DJI Matrice 600 multicopter.
Drone Rescue (DR) from Austria has announced its DR-10 parachute recovery system,for drones weighing 5-20 kg (11-44 lb). The DR-5 system is for lighter UAVs (8kg – 17.6lb).
The DRS-M600 system has apparently been derived from the DR-10 specifically for the DJI Matrice drone.
Photo: Drone Rescue
The parachute is mounted in a carbon cage and is released when a self-contained electronics system automatically detects an imminent crash. DR claims that their system works even in the event of control data link failure, and that incident data is collected in an on-board UAV flight-data recorder for subsequent analysis.
It was previously announced that an FAA waiver for flight over people was granted to North Dakota UAS operator, Botlink using a ParaZero Israel drone recovery parachute system.
Initial flights were conducted during a tailgating event prior to the North Dakota State University vs South Dakota State football game in North Dakota. The drone flew over crowds in the stadium’s parking lots and provided real-time video for local law enforcement and media companies.
This drone parachute safety system includes a fully autonomous triggering system that deploys quickly and reliably without being dependent on any manual operator’s response. During FAA testing it was necessary to demonstrate that the descent rate was slow enough to provide acceptably low impact energy and that the system would operate correctly in multiple types of failure conditions.
DHL Drone Delivery
Meanwhile, DHL has joined other drone delivery companies to establish a medical delivery trial in Africa. DHL’s trial is in the Lake Victoria region of Tanzania.
The six-month trial has focused on delivered medicines by UAV within 40 minutes to an island in Lake Victoria — the trip normally takes six hours by road.
Photo: DHL
Over the course of 160 proving flights, using a 4-kg-capacity Wingcopter, medical supplies were successfully transported over the 60 kilometers between Mwanza and the hospital on the island of Ukerewe.
The medicines reach their destination at least 3 hours earlier than by any traditional mode of transportation, and as a result of these tests, 400,000 people in the Ukerewe District will now have access to medical care and support in hours rather than days.
Conclusion
Drones helping out hurricane Michael recovery efforts in the Florida Panhandle, specialized drones tracking sharks to mitigate possible attacks off beaches in Australia, parachute recovery systems enabling drone flights over people, the integration of drones into regular airspace moving ahead, and more medical delivery trials in Africa. These are a few recent UAV applications that appear to be supporting even further drone use around the world.
An Air Force professor was honored for years of work exploring every PNT technology imaginable in conjunction with GPS; Rockwell Collins launched a new MicroSTRIKE multi-GNSS chip for military and professional applications, available globally on a non-ITAR basis; and Spirent Federal previewed its SimMNSA, a new M-code simulation option delivering to authorized customers by the end of the year.
John Raquet, AFIT, accepts 2018 Leadership Award for Services from Justin Eldredge, Spirent Federal. (Photo: Melanie Beus)
John Raquet, a professor in the Department of Electrical and Computer Engineering at the Air Force Institute of Technology, received the 2018 Leadership Award for Services. Raquet was recognized for work he and his team at the Autonomy & Navigation Technology (ANT) Center developed on PNT sensors and systems utilizing almost every available source, including GPS, GNSS, inertial, vision, lidar, magnetic field, pseudolites, radar, terrain mapping, signals of opportunity, star trackers, radio ranging, 3D audio, X-ray pulsars, clocks, and more.
Raquet has co-authored many defense-oriented technical papers over the past three decades. See the list at the end of this article for some of the most recent ones.
Justin Eldredge from Spirent Federal introduced Raquet and bestowed the award, after updating the audience on Spirent’s most recent advance: “This year we maintain our position of being first to market with new signals, with the launch of SimMNSA. We’re currently in the final test phase of this new M-code option and it will delivering to several authorized customers by the end of the year. If M-code signals aren’t in the spectrum of testing for you, we offer products that simulate all other GNSS signals, plus a variety of other sensors.”
SimMNSA was demo’d at the Spirent Federal Systems booth at the neighboring ION GNSS+ conference. A video presentation of SimMNSA (for Modernized Navstar Security Algorithm) is available here. Spirent’s new software will support M-code using MNSA. M-code is an updated GPS military signal that is being rolled out as part of the modernization of the current GPS constellation. Until now, AES and SDS have been the only methods authorized to be used within a GNSS simulator to produce M-code. As the long-awaited MNSA M-code signals become available, Spirent Federal Systems will make this capability available to authorized users on the GSS9000 series simulator.
ANT
After receiving the 2018 Leadership Award, Raquet spoke about his work at theAutonomy & Navigation Technology Center. “Sometimes I called the ANT the Crazy Idea Factory. We’ve tried lots and lots of things. I think I have the best job in the world, because I get to experiment with many, many things, and work with amazing people.”
John Raquet, U.S. Air Force Institute of Technology (Photo: Melanie Beus)
“This is not the kind of community where you build something once and you’re done, you put it away. This is a growing worldwide enterprise that takes new talent to come in and fill the spots that many of the people in this room have occupied. I’m privileged to see some of the students that we’ve worked with to then go on and fill some of the gaps, really do some amazing things.”
MicroSTRIKE, a non-ITAR GPS chip
Two awards prior to Raquet’s Services award, Phil Froom from Rockwell Collins, UK, spoke about an innovative venture from Rockwell and partners QinetiQ UK as he bestowed the Satellites award.
“For many years most of you here this evening will have known Rockwell Collins as a reliable partner in the delivery of Secure (encrypted) GPS receiver, and indeed, we are still the largest producer of encrypted military GPS solutions in the world. Our partners QinetiQ also have great expertise in the design and delivery of high assurance low SWAP GPS receivers, bringing together many years of expertise of our two companies in this new venture.
Phil Froom, business development lead for Rockwell Collins, Europe, Middle East and Asia (Photo: Melanie Beus)
“However, over the past few years we have seen our military and professional (government) users looking to greater flexibility in their use of GNSS, as new capabilities and constellations come on line. But with that flexibility, a retention of assurance and where possible, mitigation of threats. For this reason, last May, Rockwell Collins and QinetiQ signed an Alliance Agreement in London, to produce a new family of high-assurance, multi-constellation GNSS receivers for professional and military use.
“This new family of receivers is aimed to be complementary to the current encrypted family of Rockwell Collins receivers in service across the globe, but allow the customer to select his level of capability and protection based upon his operational, political or even financial needs. The new “MICRO” family of GNSS receivers will offer a multi-constellation open service (MCOS) GNSS capability, which will initially provide two receivers; the first, to be known as the Q40-MicroPNT, will address dismounted low dynamics requirements, and the second, the Q40-MicroSTRIKE, will be a gun hard, high dynamics receiver.
“You will note I said they are MCOS receivers. Therefore, they will not include an encryption device, will be Non-ITAR and will actually be produced in Europe, under the control of Rockwell Collins UK. QinetiQ are today working on the Q40 ASIC and, once available, this will be incorporated into these first two Micro Family receivers.
“These receivers will be of a common format to our existing and highly successful SAASM based MicroGRAM receivers and will offer users and OEMs the ability to select an MCOS receiver, or a SAASM (or ultimately M-Code) receiver, of a common form – factor, to meet their mission or platform needs. Thus allowing OEMs to reduce costs in integrating different form-factors, and to allow users to hold common hardware, but mounting mission specific receivers.
“We are of course extremely excited about this Alliance with QinetiQ and equally by the prospect of what it will bring to our existing and future users as we all move forward into this new era of GNSS capability.”
Check out videos from the event below. Click on the icon in the top left hand corner to choose which video you’d like to watch.
Recent technical papers co-authored by John Raquet.
• “Magnetic field navigation in an indoor environment,” Ubiquitous Positioning Indoor Navigation and Location Based Service, (Aiding an inertial navigation system when GNSS signals are not available, by taking advantage of the uniqueness of magnetic field variations);
• “Comparison of two image and inertial sensor fusion techniques for navigation in unmapped environments,” IEEE Transactions on Aerospace and Electronic Systems, (navigation of miniature aerial vehicles (MAVs) couplimng information from an IMU with visual information from an electro-optical camera);
• “Real-time UWB-OFDM radar-based navigation in unknown terrain,” IEEE Transactions on Aerospace and Electronic Systems (a signal processing algorithm and simulation study for aerial navigation with an ultrawideband orthogonal frequency division multiplexed (UWB-OFDM) radar in GPS-denied environments;
• “Navigation in GPS denied environments: Feature-aided inertial systems,” Air Force Research Lab, Eglin AFB FL Munitions Directorate (latest alt-nav trends for navigating in difficult urban, indoor, and underground environments where typical GPS receivers do not function;
• “Coded aperture aided navigation and geolocation systems,” US Patent office #8577539 (A micro air vehicle having a navigation system with a single camera to determine position and attitude of the vehicle using changes the direction to the observed features);
• “Multisensor navigation systems: A remedy for GNSS vulnerabilities?” Proceedings of the IEEE (A multisensor navigation approach to GNSS-challenged environments using inertial measurement units (IMUs), barometers, magnetometers, odometers, and digital compasses);
• “Large scale image aided navigation,” IEEE Transactions on Aerospace and Electronic Systems (images from an airborne camera match features against a reference image to compute global position);
• and many more.
Researchers from NASA’s Frontier Development Lab (FDL) and Intel are proposing a way to navigate on a new planet using artificial intelligence (AI).
The researchers presented their planetary navigation research during an Intel event on Aug. 16.
The immense challenge of building GPS-similar constellations around every planet or moon could be avoided by using imagery, according to researchers Andrew Chung, Philippe Ludivig, Ross Potter and Benjamin Wu.
The team developed a system for simulating the Moon’s surface so that AI could be used for navigation on the surface.
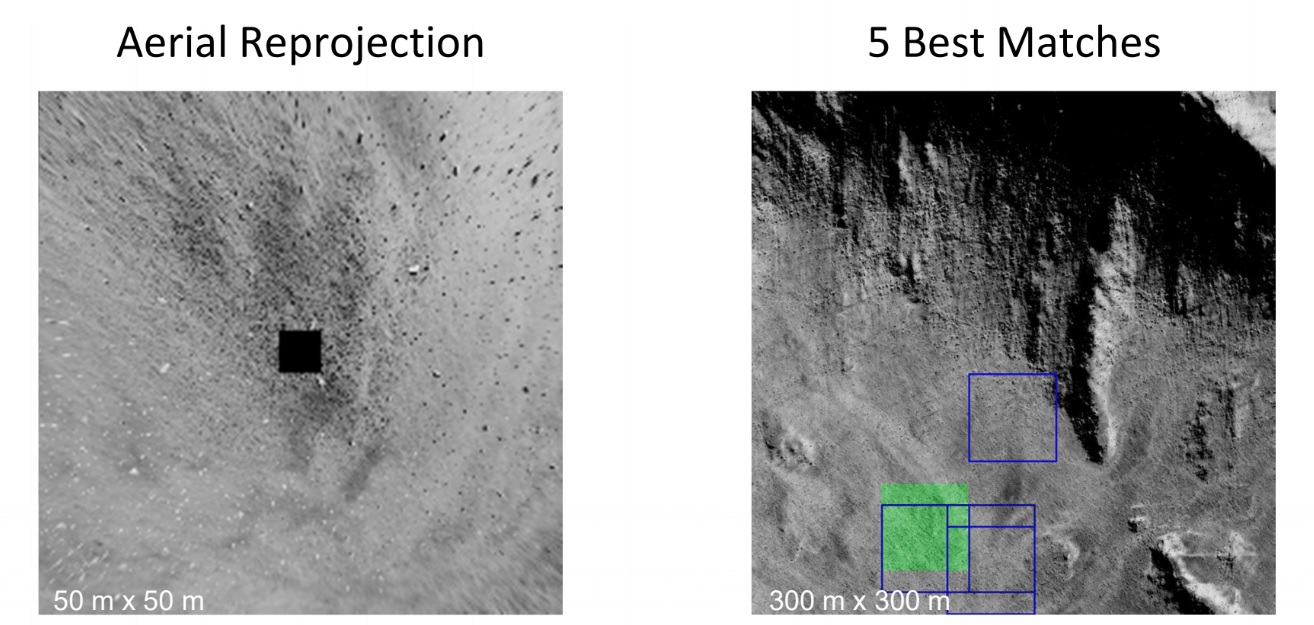
How It Works. The researchers created a highly detailed digital model of a virtual moon using 2.4 million images of its surface. The images represent ones that might be taken by a rover.
The AI learned what this moon looks like by being fed the millions of images, and then used its neural network to create a model of the virtual moon.
According to the team’s presentation, this was enough to effectively enable navigation on the virtual moon’s surface.
With the model in place, a person merely needs to take a photo of their surroundings on the surface. Based on the photo, the AI determines the person’s location and shows how to navigate to a destination. The AI would even understand the distortions of known features from the point of view of the camera.
The team wants to try to do the same thing with a real celestial body: Mars. They think they have enough satellite images to make it work.
If they’re right, the first Martian visitors could navigate the Red Planet by photo.
At the GPS World Leadership Dinner and Awards Ceremony in Miami on Sept. 27, 120 VIPs from the international GNSS/PNT community gathered to honor recent significant achievements in four fields: Satellites, Signals, Services and Products.
The honorees, so voted by a panel of their peers, appear below. Also, see our article here.
Their remarks upon receiving the awards will appear in the December issue, along with Future Visions for 2019 by the executive officers of GPS, GLONASS, Galileo and BeiDou.
Rounding out the evening after speeches, dinner and good conversation among good friends, old and new, was the Smart City Jam! We attempted to replicate, on the carpet of the 14th-floor banquet room, an obstructed urban environment, replete with malicious jammers. And we challenged all comers to “autonomously” navigate to a goal in this hostile environment with remote-controlled rock-crawlers. Details on this as well coming up in December.
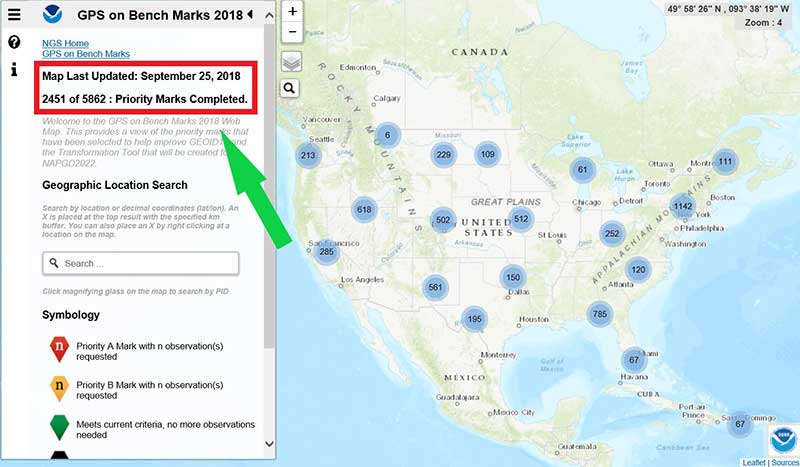
The number of GPS on Bench Mark (BM) stations highlighted as complete on the National Geodetic Survey (NGS) GPS tracking page as of Sept. 25 represents 43 percent of the total number of stations that need to be observed (2451 of 5862 Priority Marks Completed).
These new GPS on BMs observations will be helpful in identifying invalid GPS on BM stations that may have been used in the next hybrid geoid model.
Now that the 2018 GPS on BM program has officially ended for data included in the hybrid model GEOID18, NGS’ GPS on Bench Mark Program will soon be expanded to include other regions and will focus on data to improve NGS datum transformation tools.
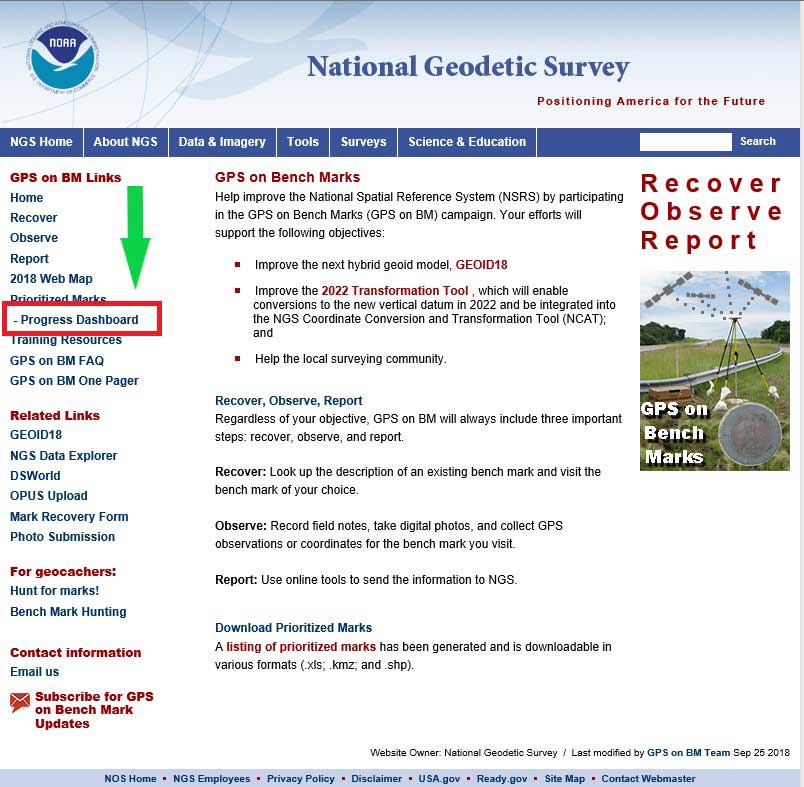
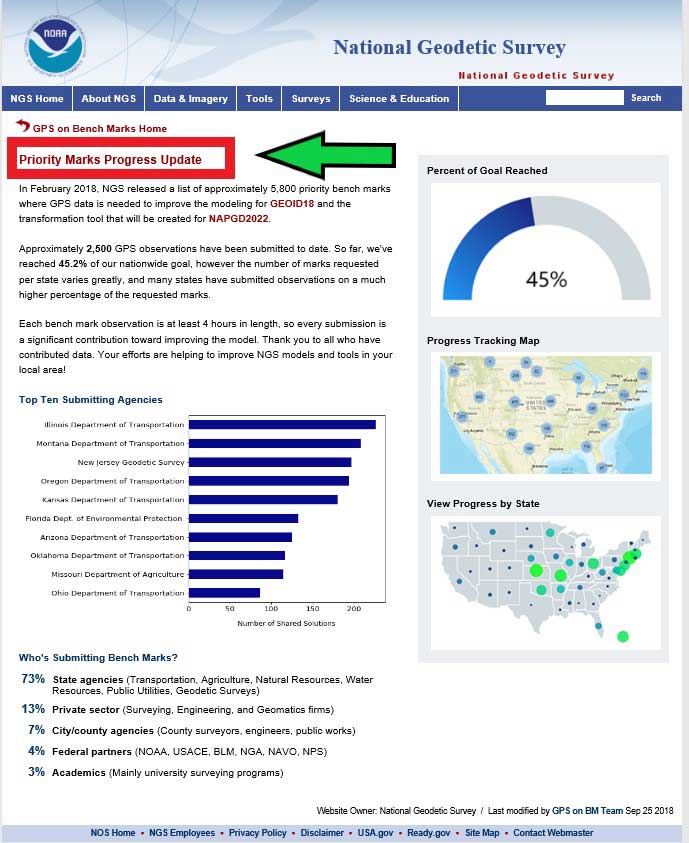
NGS has aided users that are submitting data using OPUS through their GPS on BM website service. Previous columns have highlighted the website. This column will highlight a new feature on the NGS GPS on BMs webpage that displays the progress of priority marks and its associated statistics. This webpage can be accessed through a link on the GPS on BMs Program main webpage — (see highlighted section in box tilted “GPS on BM Project Webpage”). The new webpage provides statistics by state as well as which agencies are submitting the most GPS on BMs data (see the box titled “NGS Webpage of Priority Marks Progress Update”).
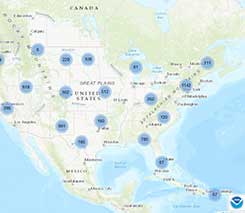
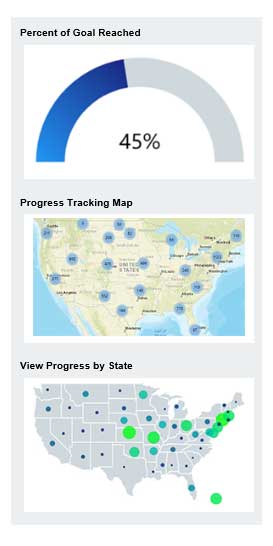
The right side of the webpage provides the percent of the goal reached, a link to the progress tracking map, and a link to progress by state (see box below). The first thing to notice that it provides a current percent of goal reached to date. In this example, the GPS on BM program is at 45 percent complete.
Right Side of Priority Marks Progress Update Webpage
Clicking on the “Progress Tracking Map” picture will bring up the latest map update (see box below). As depicted in the box, as of Sept.25, 2,451 of 5,862 priority marks have been completed. The “Progress Tracking Map” provides information based on the last time the map was updated, and the “Percent of Goal Reached” is based on the most current OPUS Shared solutions submitted. NGS is working toward generating the map and solutions in near real time.
Clicking on the “View Progress by State” picture will bring up a table of progress of priority marks by state (see box titled “View by State Webpage”). As depicted in the box, the following statistics are provided for every state:
Source: National Oceanic and Atmospheric Administration
Source: National Oceanic and Atmospheric Administration
The following states have officially completed 100 percent of their priority A and B stations: Connecticut, Minnesota, North Carolina, New Jersey and U.S. Virgin Islands. Congratulations to these states (see the box titled “Priority A & B Progress – states with 100 percent complete”).
Priority A & B Progress — States with 100 percent complete
It should also be noted that there are 15 states that have completed at least 75 percent of their priority A and B stations (see box below). This is a tremendous amount of work, and everyone should be commended for participating in the GPS on BM program.
Priority A & B Progress – States with at 75 percent Completed
Source: National Oceanic and Atmospheric Administration
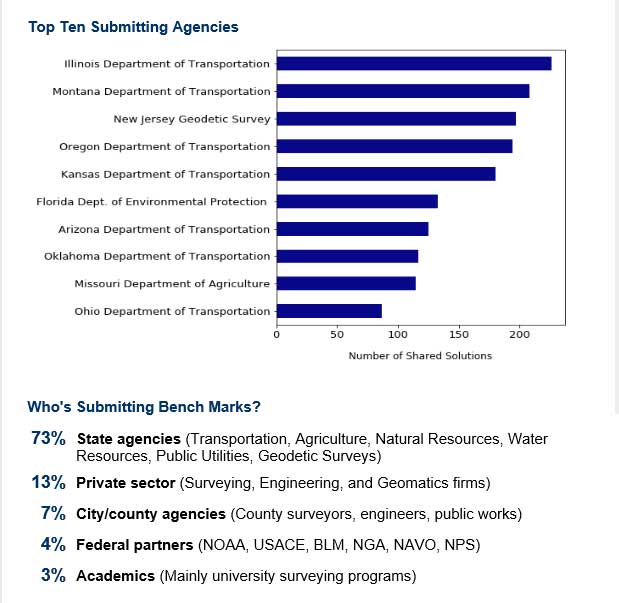
The left side of the webpage provides information on the top submitting agencies. As indicated in the box below, the Illinois Department of Transportation (DOT) and Montana DOT are the two top leaders in submitting GPS on BMs data. They have submitted well over 200 OPUS Shared solutions. The New Jersey and Oregon DOTs are close behind, providing about 200 OPUS Shared solutions.
Left Side of Priority Marks Progress Update Webpage
Source: National Oceanic and Atmospheric Administration
It’s not surprising to see that state agencies have provided the most submissions to the GPS on BM project (73 percent). It’s very encouraging to see that the private sector has provided 13 percent. Having an accurate and reliable hybrid geoid model will assist surveyors in performing their jobs as well as improve their efficiency in performing geodetic surveys requiring heights.
This column provided an update and status report on stations observed in support of the 2018 GPS on BMs program, and highlighting a new NGS GPS on BMs webpage that displays the progress of priority marks and its associated statistics. The number of GPS on Bench Mark stations completed as of Oct. 1 represents 45 percent of the total number of stations that need to be observed.
As I have explained in previous columns, there were many stations with invalid heights that could be used in the next hybrid geoid model unless more bench marks with valid NAVD 88 heights were observed with GNSS.
Many stations with potential invalid published orthometric heights have been identified by the GPS on BM program. This information will be very useful to the surveying and mapping community as well as to NGS.
NGS’ official date for accepted data for inclusion in the next hybrid geoid model, GEOID18, was Sept. 21. However, any OPUS Shared observations submitted before the final version of GEOID18 has a possibility of being included in the model. Even if it’s not included in the hybrid model, it will be very useful for evaluating the reliability of the model.
After the hybrid geoid model, GEOID18, is published, NGS’ GPS on Bench Mark Program will expand to include other regions and will focus on data to improve NGS datum transformation tools. I encourage everyone to continue supporting the GPS on BMs program — not only for improving the development of the 2022 transformation tool, but to assist in identifying bench marks in your local area that have invalid published orthometric heights due to movement.
Once NGS publishes the next hybrid geoid model, GEOID18, OPUS results will probably provide an estimate of the NAVD 88 orthometric height computed using GEOID18 similar to what it does now using GEOID12B.
In my opinion, the results of GEOID18 will be better than GEOID12B in most areas of the United States and should be helpful in identifying stations that have moved since they were last leveled. Submitting your results to OPUS Shared will provide a way for others to analyze the results to determine whether a station has an issue that requires attention.
GIS specialists are much more than mapmakers. Make sure your organization and customers understand how spatial analytics can help them succeed.
By Adam Carnow
Most non-GIS users hear the term “G-I-S” and think “M-A-P.” That is, they think of GIS, and GIS practitioners, as mapmakers. Most GIS practitioners have unknowingly perpetuated this image. Ask any GIS practitioner what they do for a living and most will say, “I make maps;” however, the reality is that what they do for a living is help people make better decisions through the power of location. This is what I call location intelligence.
There is a tremendous growth opportunity for GIS in government across the enterprise. GIS was created to perform spatial analysis. GIS can often be underutilized because non-GIS users sometimes don’t understand the reach of spatial analysis and how it can help them. GIS practitioners need to market and evangelize the power of spatial analysis to help change that image.
Photo: rmnoa357/Shutterstock.com
You can break down location intelligence into six categories. As you move down this list, the value of the location intelligence increases:
Understanding Where. A map (could be paper or PDF, but should be an interactive web map) showing where the fire stations are located across a city.
Measuring Size, Shape and Distribution. A map showing the size, shape and distribution of wetlands across an area would help with wetland protection and preservation.
Determining How Places Are Related. Showing how certain soil types correspond to flood zones.
Finding the Best Locations and Paths
To find the best location for a new fire station, run a drive-time polygon process to show the coverage area for each fire station. The areas that are uncovered are where a new fire station is needed.
To find the best path for field inspectors: We have 50 inspections to do today and three inspectors. Divide the inspection locations among each inspector and create the most efficient route to get their work done.
Detecting and Quantifying Patterns. Crime analysts look at crime data to try to predict where the next one may occur and to help identify known perpetrators. (See also An inside look at fighting crime with GIS.)
Making Predictions. Modeling a watershed can allow for flood predictions based on anticipated rainfall.
Another way to help break the mapmaker image is to rebrand. Most staff in any organization use spreadsheets daily for a multitude of things that bring value to the organization – some say it’s the number one business intelligence (BI) tool.
There are GIS software tools that are as easy to use as a spreadsheet; in fact, you can use GIS inside of spreadsheets.
Wetlands map, Oregon’s Klamath Lake. (Map: USGS)
Even though spreadsheets are such a useful tool, you don’t see a Spreadsheet Department. Spreadsheet is just the name of the tool, so you don’t have, or name, a department for it. A department should be named based on the function, or value, it serves.
GIS should be thought of as BI with location data and spatial analysis, or location intelligence. A great way to get people to understand the real value and power of GIS is to rebrand your GIS department to something like Enterprise Location Intelligence.
One such example of this is Walgreens. As the drugstore chain’s GIS department became more strategic and tied to the analytics of the organization, the company rebranded it as Enterprise Location Intelligence.
If your organization has a BI group, they should consider reorganizing to put GIS with that BI group. I’m seeing real-world examples of this rebrand:
GIS job title changes to things like:
Data Analytics Manager
Content Delivery Manager
Business and Location Intelligence Manager
Reorganization putting GIS with BI: A major city has a Smart City initiative, and in response the city has reorganized its IT group — they now have a Data Analytics Group that consists of a BI team and their GIS team.
This rebrand, and expansion of the understanding of the true purpose and value of GIS, will not just help the organization realize more return on investment (ROI) for their GIS investment, it will help the GIS practitioners elevate their value to the organization and hence their careers.
What can you do? If you’re a GIS practitioner:
Explore rebranding your title and your GIS group as a start to changing your image from mapmaker to solution provider.
Evangelize the power of location intelligence. This is actually pretty easy to do. When someone asks for a map, ask them why they need it, probe to find out more about their project; you will probably uncover a need for spatial analysis.
Start to enable others in your organization to become GIS users via easy-to-use web maps and apps. As they use GIS, they will realize its full potential and seek to utilize it more often.
If you’re not a GIS practitioner, seek out your GIS team to learn more about their capabilities and how they can help you. And, become a GIS user, there are plenty of GIS tools available that are easy to learn and use.
This article originally appeared on Govloop.com and is reprinted with permission.
Adam Carnow is an Esri community evangelist and part of the GovLoop Featured Contributor program.
GIS is growing in importance to urban development, whether for environmental impact studies, geofencing or building information modeling (BIM). Sharing GIS data with developers is critical to a coordinated approach to smart city growth.
By Christine Easterfield, Principal Analyst, Cambashi
Just over half the world’s 7 billion population lives in cities. In Europe, this rises to three quarters, and 30 cities worldwide have populations of more than 10 million — the majority in India, China and South America.
This trend will continue. It is projected that the global population will reach almost 10 billion by 2050, which means cities will need to cope with increasing demands on housing, transport and communications.
Growing urban populations place considerable stress on housing stock. Cities need to provide scope to build new, but also to look at best use of existing properties.
In the growing urban population, there will always be a proportion that needs more support as employment rates shift and wages do not always keep up with city expenses. Social housing projects need to keep pace, and making the most of city resources opens opportunities for smart buildings.
The role of GIS
Proposed Indianapolis zoning map. (Image: City of Indianapolis)
Coordinating new build and refurbishment plans across a city requires planning and organization, and a set of tools to support planners and designers. The layout of city-planning zones is the starting point for many new developments — sharing data about these areas is typically achieved using a GIS (geographic information system).
The standard city map with records of roads, emergency routes, bike routes, key buildings, new development zones, existing housing stock, utility services and street lighting are a central resource for most cities.
Sharing data between these city maps and developers’ plans is critical to a coordinated approach to city growth.
Environmental impact
The early stages for many developments involve an environmental impact study. How will the new development fit into the existing landscape? What restrictions are imposed because of the conditions of the site or the current demands on local resources? What options are there for addressing these constraints?
This last point is important for acceptance of the development. Being able to show a level of flexibility to accommodate local concerns and developers’ challenges will build a cooperative relationship. The ability to easily integrate building plans with the city map means that confidence is quickly built into the new plans.
Combining the geography of the city view with the building model destined for development provides a perfect foundation for an integrated GIS/BIM model to take the development from drawing board to handover.
Maintaining a digital twin of a development, in the form of a BIM, provides a rich source of information about the as-built building — exact measurements, materials used, changes from the original design and more. Integrating this with the city maps held in GIS means a continuous dataset can be formed.
Tools for construction site inspection and reporting
Photo: Alen Ajan/Fotolia.com
Developing building information models (BIMs) requires monitoring the build activity and accurate recording of the construction. The best way to do this is as it happens.
Simple-to-use tools that are robust enough to cope with a construction site are becoming more available from software providers. These support gathering data by construction teams and contractors as the work is completed.
As well as recording data, these tools are also useful in registering the progress and completion of tasks. Many enable interaction with central systems that can send changes and updates directly to the site for immediate action.
The same tools can register the location of the user, enabling safer working practices to be enforced.
The practice of geofencing to monitor or even restrict access to parts of a construction site, by registering the location of a device against a predefined region on a map of the site, can track critical activities and react with the most appropriate action if an incident is reported.
Remote site inspection and reporting
The Aeryon SkyRanger. (Photo: Aeryon Labs)
The safest inspections don’t involve human intervention at all. Sending an unmanned aerial vehicle, UAV or drone, to fly over your site removes risk to staff when viewing hazardous environments.
Photographic imagery collected by drone can be loaded into GIS tools and accurately registered against the map of the area to provide a seamless view of the site.
Data integration is key
The range of data that can be accurately gathered and viewed together now covers original 3D designs, 2D construction plans, inspection photo-imagery and as-built updates.
Integration of BIM and GIS tools means that these different data types can be viewed together and in the same spatial context.
Support for building operation, management and maintenance in the wider context of a smart city
On-the-spot data capture of accurate as-built building information models that can seamlessly integrate with existing city plans leads to a data resource that cities can build on to improve safety, security and facilities for their citizens.
So what should the smart city planner be looking for?
Existing geospatial and data management tools already address many of these challenges, and when an opportunity for a technology refresh is presented, the approach to smart city support should be a big part of the mix.
Christine Easterfield
Christine Easterfield is principal analyst for Cambashi. She has more than 20 years’ experience in the software business. Her experience has covered geospatial asset management for the utility industry: assessing market needs and opportunities, managing customer requirements, liaising with development teams and running global product introduction programs.
Previous roles include programming, training, consultancy and product marketing management.
She has worked for a range of companies from multinationals to small start-ups, resulting in an understanding of how different sized organisations operate, grow and manage change. Christine has a BSc in Computational Sciences and an MA in English Literature.
As Hurricane Florence rattles along the coastlines of the Carolinas and Georgia creating havoc, everything that flies is grounded. Right now the hurricane has slowed to a tropical storm, but flooding is extensive and people have died.
As soon as the high winds subside, expect almost all first response groups to put up UAVs to begin damage assessment. Digital images gathered by these drones will assist forward personnel to direct recovery and rescue operations. FEMA and other search and rescue teams, already in place along the track of the storm, have begun to rescue people by boat and are expected to fly drones over other inaccessible areas to find survivors.
And, of course, a significant part of the coverage we will see over the next week or so will come from drone-borne TV cameras and links to network uplink vans. We should also expect drones to be used for significant data gathering to map affected areas for damage to homes and infrastructure — including powerlines, radio and cellphone towers and distribution centers, waterways, roads and railways.
Let’s hope that the lessons learned and experience gathered during the major storms of last year will help everyone operating drones assist in minimizing the time to rescue people and to speed recovery from this latest hurricane. Later, expect the insurance companies to arrive with UAVs to assess damage and verify claims.
Police forces are using drones…
The law enforcement office in Dauphin County, Pennsylvania, has been using a drone for several months. With more than 13 investigations completed, the drone has helped locate one lost individual and has also supported crime-fighting.
Rather than calling out a manned helicopter for assistance, the police are able to get a drone in the air within 20 minutes at much less cost.
FAA regulations govern how Dauphin County law enforcement officials fly their drone, including a waiver granted to allow night-time operations.
…while Colombia is testing drones to destroy coca plants.
Recent growth in Colombian coca cultivation to 516,000 acres during 2012-2017 came as a consequence of the end of a government program to fumigate coca fields. Crop-duster planes spraying glyphosate had previously reduced Colombia’s coca fields from 470,000 to 193,000 acres during 2001-2012, according to U.S. figures.
Meanwhile, U.S overdose deaths from cocaine are continuing to increase, while rebels and drug traffickers have apparently shot down several crop-dusters.
Lawsuits against the use of the chemical glyphosate have also been successful. Over-spray is alleged to have killed other, legal crops, and opponents also cited a recent ruling in California that awarded $289 million in damages to a groundskeeper who said glyphosate-based weed killers had caused his non-Hodgkin lymphoma.
Because of concerns, Columbian police have been testing drones — flying a couple of feet above the plants to mitigate over-spraying of defoliants — to kill coca crops and reduce the supply of cocaine. Apparently, 10 remotely guided drones, each weighing 50 pounds fully loaded, destroyed hundreds of acres of coca in the first phase of tests. Though common in agriculture for the monitoring of crop growth, it’s thought that drones have never before been used to kill illegal crops. The fumigation appears to be about 90% effective to date.
Nevertheless, in Colombia’s drug zones, soldiers will be needed to partition swaths of coca-producing land and to defend operators from angry farmers and drug traffickers. There are also land mines which will need to be overcome from Colombia’s long rebel conflict and which pose a danger to drone operators.
Counter UAS (C-UAS) systems are on the rise.
The Drone Dome system uses Laser, RF and Radar. (Photo: Rafael)
As fast as drone technology is developing, counter UAS (C-UAS) systems are also being put in place to prevent unwanted drones from penetrating the air above sensitive facilities — by detecting and disabling them. There are purportedly more than 60 such C-UAS systems available in the U.S., with more in other countries including China and Russia.
Systems use various technologies for detection — such as radar, laser, optical/IR, RF “sniffer,” and acoustic. Drones can be disabled by RF and GNSS jammers, by spoofing of both the GNSS navigation or the control link, and can be brought down physically by high-power lasers, nets deployed by other drones, collisions by attack drones, by regular or specialized anti-drone gun systems and even by high-pressure water cannons for very close-in defense. Anti-drone systems include detection and take-down dome-based systems and man-portable drone guns.
SpotterRF C-UAV radar. (Photo: UAS Vision)
The UK government has acquired the Drone Dome C-UAS (counter-UAS), manufactured by Rafael, Israel. Detection is provided by an S-band radar (four radars provide all-round coverage), an electro-optical/infrared (EO/IR) surveillance suite, and a wideband RF sensor.
Drones can be disabled by a high-power laser, an RF jammer, or when very close-in by a high-pressure water gun. The UK system is expected to use jamming to bring down drones and doesn’t include the high power “hard-kill” laser option.
Depending on the size of the intruder drone, the radar detection range is around 3.5-10 kilometers, and the radar may also disable a UAV when integrated with the RF jammer. With an active electronically scanned array antenna, the radar is relatively small and light-weight for both fixed and mobile installations.
The DroneGun. (Photo: DroneShield)
Another C-UAV offering, from SpotterRF, claims to solve the problem of requiring multiple radar elements to achieve 360-degree “dome” coverage. The 3D-500 radar enables full “dome-drone” detection from 0 to 90 degrees vertical and 360 degrees horizontal using a single radar with a 500-meter detection radius, yet weighs only 12 pounds.
Latitude, longitude and altitude of intruder targets are measured within a 1-kilometer diameter hemisphere dome. Following radar detection of an unauthorized drone, the system may be augmented by a slew-to-cue optical/IR camera providing a visual display to an operator — a directional RF jammer on a pan/tilt turret can then be activated to take-down the intruder. The system operates automatically to both detect and disable the drone, or manual control is possible to enable initial operator confirmation of the target before take-down is activated.
DroneShield out of Australia markets a drone detection and mitigation system probably best known for its DroneGun. The DroneGun is a point and shoot device able to disrupt multiple RF frequency bands simultaneously (433 MHz, 915 MHz, 2.4 GHz and 5.8 GHz), taking out the communication link to a drone operator — and also GNSS signals when so equipped — up to 1 kilometer away.
The full DroneSentry detection system integrates a suite of sensors and countermeasures including radar, optical, RF listening, acoustic, thermal and an RF countermeasure transmitter with greater power and range than the portable DroneGun.
Another example is the Rex-1 drone gun. Operating in the 2.4 GHz and 5.8 GHz bands, the Rex-1 rifle-like drone-disabling device is a man-portable jammer developed by Russian Kalashnikov Group subsidiary ZALA Aero Group.
https://youtu.be/Px56KtpZ004
Mapping and survey are becoming a major application for drones.
One such example is 3D mapping of a copper mine in only three days using a fixed-wing UAS.
At an altitude of 1,400 meters, the Erdenet open-pit mine in Mongolia extends 5 x 2 kilometers and is more than 200 meters deep in places. Despite strong winds and even some snow in May this year, one UAS quickly captured geospatial data that enabled three-dimensional modeling of the large, complex site.
Site management is expected to use this initial model as a baseline against which future drone-maps will be compared, and to plan future mine operations.
However, extensive preparations over a two-week period were still required, including the installation of 21 ground control points, positioned using GPS RTK measurements. Re-verification of these points was also required from time to time before the survey, due to changes in the mine from ongoing mine operations, including dynamite blasting.
A MAVinci Sirius UAV was used to gather almost 7,000 aerial photographs which were processed through Agrisoft Photoscan Pro software to produce a detailed digital surface model. All the data collected will be used to create various internal views of the mine for continued mining operations. The mine produces about 26 million tons of ore each year, leading to approximately 530,000 tons of copper and 4,500 tons of molybdenum derivatives.
UAVs make medical deliveries.
Some U.S. medical facilities will soon be participating in a Department of Transportation test program to transport medical samples and supplies by UAV — the object being to obtain test results and medical supplies much quicker than at present. Matternet, Zipline and Flytrex — UAV companies already involved in deliveries by drone — will use several different UAVs in the program, which also aims to set up a number of medical distribution centers.
Matternet has been delivering medical supplies by drone in Switzerland, and Flytrex is focusing on food and package deliveries.
Delivery drone in Kasungu, Malawi. (Photo: AFP)
Meanwhile, Zipline and UNICEF have established an “air corridor” in the city of Kasungu in Malawi to test the transport of medical supplies by drone. Rwanda had previously used UAVs to deliver medication in Africa. Other underdeveloped countries without good ground infrastructure could well benefit by using life-saving drone deliveries for urgently needed medication.
Supporting police investigations, mapping of mines, and coca crop destruction all seem to be good examples of newer uses for unmanned air vehicles. And when policing of drone intrusion is required, looks like there are many new options to detect, disable and even take down unwanted drones. I’d say we seem to be making good progress towards better acceptance and that the industry is starting to grow up.
And let’s all hope that the efforts of all first responders in the Carolinas and Georgia continue through the many weeks of recovery from flooding and damage that are still to come, and that people can soon get back into their homes.
June’s Geointelligence Insider article on Jack Maple was the human interest article. One of the readers of June’s article had the opportunity to meet Jack Maple. I appreciate the feedback. This month’s article is based upon the recommendation of Geospatial Solutions Managing Editor Tracy Cozzens to cover the technical side of GIS and crime fighting.
Recap
Fighting crime with GIS sounds simple enough — map where the crimes are happening and where the bad guys are and send in the cops. That would be a gross over simplification. As always, there’s more to the case.
The first CompStat was founded in the pre-internet days of 1994 on a Commodore 64, harkening back to the days of 128-MB floppy disks and MS-DOS, a Jurassic period of computer evolution that marked some of the first steps into crime fighting’s digital era. The graph above is the current CompStat 2.0 from the NYPD. It is a GIS-based system, interactive, user-friendly and available to the public. Take note of the highlighted number.
Since CompStat was introduced, crime has fallen precipitously. As of this writing (Aug. 25, 2018) New York City has 183 reported murders year to date. By comparison, in 1990, prior to CompStat, there were 217 murders per month on average. More murders were committed per month in 1990 in New York City than what it will experience in all of 2018. Murders have dropped nearly 90 percent. In other words, nine out of 10 who would otherwise have been killed are alive to return to their families, parents, classmates and colleagues, and friends. The difference is staggering, providing tangible proof geospatial science is a benefit to humanity.
The arsenal of geospatial applications available for the crime fighter is enough to make any superhero envious. The list of these high-tech, integrated intelligence systems push the limits of science fiction.
The underlying strength of these systems is the robust GIS/GPS platform they are built on. Security cameras are geospatially connected to the network with dynamic mapping capabilities. This allows the surveillance video to be overlaid on GIS software in order to interact with more information and create actionable intelligence.
Cameras use a host of software algorithms that are able to recognize aggressive behavior, patterns, anomalies, change detection, biometric features, objects and text. Systems can integrate real-time information like social media feeds as well as live video, including facial recognition software scans for wanted individuals in real time. This information is shared with police officers in the field.
Police cars are becoming mobile command centers outfitted with a suite of sensors, and will eventually include drones. Police officers wear smart glasses augmenting information about who they are looking at in an intelligence and location-based context.
The police officer’s belt is Bluetooth enabled, connecting all these devices, as well as monitoring the officer’s vital signs. The officer’s gun is also Bluetooth enabled, reporting when it is drawn, the direction it is pointed and if it fired. The gun also comes with a chip for tracking purposes and to ensure only the officer it belongs to can fire the weapon.
The vest-worn camera is woven into the seamless geospatial network of sensors and records the officer’s experience from a first-person perspective.
Imagine this scenario. A crowd gathers at an intersection triggering an anomaly detection sensor due to the number of people gathering in that location at that time. Out of the thousands of security cameras being monitored at the Command and Control Center (C3), this video scrolls around and flashes yellow, bringing attention to the possible situation. Other mounted cameras that have that intersection in the field of view automatically align along the edge of the main security video projecting their imagery onto a 3D data model of the area. Police officers in the field nearest to that location are simultaneously alerted. No action is taken at this point except the police begin heading in that direction. Facial recognition software scans the video images for faces of known suspects. Social media and texts scroll next to the video and geospatially link to those in each frame of the video. Colored sentiment indicators showed levels of concern. Boxes outlining people in various colors correspond to threat levels determined by datamining multiple databases. Semi-persistent motion trails lag behind each box showing the speed and direction of people in the video. Pattern identification looks for convergence, divergence and synchronous movements.
Video analytics identify several people converging on a car that just pulled up. The license plate reader linked to the security camera reports the car as stolen with two traffic violations. Based on this preliminary information, the situation is elevated. A police officer is dispatched but before arriving, a drone launches from the police car outfitted with a true color camera and a stereographic infrared camera. The stereographic imagery pair is streamed live to the police officers entering the area of interest through their smart glasses and to a team of imagery specialists at the C3. The video analytics of the police drone are seamlessly integrated with the security camera videos focusing on the car and the individuals as it arrives on scene and surveils the area. Object recognition identifies three possible weapons on the persons of interest. The boxes around those individuals turn red. They are tagged for persistent surveillance by all security cameras in the area. The order is given to apprehend them for probable cause. More police officers are called in and before they arrive they know who they are looking for, where the person is located, and that they may be armed and dangerous. In less than a minute, the police arrive. The suspects flee. The drone follows one of them up the street into an alley. Two of the officers pursue him. The other two suspects jump into the car and drive away. License plate readers and security cameras track the car on a map showing the vehicle’s route and speed with corresponding real-time video as the vehicle passes into view of each camera. As the vehicle travels south a police officer steps out from a cross street and shoots an electromagnetic dart into the speeding vehicle, disabling it. The police officers approaching the car shine a disorienting laser light weapon called a dazzler at the suspects, preventing their eyes from focusing. The occupants are apprehended without incident. They are searched for probable cause and arrested for carrying handguns without a permit.
The other suspect fled on foot. The drone followed him relaying live imagery to the police officers’ smart glasses. Their smart glasses showed a real-time map of their locations and the suspect’s. They cornered him in a fenced area. Guns drawn, the smoky red light of the laser cutting through the air pointed at the suspect. He surrendered. No gun was found on the suspect but the drone video the gun being thrown into a dumpster. One of the officers went back and retrieved the gun.
Gun traces were run on the three confiscated weapons and one was identified as stolen, matching a description of a gun used in a recent homicide. One of the suspect’s fingerprints match those found on shell casings at a nearby location reported by gunshot acoustic sensors. Based on this information, there is probable cause and a tap and trace is approved electronically by a special task force judge. The phone records of the three suspects are searched linking them to the el Diablo gang. Several unknown numbers are also in the call logs. Those numbers are added to the case file to be investigated later.
Only one of the suspects has a known address. The other two have no known location. Activity extracted from phone records show their whereabouts over the preceding days pin pointing their main locus of operation. Search warrants are issued. Within hours of arresting the suspects, the locations are raided and searched. Officers discover a cache of weapons, drugs, laptops and other useful information.
Everything described above is already available — it is only a matter of time and money. And, if Dubai is any indication of things to come, police could soon be arriving on hoverbikes.
The police arriving within minutes is key to the success of preventive policing. Time saves lives. The goal is to intervene before crime happens. But how is it possible? Before answering, let’s look at some numbers.
By the numbers
In 2017 almost 84 percent of the population of the United States was considered urban residing within 106,400 square miles. The Bureau of Justice Statistics reports there are only 758,854 sworn officers in the United States. Maintaining the same 84 percent ratio as the population means only 634,847 officers cover those urban areas. Specifically, it breaks down to six police officers per square mile. It is one police officer for every 431 residents except that police, like all of us, work 40 hours a week, have days off, take vacations, etc., so, only one out of every six police officers is on duty at any given time. That is one police officer for every 2,153 residents; however, police often operate in pairs, so 4,306 residents depend upon two brave souls to protect them from danger.
Victims of violent crime are 2.1 percent of the population. In a sampling of 4,306 residents that equals 90 victims of violent crime every year. In the top 10 cities it is far worse. Police officers have an incredible responsibility placed on them and they rightly deserve our praise, support and respect for the dangers they face every day.
Why not more officers you ask? Police protection comes at a cost of $100 billion annually. Our relative safety is not cheap. Crime is a huge expense. Jails, trials, public defenders, prosecutors, judges and incarceration all cost money. Safety is expensive. Budgets are stretched thin. The answer for increased safety and security isn’t more police. The answer is integrated and intelligent technology systems leading to increased efficiency. Technology has benefitted most other professions. Now, the field of law enforcement and crime prevention are benefitting. Cost is the driving need. These efficiencies are being realized on a grand scale. Making matters more urgent is the worldwide mass migration as populations move towards cities. It is imperative to manage crime now rather than later.
Enter predictive policing — putting the power of open data, cloud computing, machine learning, geoscience and artificial intelligence in support of law enforcement and prevention. Basically, cities are broken up into grid patterns, typically 500×500 feet. Within each grid, crime data is compiled using multiple factors and resources, such as historical data, 9-1-1 calls, recent crime reports, and residences of known offenders and parolees. Even considerations such as the time, day of week, celebrations and cyclical events are taken into account. Information derived from security cameras, license plate readers, social media and financial transactions help the algorithm. The algorithms take into account information collected by authorized wire taps, call logs and other confidential sources. The goal of the algorithms are to include all available resources to develop the most complete and reliable dataset upon which the heatmaps base their probabilities. This helps police departments allocate their resources, know what to prepare for and, most importantly, know where to be to protect the public at large.
University of Montana, Research and Training Center (Data: U.S. Census Bureau)
Police tighten their patrols around the hotspots. Throughout their shifts those hotspots are subject to change depending upon new data. Mobile units simply focus their patrol efforts accordingly. Once a threat is reported, automated navigation routing systems show police the fastest route to the incident and their expected time of arrival. Officers continue to receive intelligence about the incident while en route to anticipate the situation prior to arriving. Knowing where the areas of highest probability are expected to occur focuses non-human assets too, such as geofencing the areas of interest and monitoring more closely for key indicators. This technology is not too different than numerical weather forecasting models predicting what and where weather events will occur in the next hour, three hours, six hours and so on. Numerical models continue to evolve making forecasting more and more reliable. And, although the past does not predict the future, it is a strong indicator. The disclaimer would be similar to the ones most have seen before, “Past performance does not guarantee future returns.” Sometimes preventing a crime is saving a life, sometimes it’s protecting property and almost always it is stopping someone from doing something they will later regret. All crime cannot be prevented but for every crime that is prevented there is a family spared from tragedy.
Preventive policing does more than help keep communities safer. It improves economic viability. Crime has an inverse relationship with a community’s vibrancy. As crime increases, prosperity decreases. Real estate values go down, the tax revenue goes down, employment opportunities go down, and safety, happiness and well-being go down. Crime is a societal disease. Reducing crime reverses those affects. Home values, employment, affluence and the quality of life all go up, which correlates to increased tax revenues. Thus, reduce crime and the city’s revenues increase. That means politicians can divert money into other programs to benefit the citizens. For these reasons there is bi-partisan support for computer based policing.
If you do the research you will see opposition efforts against artificially intelligent systems to fight crime, but those opponents are not well supported. Communities want to feel safer. Politicians want to be able to say they are using the latest technologies to keep the community safe. Companies want to prove their systems work in decreasing crime and capturing criminals. Crime prediction causes the greatest concern because it borders on Minority Report, but it is the echo of Jack Maple and William Bratton putting police where they need to be to support the people they need to protect. It is the essence of community based policing.
This article only touches on the front side of GIS and law enforcement, but there is another world on the back side piecing crime scenes together with forensics in artificially replicated environments. That too is a fascinating topic to explore.
Do yourself and your neighborhood a favor. Thank the police officers in your community for the job they do. They are foundational to the fabric of our society.
No, this is not a drill or a major motion picture event.
During my lifetime, many natural disasters that have taken place around the globe. These unfortunate events have created mass destruction and caused many deaths by a variety of environmental elements, ranging from earthquakes and volcanic eruptions to hurricanes and snowstorms.
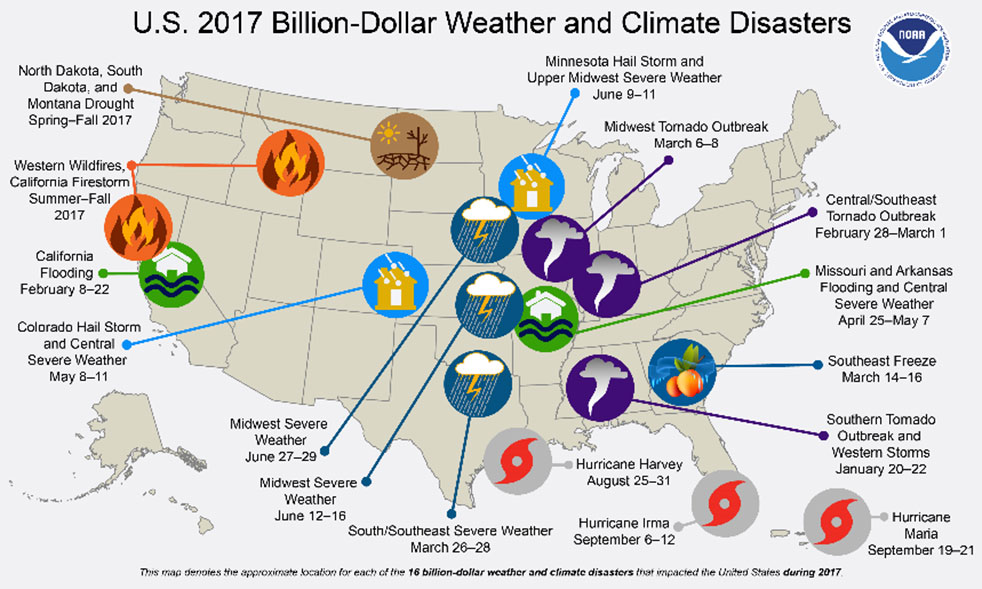
Disasters in the United States. (Image: FEMA)
Once Mother Nature decides to unleash her wrath, rarely anything stands in her way. Some types of disasters create situations worse than others, but all have a reputation of leaving a trail of death and destruction.
Search and rescue is the first and foremost priority when it comes to these disasters, with cleanup and rebuilding to soon follow.
The role of the land surveyor, however, doesn’t usually enter the discussion when it comes to these situations. It has always been considered an occupation that fills an important role in development, construction and parcel ownership, but rarely is discussed in the same terms as a fireman, policeman or doctor.
We will take a closer examination at how the surveyor uses skills developed through education, technical training and practical application of geographical data to quietly assist those in need through these difficult bouts with Mother Nature.
First, however, we will discuss various types of the deadliest natural disasters, the amount of destruction that has been caused and types of problems (besides deaths) that were left because of these tragedies.
Disasters throughout history
When describing natural disasters, the obvious ones come to mind: earthquake, hurricane/typhoon/cyclone, tornado, wildfire, flooding/monsoon, drought/famine, volcanic eruption, tsunami, sandstorm, avalanche, and snowstorm.
All of these have wreaked havoc on mankind for centuries, with more physical destruction taking place in the past few centuries.
Some of the factors leading to an increase in this devastation are gains overall population and amount of buildings and improvements in populated areas. Let’s look at how each disaster impacts the areas in which it occurs:
Flooding/Monsoon
Historically the deadliest type of natural disaster, rainfall through storms and monsoons cause flood events that have caused millions of deaths in several instances around the world. Most of the deaths caused by flooding situations are due to drowning in floodwaters that inundate areas not normally affected by normal amounts of rain.
The largest flood in recorded history took place in China during 1931, combining melting snow and ice with ongoing rain events to create a continuous flooding event that lasted most of the year. Death toll estimates range from 400,000 to almost 4 million, as many of the victims either died or moved to other regions with no trace.
Hurricane/Typhoon/Cyclone
This is another type of flooding disaster, but it combines large amounts of rain gathered from ocean storms with high winds to batter shoreline and inland areas. These storms can often stall in place, causing significant damage by both wind and rain.
Tornado
Most weather systems associated with creating tornadoes are believed to occur in the United States, but they happen all over the world. Many of the deadliest tornadoes have taken place in the Middle East, including Bangladesh, Russia and Pakistan. These storms can include torrential rain, but most of the damage caused by tornadoes is wind-related.
Earthquake
Shifting tectonic plates and earth-shaking tremors are a significant cause of damage and deaths throughout the world. Most of the highest death tolls have taken place in Asia, with the biggest loss of life occurring in Shaanxi, China, on Jan. 23, 1556, with more than 830,000 deaths.
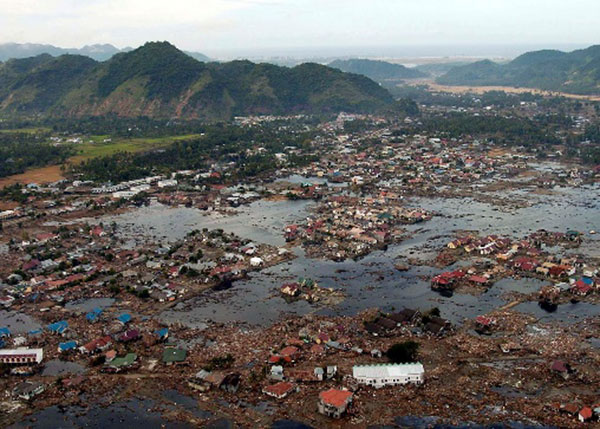
Indian Ocean (Jan. 2, 2005): A village near the coast of Sumatra lays in ruin after the Tsunami that struck South East Asia. (Photo: U.S. Navy/Photographer’s Mate 2nd Class Philip A. McDaniel)
Tsunami
Often a secondary disaster generally associated with earthquakes in coastal areas, tsunamis kill thousands by inundating shorelines with huge waves and sending vast amounts of water into low-lying areas and poorly constructed seaside villages. The largest tsunami in recent memory was on Dec. 26, 2004, in the Indian Ocean off the coast of Indonesia, with the death toll reaching 280,000 people.
Volcano
The biggest cause of earthquakes is typically molten lava expanding to shift tectonic plates, but volcanoes are formed with the lava and associated gases finding an escape in the Earth’s crust.
Once a volcano has formed, an eruption can lead to significant damage from lava flow onto adjacent land and hot ash spewed into the atmosphere. Many volcanic eruptions throughout history have buried local cities and villages, making them virtually disappear.
Wildfire
Grabbing the headlines more recently has been the proliferation of wildfires. While not causing the substantial loss-of-life associated with many other natural disasters, wildfires are responsible for scorching hundreds of thousands of acres of forest and brush areas, as well as decimating neighborhoods.
Avalanche
This disaster only takes place in locations with significant snow pack and elevation changes. After large amounts of snowfall, various factors lead to movement of large areas of snow and ice down mountainous slopes. Often these events take place near cities and villages in mountainous regions and can leave the inhabitants buried and unreachable.
Other Types of Natural Disasters
While the varieties of events listed above can create large-scale destruction, there are others that, while smaller in nature, can collectively cause great damage and loss of life. Thunderstorms, snowstorms and sandstorms are wind-related and can be devastating to the areas being affected.
Other natural disasters that often don’t get the same recognition as those listed above include drought and famine. These environmental tragedies ruin thousands of lives, and it take years to recover from the damage caused by these inflictions.
Disaster hits. Now what?
June 28, 2008: A house in Parkersburg, Iowa, is being rebuilt while debris from a deadly EF5 tornado still covers the ground. (Photo: FEMA/Richard O’Reilly)
All of these disaster types have led to a great number of fatalities and total devastation of cities and roadways. To help us understand what type of assistance the surveyor can provide, we first need to identify the conditions left by each of these events.
Most of the disasters simply wipe out whatever is in its path; from tornadoes, hurricanes, and wildfires to earthquakes, avalanches and tsunamis, the regions affected are left in shambles after the occurrence.
The initial search and rescue through the rubble takes manpower and careful identification of areas where people are known to inhabit, either as residences, places of employment or public spaces. These areas require retracement of existing mapping and atlases to accurately identify those places for timely recovery.
Once the search-and-rescue efforts have ceased and cleanup/rebuilding commences, the destroyed areas will need to be remapped based upon existing parcels and ownership rights. Reconciliation of existing parcels, subdivisions and rights-of-way will be required to properly return the injured areas to a habitable state.
The one disaster that’s a big wildcard, however, is the earthquake. The devastation is like the others and generally will need rebuilding like the others, but with one large difference; putting everything back where it belongs.
When large tremors cause significant shifts in inhabited and/or complex parcels, the ability to retrace existing parcels, subdivisions and rights-of-way to place them in their original location becomes a nightmare.
How surveyors and GNSS help before and after disasters
As expert measurers and establishers of boundaries, the surveyor provides guidance for the creation of parcels and rights-of-way. Through extensive education, training and experience, the surveyor combines field reconnaissance, legal definitions of parcels and high-level mathematics to provide direction for the creation and retracement of real property.
After experiencing a devastating event like the ones described above, the surveyor becomes a key position in rebuilding the affected area.
Prior to the invention and proliferation of GNSS technology, however, the use of state plane coordinate data was a tedious and time-consuming task (see my January 2017 article at GPS World).
Establishing coordinate values across a large region and/or utility system was not practical from a time or cost viewpoint. The arrival of GNSS technology in the 1990s changed that situation with the ability to determine coordinate values in real-time and create large databases of infrastructure and utility information. Government agencies (and surveyors) now could replicate, with acceptable accuracy and precision, locations of improvements and utilities throughout their jurisdiction.
Surveyors are now being called upon to assist with search and rescue efforts when these disasters hit to help locate and turn off existing utilities (i.e. electricity, gas, water), and to provide mapping assistance for retracing where people may be in the rubble. Because lives are at stake, timely location is essential for these services and GNSS technology use by the surveyor provides a much-needed service.
Once these disaster events being a rebuilding mode, the surveyor steps in to find the existing parcel and right-of-way lines to assist the respective owners where a deed or roadway was previously located. Most times, the surveyor can retrace existing line by locating buried monuments and recreating existing deed descriptions and/or roadway locations.
Where there becomes a problem is when the devastation is large enough to destroy all existing monuments and leave no trace of any occupied land. The surveyor must expand the search area, as far as needed, to find the closest available monuments in which to begin rebuilding the parcel descriptions.
Depending on the site conditions, GNSS equipment is used to locate the positions of the nearest monuments so the surveyor can perform retracement calculations for the disturbed area.
Once the area to be re-established to calculated, the surveyor can return to the site and place markers signifying parcels and rights-of-way for the rebuilding of roads, utilities and buildings. GNSS receivers are again utilized to increase the proficiency of the field crew by allowing the installation of the markers over a large area in a short amount of time.
How surveyors can prepare for future events
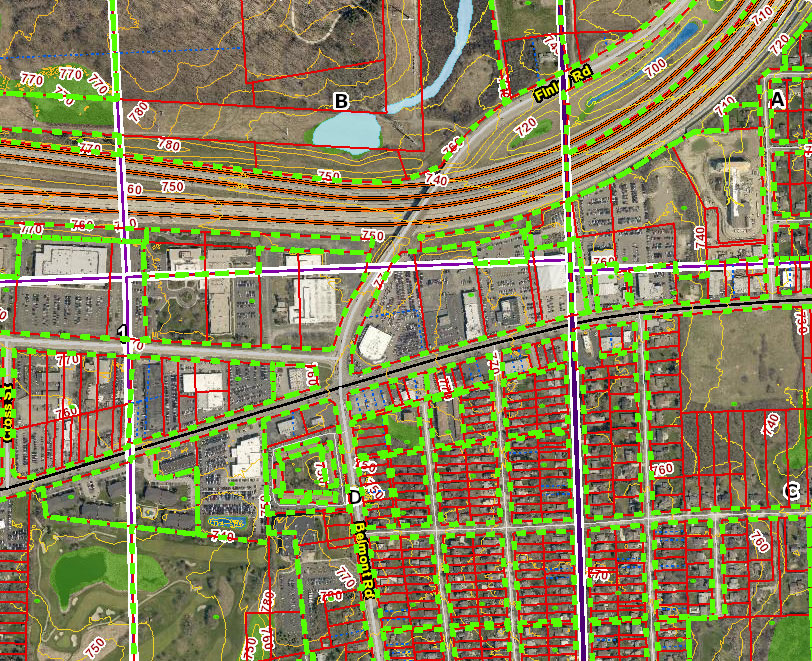
Image: DuPage County, Illinois, GIS
As previously written in my January 2017 column, GNSS technology has helped expand geographic information systems (GIS) into a database beast, containing everything from voter districts, zoning regions and floodplain maps to locations of most municipal utility maps and databases.
When these databases have included a geodetic layer of survey information overseen by the licensed land surveyor, the GIS is now more than a glorified digital Etch-A-Sketch. These entities within the database have geolocation as part of its dataset, with varying accuracy depending on the source of the data.
By having all this information available in a digital format, typically saved in a cloud-computing location, the ability to replicate these entities becomes a simple exercise. As more information becomes available, it needs to be included into the database for future mapping consideration.
All relevant data, together with a geolocation tag, becomes valuable for future retracement. This information could be used to locate possible survivors during a disaster event.
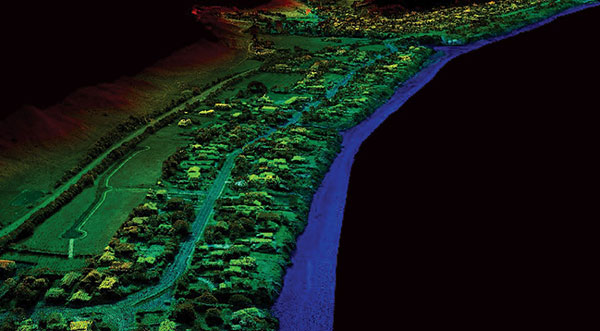
Upcoming technology to assist surveyors with disaster relief planning
Image: Esri
Many of the tools being utilized by surveyors have the capability of helping with mapping and data collection of municipal and public facilities for GIS database inclusion.
We currently use laser and lidar scanners both terrestrially and aerially to collect point-cloud data for establishing existing conditions of various sites. This point cloud, along with high-resolution photography, can be used to augment and enhance new and existing GIS databases with extensive datasets.
By having this additional information collected and available digitally, qualified experts can perform disaster simulation tests to depict various environmental events and determine what strategies will be necessary for search-and-rescue efforts.
These experts can also use this data to predict potential flood paths, conduct seismic modeling to determine building shift, and combine weather conditions with conceivable wildfire-capable areas. All these potential life-saving exercises can utilize the surveyor as a significant data-collection source.
Coming to a theater near you…
Whether one believes in climate change or just being affected by an active environmental cycle of natural disasters, the entire world is prone to have an occurrence of at least one of these events.
Since these events are not going away, remember to help your fellow man, woman or child in their time of need. It is the duty of the surveyor to provide a service that is intended to protect the public, and being there for disaster planning, prevention and recovery is part of our mission.
Think of us like the Avengers; now there’s a sequel I’d pay to see.