Category: Opinions

  • NGS releases beta coordinates and multi-year CORS solution

    NGS releases beta coordinates and multi-year CORS solution

    My last column discussed the preliminary results of NGS’ second Multi-Year CORS Beta Solution of the National CORS. Since my last column, NGS announced the release of the beta version of the hybrid geoid model GEOID18 and, on Feb. 15, NGS officially released the Beta CORS ITRF2014 coordinates and velocities.

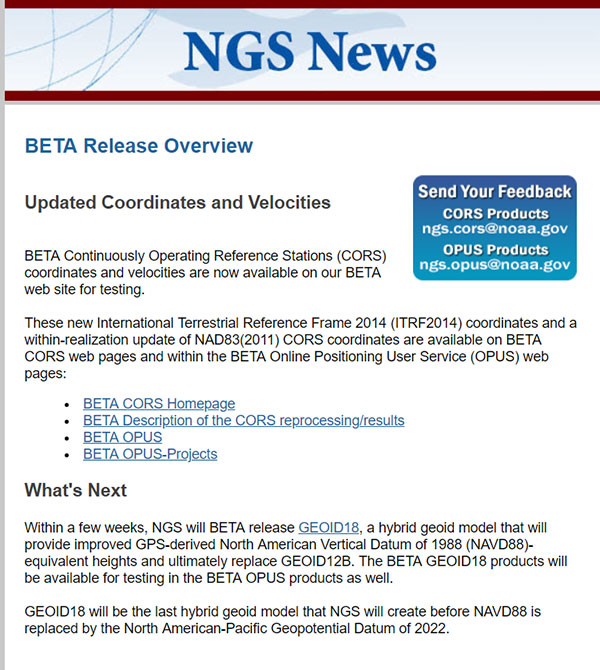
    This column provides the official links to NGS website that provide the beta coordinates and information about the latest multi-year CORS solution. Below is the NGS announcement of the beta release of the updated coordinates.

    Excerpt from Feb. 15, 2019, "NOTICE: New BETA Coordinates Available for CORS and OPUS". (Screenshot: NGS)
    Excerpt from Feb. 15, 2019, “NOTICE: New BETA Coordinates Available for CORS and OPUS”. (Screenshot: NGS)

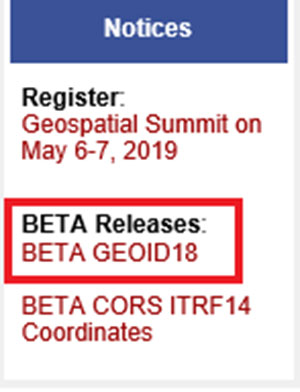
    NGS also provides a notice of the new beta coordinates on the National Geodetic Survey homepage, with a link to the Beta CORS ITRF14 coordinates (see the highlighted section below).

    National Geodetic Survey homepage. (Screenshot: NGS)
    National Geodetic Survey homepage. (Screenshot: NGS)

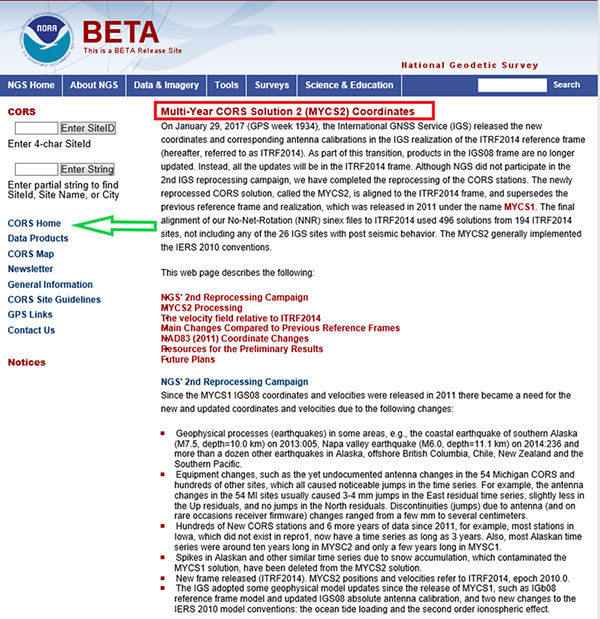
    Clicking on the hyperlink labeled BETA CORS ITRF14 Coordinates directs you to the Multi-Years CORS Solution informational homepage.

    Information on Multi-Year CORS Solution 2. (Screenshot: NGS)
    Information on Multi-Year CORS Solution 2. (Screenshot: NGS)

    By clicking on the CORS Home button, the user is directed to the Beta CORS page.

    Beta CORS release page. (Screenshot: NGS)
    Beta CORS release page. (Screenshot: NGS)

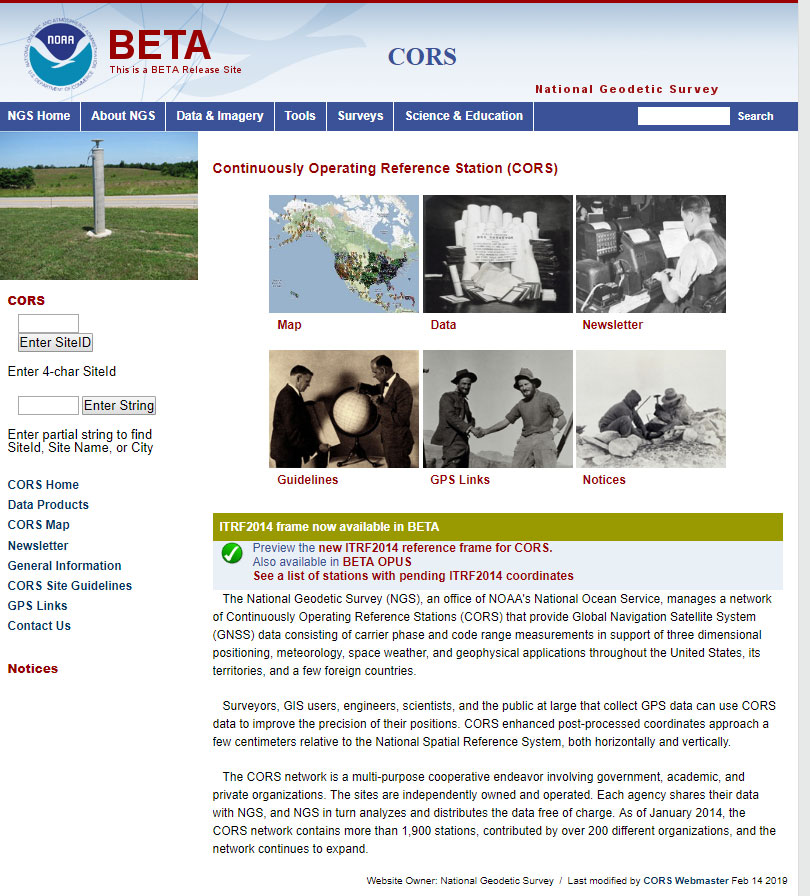
    This page clearly states that the ITRF2014 reference frame for CORS is available as a beta product. It also implies that these coordinates are being used in other beta products such as OPUS. I’ll address this later in this column.

    Users can obtain information about the MYCS and other related products and services such as Beta OPUS by clicking on links provided on the Beta CORS homepage.

    Accessing information about ITRF2014 frame in NGS beta products. (Screenshot: NGA)
    Accessing information about ITRF2014 frame in NGS beta products. (Screenshot: NGA)

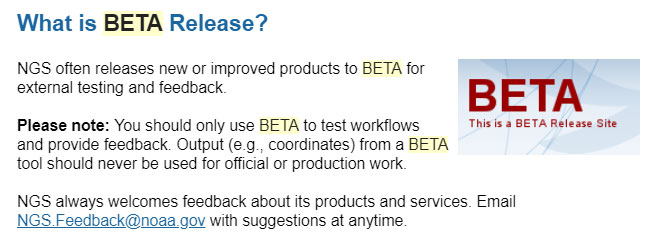
    It should be noted that these values are considered “beta” and are available to users for testing and feedback. NGS provides a statement about its beta release products. Basically, it states that users should only use beta products to test their workflows and never for official or production work.

    The NGS beta release statement. (Screenshot: NGS)
    The NGS beta release statement. (Screenshot: NGS)

    To facilitate testing of the beta CORS coordinates and velocities, NGS provides links to other beta products that will use the MYCS 2 coordinates and velocities.

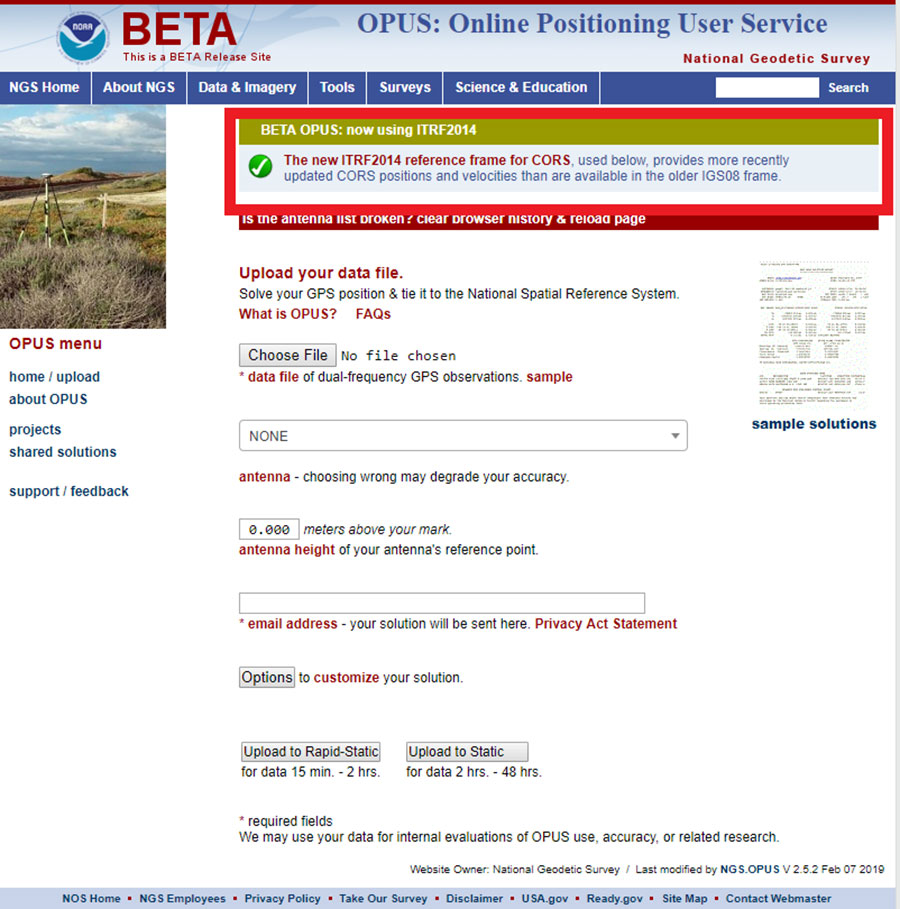
    By clicking on the link labeled BETA OPUS on the beta CORS homepage, the user is directed to the BETA OPUS webpage. This page clearly states that the beta OPUS routine uses the new ITRF2014 reference frame for CORS.

    The NGS beta OPUS webpage. (Screenshot: NGS)
    The NGS beta OPUS webpage. (Screenshot: NGS)

    NGS also provides a link to Beta OPUS Projects that use the MCYS2 coordinates and velocities.

    Beta OPUS Projects webpage. (Screenshot: NGS)
    Beta OPUS Projects webpage. (Screenshot: NGS)

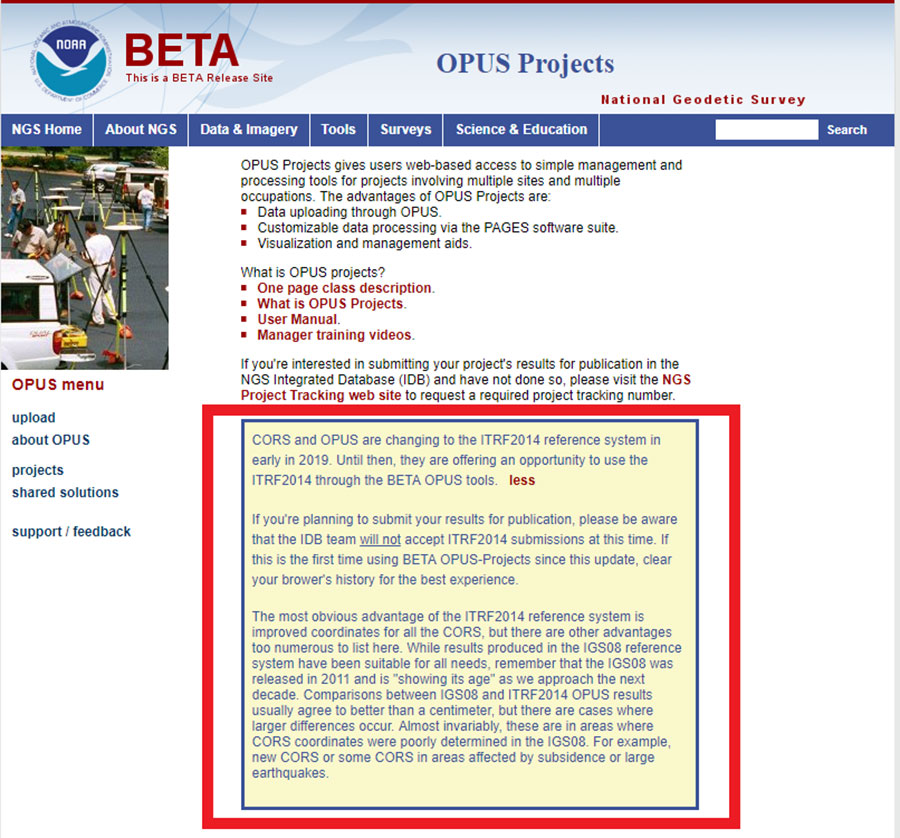
    Once again, the Beta OPUS Projects website clearly states that the beta version is using the CORS coordinates and velocities from the MYCS2. It also states that, at this time, NGS will not accept ITRF2014 submissions for publication. As previously stated, NGS’ beta products are for users to test their workflows and should never be used for official or production work.

    The Beta CORS webpage provides a lot of valuable information on the processing and establishment of the multi-years CORS solution. I’ve highlighted several of the sections below.

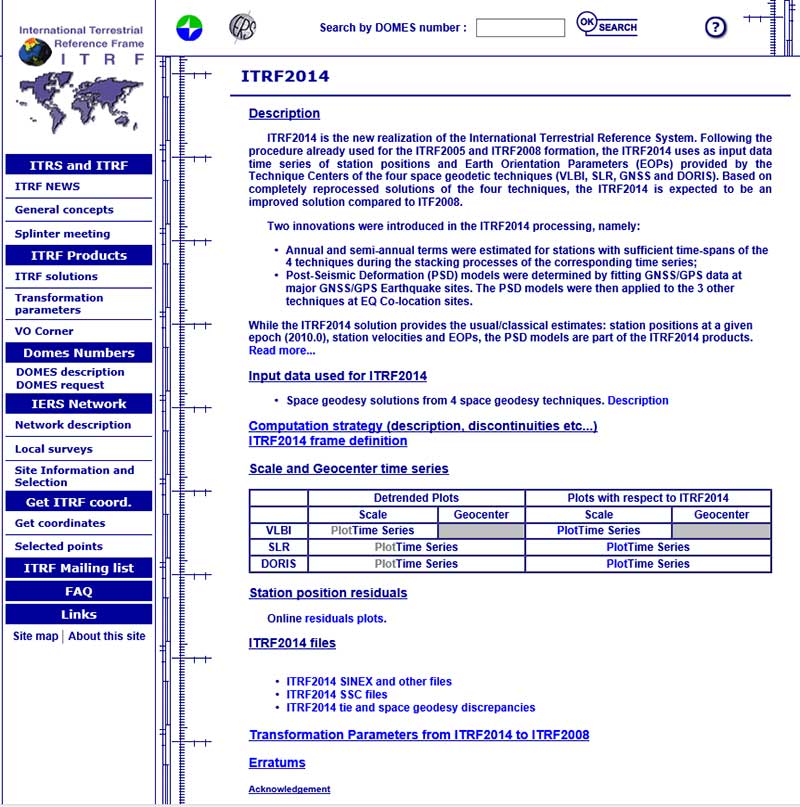
    First, by clicking on the link MYCS2 Processing, the user is directed to the section that describes the data used and the processing strategy.

    Excerpt from Beta CORS Webpage – MYCS2 Processing. (Screenshot: NGS)
    Excerpt from Beta CORS Webpage – MYCS2 Processing. (Screenshot: NGS)

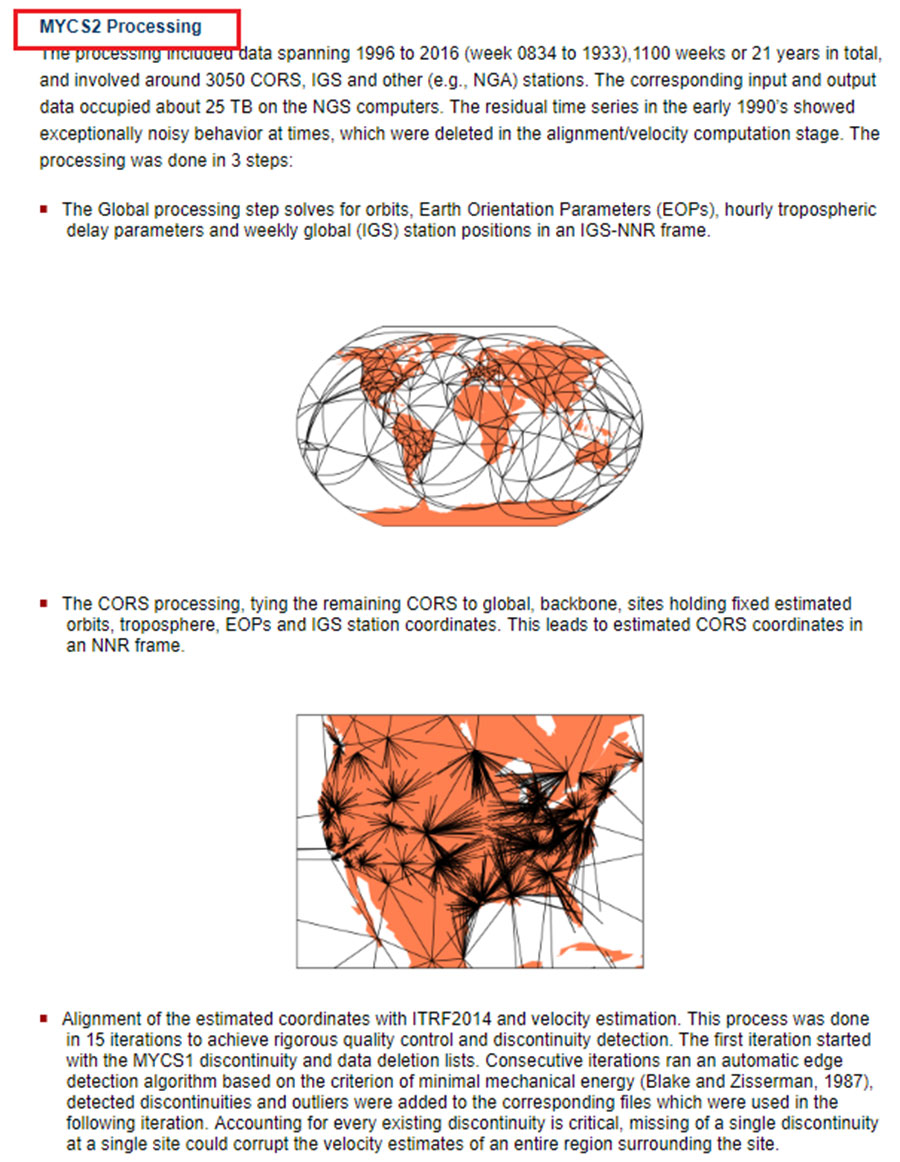
    The following are highlights from the section:

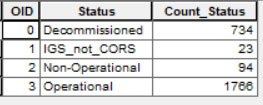
    • The processing included data spanning 1996 to 2016 and involved around 3050 CORS, IGS and other (e.g., NGA) stations.
    • The corresponding input and output data occupied about 25 TB on the NGS computers.
    • The residual time series in the early 1990s showed exceptionally noisy behavior at times, which were deleted in the alignment/velocity computation stage.
    • The processing was performed in 3 steps:

    1. The global processing step solves for orbits, Earth Orientation Parameters (EOPs), hourly tropospheric delay parameters and weekly global (IGS) station positions in an IGS-NNR frame.

    2. The CORS processing step ties the remaining CORS to global, backbone, sites holding fixed estimated orbits, troposphere, EOPs and IGS station coordinates. This leads to estimated CORS coordinates in a no net rotation (NNR) frame.

    3. The last step is the alignment of the estimated coordinates with ITRF2014 and velocity estimation. This process was done in 15 iterations to achieve rigorous quality control and discontinuity detection.

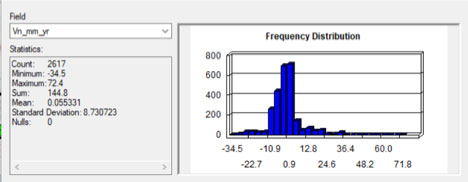
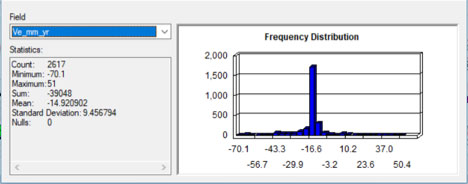
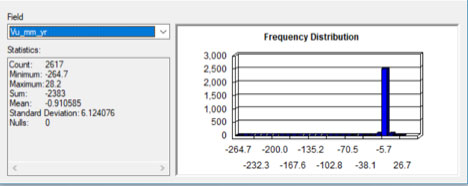
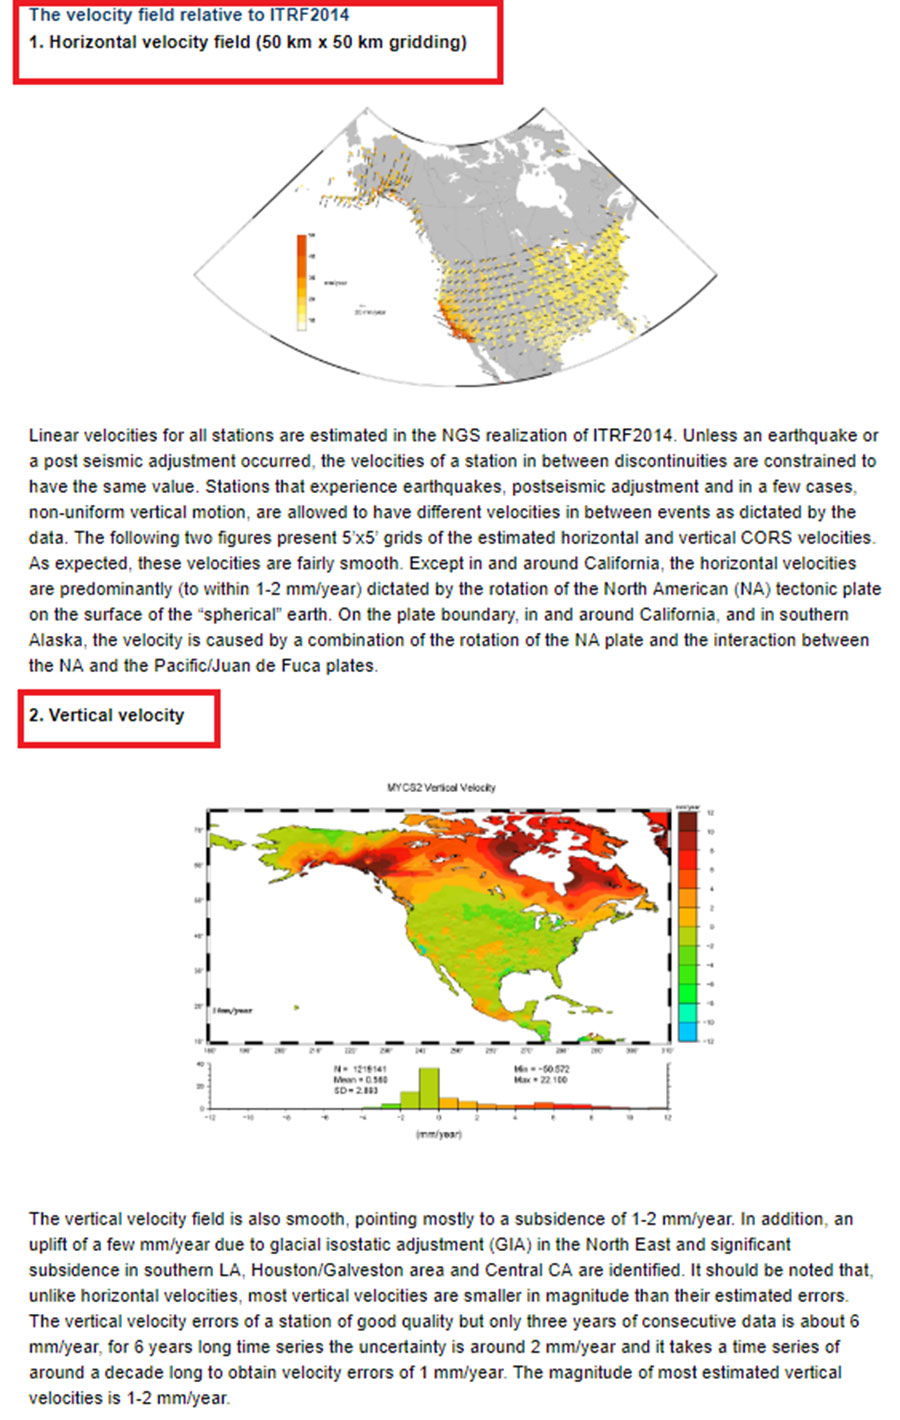
    Linear velocities for all stations are estimated in the NGS realization of ITRF2014. NGS explains how this was implemented in the section titled “The velocity field relative to ITRF2014” (see box titled “Section Describing the Velocity Field Relative to ITRF2014”). The website provides figures that depict the horizontal and vertical velocities used in the processing.

    The following are a few highlights from the section:

    • Unless an earthquake or a post seismic adjustment occurred, the velocities of a station in between discontinuities are constrained to have the same value.
    • Stations that experience earthquakes, post seismic adjustment and in a few cases, non-uniform vertical motion, are allowed to have different velocities in between events as dictated by the data.
    • The webpage provides figures that depict the estimated horizontal and vertical CORS velocities.
    Section describing the velocity field relative to ITRF2014. (Screenshot: NGS)
    Section describing the velocity field relative to ITRF2014. (Screenshot: NGS)

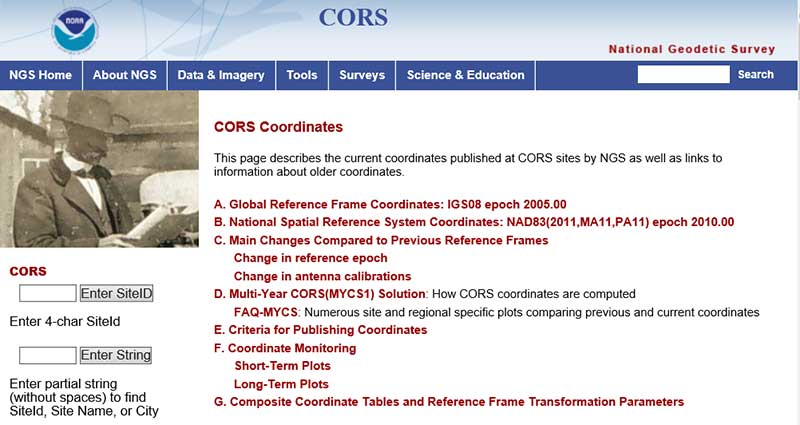
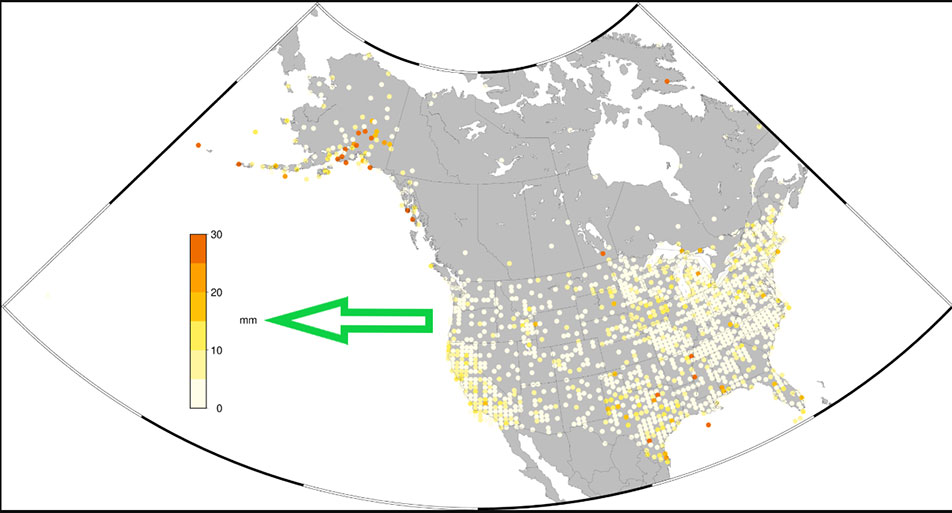
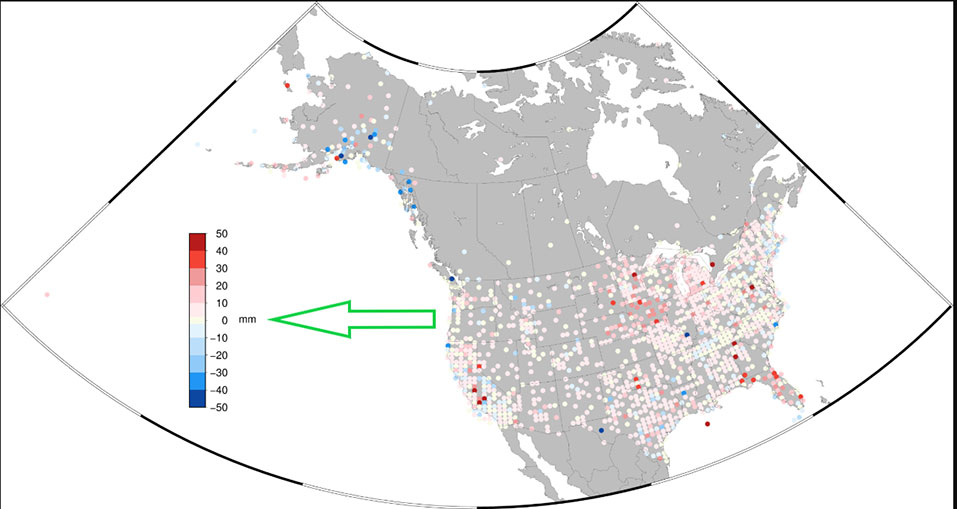
    What users usually want to know is how much the coordinates have changed and what it means to their surveying activities. The section titled “Main Changes Compared to Previous Reference Frames” provides information and plots that depict the changes of coordinates.

    Section on changes in coordinates. (Screenshot: NGS)
    Section on changes in coordinates. (Screenshot: NGS)

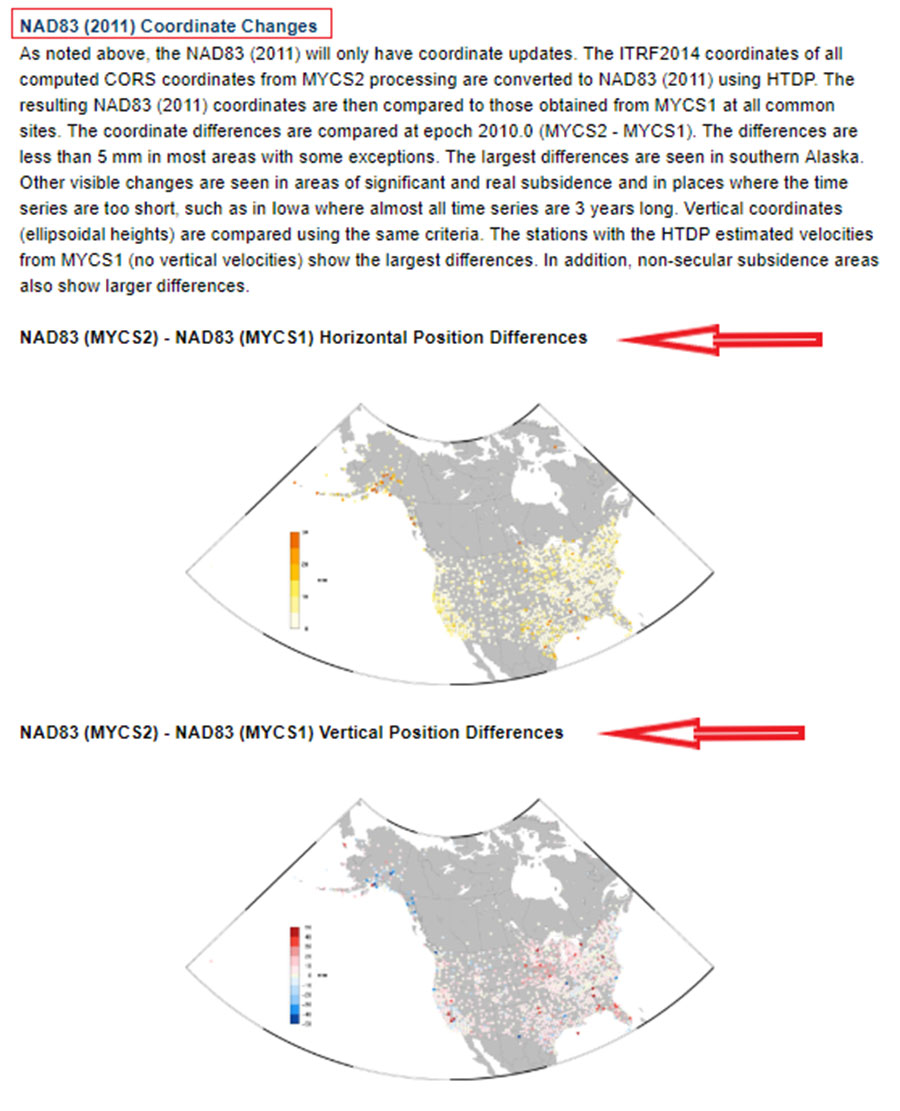
    This section provides NAD83 (MYCS2) coordinate values minus NAD83 (MYCS1) coordinate values.

    The following are a few highlights from the section:

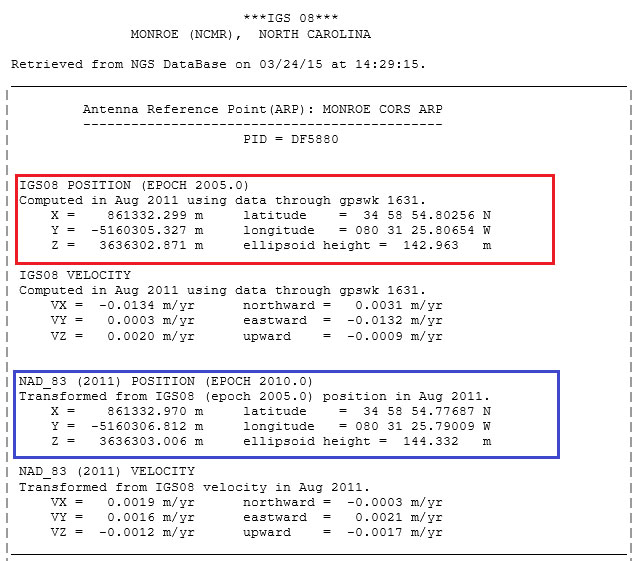
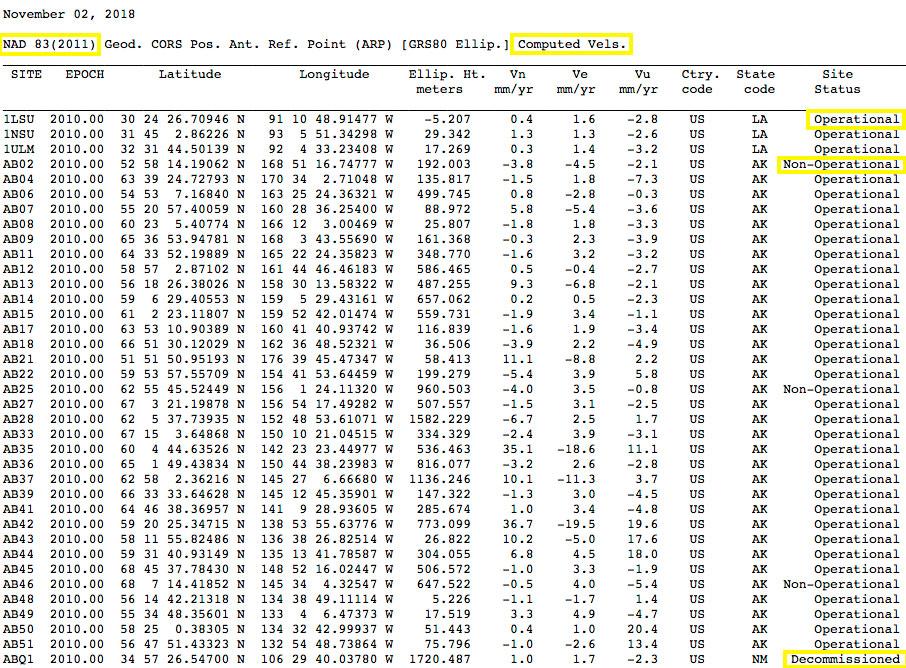
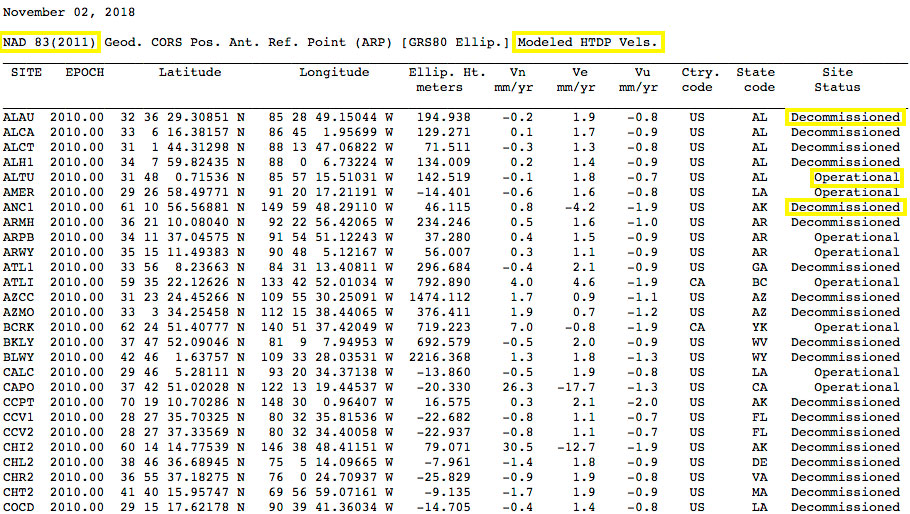
    • The ITRF2014 coordinates of all computed CORS coordinates from MYCS2 processing are converted to NAD83 (2011) using HTDP.
    • The resulting NAD83 (2011) coordinates are then compared to those obtained from MYCS1 at all common sites.
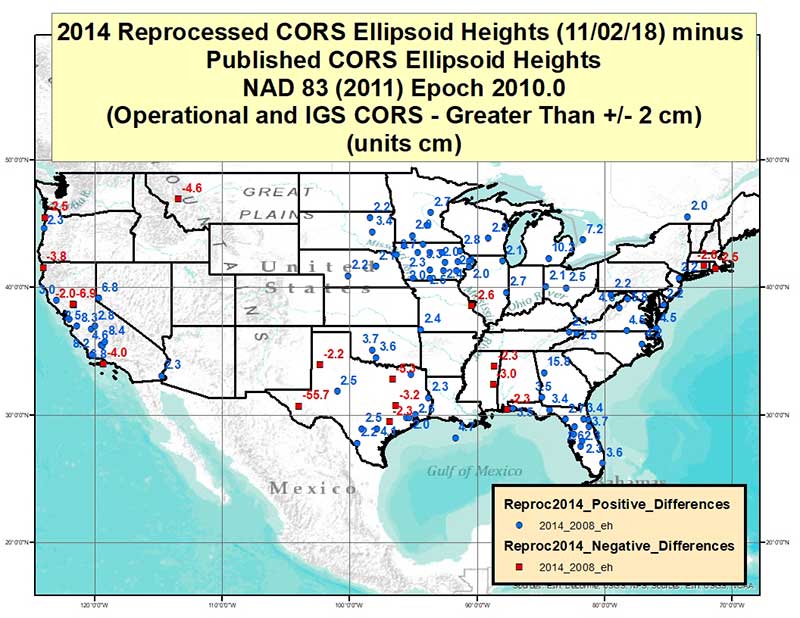
    • The coordinate differences are compared at epoch 2010.0 (MYCS2 – MYCS1).
    • The differences are less than 5 mm in most areas with some exceptions.
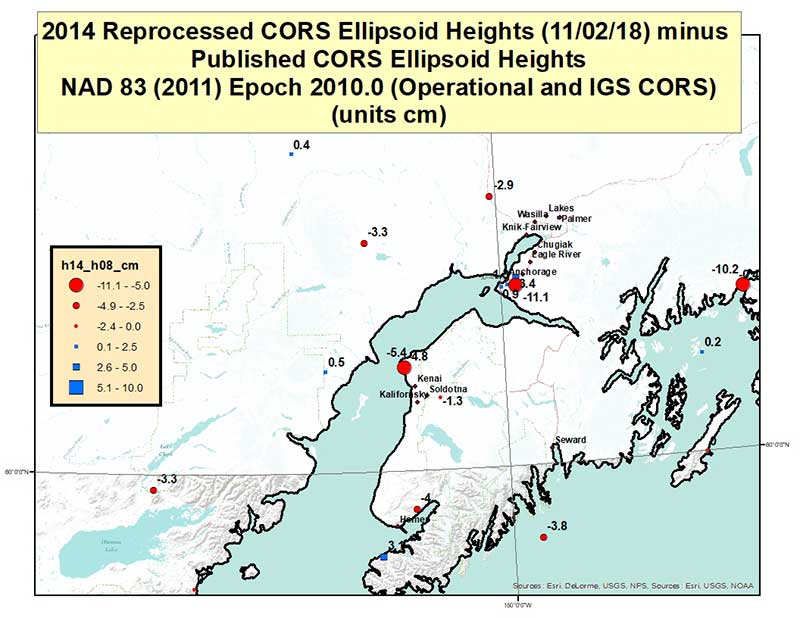
    • The largest differences are seen in southern Alaska.
    • Other visible changes are seen in areas of significant and real subsidence and in places where the time series are too short, such as in Iowa where almost all time series are three years long.
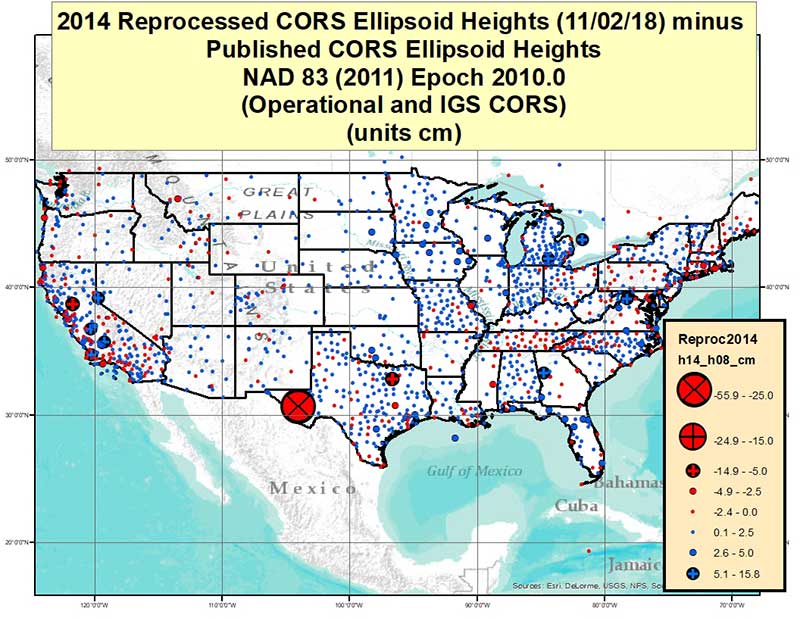
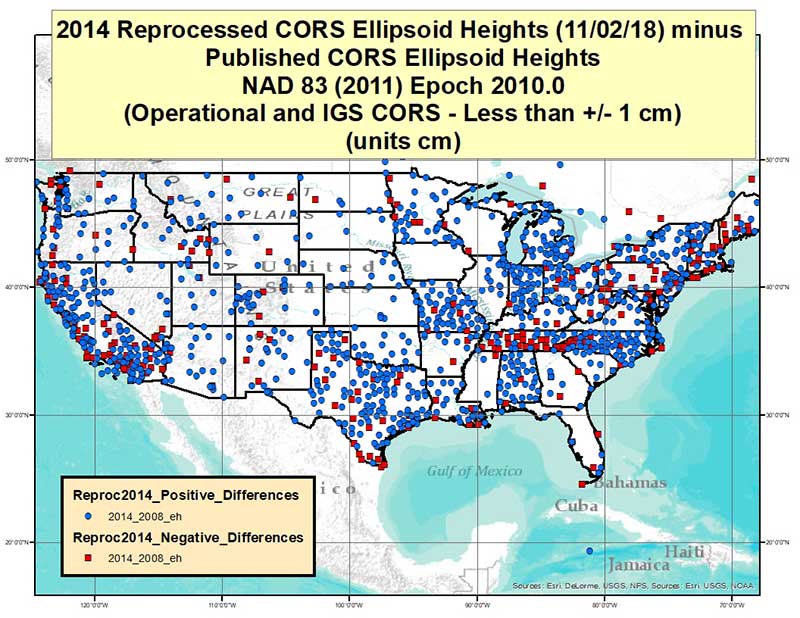
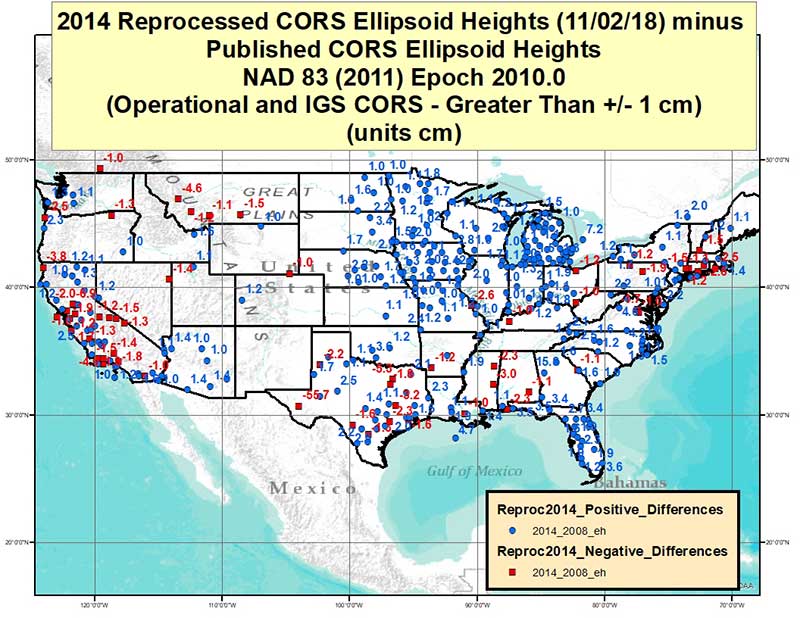
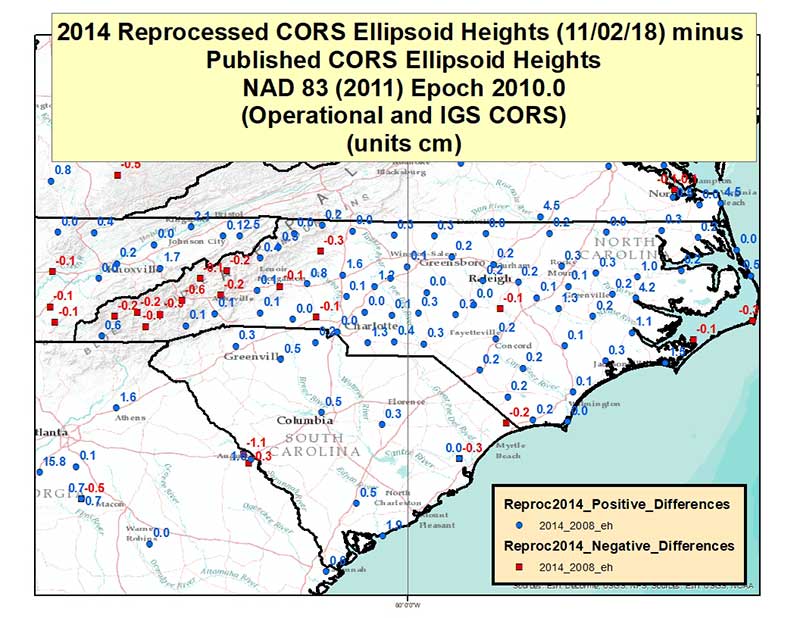
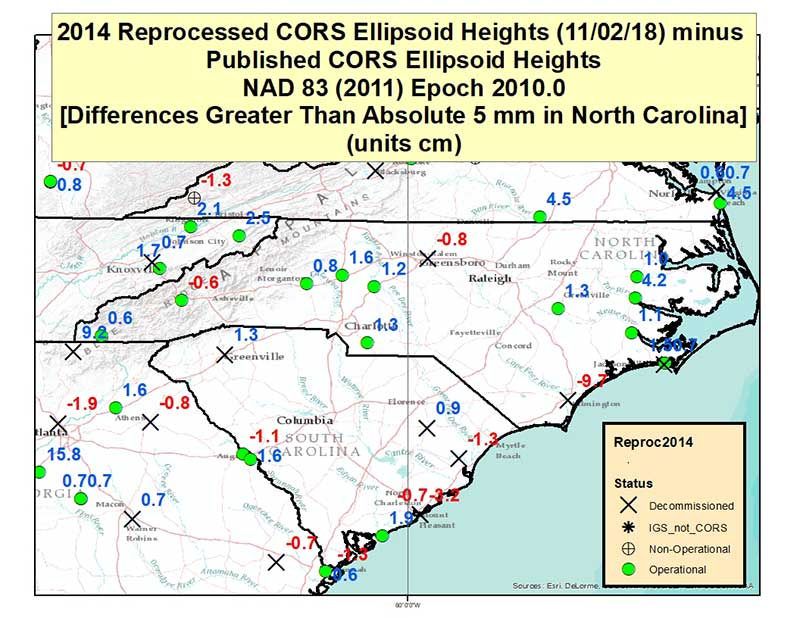
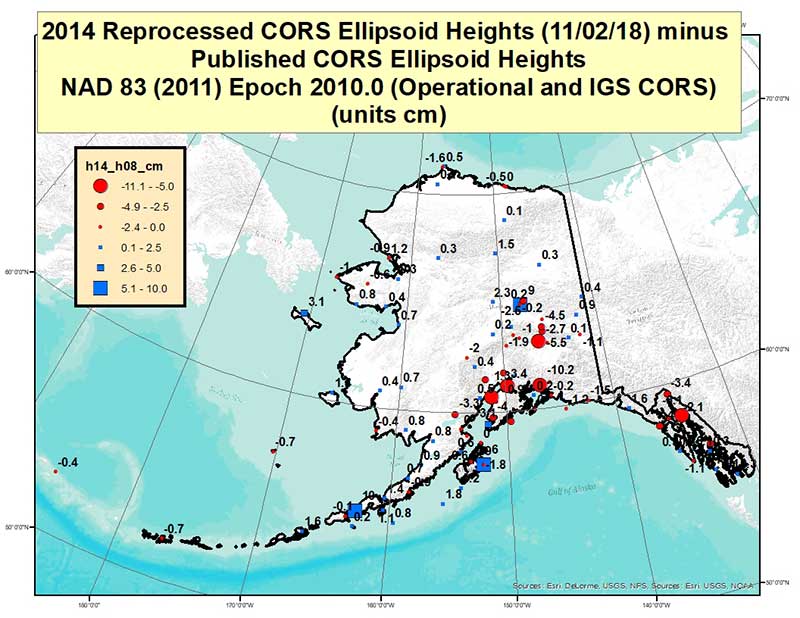
    • Vertical coordinates (ellipsoidal heights) are compared using the same criteria.
    • The stations with the HTDP estimated velocities from MYCS1 (no vertical velocities) show the largest differences. In addition, non-secular subsidence areas also show larger differences.

    By clicking on the plots, the user is directed to a larger figure that is easier to interpret. (See boxes titled “NAD83 (MYCS2) – NAD83 (MYCS1) Horizontal Position Differences” and “NAD83 (MYCS2) – NAD83 (MYCS1) Vertical Position Differences.”)

    NAD83 (MYCS2) - NAD83 (MYCS1) Horizontal Position Differences. (Screenshot: NGS)
    NAD83 (MYCS2) – NAD83 (MYCS1) Horizontal Position Differences. (Screenshot: NGS)
    NAD83 (MYCS2) - NAD83 (MYCS1) Vertical Position Differences. (Screenshot: NGS)
    NAD83 (MYCS2) – NAD83 (MYCS1) Vertical Position Differences. (Screenshot: NGS)

    NGS has done a tremendous job of explaining the MYCS2 process and results. As the results indicate, most differences between the MYCS1 and MYCS2 are small. Saying that, I would encourage all users to look at the NGS Beta webpages and obtain an understanding of the MYCS2 process and results. Users should also use the beta products and compare their results to the current production products to evaluate the CORS beta coordinates and velocities in their region of interest.

    Notice announcing beta version of Geoid18 on NGS homepage. (Screenshot: NGS)
    Notice announcing beta version of Geoid18 on NGS homepage. (Screenshot: NGS)

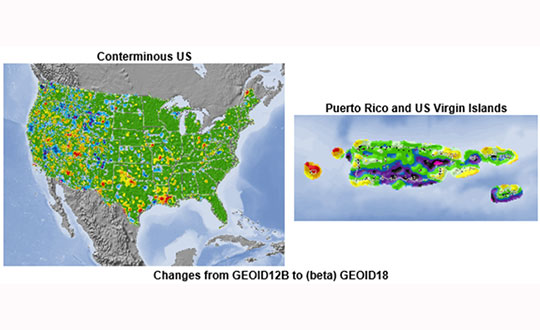
    It should also be noted that in late February, NGS released a beta version of the latest hybrid geoid model, Geoid18. This model can be accessed here; the site provides an opportunity for users to compute a beta Geoid18 value for a particular station.

    Excerpt from beta Geoid18 website. (Screenshot: NGS)
    Excerpt from beta Geoid18 website. (Screenshot: NGS)

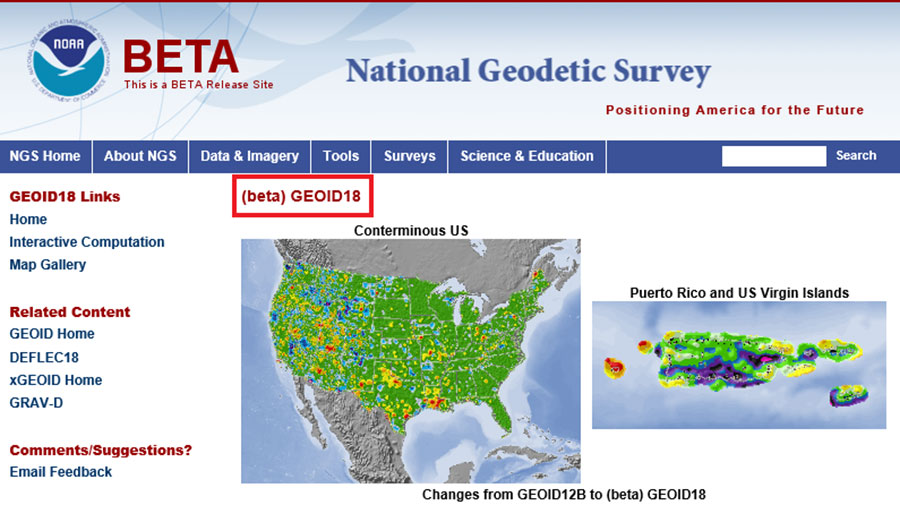
    I would encourage all users to obtain an understanding of the new hybrid model. Once again, it should be noted that this model is a beta model for users to test their workflows and should never be used for official or production work.

    My next column will discuss the beta hybrid Geoid18 model, and the differences between the beta model and the official hybrid geoid model, Geoid12B.

  • Editorial Advisory Board PNT Q&A: Simulation challenges

    Editorial Advisory Board PNT Q&A: Simulation challenges

    What’s the biggest challenge in simulating new GNSS signals for manufacturers’ product testing?

    John Fischer
    John Fischer

    “Anyone can follow a spec, but real expertise is required for interpreting nascent ICDs, looking for inconsistencies and pitfalls. The first receivers to market may not always get it right, especially before and during early live-sky signal broadcasts.” — John Fischer, Orolia


    Ellen Hall
    Ellen Hall

    “The challenge is twofold. Manufacturers are constantly implementing new signals, which is extremely difficult and expensive to do without the use of a simulator in a lab. The second problem manufacturers are facing is integrating secure signals across international constellations.” — Ellen Hall, Spirent Federal Systems


    Julian Thomas
    Julian Thomas

    “The industry has been stimulated by growing constellations and the arrival of new signals, resulting in an increasing number of sophisticated receivers hitting the market. Our biggest challenge is ensuring that all simulated signals work on all of these receivers.” — Julian Thomas, Racelogic Ltd.

  • Land ho! Uncharted island ahead

    Land ho! Uncharted island ahead

    A new island near Tonga has officially been surveyed, courtesy of Goddard NASA scientist Dan Slayback.

    Most new islands vanish as fast as they appear from punishing ocean waves, but this one is different. It’s one of only three volcanic islands to live longer than a few months in the past 150 years, and the first survivor since satellites began collecting Earth imagery.

    “There’s no map of the new land,” Slayback said. The island, nestled between two older islands, erupted from the rim of an underwater caldera in early 2015. The older islands were on some nautical charts at coarse resolution.

    Slayback has been watching the island via satellite since its birth, trying to make a 3D model of its shape and volume as it changes over time to understand how much material has been eroded and what it is made of that makes it partially resistant to erosion. But while high-resolution satellite observations provide some data, nothing beats a visit.

    On Oct. 9, 2018, Slayback and students with the Sea Education Association (SEA) measured the location and elevation of boulders and other erosional features visible in the satellite image. Using a high-precision GPS unit with a rover and base station, Dan and the students took about 150 measurements that narrow down each point’s location and elevation to better than 10 centimeters. They also used a drone to conduct an aerial survey of the island for another layer of observations to make a high-resolution 3D map.

    The elevation changes were more dramatic than Slayback expected. The data that the team gathered on the ground will help scientists hone the model they use to convert satellite images to ground heights, according to NASA.

    NASA scientists are keen to understand how new islands form and evolve on Earth; the knowledge may provide clues about how volcanic landscapes interacted with water on ancient Mars.

    Photo: NASA
    Photo: NASA
    Photo: NASA
    Photo: NASA
  • Going Beyond. Visual line of sight, that is.

    Going Beyond. Visual line of sight, that is.

    Few commercial UAV operations would be able to inspect transmissions lines, pipelines or train tracks without beyond visual line-of-sight (BVLOS) capability, but these key pieces of infrastructure often situate close to or transit across population centers. Further, many population centers have airports and low-level air traffic. Any tools to keep drones away from air traffic during BVLOS operations will significantly inspection companies. We review three promising solutions here.

    Pipeline Inspection

    Kongsberg Geospatial in Ottawa, Canada has developed location visualization software tools that are used for air-traffic control, command and control, and air defense applications. The company has several decades of experience in these applications. Its IRIS software was used to support recent UAV oil pipeline inspection operations in Nigeria, providing safety critical airspace deconfliction, supervised by the Nigerian Civil Aviation Authority (NCAA).

    IRIS airspace situational awareness screenshot Photo: Kongsberg Geospatial
    IRIS airspace situational awareness screenshot (Photo: Kongsberg Geospatial)

    The pipeline project was undertaken by Aerial Robotix, a UAS services provider in Nigeria, who used adapted Kongsberg software in its control center to demonstrate safe BVLOS operations, and was then able to obtain the necessary permits. A Schiebel Camcopter S-100 UAV with a 200-kilometer BVLOS capability was used for flight inspection, operating both day and night, with real time high-definition payload imagery sent back to the control station.

    Camcopter S-100 prior to BVLOS pipeline inspection flight in Nigeria. Photo: Schiebel
    Camcopter S-100 prior to BVLOS pipeline inspection flight in Nigeria. (Photo: Schiebel)

    Nigeria has a major problem with gasoline theft from pipelines similar to those lines inspected during this project. Recently, 105 people perished in a blast from a ruptured pipe 30 miles north of the city of Umuahia, possibly during scavenging for leaking fuel. It has been claimed that the pipeline had been ruptured by saboteurs earlier, and for the following six weeks villagers had been collecting fuel. Pipeline vandalism is common in Nigeria, even given the risk of fire or explosion, or the risk of prosecution, or even the possibility of being shot on sight.

    Unmanned Companion Fighter Aircraft

    Boeing just unveiled a concept UAV which is apparently aimed at providing an airborne team-partner for manned aircraft. The concept was introduced at the Australian International Airshow by the Australian Minister for Defense, the Hon. Christopher Pyne MP. The project is slated for a significant R&D investment by the Australian Government and Boeing Australia.

    Boeing Airpower Teaming System. Photo: the Boeing Company
    Boeing Airpower Teaming System. (Photo: Boeing Company)
    Boeing Airpower Teaming System. Photo: the Boeing Company
    Boeing Airpower Teaming System. (Photo: Boeing Company)

    The concept model has fighter aircraft lines with a projected 2,000-mile range, autonomous capability, and significant intelligence, surveillance and reconnaissance sensor capability. Flying alongside manned fighter/attack aircraft with artificial intelligence simplifying control, the Airpower Teaming System is designed as a low-cost force multiplier.

    The concept includes a pitch for international collaboration offering significant customization so countries can add local content, a key element for any aircraft program designed for off-shore sales.

    XQ-58A demonstrator in flight. Photo: US AirForce
    XQ-58A demonstrator in flight. (Photo: U.S. Air Force)

    A day or so after the Airshow (maybe not wanting to be upstaged by Boeing’s announcement?) a release showed up about the first flight of the previously secret XQ-58A Valkyrie demonstrator. This is apparently a program by the US Air Force Research Laboratory (AFRL) partnered with Kratos Unmanned Aerial Systems to develop a UAS which looks to have very similar capabilities to that of the Boeing concept, perhaps at a significantly further advanced stage, with a much more mil-spec UAV sounding name.

    The AFRL indicated that the XQ-58A is part of a Low Cost Attritable Aircraft Technology (LCAAT) (guess that means they don’t much mind losing a few) effort to come up with low-cost force multipliers which can be built quickly using commercial technology and operating from unprepared runways.

    (From the Air Force: “The thought is to develop an inexpensive, configurable and producible on demand air vehicle. A number of military applications can be envisioned for an air vehicle with such a capability. One potential application is to use hundreds or thousands of such units in a campaign to overwhelm an enemy’s air defenses and “punch a hole” to enable higher value, less replaceable [aircraft] to engage or monitor enemy systems. Another potential application is to augment the capabilities of high-value intelligence, surveillance and reconnaissance, systems which may be limited in a specific campaign by distances, quantities, or threats. For all applications, the weapon system is expected to be an air vehicle that would return to base or to a separate location to be recovered. However, because of the mission and because of the low cost, the air vehicle would be attritable, meaning the Air Force would expect and could afford to lose many of the assets.”)

    The current program took 2½ years to get to this flying prototype, which still seems pretty lengthy in terms of today’s commercial UAVs. The first flight from Yuma Proving Grounds in Arizona lasted an hour and a quarter and all went as expected. Five test flights are planned to check out functionality, aerodynamics, and launch and recovery systems. Kratos is perhaps better known for its family of target drones which have been in use by the US and internationally for some time.

    Kratos BQM-177 Navy drone declared operational. Photo: Naval Air Systems Command release
    Kratos BQM-177 Navy drone declared operational. (Photo: Naval Air Systems Command)

    Kratos Defense & Security Solutions, Inc. announced in early March that its BQM-177A Subsonic Aerial Target (SSAT) has achieved Initial Operational Capability as reported by the US Navy. A Navy statement said “The first site the BQM-177A will be operated from is Pt Mugu, California. The target is capable of speeds in excess of 0.9 Mach and a sea-skimming altitude as low as 10 feet which provides sea-skimming anti-ship cruise missile threat emulation for the US Navy.”

    Parachute System for DJI Phantom 4

    Recent testing of the descent rate of a Phantom 4 equipped with a SafeAir parachute system indicated that this UAV/parachute combination may well meet the FAA’s recently published draft rules for flight over people. The parachute system uses on-board indicators to trigger parachute deployment. ParaZero (manufacturer of the SafeAir UAV parachute system) has developed standards, and promises to provide customers with certification data to support waiver applications for flight over people.

    Wrap-up

    So now we have intuitive software using terrain data and sensor inputs which can provide a visual overlay to supports BVLOS flights, concepts designs and prototypes to support the ‘Loyal Wingman’ approach – flying UAVs alongside existing defense aircraft as force multipliers – and advances towards UAV flight over people using certified parachute safety systems.  Just a flavor of the flurry of recent new developments in the world of unmanned aircraft.


  • Surveyors and smart cities — partners in technology

    Surveyors and smart cities — partners in technology

    Image: Celebrating200years.noaa.gov
    Image: Celebrating200years.noaa.gov

    Everywhere we turn today, the term “smart” is attached to an item or to a process. Smartphones, smart cars, smart electricity grids, smart home appliances; you name it, someone is making it a “smart” item or process. Advancement in technology has increased computing power, expanded data storage capability, and has allowed for miniaturization of circuits and processors. This forward progress has led to the creation of these smart item/processes, and together creates the real possibility of making many of life’s tasks and normal operations more automated. This potential automation also brings new systems monitoring conditions of various entities and operations within our daily lives, such as increased efficiency of HVAC systems, utility metering that adjusts to our patterns of consumption and landscape watering that only provides water when needed.

    In addition to the personal systems now being controlled with these machines, there is now revitalized interest in the creation of “smart cities.” The concept of this type of a civilized urban metropolis once existed only in science fiction, but technology has brought this concept to life in ways not imagined by the best of those writers. Surveyors have a big role in the development, installation and maintenance of these cities, so let us spend some time digging into the element that go into our future environments.

    What is a smart city?

    For those old enough to remember, the concept of a smart city only existed on “The Jetsons” cartoon from the early 1960’s, with cities in the sky, flying cars and some technological advancements that do exist today. While Orbit City may not come to fruition in the next several generations, many of the concepts of a smart city are taking shape today.

    For the definition of a smart city, we go to the Google search engine and find the following entry from Internetofthingsagenda.techtarget.com:
    A smart city is a municipality that uses information and communication technologies to increase operational efficiency, share information with the public and improve both the quality of government services and citizen welfare.

    Establishing a smart city requires forward thinking leadership and substantial funding to be created and maintained; however, the real function lies within the computing infrastructure and collection/manipulation of large quantities of data to create an environment of efficiency and conservation. A true comprehensive system combines available historical data, a collection of sensors and data collectors transmitting real-time information, and a powerful computing system containing analytical programming with extensive database functionality.

    Is smart cities technology and adoption really that important?

    Population trends worldwide continue to show that urban and suburban areas are expanding while rural areas are seeing a large reduction in residence. Several factors are at play, with technology being the central reason for the migration from the farm/small towns to the bigger cities.

    Statistics show that in 1960, two billion people worldwide lived in rural areas while one billion lived in urban sections. As the population has increased drastically, the percentages for each category have reversed; in 2007, the two categories were equal and by 2017, the urban sector has jumped to 4.13 billion versus the rural population of 3.4 billion.

    Chart: Our World in Data
    Chart: Our World in Data

    Population experts estimate by 2050, upwards of 70 percent of the world’s population will be living in urban areas. Whether this population shift goes directly to the city centers or the less dense outskirts, municipal facilities and services will need to be upgraded and expanded with the continuing trend. Add to this surge the challenge to create a more sustainable environmental infrastructure and ecosystem, and it becomes a maintenance challenge and logistical nightmare. By using technology to create smarter infrastructure monitoring and management systems, the creation of smart cities with advancing technology will be key to successful and sustainable growth for municipalities and its citizens.

    One of the biggest challenges faced by most municipalities is aging infrastructure. Utility systems, including water supplies and stormwater drainage, was installed several generations ago without a plan for replacement and/or expansion. Redevelopment in older urban areas are now taxing these aging systems well beyond their initial capacity, all while these facilities begin to fail simply because of continued use well beyond their original designed life span. Municipalities are forced to spend money on repairing and modernizing the existing infrastructure before entertaining the idea of upgrading new installations to “smart city” specifications. However, many municipalities are mandating that new developments and infrastructure improvements meet these specifications so any future upgrades can include computerized systems.

    All these systems, new and future, will require extensive planning and mapping to be effective and efficient to justify their expense. Surveyors, utilizing a variety of tools based around high-accuracy mapping and data collection, can provide the necessary base information for these systems.

    Where does surveying fit in?

    Just as computers and electronic technology has allowed many industries to evolve, the surveying profession has also advanced with new methods and equipment. Our ability to perform advanced measurements and establish positional location information is critical in providing the base data necessary for smart city services. Previous surveying, mapping and record keeping systems were sufficient for the needs of the time period. However, these historical data points were nearly impossible to place into a single database simply because of one factor: georeferencing.

    The surveyor has the unique responsibility of being recognized as expert measurer and locator of physical points on the ground in relation to property and boundary rights. It is because of this distinctive role within the community that the surveyor can provide a significant role in the development of the groundwork of a smart city. The introduction and implementation of newer technology and tools has allowed the surveyor to become a valuable member of the infrastructure mapping team. It always hasn’t been this way and the surveying profession shoulders most of that blame.

    Past promises: digital vs. smart

    Many surveyors will make the argument that our profession has been ahead of the game for years with our data collection processes having been transformed from notes in a field book to electronic devices. Digital data, however, isn’t necessarily smart data as many factors go into establishing the difference. The physical form of the survey information has no direct correlation to the basis of the data; in this case, the records need to be based upon a spatial reference frame rather than an assumed data system.

    Also on the topic of spatial reference systems, we can also address the lack of respect given to geographical information systems (GIS) from surveyors during its initial introduction and implementation. GIS was discounted as a convoluted graphical database not sophisticated enough for the high-accuracy world of surveying. Little did the surveying profession know that GIS would become the spatial basis for many mapping systems and be utilized in millions of locations worldwide. Only now does the surveying community realize that we missed the bandwagon and can help to provide the crucial link between spatial data and actual points on the ground in relation to physical improvements and property ownership.

    Another digital platform not initially embraced by the surveying community is building information modeling or BIM. This software is a three-dimensional modeling program used mostly by architects and mechanical engineers for depicting and designing buildings and plumbing systems. One of the advantages of BIM versus traditional CAD is a database information link containing data regarding the entities within the BIM. Among the attributes contained with BIM are documentation, spatial reference, time, cost, operational applications, and related applications (contracts, purchasing, suppliers, procurement solutions, etc.). The existing spatial data necessary for this system can be supplied by surveyors using a variety of methods but not many have implemented the software.

    Technology, availability, cost of entry and overall usefulness

    Surveying instruments and measuring techniques has turned a significant corner in the past two decades. While conventional measurement methods are still used (including steel tapes, laser-based total stations, and GNSS receivers), more types of sensors are being introduced to enhance the accuracy and expand the volume of data points being collected. Scanners, using phase-based and time-of-flight methodologies, are now more popular than ever as ease of use has increased while the cost of ownership has greatly decreased. Ground-based and mobile LiDAR used to be only available to large firms and the government, but new models are being introduced at price points affordable to many surveyors. Many articles have been written regarding the lightspeed adaptation of surveying, engineering and construction firms with UAV use of photogrammetry methods to quickly map areas that were previously inaccessible and meeting standards not thought possible. We are also seeing more implementation of new scanning methods, including SLAM (simultaneous localization and mapping) using handheld and backpack devices.

    The common thread for all these technologies and methods is one thing: georeferencing. What was once nearly impossible is now a reality; data collection from various methods all being located within a common horizontal coordinate and vertical datum systems. The ability to obtain literally millions of data points with high-accuracy horizontal and vertical values is phenomenal with most of the credit going to the United States Department of Defense and their implementation of the GPS. Yes, the technology of scanners and data collection would have been invented without the overall coordinate tie-in but having the ability to reference that same data to a common system is the key.

    Also key to the smart city data collection methodology is the surveyor as the expert measurer. A trained and experience surveyor can lead the data collection of significant projects, including location of existing improvements and establishment of future installations. From establishment of parcel/right-of-way lines to integration of point clouds from scanners and photogrammetry, the surveyor can assemble this data together to provide the groundwork for successful analyzation and planning. By combining data from various areas of a municipality, including utility atlases, existing improvements, and future expansion plans, a database can be created in which a smart city will rely upon for oversight and monitoring. The surveyor fills a vital role to determining the accuracy and effectiveness of data like no other profession and should not be overlooked when assembling a team for the creation of a smart city.

    Future opportunities

    Like all technological discoveries and enhancements before, the future is bright with many possibilities to increase the effectiveness and efficiency of a smart city. More types of sensors are being introduced on a regular basis and in every way imaginable, including wireless communication, RFID tags, and microelectromechanical systems (MEMS) devices.

    Image: GetKidsintoSurvey.com & www.elaineball.co.uk
    Image: GetKidsintoSurvey.com & www.elaineball.co.uk

    One of the latest buzzwords is the “Internet of Things” (IoT), with many new devices being created to interconnect a network of web-enabled computerized devices using microprocessors, a variety of sensors and wireless communication hardware to gather, transmit and perform actions on information acquired from their environments. IoT presents advantages to users by enabling them to monitor their overall business processes and improve the customer experience. These actions can also precipitate changes to allow the company to save time and money, enhance employee productivity, integrate and adapt business models, make better business decisions, and generate more revenue.

    As discussed in previous articles (GPS World March 2018 and GPS World November 2018), the next big technology to look forward to is the telecommunications upgrade to 5G. Once a full 5G network is running with extended coverage, we can look forward to new opportunities for indoor location services with similar accuracy to our existing GNSS capability.

    What’s next?

    The technology sector will continue to push the limits of computing speed, physical size and data capacity looking for the “next big thing.” The surveying profession has enjoyed many of the fruits of that success so one has to imagine that many more advances will be coming soon. Smart cities will continue to evolve as citizens of Earth keep migrating to the urban areas and forcing the existing infrastructure to expand or face failure. Surveyors will continue to help provide a variety of services to those citizens and municipalities, with an eye on the future for more advancing technology. I can’t wait to see what is next.

  • Galileo’s crucible

    Galileo’s crucible

    Photo: ESA-Anneke Le Floc’h
    Inside the ESTEC Test Center, Galileo’s First Operational Capability first flight model, FM1, prepares for passive intermodulation testing in the Maxwell electromagnetic facility. (Photo: ESA-Anneke Le Floc’h)

    Gazing through soaring plexiglass walls at the space simulation room of the European Space Agency’s Test Center in the Netherlands affords a glimpse into scientific history.

    I felt a frisson, a highly regimented frisson if you will, of vicarious thrill for the rigors, rhythms and methods of research and testing as I toured the center after giving a keynote at the agency’s Navigation Days. Here, the final birthing touches were administered to transmitters beaming forth the Second Golden Age of satellite-based navigation.

    One can debate which constellation combination will prove most fruitful to users: GPS plus GLONASS, GPS plus BeiDou, GPS plus Galileo (note the common term). I believe it will be the last, because of the close synergy and symbiosis of the two commercial arenas, North America and Europe.

    All Galileo Full Operational Capability (FOC) satellites had their mettle and metals probed, radiated, bombarded, shaken and shocked here before they journeyed to space. The test center’s role is to verify, intensively and for months per satellite, that it can perform well for the whole of its planned lifetime.

    A mass property test checks that the center of gravity and mass are aligned within design specifications, so that the satellite’s orientation can be accurately and economically controlled with thruster firings in orbit, prolonging work life by conserving propellant.

    A five-week thermal-vacuum test runs inside a 4.5-meter diameter stainless steel vacuum chamber, the Phenix. An inner thermal tent heats to simulate solar radiation and cools with liquid nitrogen to create the chill of sunless space.

    In the Maxwell test chamber, spiky radio-absorbent anechoic walls test electromagnetic compatibility to ensure that all systems operate together without interference. Noise horns generate more than 140 decibels to simulate a violent launch. A quad shaker table vibrates the satellite up, sideways and down, as accelerometers search for hazardous internal vibration, gathering data across hundreds of channels.

    Altogether a severe trial, a crucible from which the FOC satellites emerge certified and ready for space.

    Oh, that we humans were similarly tested before placement in positions of power.

  • Making it safe for drones to fly over people

    Making it safe for drones to fly over people

    Changes to the Federal Aviation Administration (FAA) operational drone restriction were recently proposed in order to allow some flights over people. This proposed rulemaking appears to be a major step forward. Mail-order delivery flights, newsgathering, real-estate sales movies and building inspection, to name a few markets, all begin to make more sense, maybe even become viable.

    Some night operations could also be possible.

    Risk assessment methodology appears to be logical; a number of UAV categories are proposed, and there is a way to assess if operators are in compliance.

    The Alliance for System Safety of UAS through Research Excellence (ASSURE) undertook a ground impact study to determine the possible risk of injury to people from drones falling out of the sky. Assessments were made using existing automotive standards and a military standard for debris impact, plus there was testing using automotive crash dummies.

    It was a lot of work, but the bottom line appears to be that possible injuries to people are more likely to be minor than major. Bear in mind that UAS fly at relatively low altitude, are made with materials that make them somewhat elastic in nature, and that it may be possible for people in a crowd to see a flailing, falling UAV and move to avoid an impact.

    Nevertheless, I do have a picture in my mind of a wayward drone crashing to the pavement after hitting a skyscraper in San Francisco, and I’m really glad I wasn’t down on the sidewalk below.

    Building inspection using drones. (Photo: thetowerinfo.com)
    Urban building inspection using drones. (Photo:AeroSIM RC)

    Then I read an article by James Poss, a retired military major, who seems to suggest that although the conclusion of the ASSURE assessment was that 2,000 grams was an OK weight for an sUAV to avoid serious injury to anyone, the FAA appears to have proposed limitations for sUAS which are only 1/10th of this weight. This is more in line with the weights in the mil-spec standard that are based on small, fast, solid-metal blast fragments.

    It might help us to also consider how often or badly people are injured by golf balls, baseballs, tennis balls or squash/racket balls — for instance, I’ve survived several golf ball impacts and even an impact with a squash racket during play without major damage. These are things we all take in our stride as part of (almost) normal human activity. I wonder how often recreational enthusiasts have actually been injured during model-aircraft flying gatherings?

    FAA restricts flights over government facilities

    In cooperation with the Department of Justice (DOJ) and the Department of Defense (DOD), the FAA has just established temporary restrictions on drone flights within 400 feet of the lateral boundaries of a number of sensitive federal facilities. This is in addition to previous restrictions over prisons, NGA facilities, DoD ships and other facilities.

    The most recent proposed Notice to Airmen (NOTAM) lists federal correctional facilities in almost half of the states in the U.S., several medical centers, U.S. Army facilities, ammunition plants and Pearl Harbor in Hawaii. It’s hard to understand why there aren’t already permanent UAV prohibitions over all such sensitive facilities across the whole U.S. I tried to check status, but the FAA UAS Data Display System didn’t list this proposed NOTAM which apparently goes into force on Feb. 26.

    Think it’s probably a question of preventing bad guys from planning or doing harm rather than being shy to be caught on video — but, for sure, these places should be as secure as possible.

    The FAA UAS data map shows all drone-restricted areas, once updated. (Screenshot: FAA)
    The FAA UAS data map shows all drone-restricted areas, once updated. (Screenshot: FAA)

    Security at the Super Bowl

    Well the game wasn’t the most exciting, with New England doing all that was needed to win in the fourth quarter, but the security for the event in Atlanta was humongous.

    The area around the stadium was cleared of threats even before the game, attendees were screened for prohibited items and the airspace within 30 miles was restricted for general aviation and drone access. There were even Defense Department F-16 airspace patrols, and the Customs and Border Patrol had a Black Hawk helicopter available to intercept any aircraft penetrating the exclusion zone.

    Nevertheless, the FAA still approved the operation of two tethered drones. One was flown close to the stadium by security personnel to provide live images of crowd movements in and around the stadium. The second system was operated at 45 meters above the rooftop of the CNN building facing the Mercedes Benz Stadium. CNN used it to provide aerial imagery of the scene before and after the game.

    Elistair base station and DJI M200 at Super Bowl. (Photo: Elistair)
    Elistair base station and DJI M200 at Super Bowl. (Photo: Elistair)

    The tethered drone setup included two DJI M200 drones and two Elistair Ligh-T base stations, with monitoring, control and power provided to each drone by lightweight tethers. The security system was continuously operationed for 10 hours of captive flight during the Super Bowl, and for 14 hours total over two days — all while tethered to the Ligh-T control station. Security officials expressed their interest in using this solution more often because of the ability to follow a subject continuously without having to switch from one fixed camera to another, which risks losing the subject.

    To sum up, new pending FAA regulations that support operations over people may have a few flaws. Other new FAA rules are aimed at protecting DOD and DOJ facilities from drone overflights, and tethered drones were used at the Super Bowl for crowd security and by CNN for color coverage.

    New applications, new opportunities and preventive controls to maintain security at sensitive facilities — all moving in the right direction.

    Tony Murfin
    GNSS Aerospace

  • An overview of the latest PNT satellite launches

    An overview of the latest PNT satellite launches

    History of the program: NTS-1, 2 and 3. (Illustration: Lt. Jacob Lutz, AFRL Space Vehicles Directorate)
    Satellites NTS-1, 2 and 3. (Illustration: Lt. Jacob Lutz, AFRL Space Vehicles Directorate)

    Just last month we celebrated the kickoff of the GPS III campaign, reporting on the launch of the first space vehicle of that generation in the closing days of 2018. A new era had begun, heralded by a rocket’s blazing path, bearing aloft a new “lighthouse in the sky serving all humankind.”

    Turn around and­ — whoa! Where did all these other new PNT satellites come from?

    We attempt to chronicle them all in this issue, though I’m not sure we haven’t still missed some.

    For years we’ve been talking about the Iridium constellation, a low-Earth orbit telecommunication network that can also deliver timing services to improve accuracy, and signal acquisition in urban environments. Were it not for the fact that 10 more of its satellites just launched in January, bringing the total of its second-generation NEXT constellation to 75, this would practically qualify as old news.

    But let’s move on to the real new news. NTS-3 is the new kid on the block most closely related to the GPS family. In fact, integrally a part of it. This third Navigation Technology Satellite will go even beyond GPS III —­ whose capabilities, mark you, are not yet online — to investigate new experimental antennas, flexible and secure signals, increased automation and use of commercial ground assets.

    Learn about 72 nanosatellites of the Spire constellation piggybacking on Galileo signals to offer GNSS radio occultation products for the weather community. This may not be exactly direct-to-user PNT, but it’s a derivative.

    Finally, absorb the latest on Hawkeye 360 formation-flying Pathfinders, designed to detect and geolocate radio frequency (RF) signals, and use the data in search-and-rescue as well as commercial maritime operations.

    Don’t stop there! Read about Planet, the breadloaf satellites, current population 300 with more coming, beaming down 1.2 million high-resolution Earthly images per day, useful for agriculture, defense, mapping and GIS, and a few other industries.

    If a group of satellites is a constellation, what do you call a group of constellations? If we are to follow astronomy’s lead, I’ve just learned that the proper technical term is an asterism. However, I think galaxy will be easier to handle.

  • Editorial Advisory Board PNT Q&A: Are UAVs disruptive?

    Editorial Advisory Board PNT Q&A: Are UAVs disruptive?

    Are drones (UAVs) a disruptive or constructive technology for high-precision mapping that yields practical, actionable results for the end user/customer?


    Ismael Colomina
    Ismael Colomina

    “More constructive than disruptive. Drone mapping is opening new markets that, to a large extent, were not serviceable by conventional manned flights. On the other hand, the profound changes — and crisis — in the mapping business were not produced by drones.”
    Ismael Colomina
    GeoNumerics


    Jean-Marie Sleewaegen
    Jean-Marie Sleewaegen

    “Drones have dramatically reshaped the surveying and mapping industry. Combined with reliable positioning and recent advancements in high-resolution cameras, photogrammetry and computer vision, drones now enable high-accuracy mapping faster and at much lower cost than conventional mapping techniques.”
    Jean-Marie Sleewaegen
    Septentrio


    Jules McNeff
    Jules McNeff

    “Drones can be constructive augmentations to high-precision map products because of their ready access to diverse locations. Drone imagery can document real-time physical changes that affect mapping applications during natural disasters or other events — but images alone aren’t maps without a geo-referenced grid such as the U.S. National Grid.”
    Jules McNeff
    Overlook Systems Technologies Inc.


    Other members of the EAB

    Tony Agresta
    Nearmap

    Miguel Amor
    Hexagon Positioning Intelligence

    Thibault Bonnevie
    SBG Systems

    Alison Brown
    NAVSYS Corporation

    Clem Driscoll
    C.J. Driscoll & Associates

    John Fischer
    Orolia

    Ellen Hall
    Spirent Federal Systems

    Terry Moore
    University of Nottingham

    Bradford W. Parkinson
    Stanford Center for Position,Navigation and Time

    Michael Swiek
    GPS Alliance

    Julian Thomas
    Racelogic Ltd.

    Greg Turetzky
    Consultant

  • NGS to perform another Multi-Year CORS Solution

    NGS to perform another Multi-Year CORS Solution

    The National Geodetic Survey (NGS) is performing another Multi-Year CORS Solution (MYCS) of the National CORS. This will mean the CORS coordinates will be updated to be consistent with the latest International Terrestrial Reference Frame of 2014 (ITRF2014). NGS has provided preliminary information from the new MYCS at this website. It should be noted that these values are considered beta so they are not final. They may change before they are adopted by NGS for publication. This column will provide potential changes in ellipsoid heights based on the updated beta CORS coordinates (downloaded on January 11, 2019).

    NGS has a website that describes the CORS coordinates and how they are established. (See box titled “Excerpt from web page https://www.ngs.noaa.gov/CORS/coords.shtml.)

    Excerpt from NGS website

    Screenshot: NGS website Screenshot: NGS website

    What is a Multi-Year CORS Solution? NGS provides a short explanation on their web page (see box titled “Description of MYCS1.”)

    Description of MYCS1

    (https://geodesy.noaa.gov/CORS/coords.shtml#MYCS1)

    Multi-Year CORS (MYCS1) Solution

    To obtain the new coordinates that were just described the CORS team completed a full reanalysis of all data from CORS and from a set of global sites with the goal of simultaneously computing a fully consistent set of coordinates, GPS satellite orbits and Earth Orientation Parameters (EOP). This initial Multi-Year CORS (MYCS1) effort is the first of a series of reprocessing projects that will occur periodically in the coming years. The last time a reanalysis of CORS data occurred was in 2002 and numerous inconsistencies and changes have occurred in our processing techniques since that date. The concern over the overall quality of the solutions was not limited to NGS, but also to other geodetic groups, in particular IGS. Thus, IGS requested participation in a reanalysis of all data collected since 1994 to establish a new consistent set of GPS orbits, clocks and EOPs. This project was called IG1/repro1. NGS elected to contribute to this effort as an IGS Analysis Center and used this opportunity to simultaneously reprocess all its CORS data to provide a single consistent set of coordinates for all sites computed using the best available methods.

    For regional and site specific plots and many details about the MYCS1 please consult the FAQ. The FAQ also includes comparison between the current and previous frame coordinates.

    As noted in the explanation, MYCS1 was the first of a series of reprocessing projects that will occur periodically in the coming years. The current CORS coordinates are referenced to IGS08 epoch 2005.00 (see box titled “Description of IGS08 epoch 2005.00 Coordinates”). The updated coordinates will be consistent with the International Terrestrial Reference Frame of 2014. ITRF2014 is the latest frame realization of the International Earth Rotation and Reference Systems Service (see box titled “Description of ITRF2014”). What will be important to users is how much have the coordinates changed due to the reprocessing.

    Description of IGS08 epoch 2005.00 Coordinates

    (https://geodesy.noaa.gov/CORS/coords.shtml#IGS08)

    IGS08 epoch 2005.00 Coordinates

    Since April 17, 2011, the National Geodetic Survey (NGS) and the other Analysis Centers of the International GNSS Service (IGS) have been providing GPS satellite orbits (ephemerides) that are referred to a new terrestrial reference frame, called IGS08 and defined by the IGS. This new frame is based on GPS observations and was designed to be consistent with the International Terrestrial Reference Frame of 2008 (ITRF). ITRF2008 is the latest frame realization of the International Earth Rotation and Reference Systems Service (IERS) and is a multi space-based geodetic technique solution, combining Very Long Baseline Interferometry (VLBI), Satellite Laser Ranging (SLR), Doppler Orbitography and Radiopositioning Integrated by Satellite (DORIS) and GPS data. Although, the best fitting Helmert transformation between IGS08 and ITRF2008 for a set of well-established, international GNSS satellite tracking sites is the identity function, the transformed ITRF2008 positions have a site specific “correction” applied to them to create IGS08 positions (for additional details on IGS08 consult the following IGSMAILs 6354, 6355, 6356, 6374). Thus the IGS08 position for a particular site may differ from its corresponding ITRF2008 position; however, the velocities remain identical. By using IGS08 coordinates and the associated absolute antenna calibrations in combination with IGS orbits a consistent frame is realized. In addition, NGS has updated the IGS orbits from January 1, 1994 to April 16, 2011 in its online storage with the recently released IGS reprocessed (repro1) orbits that are all aligned consistently with IGS05. For most non-research applications, users can freely mix IGS05 and IGS08 orbits to compute coordinates for control points. Additional information is available in the following IGSMAIL 6475.

    On October 7, 2012, the IGS introduced an update to IGS08, called IGb08 (see IGSmail 6663).
    This change is transparent/invisible to most users as it focused on introducing positions for: 3 new stations at multi-technique colocations, and 33 IGS reference frame stations with IGS08 coordinates invalidated by positional discontinuities. Coordinates for stations with velocity discontinuities were not updated.

    Description of ITRF2014

    (http://itrf.ign.fr/ITRF_solutions/2014/)

    Screenshot: International Terrestrial Reference Frame

    How does this fit into what surveyors use, that is NAD 83 (2011, MA11, PA11)? NGS provides a description of CORS coordinates and NAD83 (2011, MA11, PA11) on their web page (see box titled “Description of NAD83 (2011, MA11, PA11)”). NGS provides CORS coordinates in both IGS08 epoch 2005.00 and NAD83 (2011, MA11, PA11) epoch 2010.00. See box titled “Current CORS Coordinate Listing for a CORS in Monroe, NC (NCMR)” for an example of a CORS in North Carolina. The beta website contains links to the updated CORS coordinates based on ITRF 2014 (see box titled “Updated CORS Coordinate Listing for a CORS in Monroe, NC (NCMR)” – ftp://www.ngs.noaa.gov/cors/coord/beta_coord_14/ncmr_14.betacoord.txt).

    Description of NAD83 (2011, MA11, PA11)

    (https://geodesy.noaa.gov/CORS/coords.shtml#NAD83)

    NAD83(2011,MA11,PA11) epoch 2010.00 Coordinates

    On September 6, 2011, NGS updated the National Spatial Reference System NAD 83 (CORS96, MARP00, PACP00) positions and velocities for all CORS sites, to NAD 83 (2011, MA11, PA11). The NAD 83 (2011) frame, which is relative to the fixed North American plate, is used to define the coordinates for sites located in the CONterminous United States (CONUS), Alaska and US territories in the Caribbean. The NAD 83 (MA11) frame is realized with respect to the fixed Marianas plate and is used to define coordinates in the Marianas. The NAD 83 (PA11) is a Pacific plate fixed frame and is used to define coordinates in Hawaii, American Samoa, the Marshall Islands and other US territories residing on the Pacific Plate. For informative articles about NAD 83 see Snay and Soler, 2000, Snay, 2003. The new realization of NAD 83 involves no datum change, which means that, the origin, scale and orientation of NAD 83(2011) are identical to those of NAD 83(CORS96), and the same for the two other frames. The coordinates are not the same in the old and new realizations for multiple factors including the switch to absolute antenna calibrations, new/revised processing algorithms, improved discontinuity identification, several years of additional GPS data, change in reference epoch, and an improved definition of the global reference frame, IGS08. For a description of how NAD 83 is related to the global reference frame see Craymer et al., 1999, Snay and Soler, 1999. Users working in Canada should consult Craymer, 2006 for a review of how NAD 83 is implemented in Canada. Concisely, the two biggest changes are caused by the change in reference epoch and the move from relative to absolute antenna calibrations.

    Current CORS Coordinate Listing for a CORS in Monroe, NC (NCMR)

    (ftp://www.ngs.noaa.gov/cors/coord/coord_08/ncmr_08.coord.txt)

    Data: National Geodetic Survey

    Updated CORS Coordinate Listing for a CORS in Monroe, NC (NCMR)

    (ftp://www.ngs.noaa.gov/cors/coord/beta_coord_14/ncmr_14.betacoord.txt)

    Data: National Geodetic Survey

    A March 2017 presentation by NGS employee Kevin Choi does an excellent job of explaining the CORS status and why NGS is reprocessing the CORS to be consistent with the latest ITRF. It is dated because it was presented in March 2017 but the reasons for reprocessing and recommendations are still valid today.

    Slides from NGS Presentation titled “CORS, OPUS, and Reprocessing status”

    by Kevin Choi

    (https://www.ngs.noaa.gov/CORS/Presentations/NSPS_MAPPS/CORS-OPUS-Repro2-version1.pdf)

    Slide: National Geodetic Survey presentation by Kevin Choi

    Slide: National Geodetic Survey presentation by Kevin Choi

    Slide: National Geodetic Survey presentation by Kevin Choi

    Slide: National Geodetic Survey presentation by Kevin Choi

    The text box titled “Slides from NGS Presentation, titled ‘CORS, OPUS, and Reprocessing status by Kevin Choi,’” contains four slides from Kevin Choi’s presentation that explains why NGS periodically performs a multi-year reprocessing of the National CORS. As stated in the slides: (1) some CORS coordinates are outside their allowable 2/4 cm (H/V) threshold, (2) some stations that had modeled velocities will now have computed velocities, (3) there are new CORS stations since the last reprocessing, and (4) there is an updated ITRF (ITRF2014 and a corresponding IGS14). What’s really important to the user of CORS is, how much have the coordinated changed and what does it mean to me. This column will focus on changes in ellipsoid heights. I downloaded the CORS coordinate information for both the updated ITRF2014 values (ftp://www.ngs.noaa.gov/cors/coord/beta_coord_14/nad83_2011_geo.comp.txt and ftp://www.ngs.noaa.gov/cors/coord/beta_coord_14/nad83_2011_geo.htdp.txt) and the current IGS08 values (ftp://www.ngs.noaa.gov/cors/coord/coord_08/nad83_2011_geo.comp.txt and ftp://www.ngs.noaa.gov/cors/coord/coord_08/nad83_2011_geo.htdp.txt) from NGS’ website. See box titled “Excerpt from ftp://www.ngs.noaa.gov/cors/coord/beta_coord_14/nad83_2011_geo.comp.txt” for a sample of the contents of the file of the stations with computed velocities and the box titled “Excerpt from ftp://www.ngs.noaa.gov/cors/coord/beta_coord_14/nad83_2011_geo.htdp.txt” for a sample of the contents of the file of the stations with modeled velocities. As previously stated, the ITRF2014 coordinates are “Beta” and can change before being officially published. I generated several plots that depict the difference between the two sets of ellipsoid heights referenced to NAD83 (2011).

    Excerpt from ftp://www.ngs.noaa.gov/cors/coord/beta_coord_14/nad83_2011_geo.comp.txt

    Data: National Geodetic Survey Data: National Geodetic Survey

    Excerpt from ftp://www.ngs.noaa.gov/cors/coord/beta_coord_14/nad83_2011_geo.htdp.txt

    Data: National Geodetic Survey

    The column labeled “Site Status” indicates whether the site is (1) Decommissioned, (2) IGS station and not a National CORS, (3) Non-Operational, and (4) Operational. A summary of the status of the Stations is listed in the text box titled “A Summary of ITFR2014 CORS Stations.”

    A Summary of ITFR2014 Station

    Image: International Terrestrial Reference Frame

    The file also provides the velocity of the station (modeled or computed) in the north (Vn – units mm/yr), east (Ve – units mm/yr), and up (Vu – units mm/yr) component. The box titled “A Summary of the Velocity Values of ITRF2014 Stations” provides a statistically summary of the velocity components of the stations.

    A Summary of the Velocity Values of ITRF2014 Stations

    Image: International Terrestrial Reference Frame

    Image: International Terrestrial Reference Frame

    Image: International Terrestrial Reference Frame

    The text box titled, “Differences between 2014 Reprocessed CORS Ellipsoid Heights and Published CORS” depicts the differences in NAD83 (2011) ellipsoid heights between all common CORS between the two set of values in conterminous United States. There appears to be several CORS that have very large changes in ellipsoid heights.

    Differences between 2014 Reprocessed CORS Ellipsoid Heights and Published CORS

    Sources: Esri, DeLorme, USGS, NPS, NOAA

    The box titled “Differences between 2014 Reprocessed CORS Ellipsoid Heights
    and Published CORS – Less Than +/- 1 cm” depicts the differences that are between -1 cm and 1 cm.

    Differences between 2014 Reprocessed CORS Ellipsoid Heights and Published CORS – Less Than +/- 1 cm

    Sources: Esri, DeLorme, USGS, NPS, NOAA

    The box titled “Differences between 2014 Reprocessed CORS Ellipsoid Heights and Published CORS – Greater Than +/- 1 cm” depicts the differences that are less than – 1cm or greater than 1 cm. As the plots indicate, most of the differences are between +/- 1 cm.

    Differences between 2014 Reprocessed CORS Ellipsoid Heights and Published CORS – Greater Than +/- 1 cm

    Sources: Esri, DeLorme, USGS, NPS, NOAA

    The box titled “Differences between 2014 Reprocessed CORS Ellipsoid Heights and Published CORS – Greater Than +/- 2 cm” depict the differences that are greater than absolute 2 cm (that is, less than – 2 cm and greater than 2 cm). The plot clearly indicates that most of the station coordinates will change less than +/- 2cm.

    Differences between 2014 Reprocessed CORS Ellipsoid Heights and Published CORS – Greater Than +/- 2 cm

    Sources: Esri, DeLorme, USGS, NPS, NOAA

    The text box titled “Differences between 2014 Reprocessed CORS Ellipsoid Heights and Published CORS in North Carolina” depicts the differences in NAD83 (2011) ellipsoid heights between all common CORS between the two set of values in North Carolina. Most of the differences are less than a centimeter.

    Differences between 2014 Reprocessed CORS Ellipsoid Heights and Published CORS in North Carolina

    Sources: Esri, DeLorme, USGS, NPS, NOAA

    The box text titled “Differences between 2014 Reprocessed CORS Ellipsoid Heights and Published CORS in North Carolina – Greater Than +/- 5 mm” depict the differences greater than absolute 5 mm. The plot clearly shows that the coordinates of most stations in North Carolina will change less than 5 mm.

    Differences between 2014 Reprocessed CORS Ellipsoid Heights and Published CORS in North Carolina – Greater Than +/- 5 mm

    Sources: Esri, DeLorme, USGS, NPS, NOAA

    The box titled “Differences between 2014 Reprocessed CORS Ellipsoid Heights and Published CORS in Alaska” depict the differences in Alaska. Most of these differences are less than a couple of cm but there are a few large differences.

    Differences between 2014 Reprocessed CORS Ellipsoid Heights and Published CORS in Alaska

    Sources: Esri, DeLorme, USGS, NPS, NOAA

    The box titled “Differences between 2014 Reprocessed CORS Ellipsoid Heights and Published CORS in Anchorage, Alaska, Region” depict the differences in the Anchorage, Alaska, region. There are a couple of stations in the Anchorage region that their ellipsoid heights will change over 10 cm.


    Differences between 2014 Reprocessed CORS Ellipsoid Heights and Published CORS in Anchorage, Alaska, Region

    Sources: Esri, DeLorme, USGS, NPS, NOAA Sources: Esri, DeLorme, USGS, NPS, NOAA

    This column discussed the preliminary results of NGS’ second Multi-Year CORS Beta Solution of the National CORS. The CORS coordinates will be updated to be consistent with the latest International Terrestrial Reference Frame of 2014 (ITRF2014). NGS has provided preliminary information from the new MYCS at the following website: ftp://www.ngs.noaa.gov/cors/coord/beta_coord_14. It was noted that these values are considered “Beta” so they are not final. It was emphasized that they may change before they are adopted by NGS for publication. This column provided potential changes in ellipsoid heights based on the updated beta CORS coordinates (downloaded on January 11, 2019). Future column will provide more details after NGS completes their analysis and adopts the final coordinates for the MYCS.

  • Air taxi, hydrogen fuel cells and airships top UAV news

    Looking around the industry over the last few weeks, there continues to be a flood of innovation that promises new approaches for unmanned aircraft in addressing several new opportunities. This month I cover a flying taxi at the 2019 Consumer Electronics Show (CES) in Las Vegas, greater range for multi-copters using fuel cells, a potential huge drone in the making, and a potential Florida controversy over use of a tethered aerostat — interesting stuff!

    Bell Flying Car/Air Taxi

    At CES of all places, there was a new idea for air-taxis — not yet a UAV, but with the promise of future autonomous flight, it surely deserves a mention. Bell brought its latest commercial vertical take-off and landing (VTOL) mock-up to CES to test the level of interest in its concept of a flying car.

    Lift and directional flight control are provided by six 8-foot ducted fans, each driven by its own electric motor and powered by a turbine-driven electric generation and back-up battery system. Using technology derived from the mil-spec V-22 Osprey Tilt-Rotor and its commercial V-280 cousin, the ducted fans pivot from horizontal for take-off to vertical for forward flight.

    The concept vehicle at CES had a seat for the pilot, but the digital flight control system is envisaged to have autonomous flight capability — and there we have another approach for a UAV flying car/air-taxi — from one of the mainstay aviation manufacturers of helicopters with all the necessary experience to make it happen.

    Fuel-Cell-Powered UAV Flies for 70 Minutes

    There’s apparently a new way to overcome the short duration that is currently available for flying existing multi-rotor drones — don’t just rely on batteries, use hydrogen! Actually a hydrogen fuel-cell configuration that has recently been tested in the UK to extend flight time to 70 minutes, while carrying a 5-kg payload.

    Test-drone with Intelligent Energy Hydrogen Fuel-Cell. (AVI screenshot supplied by Productiv)
    Test-drone with Intelligent Energy Hydrogen Fuel-Cell. (AVI screenshot supplied by Productiv)

    The UK team includes Intelligent Energy, which supplies the fuel-cell, engineering firm Productiv, and UAS video company BATCAM, with funding provided by Innovate UK, a government-sponsored group that supports novel ventures such as this joint project.

    Most existing battery-powered multi-rotor UAVs have endurance in the tens of minute (DJI seems to be approaching 20-30 minutes with some of its drone models). But longer endurance is really important for most operators, especially for capturing lengthy video, hence the interest and participation of BATCAM as the operator/consultant for the project.

    Fuel cells provide a number of advantages over batteries with fast refuel, little vibration, quiet operation, zero emission at point of use, and around three times longer flight time. Intelligent Energy is making use of a portable hydrogen refueling system supplied by NanoSUN.

    With BATCAM set to begin operational trials, the company is optimistic that further development of hydrogen fuel cells for UAVs will not only enable even longer video broadcasts but will solve the problem encountered with the difficult and expensive international transportation of Lithium polymer batteries.

    Airship Moves towards Civil Certification

    While we are in the UK, a huge 300-foot-long helium-filled airship called the Airlander 10 is again moving steadily down the path to gain civil approval by the Civil Aviation Authority (CAA), despite a previous crash in November 2017 due to a wayward landing cable.

    The latest milestone was just achieved at the end of 2018 when CAA awarded Hybrid Air Vehicles Ltd. (HAV) a Production Organisation Approval, following on from earlier Design Organisation Approval by the European Aviation Safety Agency (EASA) in October 2018.

    This behemoth airship is claimed to be the largest aircraft in the world, can carry 10 tons of cargo virtually anywhere on earth, stays airborne for up to five days, and can land almost anywhere. Powered by two forward-mounted rotating ducted fans and two aft fixed fans, all driven by diesel engines, the pressurized helium-filled envelope is 302 feet long, 143 feet wide, 85 feet tall, and has no internal support structures — all this with a cruise speed of up to 80 knots and a maximum altitude of 20,000 feet.

    The Airlander is aimed at bulk cargo transport, but could also handle communication and observation/reconnaissance roles in both the military and commercial sectors. And it’s not so far away from becoming the largest unmanned aircraft in the world, either, should things eventually turn in that direction. Could there be potential for a greater payload without the extensive provisions for a pilot, with lower operating costs, potentially greater range and speed and/or operational altitude?

    Miami Police use Tethered Aerostat

    Miami police have been using a tethered aerostat to monitor large gatherings, such as the Dec. 28 Orange Bowl-related party called the Capital One Beach Bash. Presumably this use had a safety related motivation, and there was hopefully no intent to spy on partygoers.

    However, I just became aware that police cannot fly drones in Florida to surveil people — there’s a law against it. But there is a provision in the Florida “Freedom from Unwarranted Surveillance Act,” which starts off: “If the law enforcement agency possesses reasonable suspicion that, under particular circumstances, swift action is needed to prevent imminent danger to life or serious damage to property,…”. Now, I’m no lawyer, but it would seem that this exclusion might possibly allow the Miami cops to monitor large gatherings where there might be a need to watch out for people’s safety – that generally being what we employ the police to do for us.

    But the Florida lawmakers certainly believe that there is clearly a need to protect people’s privacy and to prevent unauthorized monitoring of an individual’s activities using drones. The provisions of Florida Statute 934.50 prohibits “the observation of such persons with sufficient visual clarity to be able to obtain information about their identity, habits, conduct, movements, or whereabouts” — a good thing to do to protect our freedom of movement and basic rights.

    But you have to ask yourself if a general prohibition on the use of drones by police is the best thing to do when other police departments around the U.S. are gaining advantages from drone usage by speeding up and improving the accuracy of traffic accident investigations, for search and rescue, in crime scene reconstruction, for disaster response, and of course for improving officer safety — in fact, all the things that are already achieved through the use of police helicopters, but at a fraction of the cost.

    Florida Statute 934.50 already has a significant number of allowable exceptions to enable a “law enforcement agency” and others to operate drones legally, but could it also be possible that these wider benefits of drone use might be fully exempted without infringing any personal liberties?

    Conclusion

    To sum up, we have a big aerospace company jumping in to help shape the future of unmanned air taxis; another drone fuel-cell application that significantly extends flight time; and progress towards certification of an airship that has benefits as a drone. Finally, police use of a tethered aerostat at an event stirs potential controversy, while other police forces benefit from the use of drones — a mixed bag of drone ventures that seem to have great potential.

  • Commentary: High-precision positioning is going mainstream

    Guest column by Peter Fairhurst, Director, Product Line Management, Product Center Positioning, u-blox

    Peter Fairhurst, Director Product Line Management, Product Center Positioning, u-blox. (Photo: u-blox)
    Peter Fairhurst, Director, Product Line Management, Product Center Positioning, u-blox. (Photo: u-blox)

    A new generation of GNSS hardware and pioneering new correction data services are enabling cheaper, more compact and truly scalable high-precision GNSS solutions, ready for the mass market.

    High-precision GNSS as employed by specialized markets for more than a decade isn’t aren’t suitable for mass-market autonomous vehicles or other mainstream use cases. As well as being big, heavy and expensive, traditional high-precision GNSS systems don’t scale, which is a critical shortcoming when you consider this capability may very soon need to be built into every car that gets built.

    To overcome these challenges, we’re seeing two complementary things coming to market: a new generation of GNSS hardware, and pioneering new correction data services. These two key facets combine to enable cheaper, more compact and truly scalable high-precision GNSS solutions, ready for the mass market.

    A new generation of GNSS correction service forgoes the two-way link between customer device and the correction data service that is a hallmark of traditional high-precision GNSS corrections. Instead of sending each device its own, location-specific GNSS correction data, the new-generation services create a real-time model of relevant errors across their entire territory. They broadcast this over satellite and/or the Internet for customer devices to pick up.

    Transmitting modeled GNSS error data to receivers across an entire region – as opposed to maintaining a two-way link with each and every device – opens the door to large-scale, mass market applications of high-precision GNSS

    The shortcomings of traditional high-precision positioning

    Correction data has long been key to high-precision GNSS services. In traditional applications, the customer’s positioning device detects its approximate location and sends this information to its correction service provider. This provider uses a network of base stations to monitor GNSS errors, comparing the readings calculated from the satellite signals to the stations’ known, fixed positions. It uses these insights to send the customer’s device tailored correction data, based on its location.

    The technology has successfully been used to provide centimeter-level accuracy in surveying, agriculture and machine control, but annual subscriptions of sometimes more than $1000 per device mean it’s remained confined to specialized markets.

    Moreover, traditional correction data services typically only operate in one country, or even one state. While this may not be an issue in some applications (such as localized agriculture), there are other use cases where limited range is a major problem. Imagine, for example, that you regularly need to travel across a state or national boundary in your (semi-) autonomous vehicle, or carry out remote UAV-based surveying in another country: maintaining your high-precision positioning capability is likely to mean roaming contracts and other extra costs.

    The other issue with these traditional services is scalability. They use two-way cellular communication to pass data back and forth between the customer device and the correction data provider. And while this works when device density is relatively low, if this number grew to thousands or even millions of end-user pieces of kit trying to access the correction data service, current cellular infrastructure would struggle to deliver the required reliability. Particularly in safety-critical applications, where losing access to the correction data service could put lives at risk, this is unacceptable.

    Image: u-blox
    Image: u-blox

    Recent developments in high-precision positioning

    The new generation of GNSS correction services, creating and broadcasting a real-time model of relevant errors across their entire territory, over satellite and/or the internet for customer devices to pick up, opens the door to large-scale, mass-market applications of high-precision GNSS. Technology using State Space Representation (SSR) is one flavor of these new-generation GNSS correction data services.

    Japan has led the way in GNSS error-broadcasting, using the L6 signal of its QZSS satellite network as a proving ground for mainstream use of the approach. Although it’s currently only available within Japan, the Centimeter Level Augmentation Service (CLAS) is generating a lot of interest across the automotive, agricultural and machine-control industries. Mitsubishi Electric, for example, used the CLAS service to field-test its autonomous driving system.

    In China, Qianxun Spatial Intelligence Inc. is pioneering a different technique. Instead of broadcasting the data, Qianxun SI is leveraging its special access to the Chinese GNSS reference base stations to push the boundaries of what’s possible using the traditional technique. It provides tailored correction data services to customers including individuals, system integrators and original equipment manufacturers (OEMs). While it’s been a success in China, the approach is less appealing to OEMs who ship worldwide, because it requires their clients to arrange their own, local GNSS correction data.

    Another important advance has been the rise of multi-band GNSS receivers, which enhance standalone positioning accuracy, thereby delivering a better customer experience in a variety of use cases. However, even multi-band receivers can’t achieve the centimeter-level accuracy that mobile robotics and autonomous vehicles need: these devices will always need to be complemented by some form of correction service.

    Continent-wide GNSS correction data

    Particularly in Europe, where there’s a lot of cross-border travel and economic activity, the simplicity of continent-wide GNSS correction services would offer enormous value. Sapcorda, for example, a recently launched joint venture between Bosch, Geo++, Mitsubishi Electric and u-blox, is creating a next-generation GNSS correction data service with coverage on a global scale (Europe, North America, etc), building on the lessons learned in Japan.

    Sapcorda will broadcast right across the continent, using cellular networks as well as over satellite links. Customers won’t be tied to a specific GNSS manufacturer. Data will be distributed in an open format, so that device-makers can create exactly the solutions their customers want.

    Having access to GNSS correction services continent-wide has the potential to transform high-precision positioning into a mainstream offering, supporting various IoT applications, as well as drones and (semi-) autonomous vehicles.

    Addressing the remaining challenges

    High-precision GNSS correction services that target the mass market are still relatively new, with different suppliers pursuing different business models. Trimble’s service, for example, doesn’t use an open correction-data format, and is only compatible with devices using its own GNSS receivers. The benefit of this is that it can deliver a seamless, fully integrated solution, with complete interoperability across the Trimble product range (provided the region in question has good coverage). OEMs with customers is geographically broader markets will need to weigh this up against the benefits of global coverage provided by a range of correction-data suppliers offering open-format data.

    As we touched on earlier, in safety-critical applications where location-accuracy is essential, any correction data service must be up to the task. This includes ensuring data broadcasts aren’t crowded out when cellular networks become saturated. To this end, u-blox has been working with the 3GPP body to create appropriate standards that can ensure the service meets the required service level agreements.

    Lastly, although there’s now country-wide coverage in both China and Japan, Sapcorda is now attempting to provide continent-wide high-precision services. If it’s a success, it could overcome the challenges of national boundaries and country-based cellular providers. It’s as yet unclear how existing correction-data-service suppliers will respond.

    Customer satisfaction is paramount

    For high-precision GNSS services to achieve mainstream success, they not only need to offer wide coverage and be truly open, but must facilitate innovation and ensure they can broaden the appeal of this capability beyond being a niche specialism. Like in any industry, customer satisfaction is essential if the technology is to achieve this.

    Complexity that arises as a result of state boundaries, national borders, conflicting regulations or subscriptions, must be shielded from the end user and dealt with upstream. This is already happening in some areas, where device-makers are partnering with correction data service providers, enabling them to bundle the service cost into the device cost that the end user pays.

    A revolution in positioning

    As well as helping to realize some of the automated navigation solutions currently under development, new-generation high-precision GNSS services are driving a seismic shift across the whole industry.

    The rise of innovative, high-precision GNSS technology, combined with business models that promise to make high-precision a mass market reality, mean the coming years will be tremendously exciting. By disrupting the existing market, the new technology will mean lots of new opportunities for those ready to grasp them.


    Peter Fairhurst joined the Product Strategy team in the Product Center Positioning at u-blox AG in 2015. He is responsible for the development of industrial markets, with a specific focus on unmanned systems and mapping solutions. Prior to u-blox, he was part of the Product Management group at Leica Geosystems AG, where his focus was on high-precision GNSS surveying technology.

    Fairhurst holds a bachelor degree in Mathematics & Computer Sciences and doctorate degree in satellite geodesy from Newcastle University and an MBA diploma from the University of Strathclyde.