What is the greatest threat to GNSS over the next three years? Click to enlarge. (Source: GPS World 2018 State of the GNSS Industry report)
When we designed the survey of the global PNT community for the 2018 State of the GNSS Industry report, we put a couple of new wrinkles into the online questionnaire. We wanted to know, succinctly, what you felt was the number one obstacle to growth for your organization. And, with the same brevity, what you saw as the number one opportunity for growth.
The answers most frequently given within each sector — mobile, OEM, survey, UAV, transportation, machine control, mapping and defense & government — appear on those respective pages in this issue. They weren’t the only answers, by far.
Obstacles to Growth
Other stumbling blocks that were called out included security, competitors (sometimes mentioned by name), politics (sometimes mentioned by party), budgets, funding, understanding, ignorance, management, bureaucracy, age, and that enduring favorite, time.
The most frequently cited obstacles to growth were:
regulation, and
the lack of qualified staff, personnel, engineers.
One ingenious survey-taker somehow found a way to cram 21 words into an answer box meant for only one or two. “In my industry, deep technical talent that addresses the specific issues. Without that, the ‘big picture’ judgments are often just wrong.”
This problem is not new, nor is it particular to the GNSS/PNT industry. The fact that it is with us year after year suggests that it is not getting enough effective attention. Talented engineers can be imported, yes, if the homegrown supply falls short. In the current political climate, this may not be a strategy with legs. Even given a totally benign immigration regulatory landscape, it is far from a panacea. More on this in a moment.
Growth Opportunities
Various flavors of technology integration, both multi-GNSS and non-GNSS, led the pack in nearly every sector. Other popular answers included customization, broadband, autonomous navigation, Galileo, international markets, alt-nav, Brexit, the Cloud, M-code, anti-jamming, connectivity, flexibility, more clients, and, in riposte to the aforementioned obstacle: training, education, or simply engineering.
The great American thinker Margaret Mead said, “We are continually faced with great opportunities which are brilliantly disguised as unsolvable problems.”
If your organization encounters this perennial problem, this shortage of qualified staff that stifles innovation, inhibits growth, and causes you to pass on new ventures that are just out of reach, here’s the biggest whopping opportunity of all: get involved with higher education and engineering graduate schools in your area.
The talent is there. If you’re not out actively cultivating, encouraging, training and recruiting it, those bright young engineering people will be drawn instead to Internet ventures or gaming software or other industries that sap the soul but nourish the pocket — and those are your true competitors.
On Aug. 10, the National Space-Based Positioning, Navigation, and Timing (PNT) Advisory Board, the government’s GPS expert board, sent a letter to the National Executive Committee for Space-Based PNT (a multi-agency body that steers GPS policy) that concluded, “We strongly recommend your opposition to the Ligado proposal.”
The letter sprang from a unanimous vote five days earlier to oppose allowing Ligado Networks to use spectrum neighboring the GPS band for terrestrial communications.
Ligado possesses licenses to broadcast on two satellite bands located adjacent to the GPS frequencies. The company has been seeking permission from the Federal Communications Commission (FCC) to repurpose these licenses from satellite-based use to ground-based use from powerful tower transmitters.
Ligado said in May it would lower the power in its proposal for the 1526–1536 MHz band to 9.98 dBW to avoid interference with certified aviation receivers. However, the PNT Advisory Board reiterated its opposition, saying that even if the transmissions’ power was lowered to just under 10 watts, it “will create totally unacceptable interference for a great number of GPS users in the United States.”
From the Letter: “This risk is far too great, and far too many questions remain, for Ligado’s proposal to be approved. While there are many broadband alternatives (Ligado would be a very small percentage of this national asset), there is only one GPS. Any impairment to current and future uses is clearly contrary to the national interest. Therefore, implementation of their recently proposed ~10-watt operating scheme will create totally unacceptable interference for a great number of GPS users in the United States. In fact, despite power limits in their current amended application, it is probable they could still be allowed to increase this power over time. This would be even more destructive to GPS users.
“We believe avoiding degradation over at least 90 percent of the region near Ligado transmitters is the absolute minimum protection for GPS receivers in each class. This would be a hypothetical 90 percent Protection Evaluation. This is not an endorsement of this level since, of course, all users would prefer 100 percent protection. The Department of Transportation (DOT) Adjacent Band Compatibility (ABC) study is the only validated test to verify degradation at various received power levels.
“Those results inform that to insure degradation not exceed 10 percent of the Region (90 percent Protection) for High Performance receivers, either:
Ligado maximum power can be no more than .0036 watts at the 400-meter spacing they had earlier planned. Tolerable power would be 3/10ths of 1 percent of their proposed ~10 watts. Or
the closest spacing of Ligado transmitters is 20,000 meters (over 12 miles) for their proposed ~10 watt power level (see Figure 1).”
Figure 1. The PNTAB strongly believes that 90 percent is the minimum Area Protection Criterion (maximum 10 percent degradation). (Chart: PNT Advisory Board)
The U.S. Defense Advanced Research Projects Agency (DARPA) Microsystems Technology Office is soliciting research proposals for the development of a new class of atom-based systems using integrated photonics and trapped atoms to enable high-performance, robust, portable clocks and gyroscopes.
The military researchers are asking industry to develop relatively simple portable photonic integrated circuits (PICs) for high-performance position, navigation and timing (PNT) devices as an alternative to GPS for when satnav signals are not available.
A PIC or integrated optical circuit, similar to an electronic integrated circuit, integrates multiple photonic (having to do with light) functions, providing capabilities for information signals imposed on optical wavelengths, typically in the visible spectrum or near-infrared, 850–1650 nanometers.
A-PhI Program
The Atomic-Photonic Integration (A-PhI) program seeks to develop trapped-atom based, high-performance PNT devices, reducing the complexity of these atomic systems by using PICs. According to the DARPA document, the PICs will replace the optical assembly behind devices such as sensitive and accurate angle sensors and clocks, while still enabling the necessary trapping, cooling, manipulation and interrogation of atoms.
A-PhI aims to demonstrate that compact PICs can replace the optical bench of conventional free-space optics for high-performance trapped-atom gyroscopes and trapped-atom clocks without degrading the performance of the underlying physics package.
Physics
Atomic systems using trapped atoms have the potential to be made portable while maintaining their accuracy due to the atomic trap’s small size and the inherent isolation a trap offers an atomic system from the environment, especially from acceleration.
Currently, these systems are bulky, heavy, and not notably portable, because of the complexity of the optical systems used to create the trap.
In the past, efforts to miniaturize the hundreds to thousands of optical components in such benchtop systems have relied on removing optical elements, miniaturizing the remaining elements, and tightly integrating them in a small package.
The products deliver degraded performance with the need to maintain very tight optical alignment, causing both poor environmental robustness and poor tolerance to design errors. Effective miniaturized atomic systems cannot be achieved at a reasonable cost with this approach.
Recent developments in PIC research suggest that on-chip optical frequency combs based on microresonators, optical frequency synthesis, novel on-/off-chip coupling, wavelength demultiplexers, and on-chip phased arrays for dynamic manipulation of light fields can replace optical systems with readily manufacturable, low-cost chips without the alignment sensitivity of conventional free-space optics.
Gyroscopes
A-PhI also seeks to develop proof-of-concept trapped atom gyroscopes, a matter-wave analog of the interferometric fiberoptic gyroscope. Such a miniaturization effort could generate an order of magnitude improvement in angular sensitivity and dynamic range over current free-space products.
A-PhI hopes to develop portable, high-performance, navigation and timing systems: the miniaturization of the optics of atomic systems without a decrease in performance. Subsequent work, the RFP asserts, will be required to incorporate the necessary compact and robust lasers and electronics to achieve a fully functioning, high-performance, portable PNT system.
GPS data serves as the basis for a geodetic model of the Alps. Here, a horizontal strain field is derived from the data. Red areas indicate compression; blue indicates lateral spreading. (Image: DGFI-TUM)
Our Earth is constantly on the move, as the current Kilauea eruption dramatically illustrates. But capturing data on small shifts over time isn’t so easy.
A new computer model based on more than a decade of GPS data shows the dynamic movements of the Alps as the mountain range drifts and rises.
In general, the range drifts an average of one-half millimeter and rises 1.8 millimeters every year.
However, there are strong regional variances. In South and East Tyrol, a rotation towards the east is superimposed on the overall movement, while at the same time the mountain range is being compressed. And the rise in height is not identical everywhere, either. While very small in the southern part of the western Alps, it reaches its maximum with a speed of more than 2 millimeters per year in the central Alps at the boundaries of Austria, Switzerland and Italy.
To create the model, researchers at the Technical University of Munich (TUM) German Geodetic Research Institute evaluated measurements made by more than 300 GPS antennas over a period of 12 years, in the German, Austrian, Slovenian, Italian, French and Swiss Alps. Over that time, each of the stations has been making positioning measurements every 15 seconds.
The team’s model makes the movements visible on a comprehensive basis for the first time.
The scientists identified the positions of the measurement stations, accurate down to fractions of a millimeter; many of the stations were set up in the EU project ALPS-GPSQUAKENET and are in part operated by TUM.
Once corrected for snow weight and atmospheric interference, the data show horizontal and vertical shifts as well as lateral spreading and compression at a resolution of 25 kilometers.
Explains Florian Seitz, chair of Geodetic Geodynamics, “The data are a goldmine for geodesy, with its objective of accurately measuring the surface of the Earth and identifying any changes occurring.”
The attack seems to have been mounted by those operating two small six-rotor UAVs similar the DJI Matrice 600 — one was certainly carrying explosives because it was videoed exploding. These drones showed up somewhere near Maduro and disrupted not only the president’s speech, but also broke up the parade with participants running for cover.
One drone seemed to collide with an apartment building, fell to the ground, and then fire broke out in an apartment on the first floor. Firefighters apparently disputed a drone explosion saying that a propane gas tank had exploded inside an apartment, but images show a significant hole blown in the wall below the apartment window.
A number of discrepancies could suggest that the incident was staged, but there were injuries to several in the parade below where the first drone exploded, and the apartment fire was only 400 meters from Maduro’s review stand. The “apartment drone” appeared to behave as if control had been lost, possibly due to anti-drone jamming. Check out pictures, a video and a comprehensive analysis of these events on Bellingcat here.
Zephyr-S launched for flight test. (Photo: Airbus)
Meanwhile, on a more drone-positive note, the Airbus Zephyr S pseudo-satellite, solar-powered UAV achieved a world endurance record flight which was just 3 minutes short of 26 days, eclipsing a previous record of 14 days set by a Zephyr prototype. The ultra-lightweight UAV took off July 11 July and landed Aug. 6. This is likely the longest ever flight by an air-vehicle without refueling (balloons and spacecraft excepted).
The Zephyr S is the first of three such vehicles built by Airbus for the U.K. Joint Forces Command. The Zephyr-S flies around 70,000 feet in the stratosphere, powered solely by sunlight, and is aimed at providing short turn-around, satellite-like communications and observation services for both commercial and military customers. The potential exists to support disaster monitoring of fires, earthquakes, oil spills and the like, and to connect almost everywhere in the world that doesn’t already have established communications.
Following evaluation of the flight test results, further flights are planned from a new base at Wyndham airfield in Western Australia. The aircraft is extremely light and does not have an undercarriage, so it’s hand launched and retrieved under minimal wind conditions.
Joe Lee and paramedics UAV pilot Scott Mcleod confer before a simulated medical rescue scenario. (Image: Kongsberg Geospatial)
Meanwhile, at a deserted airfield near Pembroke, Ontario, Canada, a simulated disaster exercise, led by a Royal Canadian Mounted Police (RCMP) incident commander and supported by personnel from Transport Canada and the National Research Council, was evaluating a new air traffic management system supplied by Kongsberg Geospatial from Ottawa.
Integrating drones with disaster management air traffic is one aspect of the Emergency Operations Airspace Management System (EOAMS), a situational awareness system which provides first responders with situational awareness of the airspace around a disaster scene. The system integrates real-time data from a number of sensors, including 3D airborne radar, ground radar, ADS-B (Automatic Dependent Surveillance — Broadcast) sensors, video and GPS. Real-time information was presented to participants on regular computer displays and through a Microsoft HoloLens “mixed reality” visor.
Drones were flown beyond visual line-of-sight (BVLOS) at up to 2 km away from the airfield while the trial emulated emergency scenarios including a plane crash, a medical emergency, and the protection of a VIP threatened by an approaching, unauthorized drone. Drones were operated by the RCMP and local paramedics.
The EOAMS system displayed ground tracks and the identity of a variety of emergency aircraft, and emergency ground vehicles, and enabled safe flight of UAVs within the same airspace. Non-participating drones in the area of the disaster were also identified as possible threats to police and medical aircraft involved in the recovery efforts.
The RCMP and paramedic pilots flew consumer-model drones including the DJI Mavic to test the system’s capacity to detect small drones. Position outputs from these drones were used to verify the accuracy of the EOAMS-displayed plots. A light aircraft was also used to simulate different airborne assets, including a water bomber.
What was learned in the trials will be useful in further development of future emergency airspace management systems for use by first responders, police services and other government agencies in Canada.
RoboTiCan, an Israeli start-up, has developed a unique way of dealing with unwelcome, unidentified drones that intrude into sensitive airspace. With ground-based radar detecting and tracking an incoming UAV, its large, robust drones use machine vision and artificial intelligence technologies to identify threats and then physically attack them.
This video provides — complete with dramatic accompanying music — an insight into how their “Goshawk” drone engages, attacks and by brute force, disables smaller drones in flight.
At first encounter, the Goshawk octocopter appears to also be disabled by an intentional collision with a small UAV, but subsequent encounters demonstrate how it hones in on, collides with, and disables its target and recovers to attack again.
Compared to bird behavior, especially in the spring when nesting birds use similar tactics to defend their eggs or chicks, it does seem that its mode of operation could be very much like a hawk attacking smaller birds — hence its name.
The Goshawk uses strong, fiber reinforced blades to enhance impact survival, while its smaller drone victims may have plastic props. Overall, it’s large, has multiple blades, seems to use an attack move just before impact, and it recovers well. So control algorithms appear to have been enhanced for collisions and recovery. Its targets seem to immediately lose lift and control before they hurtle towards ground impact.
Not surprisingly, RoboTiCan appears to be positioning its marketing towards military customers, but combining this aggressive take-down capability with a high-quality drone detection/location system might also be a winner for civilian/government drone intrusion defense — Mr. Maduro, take note!
To sum up, we have more bad press for UAVs being used as offensive weapons, interesting progress towards pseudo-satellites as Zephyr-S completes 26 days aloft in the stratosphere, another UTM (UAV Traffic Management) system trial aimed at better air traffic control for disasters, and another way to bring down unwanted drone threats.
This last solution might be a better deterrent for negligent or intentional operators who stray into inadvisable airspace. The potential destruction of the drone might just get some recreational flyers to think twice and perhaps reduce these problems.
GPS World magazine recently conducted the 2018 State of the Industry survey, an online polling of the GNSS community. It has become an annual feature, probing for the technical and business challenges that are drawing attention this year, how executives, managers and product developers are driving business in today’s economy, what issues they are concerned about, and — always — what solutions hold the most promise for positioning, navigation and timing (PNT) in challenged and indoor environments, regardless of which technology provides them?
This column reports on the answers provided by those who identified themselves as working in the Defense, Security and Government (DSG) sector of the GNSS/PNT industry, and speculates on the insights that can be drawn from the answers.
Among all who took the survey, 18 percent said they worked in Defense, Security and Government, the second largest group among eight industry sectors, following only Survey and High Precision in size. Of the DSG group members, 82 percent were based in the United States, 6 percent each in Europe and Asia-other-than-Russia-China-and-Japan, and 4 percent from Latin America. Slightly more than half of them worked in companies of more than 500 people.
Queried as to job title, they answered as follows:
Owner/president/co-owner/CEO: 8 percent
Vice president, CTO, COO, CFO or similar: 6 percent
General Manager: 2 percent
Product or program manager: 10 percent
Researcher: 12 percent
Engineer: 44 percent, the largest group
and Other: 18percent, with this last category encompassing consultants, cartographers, a security architect systems engineer, and more.
Each sector group taking the survey answered two questions specific to their sector, while also responding to a variety of economic and systemic questions for the industry as a whole. In the DSG group, the specific questions were:
How vulnerable is GPS/GNSS in defense/security/critical government applications, that is, M-code or similar, to disruption by jamming, whether intentional or unintentional?
And:
What is the greatest threat to GNSS over the next three years?
The answers to vulnerability appear here:
Source: GPS World 2018 State of the Industry survey
And the answers to threat here:
Source: GPS World 2018 State of the Industry survey
Perhaps we erred in offering an “All of the above” answer, as nearly half of respondents selcted that option. This shows a generalized awareness (and fear) of threats, but lacks the capability to then prioritize those threats.
Delving a little further into the responses from the DSG sector, when asked “What technology will win fully enable seamless outdoor/indoor navigation, in combination with GNSS,” they answered:
Assisted GNSS 8.57 percent
Assisted GNSS plus any ONE of the six other answers (Cell-tower triangulation, Proximity beacons, Radio frequency pattern-matching, Sensor-based dead reckoning, Terrestrial ranging system,Wi-Fi 22.86 percent
And the winner: Assisted GNSS plus MORE THAN ONE of the six alternatives 34.29 percent
With Don’t Know, 17.14 percent, and Other, 8.57 percent.
More than any other solution an integration of at least three sensors, in the opinion of the plurality, will be necessary for ubiquitous positioning and navigation.
First choice for a GNSS back-up? The leading answer was eLoran, at 25.71 percent, followed by Low-Earth orbit satellite constellations, 22.86 percent, and Sensor-based dead reckoning, 17.14 percent.
How much effort are you devoting to mitigation of GNSS jamming and/or spoofing?
This is the leading concern of out research and development effort 40 percent
This is an important concern for our R&D, but not the dominant one 20 percent
This is one among many factors we consider; no particular importance above others 17.14 percent
And very surprisingly: We are not focusing on jamming/spoofing mitigation at all at this time 22.86 percent
Finally, describe the market for GNSS products/services in the Defense, Security and Government PNT industry sector as of today.
Very healthy; strong growth 25.71 percent
Relatively healthy; moderate growth 48.57 percent
Flat 22.86 percent
Slightly down 2.86 percent
For more results from the 2018 State of the GNSS Industry, see this page.
Alan Cameron Editor-in-Chief and Publisher, GPS World
“All the News that Fits” can sometimes be a hard motto to live up to, and it has turned out so this month. I want to get more material into our pages for your perusal, and it just could not be crammed into the System of System pages in this issue. Therefore, I cede my “Out in Front” editorial to the 27 gentlepeople, executives across the commercial, scientific and government agency spectrum, who wrote to U.S. Federal Communications Commission (FCC) chair Ajit Pai on July 18.
The core quotes from the letter appear here. However, there’s more meat on the bones and I want to present it here.
“The undersigned organizations, representing entities that provide and rely upon critical GPS, satellite communications (“SATCOM”) services, and essential weather and other environmental data, write to inform you that the threat of harmful interference from Ligado’s proposed ancillary terrestrial component (“ATC”) service continues to pose a significant risk of harmful interference despite Ligado’s May 31, 2018, amendments to its license modification applications in the above-referenced file numbers. The record, augmented by recent government reports, makes clear that the interference will be particularly impactful to the countless government and commercial entities that rely on GPS and SATCOM services for aviation safety and other critical services and the many groups that receive and depend upon real-time weather and related environmental information from National Oceanic and Atmospheric Administration (“NOAA”) satellites…
“We recognize the importance of ensuring that there is sufficient spectrum for mobile broadband, and the Commission has recently taken many steps to address that challenge. However, at a time in which the Administration has placed so much emphasis on the critical importance of space-based communications — through the revival of the National Space Council and other policy initiatives — the FCC should not undermine the nation’s critical space leadership.2 Granting Ligado’s request would harm the nation’s satellite industry and the broad sectors of the country that benefit from American space leadership every day in at least three ways. First, it would threaten the reliability of critical position, navigation and timing (“PNT”) services, including GPS and also an emerging satellite time and location (“STL”) capability augmenting GPS.
“Second, it would undermine the investment-backed expectations of those who operate commercial satellite systems by fundamentally altering the interference environment decades after licensing.
“And third, it would convert 40 MHz of increasingly rare satellite spectrum away from satellite use, rewarding a company for underutilizing its satellite spectrum rather than investing in new satellite technologies.”
In addition to several organizations, the letter is signed by the Aircraft Owners and Pilots Association, the American Geophysical Union, American Weather and Climate Industry Association and the National Emergency Number Association.
My last two columns (NGS 2018 GPS on BMs program in support of NAPGD2022 — Part 6 and NGS 2018 GPS on BMs program in support of NAPGD2022 — Part 7) described the National Geodetic Survey’s (NGS) GPS on BMs 2018 interactive web map, and provided an update and status report on stations observed in support of the 2018 GPS on BMs Program. This column will provide another update and status report on stations observed in support of the 2018 GPS on BMs program and provide an example of how the OPUS-shared results filled in a void area in West Virginia that will benefit the development of the hybrid geoid model GEOID18. The column will also provide an example of how OPUS Shared results identified a reset station that has an invalid NAVD 88 height, and the importance of having a least two OPUS Shared results to ensure the reliability of the OPUS solutions.
As mentioned in the last column, the GPS on BMs 2018 web page contains a link to a web map where users can determine which bench marks NGS would like users to occupy before the August 31, 2018, deadline. The box titled “2018 Web Map” depicts the map update as of July 27, 2018 (1738 priority marks completed). My last column reported that as of May 29, 2018, there were 1067 priority marks considered completed. During the past two months, 671 more priority stations have been reported completed. This is progress but this still only represents about 30 percent of the priority marks. Hopefully, this will increase dramatically during the month of August. Remember, the cut-off date for data to be included in the creation of the hybrid geoid model GEOID18 is August 31, 2018.
NGS periodically provides an update on the GPS on Bench Marks Program. On July 3, 2018, NGS sent an email to everyone that shared GPS data on NGS bench marks via OPUS or registered for NGS’ February 2018 webinar about GPS on Bench Marks. The email provided an update on the GPS on Bench Marks Program (see box titled “July 3, 2018, NGS Email on GPS on BMs Update”). The map provided in the update indicated that some of the new observations may generate changes between +/- 8 cm.
July 3, 2018, NGS Email on GPS on BMs Update
(Source: Email from National Ocean Service, NOAA; [email protected] to Dave Zilkoski)
Update: GPS on Bench Marks
Over 1,420 marks completed, and two months left to improve GEOID18 accuracy in your area!
Image: National Geodetic SurveyYour observations are making a difference! The color ramp in the map above reflects accuracy improvements in a hybrid geoid model from your recently submitted GPS observations. The improvements will be realized when NGS releases GEOID18.
In case you missed it
In early 2018, NGS released a list of priority bench marks where GPS data is needed to improve GEOID18, NGS’ last planned hybrid geoid model before The North American Vertical Datum of 1988 (NAVD 88) is replaced by the North American-Pacific Datum of 2022 (NAPGD2022). Data to support GEOID18 will be accepted until the end of August 2018. After that, GPS on Bench Marks (GPS on BM) efforts will expand to include other regions and will focus on data to improve future transformation tools.
How can I help?
Following the guidance provided on the NGS GPS on BM website, you can help by collecting static GPS data on adjusted NAVD 88 bench marks and submitting the data to NGS via OPUS Share. To improve efficiency and reduce unnecessary redundancy, we have created a GPS on Bench Marks 2018 web map to help contributors know where we have the data we need and where we still need GPS observations.
Thank you to our contributors
Over 1,700 observations have been submitted to date, completing the required observations for over 1,420 marks from our prioritized list. Each observation requires at least 4 hours of data collection with a survey grade GPS receiver, plus additional time for planning, travel, and data submission, so each one is a significant contribution. Visit the GPS on BM website for updates on our biggest data contributors and each state’s progress toward the goals.
Why are you receiving this email?
• You shared GPS data on NGS bench marks via OPUS, or
• You registered for our February 2018 webinar about GPS on Bench Marks.
We anticipate sending quarterly updates about these and related efforts. If you’d like to opt-out, click the “Manage Subscriptions” at the bottom of this email.
NOAA’s National Geodetic Survey
geodesy.noaa.gov
NGS is tentatively planning another webinar on the GPS on Bench Marks program for August 9, 2018 (2 pm to 3 pm eastern time). NGS will provide an update on the GPS on Bench Mark program and probably will highlight potential improvements between the current hybrid geoid model GEOID12B and the latest prototype version of the future hybrid geoid model GEOID18. I would encourage everyone to sign up for the NGS webinar series.
Source: Plot Generated Using ArcGIS
Users can subscribe to any or all of NGS four public subscription lists — news, webinar, training, and GPS on Bench Marks — by visiting the NGS subscription services web page and submitting their email address for the type(s) of notices they want to receive. (https://www.ngs.noaa.gov/INFO/subscribe.shtml)
As indicated in the figure provided in NGS’ July 3rd update on the GPS on Bench Marks program email, there are many areas of the country that have already benefitted from users participating in NGS’ GPS on BMs program. This column will highlight an area near Charleston, West Virginia, were users have been very active in providing OPUS Shared results. The box titled “GPS on Bench Marks near Charleston, West Virginia” depicts the marks that meet NGS’ criteria and will be involved in the development of the hybrid geoid model GEOID18. As you can see from the plot, there are several new stations that will be used in the development of the model which will help to improve the reliability of the product.
The box titled “An Example of OPUS Shared Stations in Charleston, West Virginia, Region” provides the stations’ PID and OPUS designation. The six OPUS Shared stations cover approximately a 50 km square area. Most of the stations are only 10 km apart. These stations will definitely help to improve the reliability of the hybrid GEOID18 model.
An Example of OPUS Shared Stations in Charleston, West Virginia, region
(Source: Plot Generated Using ArcGIS)
Source: Plot Generated Using ArcGIS
When using OPUS Shared results, users should always check to see if a station has been observed more than once. The box tilted “Differences in OPUS Shared Ellipsoid Heights in Charleston, WV, Region” lists the pairs of OPUS observations for the stations depicted in the previous plot. The column labeled “Difference in Ellipsoid Heights” provides the differences in ellipsoid heights based on the two different OPUS Shared results. All differences are less than 1.5 cm and most are less than 1.0 cm. This is indicating good repeatability to the cm level but this may not be indicating accuracy. These stations were observed one day apart but observed at about the same time of the day. They could have the same systematic errors effecting the results such as multipathing and satellite geometry. When performing the second OPUS Shared observation, users should select a different time of day to improve the chances of detecting, reducing, and/or eliminating the effects of remaining systematic errors.
Differences in OPUS Shared Ellipsoid Heights in Charleston, West Virginia, region
Source: National Geodetic Survey
The box titled “Differences in OPUS-Shared GNSS-Derived Orthometric Heights Using GEOID12B and Published NAVD 88 Heights” provides the differences between the GNSS-derived orthometric heights using GEOID12B and the published NAVD 88 values. This table indicates that there is a large difference (23.4 cm) for station HX2382 (L105 Reset 1962). Since the two ellipsoid heights only differ by 1.0 cm, this is an indication that the station probably moved since it was Reset or the reset observations were performed incorrectly. Either way, this station should not be used in the development of the hybrid model or used by anyone for geodetic control.
Differences in OPUS-Shared GNSS-Derived Orthometric Heights using GEOID12B and Published NAVD 88 Heights
Source: National Geodetic Survey
Since GEOID12B is a hybrid geoid model that was designed to be consistent with NAVD 88 values, I always compute differences between GNSS-derived orthometric heights using the experimental geoid model and published NAVD 88 height values. I described this process in my October 2015 column (http://stage.globalpositioningnews.com/establishing-orthometric-heights-using-gnss-part-3/). The box titled “Differences in OPUS-Shared GNSS-Derived Orthometric Heights Using xGeoid17b and Published NAVD 88 Heights” provides the differences between the GNSS-derived orthometric heights estimated using IGS08 (2005) ellipsoid heights with the xGeoid17b geoid model and published NAVD 88 heights. The values in the column labeled “GNSS-Derived Orthometric Height minus Published NAVD 88” represent an approximate difference between NAPGD2022 and NAVD 88. The box titled “OPUS-Shared GNSS-Derived Orthometric Heights Using xGeoid17b minus Published NAVD 88 Heights” provides a plot that depicts these differences.
Differences in OPUS-Shared GNSS-Derived Orthometric Heights Using xGeoid17b and Published NAVD 88 Heights
Source: National Geodetic Survey
OPUS-Shared GNSS-Derived Orthometric Heights Using xGeoid17b minus Published NAVD 88 Heights
(Source: Plot Generated Using ArcGIS)
Source: Plot Generated Using ArcGIS
Once again, it should be noted that PID HX2382 value is much different from the other values. To look for outliers, a mean difference was removed from the results. The box titled “OPUS-Shared GNSS-Derived Orthometric Heights Using xGeoid17b minus Published NAVD 88 Heights with a Mean Value Removed” makes it easier to see that station HX2382 is an outlier. The station is approximately 25 cm different from its neighboring stations that are only 10 km away. As previously mentioned, this station apparently moved since being Reset in 1962 or the reset observations were performed incorrectly. Identifying stations that have moved since the last time they have been leveled is one of the benefits of participating in the GPS on BMS program.
OPUS-Shared GNSS-Derived Orthometric Heights Using xGeoid17b minus Published NAVD 88 Heights with a Mean Value Removed
(Source: Plot Generated Using ArcGIS)
Source: Plot Generated Using ArcGIS
For completeness, both a bias and trend were removed from the differences since IGS08 (2005) GNSS-derived orthometric heights and NAVD 88 heights indicate that there’s an apparent long-wavelength trend between the two sets of values. The box titled “OPUS-Shared GNSS-Derived Orthometric Heights Using xGeoid17b minus Published NAVD 88 Heights with Bias and Trend Removed” depict the differences with a bias and trend removed. As in the other figures, PID HX2382 clearly indicates that it is an outlier relative to its neighbors. This station would be rejected by the geoid team when creating the next hybrid geoid model.
It should be noted that except for the Reset station, all of the differences are less than 2 cm. Although, some relative differences between closely-spaced stations approach 4 cm. For example, the differences between stations HX1746 and HX2496 is -3.7 cm (-1.8 cm – 1.9 cm). The differences in ellipsoid heights from the OPUS Shared solutions are all less than 1.5 cm, even the differences between ellipsoid heights for station HX2382 is only 1 cm. This is an indication that the reset station, HX2382, does not have a valid NAVD 88 published height and should not be used as control. Surveyors that adhere to the FGCS specifications and procedures would realize that this station did not have a valid NAVD 88 height and would not use the published NAVD 88 as control in their project. For example, surveyors performing a leveling project would perform a 2- or 3- mark leveling tie and the results would indicate that the station had moved since it was last leveled.
OPUS-Shared GNSS-Derived Orthometric Heights Using xGeoid17b minus Published NAVD 88 Heights with Bias and Trend Removed
(Source: Plot Generated Using ArcGIS)
Source: Plot Generated Using ArcGIS
This type of validation procedure should also apply for OPUS users. If a user obtains one OPUS solution and proceeds to perform a survey from that station, the user does not know whether the OPUS height value is reliable or accurate. One solution does not provide any indication of reliability.
The OPUS Shared station PID SV0942 (A 25) is an example of two OPUS Shared results generating ellipsoid height values that differ by 10 cm. (See yellow highlighted section in the box titled “Differences in OPUS Shared Ellipsoid Heights for PID SV0942.”) This large difference is significant when you performing a survey where you need heights to better than 3 cm (0.1 foot). This is one reason that NGS requires two OPUS Shared solution for every mark used in the development of the hybrid geoid model.
Differences in OPUS Shared Ellipsoid Heights for PID SV0942
Source: National Geodetic Survey
In the OPUS Shared solutions of PID SV0942, the latest OPUS Shared GNSS-derived orthometric heights (2018-07-14) agrees to about a cm with the published NAVD 88 height, while the 2014 Opus Shared GNSS-derived orthometric height is -11.4 cm different from the published NAVD 88 value. (See yellow highlighted section in box titled “Differences in OPUS-Shared GNSS-Derived Orthometric Heights Using GEOID12B and Published NAVD 88 Heights for PID SV0942.”)
Differences in OPUS-Shared GNSS-Derived Orthometric Heights Using GEOID12B and Published NAVD 88 Heights for PID SV0942
Source: National Geodetic Survey
It should be noted that the error estimates provided in the Opus Shared output indicate the ellipsoid heights are good to about +/- 1 cm. (See highlighted section in box titled “Two OPUS Shared Solution for PID SV0942.”) Saying that, the two NAD 83 (2011) ellipsoid heights disagree with each other by 10.2 cm. I like a quote that is attributed to Mark Twain – “It ain’t what you don’t know that gets you into trouble. It’s what you know for sure that just ain’t so.” (Obtained from http://lukefostvedt.com/famous-quotes-about-statistics/). I’m not suggesting that Opus Shared solutions results are incorrect. I’m attempting to provide an example of why users need to repeat all observations and to demonstrate how error estimates can be misleading.
“It ain’t what you don’t know that gets you into trouble.It’s what you know for sure that just ain’t so.”
The number of GPS on Bench Mark stations completed as of July 27, 2018, represents about 30 percent of the total number of stations that need to be observed. As I have explained in previous columns, there are many invalid GPS on BMs stations that may be used in the next hybrid geoid model unless more bench marks with valid NAVD 88 heights are observed with GNSS. NGS will accept data for inclusion in the next hybrid geoid model, GEOID18, until the end of August 2018. After that, NGS’ GPS-on-Bench-Mark Program will expand to include other regions and will focus on data to improve NGS datum transformation tools. This column provided an update and status report on stations observed in support of the 2018 GPS on BMs program, provided an example of how the OPUS Shared results can be used to identify a station that may have moved since it was last leveled, and the importance of repeating OPUS observations. I would encourage users to register for NGS’ next webinar on the GPS on Bench Mark Program scheduled for Thursday, Aug. 9th to hear the latest status of the program.
After a couple of good hours of progress, we suddenly ran up against a massive “tail-back” — as the English call road-blocks — on the A303. We eventually crawled along further and discovered that all the rubber-neckers were slowing to grab a glimpse of Stonehenge, which you can see on the left, not far from the road. A little further on I saw a sign for Farnborough and thought that its surely around this time of year for that huge aerospace show known as the Farnborough International Airshow. So when I arrived home after almost three email-less weeks, it was not surprising that my inbox was crammed with lots of European aerospace news.
SkyGuardian MQ-9B
General Atomics (GA-ASI) seems to have come out tops in UAV public relations, flying its MQ-9B company-owned SkyGuardian from Grand Forks, North Dakota, to Royal Air Force (RAF) Fairford in Gloucestershire, U.K. on July 10-11 — that’s a 3,760 nautical mile flight in a fraction just over 24 hours. The RAF has operated the MQ-9 Reaper for over 10 years and the RAF configuration of the MQ-9B will apparently be called PROTECTOR RG Mk1. It just so happens that the RAF is celebrating its 100-year anniversary, so GA-ASI took the opportunity to drop in and say hello at a much smaller airshow at Fairford July 13-15.
Then they announced last week at Farnborough that GA-ASI had been selected to provide UAS to the Royal Netherlands Air Force (RNLAF) following consideration by the Ministry of Defence for the Netherlands. Doesn’t sound exactly like a contract yet, but its close enough to say that the Netherlands will take delivery of the Predator B/MQ-9 Reaper Medium Altitude, Long-endurance UAS. They also reminded us that the Spanish Air Force is to take delivery of MQ-9 systems in 2019.
From a SatNav point of view, we might also be interested that the GPS receiver on this UAV has also been upgraded to add Galileo signal capability — a requirement for what seems to be an expanding number of government forces in Europe. No luck yet in securing better information from GA-ASI about this upgrade, but Farnborough has likely kept them hopping, so hopefully more news later.
Zephyr S High Altitude Pseudo-Satellite UAV
Photo: Airbus
Fresh on the heels of taking on the Canadian Bombardier C-Series program (now the Airbus A-220) and closing the first deal with JetBlue for 60 of these aircraft, Airbus has committed to production of the Zephyr S HAPS (High Altitude Pseudo-Satellite) solar–electric, stratospheric UAV.
Zephyr has an 82-ft. wingspan and is designed to operate on solar power in the stratosphere at an altitude of around 13 miles emulating equivalent services provided by satellite. This is well above clouds, the jet stream and the ozone layer, and importantly well away above regular air traffic. Airbus anticipates the drone flying for up to 100 days without landing (its currently record is 14 days) and to travel up to 1,000 nautical miles per day. It weighs 165 pounds, but can support a payload up to five times its own weight.
The Zephyr aircraft began its maiden flight in Arizona a few days ago — the “qualification flight” is being supported by both the U.K. and U.S. governments — and the U.K. Ministry of Defence is the launch customer for Zephyr. The aircraft has so far logged around 1,000 hours total flight time. The test flight will conclude once engineering objectives have been met. Other solar-cell powered aircraft have struggled with landing or take off due to the large wing, light weight and hence stability under wind gusts, so several projects have not progressed past the R&D stage. Airbus & RAF’s commitment to production indicates their faith in the aircraft design.
Staying with the U.K. theme, the Goodwood Estate in Chichester, England — famous for the Goodwood car racing circuit — has recently hosted the Goodwood Festival of Speed, which apparently included drone racing. And at the same time, a Guinness World Record drone speed record was established.
Wingcopter XBR
The Wingcopter XBR is a tilt-rotor UAV with two lift props and two horizontal velocity props, and the drone flown by teenage drone racer Luke Bannister reached an average of 240.6kmph (~150m/h) over a Goodwood 100 meter track, flying over the measured track in both directions to account for wind. This set the world record for the fastest ground speed by a “remote-controlled tilt-rotor aircraft.” A previous record of 179.6 mph has been achieved by a quadcopter drone rather than a tilt-rotor UAV like the Wingcopter, but there is apparently more drag with type of drone, so its classified as a different category of UAV.
Northrop Grumman Triton High Altitude UAV
Northrop Grumman Triton High Altitude UAV. (Photo: Northrop Grumman)
Meanwhile, Northrop Grumman released a statement at Farnborough on their continuing discussions with Germany towards the sale of its high-altitude Triton MQ-4C unmanned surveillance drone, but apparently a lot of work still remains. In April the U.S. State Dept. authorized the sale of up to four drones worth up to $2.5 billion, and the German government has since been working closely with the US Navy towards a deal.
People may recall the previous cancellation of the “Eurohawk” program back in 2013 — under which Germany had planned to buy a version of Northrop’s Global Hawk drone — after escalating estimated costs for civil certification of the vehicle hit 600 million euros ($702 million) — not a minor task in any way.Subsequently, Northrop and Airbus Defense and Space have teamed up on a new ‘Pegasus’ program, which will add UAVs to Germany’s surveillance capabilities — drones flying autonomously as high as 60,000 feet to gather a wide array of intelligence data.
The German government plans to buy three of the drones, equipped with sensors and a mission system now to be engineered by Airbus. Preparations for certifying equipment to enable the drones to operate in civil airspace are moving more smoothly this time, but with deliveries to only start in 2025. Northrop developed the Triton, a marine-based variant of the Global Hawk, under a U.S. Navy contract awarded in 2008. And Australia last month said it plans to buy six Triton aircraft for maritime patrol, initially expected to cost A$1.4 billion ($1 billion U.S.).
So, lots of military drone stuff this month — not unusual given the nature of the Farnborough U.K. airshow, even though Boeing and Airbus also use the show to one-up each other’s announcements of commercial aircraft contracts and options. Lots of good news for General Atomics, not so much yet for Northrop Grumman, and some light relief with high speed drone records at Goodwood. Back to more North American UAV news hopefully next month.
Did you know Australia doesn’t exist? (Sorry, Aussies.) The entire continent is part of a massive conspiracy designed to confuse you. Anyone who says they’re from Australia is an actor (paid by NASA, probably.) And all the airline pilots are “in on it,” flying people to a carved out section of South America.
The “rationale” (I use the word very lightly) seems to be that Britain just wanted to dump its convicts in the ocean, so made up the continent to tell people where they were taking them.
These and other “theories” spouted by Flat Earthers are akin to falling down a rabbit hole where up is down and round is flat. How can they believe such nonsense?
The 1893 Orlando Ferguson map imagines Antarctica as a wall of ice around the world. (Image: Library of Congress/2011594831)
Last year, the flat Earth idea became national news when rapper B.o.B. used Twitter to jump on the flat Earth bandwagon, even starting a GoFundMe campaign to find Earth’s curve. B.o.B.’s campaign wants to “launch multiple weather balloons and satellites into space” to observe (and try to disprove) what centuries of science and technology have already confirmed. So far, he’s raised less than $7,000 of his $1 million target.
How do Flat Earthers explain GPS? Is there a way to convince them that they’re wrong? Probably not. Anyone who tries is met with an argument that their evidence is faked or faulty. GPS satellites aren’t in space — there’s a “celestial dome” over the Earth. Or the signals are really from giant towers and the G stands for ground. Or Google has laid cables across the oceans to track you.
Astrophysicist Neil DeGrasse Tyson blames the educational system — not for teaching insufficient science subjects so much as needing to improve critical thinking skills. “Our system needs to train you not only what to know, but how to think about information, knowledge and evidence,” he said.
Should we bother to convince Flat Earthers they’re wrong? Some on the internet could be trolls toying with arguments and theories. True believers, however, are an extreme minority, and there will always be people who choose to believe in “alternative facts.” Let’s hope they remain a minority.
In the not-too-distant future, the following scenario may take place.
Image: Stockvault
A corporation owns an improved property in a large metropolitan city and has decided to sell it to a prospective buyer. Through a series of electronic messages and high-tech operations, the seller, buyer, their respective counsels, lending institutions and a title company are provided with documentation stating the condition of the site along with holograms and 3D digital models worthy of a science-fiction movie. In a matter of minutes, the deal is closed with monies and titles silently swapping places out in the ether.
Behind the scenes, the surveyor is a big part of this transaction. But how will the operation of the land title survey look in the future? Like everything else, artificial intelligence (A.I.) and blockchain technology will play a substantial role in surveying. I don’t profess to be the next Carnac the Magnificent, but it could look like this…
HOW IT ALL STARTS
The seller contacts their corporate attorneys to begin the contractual process. Requirements for the sale include acceptable and insurable conditions of the site and a clean title policy from a title insurance company, so the latest land title survey requirements will be held for site and title review. Once the seller and buyer are committed to a sale of the subject property, a blockchain is established in a transactional database to track every step of the sale.
Image: GSA
The attorney will consult with “Sheldon,” an artificial intelligence system built by a leading e-commerce company and designed to assist with business-to-business commerce. Sheldon will be used to secure the services of a land surveyor for the transaction. By researching available consultants based upon the information for the parcel contained within the blockchain, Sheldon contacts firms that could meet the criteria for this part of the transaction.
Once an appropriate firm is chosen by Sheldon, the data for the survey within the blockchain is uploaded to “Thomas,” a digital assistant designed specifically for surveyors. Thomas works with Sheldon and the blockchain to formalize an agreement, secure the necessary insurance requirements, and finalize a payment schedule for services.
ENTER THE SURVEYOR
Once the project is secured, Thomas creates a project file, downloads current satellite images, GIS data (including parcel, building and utility information), and recorded documents for the subject parcel. Among the information is parcel data for the project site. This data is based upon historical land surveys and converted into an accurate dataset in which most of the property and land corners are now included in the GIS database. All corners within the database have been installed or upgraded to contain an RFID chip imbedded within the top of the marker.
Image: NOAA
These GIS databases also take advantage of ongoing advancements of the North American Terrestrial Reference Frame of 2022 (NATRF2022). Beyond the initial implementation, the National Geodetic Survey has incorporated additional precision gained by improved L5 satellite reception and other nations’ satellite constellations in sub-centimeter location with most survey-grade receivers. Thomas compiles all site data into a comprehensive package for submission to the surveyor.
Because of the advancements with instrumentation and sensors in locating improvements both above and below the surface of the ground, the latest land title survey standard has moved all optional Table A items into required information to be provided on the plat. The standard also now requires a drainage analysis to be prepared to determine how the subject property relates to the adjacent parcels.
Thomas reviews the current backlog of project managers and assigns/transmits the project to the first available team. The chosen survey project manager receives the project information and creates an Ethereum blockchain file to work with the master blockchain and begin the survey process. By creating additional survey programming working in conjunction with the project blockchain, all parties involved in the transaction can monitor progress every step of the way.
The first responsibility of the survey PM is to work with Thomas to evaluate the existing data available for the project location. Current conditions from satellite imagery, improvement and utility information from existing governmental GIS databases, and parcel/easement information from recorded document sources are used to determine flight paths for UAVs utilizing multiple sensors, avoiding substantial obstacles. This process will also establish areas to be surveyed/verified by mobile methods where aerial data cannot be obtained.
All available information is processed by Thomas to establish the most efficient routes and methods of data collection for the parcel through software designed to compile and review spatial datasets. This software is specifically designed to review existing information for potential conflicts in flight and on-the-ground obstacles. Once completed, a flight plan for the UAV and route plan for the autonomous mobile vehicle will be reported with missed areas identified for manual data collection.
FIELD WORK ON STEROIDS
When the time arrives for field work to begin, a technician is dispatched in an autonomous electric truck pre-programmed to go directly to the site. The truck is loaded with various survey-grade instruments and equipment (all GNSS equipped): vertical take-off fixed wing and multi-rotor UAVs (both with lidar, photo, hyper-spectral, and GPR sensors), an autonomous mobile ground robot (with GPR/lidar sensors), and an RFID reader for boundary location.
The technician works with the equipment through a universal tablet computer controlling both aerial and ground data collection simultaneously, depicting the progress of the work in real time. This gives the technician time to locate the boundary points with the handheld GNSS receiver/RFID reader to verify the limits of the property.
Once the autonomous work is finished, the technician processes the data on site, and software compares collection coverage versus the initial site review. When processing is complete, the technician will utilize a handheld GNSS receiver with lidar sensor to obtain remote areas not collected by the other methods.
The remaining data is compiled with autonomous data and re-analyzed for overall coverage and approved by the software for completeness. Once the computer determines everything has been collected, the technician checks the complete box and leaves the site.
OFFICE WORK AND WRAP-UP
The final field data is uploaded to cloud servers as the technician leaves the site and the survey PM is notified by electronic message of the field task completion. Thomas, the digital surveying assistant, takes the lead and begins the final processing. The data is reviewed for completeness, parsed for any anomalies within the downloads, and compiled into one database for building a 3D model of the site.
Photo and lidar data are compared for accuracy, utilities are verified against existing records and easements, and building characteristics are matched against governmental records for zoning code compliance.
Once this analysis is complete, the final drafting takes place to create the final deliverable. While the data within the model contains attributes of each entity, labels are placed interactively throughout the site to help depict the site information. This model is also suitable for use by architects and planners to utilize in their B.I.M. design programs, so the quality in the modeling output is top notch.
The final deliverable contains an overall report documenting site conditions, drainage characteristics and physical conditions of various entities. This report will also detail potential site encroachments, possible drainage issues, and zoning/parking red flags. Thomas will report back to the survey PM that all final checks have been made and deliverables made for submittal to the client, leaving only the final transmittal left to do.
Once the deliverable is received by the client, Sheldon (the B2B automated assistant) recognizes the delivery and begins the process of payment to the surveyor. With standardized surveys, automated assistant/analyzation systems, and trackable processes through blockchain, the client gets a quality product at a market rate in an acceptable timeframe and the surveyor gets paid in a reasonable period.
THEN WE ALL WOKE UP TO REALITY…
Maybe this fictional situation for land surveyors won’t be a reality in my lifetime, but I’m not willing to bet against it. I look back at my short 30+ year career and still marvel at the technological advancements yet I acknowledge we are still turning a corner in computing power (see May’s column). I remember the introduction of laser scanners and lidar sensors as future data-collector saviors, gathering multitudes of precise and accurate data much faster than any mortal. Now we have UAVs that can soar above us with little interference and provide images and data at a reasonable cost, so technology does benefit us.
But what about data that is automated to the point it is beyond the control of the surveyor? And what does this do to our shrinking surveying workforce?
Some may say it is a godsend on both accounts. I personally won’t turn out a product or survey in which I don’t have a good understanding of what the data represents or how it was collected; that violates a code of ethics of practicing beyond my expertise. I also don’t think automation will eliminate our technicians, but the surveying profession will need to provide adequate training for our next generation.
“I’M SORRY, DAVE. I’M AFRAID I CAN’T DO THAT.”
We live in a world in which so many things are automated (Alexa, Siri and “Hey, Google”) to assist us with even the most mundane of tasks. Amazon recently introduced a store where the customer doesn’t stop at a cashier; just grab the items off the shelf and walk out. Apple introduced its latest iPhone that opens by recognizing your face. Automation is here to stay, whether we like it or not.
Image: MGM
An article by the Pew Research Center (“Automation is Everyday Life“) described in detail the amount of anxiety that automation instilled in Americans. Many felt that while there are opportunities to increase productivity and profitability in many sectors, that will be offset by lost jobs replaced by automation. Others were also troubled by automation becoming more prevalent in medical treatment of senior citizens.
For many, the thought of automation isn’t nearly as scary as the concept of “artificial intelligence.” While most of the processes involve machine learning (ML) and refining results based upon increasing datasets, computing power is increasing and introducing new methods including “deep learning.” The algorithms being produced by deep learning through neural networks are making smarter decisions as they use larger and more complicated datasets.
From a June article for The Atlantic, Henry Kissinger (yes, that Henry Kissinger) offered these thoughts on A.I.:
Henry Kissinger (Photo: The Atlantic)
Ultimately, the term artificial intelligence may be a misnomer. To be sure, these machines can solve complex, seemingly abstract problems that had previously yielded only to human cognition. But what they do uniquely is not thinking as heretofore conceived and experienced. Rather, it is unprecedented memorization and computation. Because of its inherent superiority in these fields, AI is likely to win any game assigned to it. But for our purposes as humans, the games are not only about winning; they are about thinking. By treating a mathematical process as if it were a thought process, and either trying to mimic that process ourselves or merely accepting the results, we are in danger of losing the capacity that has been the essence of human cognition. (June 2018)
He also makes a strong statement that the United States needs to develop a national vision for AI like other countries (i.e. China, Russia, India) to stay competitive in computing power.
TRANSLATING ARTIFICIAL INTELLIGENCE INTO SURVEYING
The point of this discussion wasn’t to be “doom and gloom” of technology. I look forward to enjoying many of the advancements of AI and blockchain advancements. Many of the advantages of both technologies have not been brought to the surveying forefront yet, but it will only be a matter of time.
My one big fear to automation attempting to overtake and regulate some functions of surveying leads back to boundary determination and the increasing use of holding technology/mathematics over monumentation, hence Kissinger’s comment regarding human cognition. The rules of construction will always hold true in my boundary analysis until there is a time and place where all parcels (original and retracement) are created in a mathematical vacuum.
I also don’t see a timeframe yet that reduces the amount of measurement error between survey practitioners utilizing differing methods and technologies. Survey equipment manufacturers are still refining ways to get more precision from their GNSS receivers, yet still put them on a pole with a bullseye bubble that needs constant checking. Even tribrachs and total stations aren’t checked as often as recommended, but we always seem willing to argue over who measures better.
Until we get more consistent in our overall measuring as a profession, I’ll hold off on worrying about artificial intelligence taking over.
In the meantime, let’s back off calling a corner monument off by 0.03’ just yet. Let’s hope that when A.I. does become more prevalent, the surveying profession will have its collective heads wrapped around our own intellect as well.
A little more than a decade ago, the IT world began to buzz about the next big thing, a concept called service-oriented architecture (SOA). SOA promised a better way to build enterprise applications, delivering efficiency, business agility and fluid communication — a near revolution in business workflows. Such was its promise that business executives — not just CIOs — began to ask, How do I get an SOA?
In the fog of excitement, few executives asked the more appropriate question: What exactly is an SOA? Is it an off-the-shelf product, an IT methodology, a business philosophy? And where does it belong in my organization — do I need a strategy to drive business value from it?
Today, artificial intelligence (AI) triggers similar levels of excitement, with a chaser of fear. In a recent survey by New Vantage Partners, C-level executives crowned AI the most disruptive technology — far outranking cloud computing and blockchain. And nearly 80 percent of those executives fear competitors will harness AI to outflank their business.
An Executive Checklist for AI in the Enterprise
Create a strategy. AI is already making an impact in the enterprise — via chatbots, virtual assistants, and other point solutions. Experts advise executives to establish a framework for how AI will be incorporated into business strategy and processes, and to define measurable goals.
Apply executive support. Assign a C-level executive to oversee the company’s strategy. “When companies are looking to do fundamental digital transformations and reinvention of the business, there is incredible value in having top-down guidance drive much of that activity,” says Microsoft’s Joseph Sirosh.
Mind the data. “Predictions will be accurate only if the training data used to teach the AI prediction model is truly representative of the target cases being classified or predicted,” explains Esri’s Sud Menon. “AI is a data-driven game, hands down.”
Incorporate robust datasets, including location information. In nearly all its forms, business data can become more valuable when coupled with information about its location. This form of geoenrichment is especially useful for AI models, which can discover insight that humans might overlook. (See “A Business Case” in the article.)
From an executive’s perspective, now is the time to answer critical questions: What is AI, what can it do for my business, and who should be responsible for its development and strategic alignment?
AI in the Enterprise
Although 93 percent of businesses are investing in artificial intelligence, not all are using it in the same way or toward the same end, says Sud Menon, director of software product development at Esri. “AI is a very broad term, and businesses are adopting different aspects of it at different rates,” Menon notes.
Sud Menon, Esri
When envisioning how AI can deliver value to their enterprises, business executives should think of three primary processes, according to Menon and Joseph Sirosh, corporate vice president of artificial intelligence and research at Microsoft: internal business operations, customer interactions, and business planning. Interestingly, a survey by Tata Consultancy Services found that high-performing companies are more likely to focus their AI efforts on internal operations, while AI followers tend to concentrate on customer interactions.
Regardless, each process is being transformed with help from cloud computing, data, and intelligent algorithms that power AI. Here are a few examples of how:
Internal Operations. AI is improving companies’ internal operations in several ways. In some workplaces, AI-based facial recognition systems regulate employee access to secure areas. Predictive maintenance systems run by AI help determine the optimal service schedule for fleets of delivery vans. And AI-infused bots are performing HR tasks that once required human intervention, such as guiding employees through the steps of changing their last name, or adjusting the allocation of their 401k plan. The bots connect to systems of record like ERP and HR software, analyze pertinent data, and lead employees through an intuitive workflow.
Customer Interactions. AI is adding intelligence to some customer-facing tasks. For example, AI powers many of the recommendation systems that suggest a relevant product or a message to a website visitor who lives in a particular location. It anchors security systems that recognize a fraudster’s voice signature or suspicious online activity in real time and deny the person access to an online account. And it supports the chatbots that interact with millions of consumers online each day.
Business Planning. For executives and decision-makers looking for strategic guidance, AI can predict shifts in supply and demand and how businesses might react. To plan next quarter’s operations, the technology can sift through customer purchasing habits and factors such as planned competitor stores to predict sales, product mix, and staffing levels. Business decisions that were once governed primarily by an executive’s intuition — like where to invest and when — are now being strengthened by data-driven AI. (See the section titled “A Business Case” for an example.)
AI Accuracy: Machine Learning Keeps on Learning
Much has been made of AI’s abilities — to see, to understand human speech, to predict outcomes. But some wonder whether the technology has evolved enough to form the foundation of business decisions. For instance, a recent WIRED story reported that an AI-based image detection program was 91 percent sure that a photo of two skiers was a dog. It turns out that like any computer program, AI will need debugging before it is put into production.
AI systems today are statistical learning systems that drink in data. If the data used to teach AI systems is flawed, either because it’s wrong, statistically unsound, or does not cover the use cases the AI system was designed for, the outcomes can be erroneous.
As companies increasingly turn to AI and machine learning to inform business decisions, experts advise a meticulous approach to data. “While AI models have increased greatly in sophistication, including the ability to learn from ever larger datasets of known cases, businesses need to understand that the approach is still empirical,” Menon says. “Predictions will be accurate only if the data used to train the prediction model truly represent the target cases being classified or predicted.”
For example, an AI model schooled to predict the health outcomes of a certain diet might overstate results if the data used in training the model is tied to a specific subgroup of the population. In such a case, the model would have no way of taking into account the genetic and lifestyle variations in other groups that could modulate the effect of diet on health, and its results could be flawed if applied broadly.
Joseph Sirosh, Microsoft
The good news, Sirosh says, is that AI systems can be tested in scientific ways — with new data — and validated. Especially in the case of AI designed for mission-critical operations, it may be important to have controlled statistical testing, similar in spirit to clinical trials in medicine.
“It is up to a business to gather the right data for the problem at hand and apply prediction results appropriately depending on the type of problem being solved and the decisions being made,” Menon says. Executive-level support can set these ground rules for AI, helping ensure accurate decision support throughout the enterprise.
With the right data, the business case for applying AI widely is growing stronger by the week — across many forms of AI. A Danish company, for example, claims that the AI behind its pricing technology can improve gas stations’ margins by as much as 5 percent. Meanwhile, the insurance company Lemonade recently claimed a world record, saying the company’s AI bot settled a client’s claim in three seconds (including sending wiring instructions for the payout and notifying the client of the settlement).
In all these instances, businesses are either offloading decisions to AI or strengthening them with AI’s help — and creating new experiences for customers, new business models, and new ways of working.
Trend Spotting: Adding Location Data to AI
(Image: Esri)
“All this decision-making feeds on data,” Menon says. “The more data you have that is relevant to the problem, the better the decision-making process is.”
One type of data driving AI in new directions is location, Sirosh says. “Geographic information systems [GIS], which can correlate and analyze location in time and space and integrate it with many other types of information — and then serve it up for higher-order AI to be applied on it — are particularly interesting,” he told WhereNext.
“GIS and geography provide organizations with additional contextual information that enriches observations, leading to better predictions,” Menon explains. That might be the quarterly sales at stores in a particular market. Or the rate of home ownership in the area where a bank is considering building a new branch. It could even be data on physical phenomena such as weather, vegetation, or urban density. The more data elements that GIS catalogs, the more oxygen AI has, and the better its predictions will be.
“Most things are located in the world and related to or influenced by nearby things,” Menon says. That simple statement underscores the value of using location data to strengthen AI-based decision making.
The Pillars of Artificial Intelligence
Unlike technologies that are well known but struggling for widespread business adoption — among them, virtual reality and blockchain — artificial intelligence is already being put to work in organizations worldwide.
The coming-out party for AI is due to three factors, according to Joseph Sirosh, corporate vice president of artificial intelligence and research at Microsoft. The first is the massive compute power now available in the cloud or on premises, which allows data to be processed into insight. The second is the data unleashed by digital transformation, including sensors that relay information via the Internet of Things (IoT), GPS and mobile devices that report accurate locations, and innumerable other sources. Sirosh calls data the oxygen of artificial intelligence.
The third pillar of AI is the algorithms that fuel its intelligence. Recent innovations have provided AI with “the ability for computers to learn from every type of data, make predictions, and act without being programmed explicitly,” Sirosh says.
Together, those forces help AI mimic — and in some cases, outperform — humans’ abilities to see, analyze, communicate with, and make predictions about the world around them.
A Business Case: AI Powered by Location Intelligence
Just as search engines revolutionized the speed of information discovery and knowledge sharing, AI and location data are accelerating business activities by performing some tasks faster than humans can, with more data. The benefit isn’t simply faster decisions, Sirosh and Menon say. It’s smarter decisions.
A new breed of AI-based sales analysis is a case in point. A sales executive at a national retailer has identified young parents as a core customer segment and wants to learn more about them. But manually gleaning insight from thousands of customers and hundreds of thousands of transactions is an impossible task. The company turns to a machine learning model in the hope of discovering more insight.
The goal is to find patterns in the data that will help the company understand this core customer segment — insight that will improve the company’s marketing messages, store assortments, and the events it sponsors in its communities. The project team tutors an AI model using data from multiple stores, including customer addresses and a record of purchases attributed to each address.
The AI model sifts through these records looking for insight. It homes in on diaper purchases as a signal for young parents and discovers a curious correlation: many diaper purchases are accompanied by purchases of pill organizers, denture cream, and senior vitamins.
To refine the analysis, the team enriches the AI model with location-based demographic data pulled from GIS. To each customer address, the AI model adds hundreds of data points about the demographic characteristics of the surrounding neighborhood — average household income, family composition, marital status, hobbies, languages spoken, and recreational preferences.
Combing through that location-enriched big data, the AI algorithm reveals something executives hadn’t expected. At many of the company’s stores, young parents from the surrounding area live in multigenerational homes. And, as it turns out, the grandparents are doing most of the shopping.
The AI model helped executives adjust plans for marketing, merchandizing, and community outreach before they spent millions targeting the wrong demographic. And it did so by using the three traits that make AI a valuable tool for augmenting the human workforce, according to the consultants at PwC:
Automating complex business processes
Spotting patterns in historical data that lead to business value
Providing insight that strengthens human decisions
Business Strategy: Who Oversees AI — CXOs or LOB Managers?
Considering AI’s expected business impacts and the fact that 93 percent of organizations are already investing in the technology, it’s worth asking where artificial intelligence should live in the organization, and who should be responsible for it. There may be no simple answer, but those with a ringside seat for AI’s emergence have some suggestions.
“When it involves the data that a company uses and the way that decisions are made, AI requires top-down vision and investment,” Menon says.
Sirosh agrees. “Where we have found dramatic wins related to AI, the CEO had a vision of how to transform the organization toward creative work and away from old-economy and labor-intensive processes, or to create new customer experiences and business models. That vision was much more cohesive and integrative than what would have bubbled up” from the lines of business, he says.
AI Need Not Apply — Business Processes Untouched by AI
Despite the sense that AI is sweeping through every function of business, some remain AI free, according to Joseph Sirosh, corporate vice president of artificial intelligence and research at Microsoft. “For example, engineering and physics are incredibly well-developed mathematical sciences, and we are going to make tremendous progress in those areas. That will include breakthroughs in quantum computing and other disciplines. Those are all areas that are just core scientific and engineering work. AI doesn’t encompass all of that, although it may help amplify some of this work.”
Using AI to move companies away from labor-intensive processes will likely have profound effects on the workforce. McKinsey researchers assert that 45 percent of activities in today’s workforce could be automated — whether through AI or other means. And when natural-language processing — a form of AI — reaches the median level of human capability, another 13 percent of jobs could be on the block.
C-level executives will need to find an effective balance. Writing about the C-level challenges of AI, McKinsey senior partners Jacques Bughin and Eric Hazan note that measurable ROI typically comes only when AI is laced into a business’s culture and workflows. That in itself is a sizable feat, the partners say, possible only with the guidance of company leaders.
“When companies are looking to do fundamental digital transformations and reinvention of the business,” Sirosh says, “there is incredible value in having top-down guidance drive much of that activity.”
Workforce shifts and workflow transformation aside, Sirosh and Menon advise concerned executives to focus on the foundation of AI. The goal of such a sophisticated technology, they say, is rather simplistic.
AI, informed by location data, helps organizations reason and interact with the increasingly sophisticated world around us,” Sirosh says.
“If I had to put it in one term,” Menon adds, “AI is basically about decision-making — smarter decision making.”
(Listen to a podcast featuring Joseph Sirosh to explore this concept in more depth, including a look at how AI is changing business models.)
Marianna Kantor joined Esri as chief marketing officer in 2015. Prior to Esri, Marianna was the VP of Marketing at PTC, where she built the worldwide services marketing and field-enablement organization, helping drive sustained revenue growth in dynamic and changing markets. Marianna has held technology and marketing leadership positions throughout her career in leading organizations such as AT&T, Akamai, and Los Alamos National Labs. At Esri, Marianna is exposing and amplifying the transformational capabilities of geospatial technology as an indispensable tool for problem solving and decision making in business and government. Marianna holds two engineering degrees from Columbia University and University of Pennsylvania, and an Executive MBA from MIT.  As Esri’s chief technology officer, Jay Theodore guides the long-term vision for the ArcGIS platform. Jay is passionate about harnessing innovative ideas to increase the value companies gain from location intelligence, geoscience, computer science, and technology. He takes great pride in working with outstanding software developers, architects, and product engineers. Jay earned a master’s degree in computer science from Florida Institute of Technology, where his research focused on finite element analysis and modeling (FEA/FEM), computer graphics, and composite structure design for Space Station Freedom. He also holds a bachelor’s degree in computer engineering.
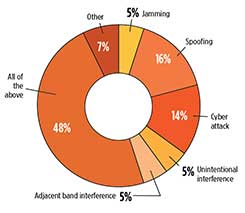
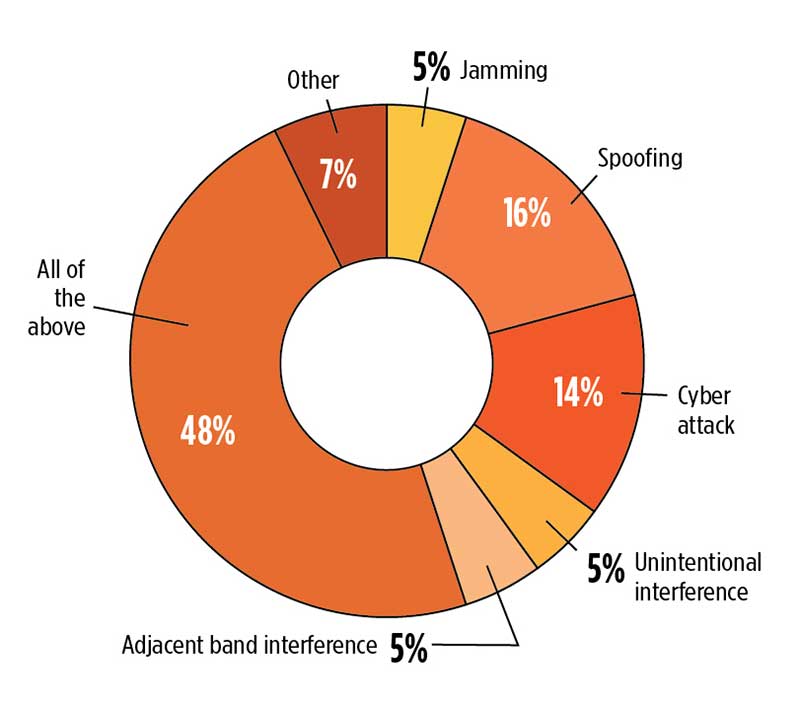

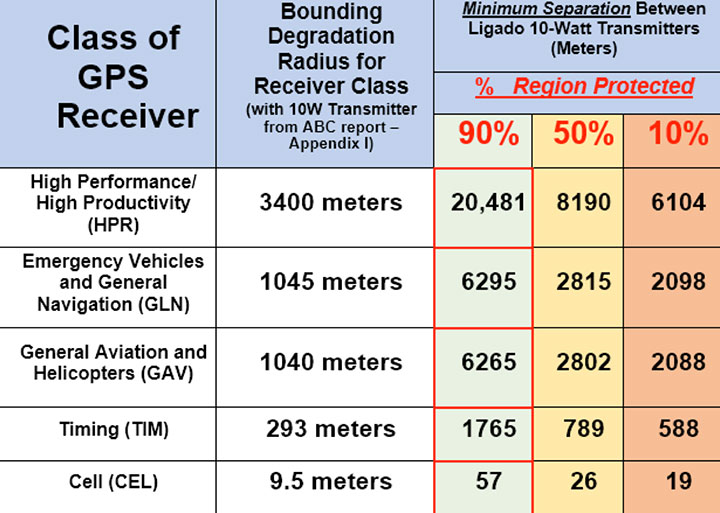


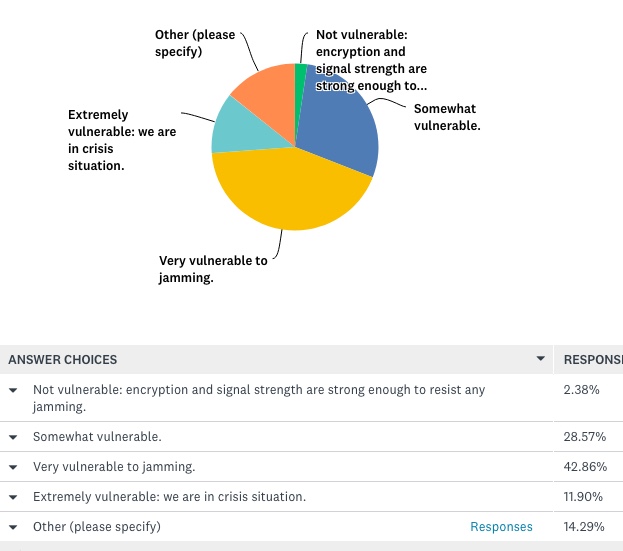
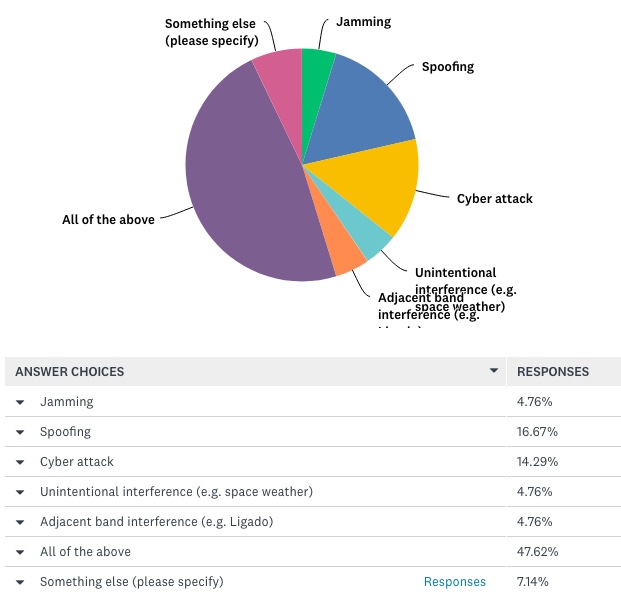

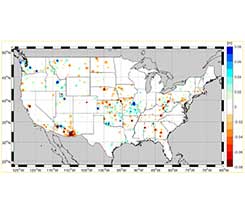
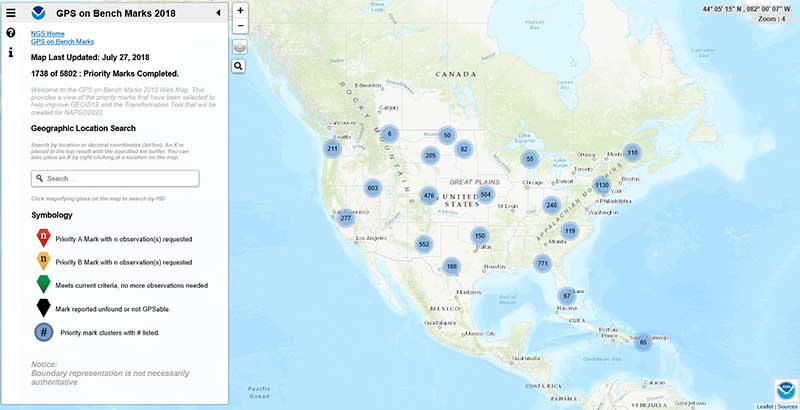
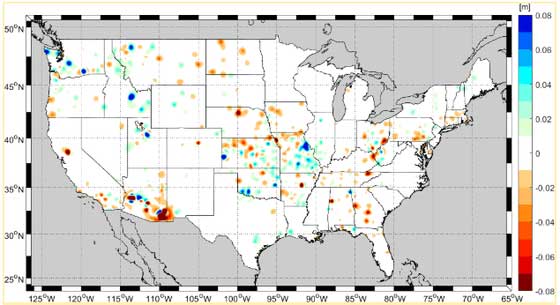
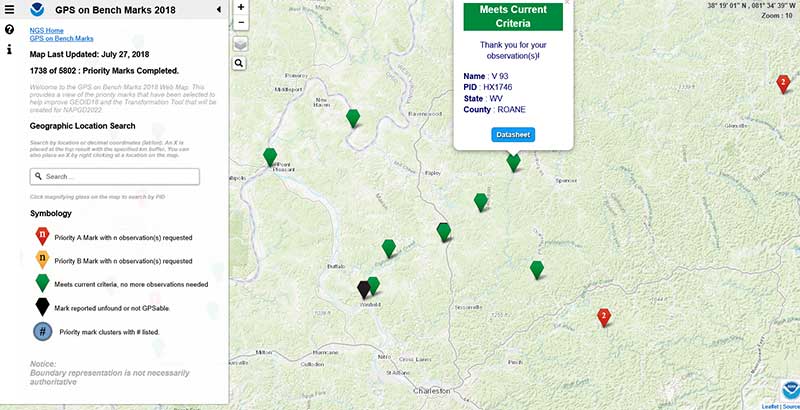
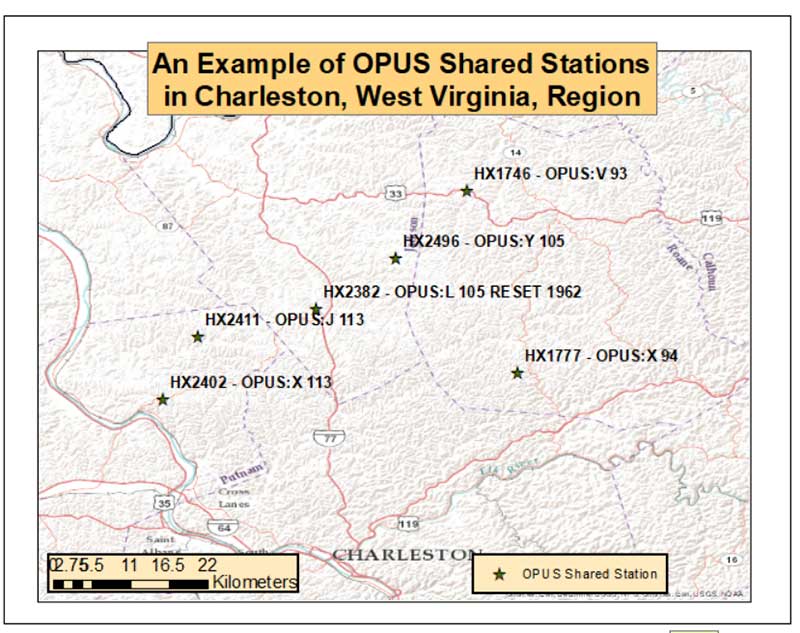
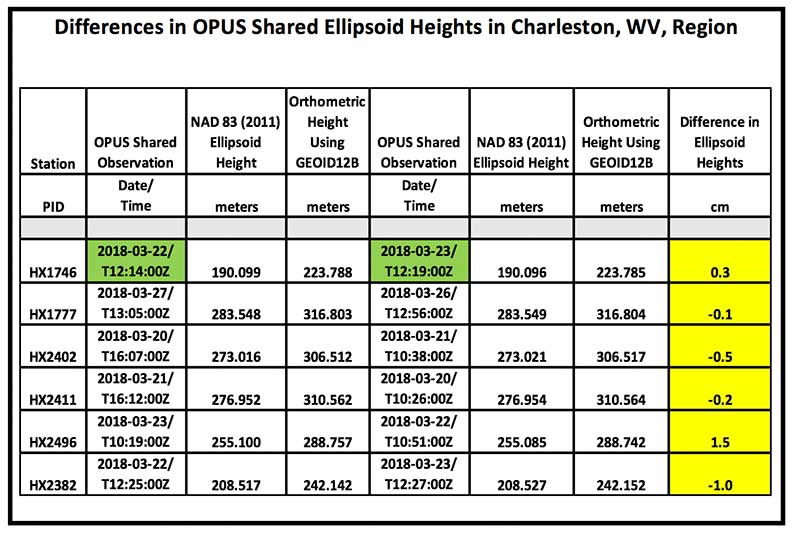
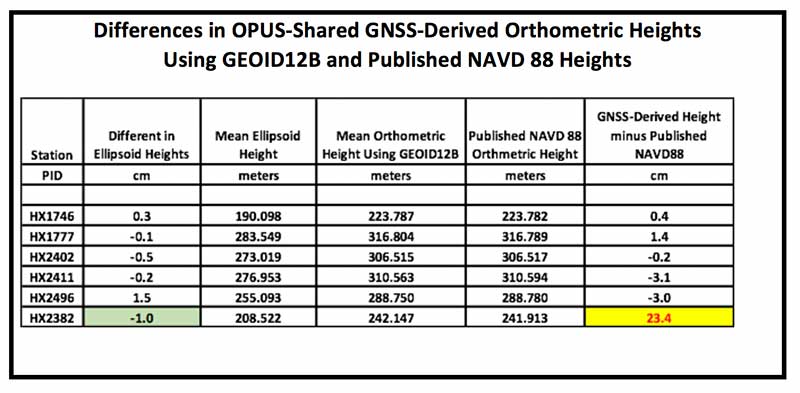
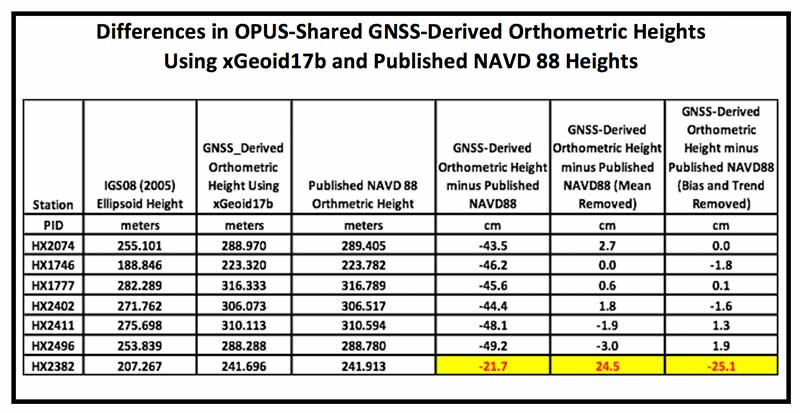
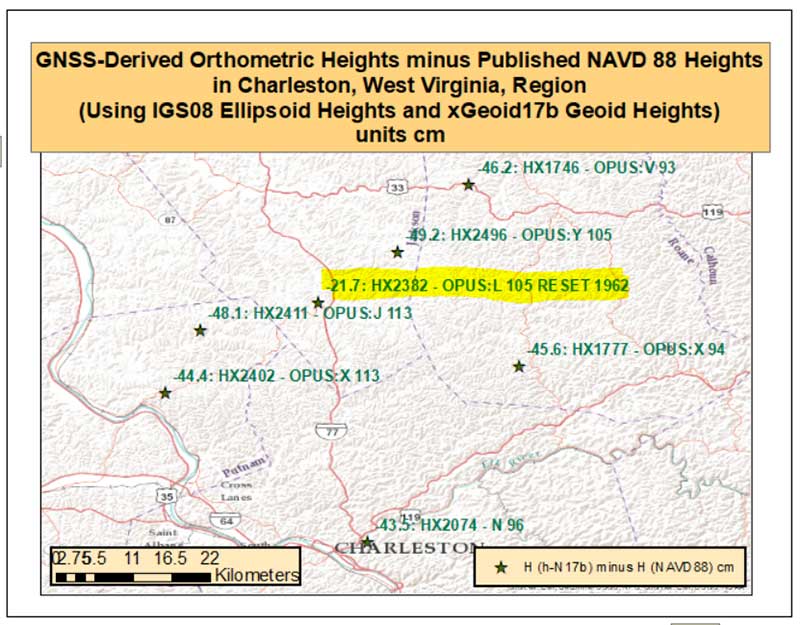
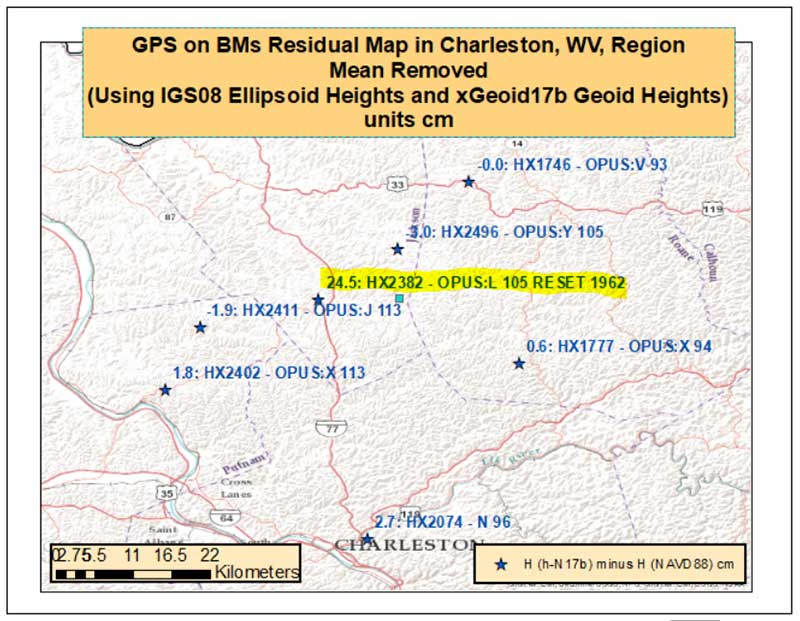
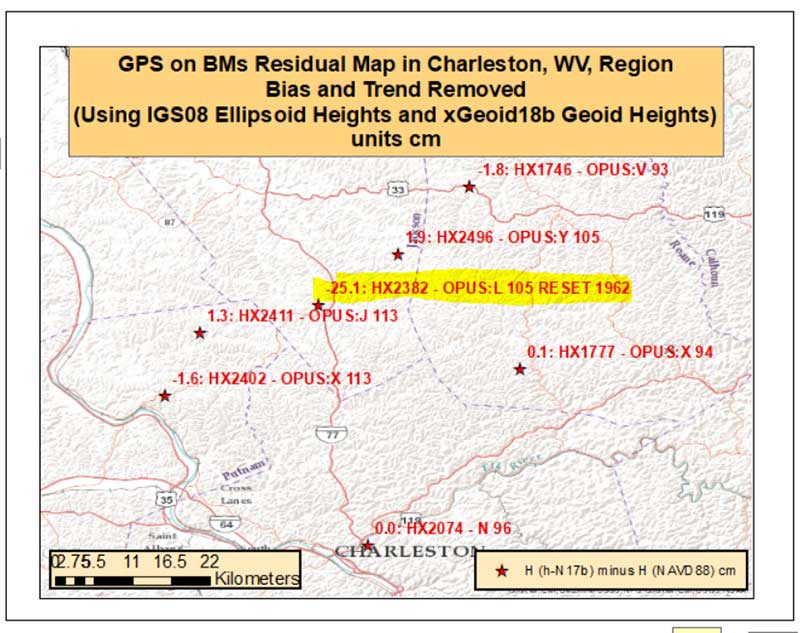

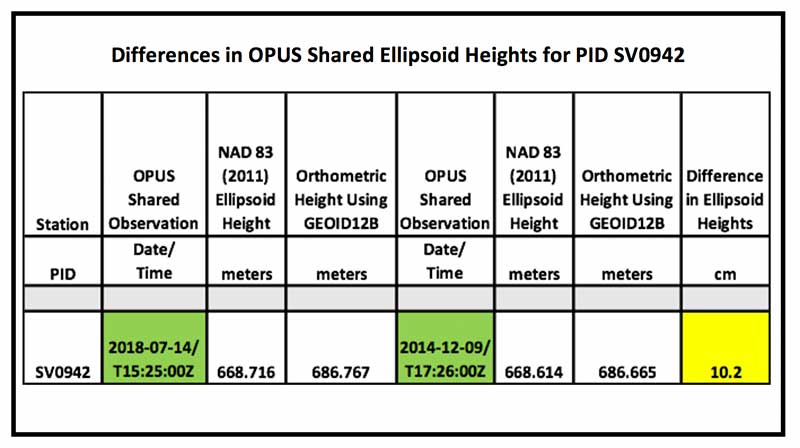
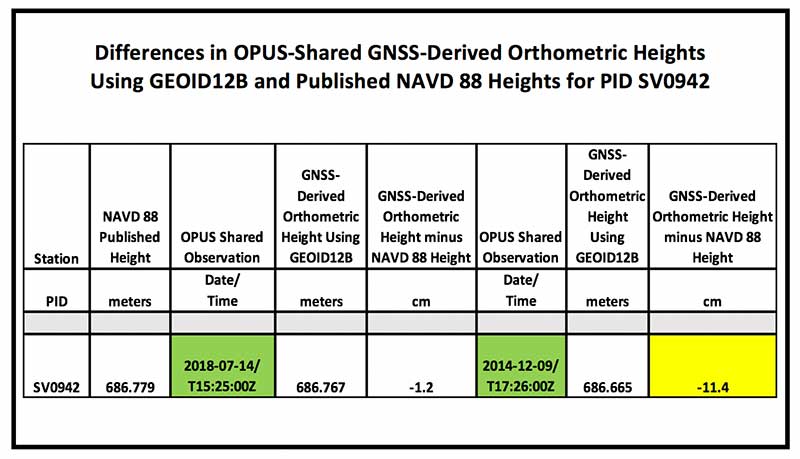
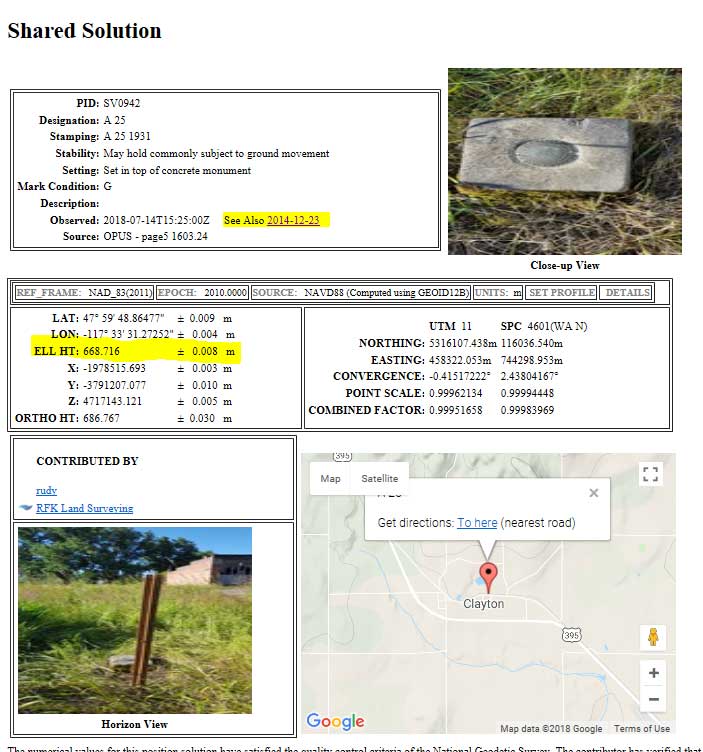
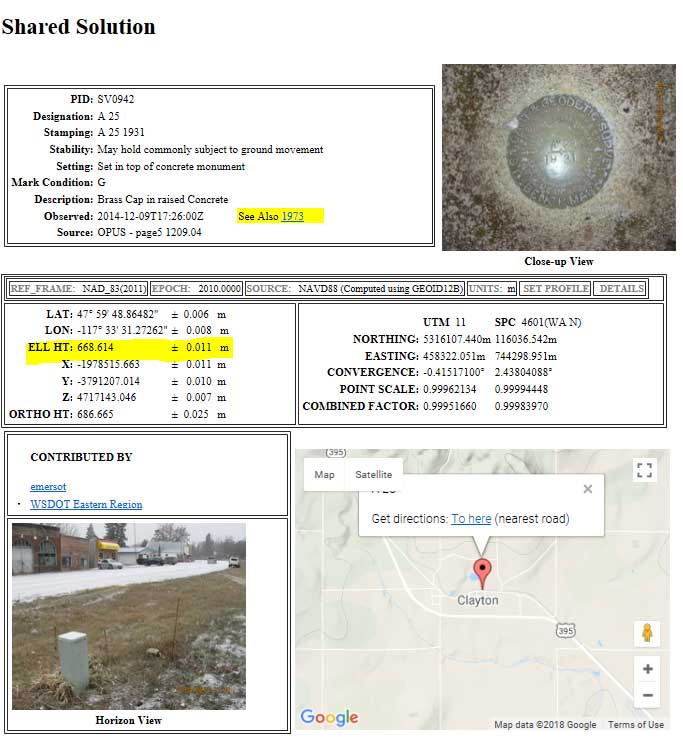
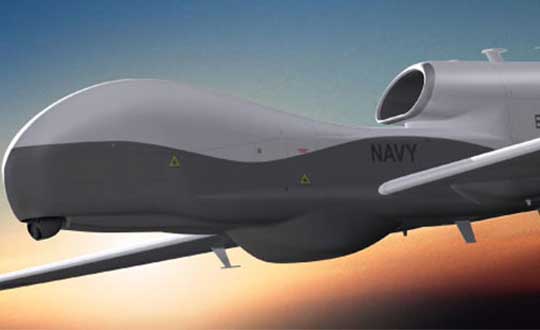


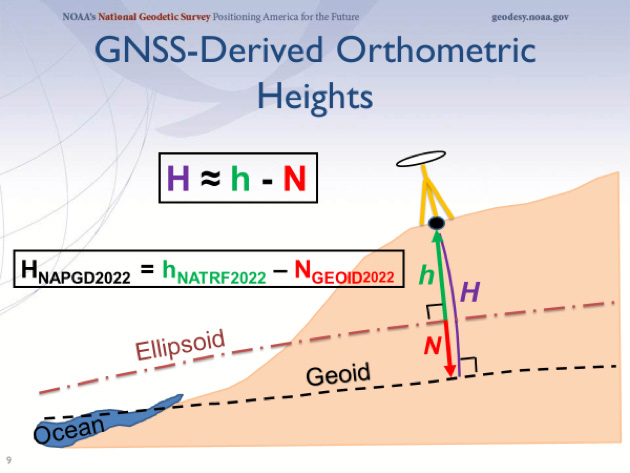


 Marianna Kantor joined Esri as chief marketing officer in 2015. Prior to Esri, Marianna was the VP of Marketing at PTC, where she built the worldwide services marketing and field-enablement organization, helping drive sustained revenue growth in dynamic and changing markets. Marianna has held technology and marketing leadership positions throughout her career in leading organizations such as AT&T, Akamai, and Los Alamos National Labs. At Esri, Marianna is exposing and amplifying the transformational capabilities of geospatial technology as an indispensable tool for problem solving and decision making in business and government. Marianna holds two engineering degrees from Columbia University and University of Pennsylvania, and an Executive MBA from MIT.
 As Esri’s chief technology officer, Jay Theodore guides the long-term vision for the ArcGIS platform. Jay is passionate about harnessing innovative ideas to increase the value companies gain from location intelligence, geoscience, computer science, and technology. He takes great pride in working with outstanding software developers, architects, and product engineers. Jay earned a master’s degree in computer science from Florida Institute of Technology, where his research focused on finite element analysis and modeling (FEA/FEM), computer graphics, and composite structure design for Space Station Freedom. He also holds a bachelor’s degree in computer engineering.