This month’s column deals with two troublesome topics: the U.S. government’s over-reliance on GPS, and the potential costs of GPS disruption toward which such a policy may be leading us.
First things first.
When someone utters the words “I’m nearly perfect,” get on your toes. Such self-appraisal usually masks something. It could be insecurity, denial, ignorance or simply fear. At the very least, some level of illusion, if not delusion, is involved.
The press release actually says, “The U.S. Air Force released two technical reports demonstrating that the Global Positioning System (GPS) continues to deliver exceptional performance to civilian users around the world….The 2014 and 2015 performance reports confirm that the GPS Standard Positioning Service (SPS) satisfied nearly all measurable performance commitments documented in the GPS SPS Performance Standard.”
Fair enough. Those are demonstrable facts. Nowhere does the release — other than in its headline — employ the words “perfect” or “near-perfect.”
The problem is, as current events repeatedly show, people remember only the headline. That may be all that they read or register in the first place.
Affixing the label “near-perfect” to GPS is “potentially dangerous,” points out Dana Goward of the Resilient PNT Foundation, “because it could exacerbate the public’s growing over-reliance on, and often blind faith in, GPS. Even if GPS did always perform perfectly, all kinds of things can happen to signals after they leave the satellites and before they get to receivers. Personal privacy devices, other jammers, spoofers, solar activity, other electromagnetic interference, even the local geography can significantly degrade or disable a receiver’s performance. That’s why in the GPS System Performance Standard the Air Force specifically says its responsibility ends once signals are in space.”
Perfection might exist in space, but it doesn’t down here.
Even in space, accidents sure will happen. The Air Force release documents GPS performance for 2014 and 2015. This conveniently draws up short of January 2016, when several GPS satellites broadcast a timing error that triggered equipment faults and failures globally for nearly 12 hours. Thus demonstrating something far from perfection.
Issuing a statement in the manner done on June 16 perpetuates a dangerous myth, keeps users in the dark about the actual state of affairs, cultivates a What-Me-Worry? approach to positioning, navigation and timing, and abets the lack of political will and understanding of GNSS vulnerabilities.
We have expanded the focus of this magazine to cover other technologies relevant and applicable to the field precisely because GPS, and by extension GNSS, great though they may be, are not perfect. Not even nearly.
At What Cost Ignorance?
A report recently compiled and released in the UK attempts to quantify the cost of a GNSS disruption, should one occur. The figure the authors came up with? 1 billion pounds sterling per day. That’s approximately $1,273,710,000.
Per day.
The report, available in either 11-page or 133-page versions, and titled The economic impact to the UK of a disruption to GNSS, looks at what would happen to the UK economy if GNSS were unavailable for five days. Five days is, indeed, a long time. One hopes that a fix could be obtained in less than that amount of time. But one never knows, does one?
“The economic impact to the UK of a five-day disruption to GNSS has been estimated at £5.2bn.” Thus the per diem figure above.
The report was commissioned by Innovate UK, the UK Space Agency and the Royal Institute of Navigation. It followed from the January 2016 accident referenced earlier, in which an error in the GPS signal from certain satellites, triggered by the decommissioning of one of those satellites, brought a number of key industrial servers to their knees. The episode lasted 12 hours.
This report hypothesizes a more fleshed-out disaster and estimates the likely impact of a disruption to GNSS availability for up to five days across ten application domains in the UK: Road, Rail, Aviation, Maritime, Food, Emergency and Justice Services, Surveying, Location-Based Services (LBS), Other Infrastructure, and Other Applications.
The report is worth reading, not only for its figures, methodology, and discussion of mitigation, but also for two salient pages: “A day in the UK with GNSS” and “A day in the UK without GNSS.” At home, on the move, with others, at work, at the shops, when things go wrong, back at home. A post-modern (or post-Beatles) “Day in the Life.”
Even if the hypothetical disruption were not to last 5 days, but a much shorter period, perusing the two chronologies of with and without can serve to remind us how many of our daily activities are keyed to and thus dependent on GPS/GNSS.
Having no viable, working back-up — not even on the visible horizon — to such an essential system makes sense how?
It’s been a few months since I’ve published a GSS Monthly newsletter column. What a busy few months it has been. It’s been all about UAVs, high-precision GNSS projects and GIS, with some conferences and workshops sprinkled in between. High-accuracy GNSS technology and UAV technology are hot trends— red hot.
UAVs: Prosumer and mapping on a slope
Obviously, consumer UAVs have exploded in the mainstream consumer electronics market during the past five years. Since the FAA began requiring UAVs to be registered in late 2015, far more UAVs have been registered (~700,000 to date) with the FAA than manned aircraft (~320,000).
In fact, the number of registered UAVs aircraft eclipsed registered manned aircraft more than a year ago! The FAA reported that at any one point during the day, there are ~7,000 manned aircraft flying in the U.S. airspace. That begs the question, how many UAVs are flying above our heads at any one point in time? No one can answer that question.
On the coattails of consumer UAVs in mainstream America is the use of UAVs in the USA’s commercial world. Since the FAA opened the floodgates in August 2016 to allow almost anyone to fly UAVs for business ($150 and answer 42 out of 60 questions correctly), lots and lots of companies are buying inexpensive “prosumer” UAVs and extracting tremendous value from them.
Prosumer electronics is equipment and software targeted at the consumer market but also good enough to be used for business. The UAV market is a perfect example of this. DJI, by far the biggest UAV manufacturer in the world at $1B+ in annual revenue, targets the mainstream consumer market and sells a huge number of low-, medium- and high-end UAVs to businesses. Think about it: You can buy a DJI Phantom 4 Pro at your local Apple Store and the next day be generating one-foot elevation contours on a project site!
Following is an example of a papermill I flew a few weeks ago. I flew it in less than one hour (50 acres), generated an orthophoto with 2.4-cm/pixel resolution and a digital elevation model (DEM) with 4.79-cm/pixel resolution.
Figure 1. 2.4-cm/pixel resolution orthophoto, 50 acres.Figure 2. DEM with 4.79-cm/pixel resolution of the same flight.Figure 3. Zoomed-in image of the same DEM.
The detailed data above, generated from a $1,500 UAV, is clearly outstanding. By the way, the purpose of the project was to determine the volume of the various stockpiles, which I’ve not computed yet. But if the volume calcs are close enough to the traditional terrestrial-based measuring methods, the UAV return on investment (ROI) argument will be hard to beat.
It takes ~14 hours each month to measure all the stockpiles on this site using traditional terrestrial measurement tools. Also, the measurements must be taken on the weekend when the site activity is minimal. It took less than one hour to fly the entire site, and I flew it twice (one time west-east direction at 80/80 overlap and one time north-south at 70/70 overlap) to make sure I had enough data. I mean, seriously, I drove 1.5 hours to the site. Why not spend another 20 minutes to fly it in a perpendicular direction?
To date, I’ve only flown relatively flat sites such as construction sites, agricultural fields, and industrial sites. That was until a couple of weeks ago. While I’ve become pretty comfortable at flying open and relatively flat sites over the past 18 months, I’ve not ventured into flying a site with a lot of elevation changes and tree canopy. I finally did that earlier this month, and it was both challenging and rewarding. There are a few problems on sites with major elevation changes and tall tree canopy:
A. Maintaining visual line of sight (VLOS) as required by the FAA.
B. Flying in such a manner that the image-processing software has good quality data to work with so you can generate the products you need.
The mission planning/control software plays a very important roll in this process. Well, it always does, but it really does in this case. Typically, the mission planning/control folks want you to fly at a consistent height above the ground so your overlap is consistent. This is very difficult to accomplish if you’re flying a site with a lot of elevation change. In that case, they typically tell you to launch from the highest (or nearly the highest) elevation point and fly at that elevation.
The problem this causes is that you could end up flying 500, 600 or 700 feet above ground level (AGL). For example, if you are flying a site with 500 feet of elevation change and you instruct the mission planning/control software to fly at 350 feet AGL, at some point in the project the UAV will be at 850 feet AGL. That can be a problem from both a regulatory standpoint (FAA allows UAV flights up to 400 feet AGL) and an image-processing standpoint.
Fortunately, the mission planning/control software I use just introduced a Terrain Awareness feature. It uses SRTM (Shuttle Radar Topography Mission) elevation data. Granted, it’s 30-meter pixel elevation data, so each elevation block is 30 meters x 30 meters, so I really wondered if the resolution was high enough. The site I was going to fly was only 60 acres in size and had 550 feet of elevation change. Note that the trees on the site had already been harvested, so the land was relatively clear. There’s about a 550-foot difference from the projected launch point (purple dot) to the northern and western end of the site. Following is the mission plan for the site I was planning to fly.
Figure 4. 60-acre site with ~550 feet of elevation change.
To give you an idea of the slope, the solid red lines in the following image are 100-foot elevation contour lines. The green triangle is the projected UAV launch point. This was a great launch point because I could see the entire site and maintain VLOS.
Figure 5. Site topo with projected UAV launch point.
I chose to fly the mission at 300 feet AGL. I figured it would be high enough if there was some “slop” in the SRTM elevation model. Still, I was concerned about the resolution of the SRTM data because at 300 feet AGL, my UAV would be flying below the launch elevation due to the extreme elevation slope on the site. Remember, the Terrain Awareness feature of the mission planning/control software is based on the SRTM elevation data, and not based on any sensors in the UAV itself — if the SRTM elevation data was incorrect, my UAV might crash into the ground.
Following is the SRTM elevation data along with the flight path data displayed in the mission planning/control software.
Figure 6. The projected UAV flight path based on the SRTM elevation data.
The moment of truth came when I launched the UAV from the start point (purple dot) and watched it rise to 300 feet AGL to start its mission. The first few swaths were uneventful. After that, it started to fly into the canyon, following the terrain as programmed, then rise up from the canyon during each pass. It was a thing of beauty to watch.
Unfortunately, about 70% of the way through the mission, it started raining, so we called it quits. However, we proved that at least on the four sites I flew that day, the SRTM data and Terrain Awareness feature were effective in collecting data in steep-slope environments. Following is the 2.69-cm/pixel orthophoto generated from the flight. Note the tracks where the logging rigs pulled the logs up the steep slope.
Figure 7. 2.69-cm/pixel resolution orthophoto.
Following is a zoomed-in view of the UAV launch site.
Figure 8. Zoomed-in view of the orthophoto.
Following is an image of the 5.37-cm/pixel DEM generated from the flight data. Notice the logging tracks.
Figure 9. 5.7-cm/pixel image of the DEM generated from the flight data.
Following is a zoomed in view of the 5.37-cm/pixel DEM image.
Figure 10. Zoomed-in 5.37-cm DEM image of UAV launch point.
The mission was successful in proving that SRTM elevation data was sufficient enough to fly a mission with a dynamic AGL. It handled the steep slopes by maintaining a sufficient AGL elevation as I hoped it would despite only having 30-meter x 30-meter block elevation resolution. The image processing software seemed to like the UAV data, as you can see from the results above. I didn’t have to spend any additional processing time over and above what I usually spend in order to generate these products.
I did experience a hiccup with the mission planning/control software running on my iPad Mini 2. It turns out that the Terrain Awareness feature in my mission planning/control software requires some extra CPU horsepower — the software overpowered my iPad Mini and crashed once during a mission. The UAV kept flying its intended course as instructed, but it stopped taking photos when the software crashed, so I brought it back to the launch point.
After visiting the software vendor’s website, it became clear to me that it’s probably time to upgrade my iPad Mini to the latest model to keep up with the new features being implemented in the software.
A Quick Note on High-Accuracy GNSS
In March, I attended the Hawaii GIS conference and decided to perform some benchmark testing on a survey mark using WAAS and a high-accuracy GNSS receiver.
My goal was two-fold.
See how WAAS is behaving in Hawaii. WAAS in Hawaii is an anomaly because it’s far away from the Continental U.S. (CONUS) where all the WAAS reference stations are located (there’s one in Honolulu, but that’s it). In other words, Hawaii is the most challenging place for WAAS accuracy in North America.
See how many GNSS satellites I could track and use in Hawaii.
Holy moly, was I surprised at how good it was. I’ve tested WAAS in Hawaii several times in the past many years. The last time I tested it was in 2013 and the GNSS receiver I used (GPS + GLONASS) achieved a steady 80-cm accuracy. That was pretty darned good for WAAS in Hawaii at that time.
I packed up some receivers and hiked about 4 miles to a survey mark I could find in Honolulu. I was a great survey mark for testing because it was on the sidewalk of a quiet residential street. Following is a photo of the survey mark.
Figure 11. PID DK4162 survey mark in Honolulu.
I set up on the survey mark and then looked at the satellites the receiver was tracking. I wanted to know how many GPS, GLONASS, Galileo and BeiDou satellites were being used. Following is a screen shot.
Figure 12. Total number of GNSS satellites being used – 23.
Twenty-three GNSS satellites being used! Are you kidding me? This is more than double the number of GPS satellites being used. This illustrates the power of four-constellation GNSS that is only going to continue to get better over the next several years.
What surprised me the most was the number of Galileo satellites being used, and this was before two Galileo satellites were declared healthy in late May.
My next test was to evaluate WAAS accuracy. Who cares how many satellites the receiver is using if the accuracy isn’t improved? I plumbed the receiver antenna on the survey mark and plotted ~7 minutes of data.
Figure 13. Accuracy plot compared to the DK4162 survey mark coordinates.
Yep, that’s about 30-cm accuracy over a 7-minute period. That’s better by a factor of two compared to the accuracy I saw in 2013. Sure, WAAS has improved somewhat, and maybe the ionosphere was particularly happy that day, but I have to believe that the additional GNSS satellites contributed the most to the improvement in accuracy. In the next few months, I’m going to be performing more tests with WAAS and RTK on my GNSS test course near my office. I’ll keep you posted on the results of those tests.
The Esri International User Conference – July 10-14
As usual, I’ll be attending the largest gathering of GIS professionals in the U.S. next month, the Esri International User Conference. 16,000 of our colleagues will descend upon San Diego to share, network and enjoy the spatialness that we have for one another.
If you’re interested, I’m giving a couple of presentations at the Esri UC:
Tuesday (July 11), 08:30 a.m., Room 28B (subject to change)
Paper Title: An Efficient, Accuracy Mobile GIS Workflow using RTK GNSS
Session Title: Mobile Data Collection
This is cool project I worked on with WaterOne, a large water utility, to design a real-time, high-accuracy GNSS workflow in the Esri environment. They are collecting data at the centimeter level for mapping their above-ground assets as well as new construction using tablet computers and RTK GNSS receivers.
Thursday (July 13), 8:30 a.m., Room 29C (subject to change)
Paper Title: UAV (drone) applications for water utilities
Session Title: Applied GIS: Three Unique Examples
This is some groundbreaking work I’ve done with American Water on using UAV technology for mapping and inspection. We did a lot of experimenting during the proof-of-concept phase to figure out what applications are practical and which aren’t.
Most UAVs now come with GNSS as the principle sensor for guidance, often with inertial aiding. And high-precision GNSS on a drone enables much quicker high-precision surveying — unless signal interference disrupts things and spoils your day.
Septentrio is now fielding two high-precision receivers that can overcome a good proportion of most common interference. AsteRx4 and AsteRx-m2 receivers, equipped with AIM+, can not only overcome common (but illegal) chirp jammers (which can virtually blot out L1 GNSS signals), but also have a spectrum plotting capability. This spectrum plot can visualize potential onboard interference sources during integration, and help identify onboard jammers.
GoPro Hero 2 camera pick-up monitored by an AsteRx4 receiver
The GPS L1-band spectrum above has been disturbed by a GoPro camera installed without sufficient shielding on a quadcopter close to the GNSS antenna. The three peaks indicate harmonics of 24 MHz — the typical frequency for a MMC/SD logging interface. This problem was fixed in the lab by adding a shielded enclosure for the camera.
Although chirp jammers only transmit at around 10 mW, they are powerful enough to block GNSS signals over several hundred meters on the ground. A UAV is much more vulnerable in the air as jamming signals travel further, without line-of-sight blockage from trees, buildings or other obstacles.
The figure above illustrates how a 10-mW chirp jammer disrupts RTK positioning 1 km away in a high-end receiver. Even a low-end, less accurate and less sensitive consumer-grade L1 receiver loses positioning over several hundred meters. But with AIM+ activated, the AsteRx4 maintains an RTK fix throughout the (simulated) flight and shows no degradation in position.
So, there are two benefits to using these Septentrio receivers on a drone — less likelihood of losing positioning capability from intentional jamming while airborne, and a built-in spectrum plotter.
Tethered Drones
We ran an article recently relating that the U.S. military was interested in tethered drone systems, presumably for short-range reconnaissance. Hard to understand why you might want to intentionally limit the operating range of a drone, but with power supplied from the ground, much longer mission endurance may also have advantages for certain civilian applications too. For instance, inspection of power plants, refinery stacks, on-shore and off-shore oil rigs and other such fixed-location critical installations may benefit from long duration capability, while tethered flight should still allow travel over the whole inspection area.
Well, these same guys — Drone Aviation — just figured out how to adapt DJI Inspire drones to add a tether system. With a massive share of the commercial small drone market, DJI drones are the most common sUAV used in many civilian applications.
So now realtors wanting detailed listing videos, news media, maintenance and insurance people inspecting tall buildings or bridges, and many others in the oil and gas industry, no longer need to worry about losing power during lengthy visual data collection. Maybe in exchange, management of how the tether locates during an inspection may become a concern, but the longer endurance trade-off may also be worthwhile for a lot of applications.
FUSE system.
The Drone Aviation FUSE system comes with a customized power pack and an “automated smart tension control winch case” with 200 feet of tether, and uses 110-volt ground power — which works well when supplied by a portable field generator.
NASA Tests UAV Traffic Management
In the meantime as small drone use increases, including overnight shipping companies who continue to pursue ways to make package delivery by drones in ways acceptable to the FAA, the looming crisis in UAV airspace traffic management (UTM) is getting a lot of attention.
NASA has been cooperating with FAA for some time to investigate potential systems for low altitude drone traffic management, and recently concluded field tests at six FAA test sites across the U.S.
The three-week campaign, known as the Technology Capability Level 2 (TCL2) National Campaign, has focused on flying small drones well beyond the pilot’s visual line of sight over sparsely populated areas at these test sites. Operational test scenarios have included simulation of package deliveries, agricultural surveys, search and rescue, railway inspections and video surveillance operations.
NASA has signed up over 100 industry, academic and government partners for this UTM effort, who are collaborating together, sharing data and using their own resources for this investigation. Companies who are participating and who may have significant interest in the outcome of these tests are planning to fly drones in the national airspace for package and food deliveries, bridge, power line and rail inspections, and agricultural purposes — these include Amazon, Google, Intel, Flirtey, Drone America, Carbon Autonomous and NUAIR.
NASA is currently assessing the data gathered during these recent tests, but plans are already in place for the next phase of tests — flying drones in denser traffic over more populated areas and also determining UAV/UTM responses to larger manned aircraft.
And in related activities elsewhere, at AUVSI XPONENTIAL in Dallas last month the International Civil Aviation Organization (ICAO), an agency of the United Nations that coordinates aircraft operations between member countries around the world, announced a Request for Information (RFI) on UTM systems. The intent of the RFI is to advance international progress towards worldwide UTM adoption by first gathering the best ideas from governments and industry.
BVLOS Demonstration in France
In an effort to demonstrate practical, readily implemented Beyond Visual Line Of Sight (BVLOS) drone operations in France, Delair-Tech recently flew a UAV for 30 miles, simulating powerline inspection. Delair used a regular, commercial 3G cell-phone network to control the drone for this test – an innovative demonstration that long-distance drone operations can be safe and simple to achieve.
Delair drone inspects powerlines in France.
Delair-Tech acquired Gatewing — which was previously owned by Trimble — in 2016 and has also signed strategical distribution agreements with Trimble. The business not only includes the manufacture, turn-key operation and support of drones, but also includes data analysis and reporting. And in a sign that commercial drone operations are becoming more commonplace in France, and that there is likely a preference for local suppliers, the purchasing conduit for government agencies across the country has selected the Delair DT18 and DT26X as the choice for French government agencies purchasing fixed-wing unmanned aerial vehicles.
Unmanned Space Plane?
DARPA recently selected Boeing to complete advanced design work for the Experimental Spaceplane (XS-1) program — a new class of hypersonic aircraft aimed at rapid turn-round, low-cost access to space.
Artist’s concept of the space-plane.
The XS-1 program is expected to create a reusable unmanned aircraft, around the size of a business jet, which would take off vertically like a rocket and fly at hypersonic speeds. The vehicle would fly to a high suborbital altitude and release an expendable upper stage, deploying a 3,000-pound satellite to polar orbit. The reusable space plane would then return and land horizontally and — this is a key requirement for the program — be prepared for the next flight within hours or a few days.
The XS-1 technology demonstration will therefore aim to fly 10 times in 10 days, with the final flight carrying the upper-stage payload delivery system. Its hoped the program will promote a commercially offered service with costs as low as $5 million or less per launch — a small fraction of the cost of today’s launch systems. The XS-1 technology demonstrator’s propulsion system will be an Aerojet Rocketdyne AR-22 engine, a version of the Space Shuttle’s main engine, which would be fired on the ground 10 times in 10 days to demonstrate propulsion readiness for flight tests.
Phase 3 objectives include 12 to 15 flight tests, currently scheduled for 2020. After multiple shakedown flights to reduce risk, the XS-1 will to fly 10 times over 10 consecutive days, at first without payloads at speeds as fast as Mach 5. Subsequent flights are planned to fly as fast as Mach 10, and deliver 900lb to 3,000lb payloads into low Earth orbit.
So, high-end receivers to help deal with both external and internal jamming, tethers for DJI drones enabling longer inspection flight capability, NASA testing and industry collaboration towards an air traffic system for drones, long-range drone operations using 3G cellular networks in France, and even a research program to develop an unmanned space plane — nothing ever stands still in the ever-evolving world of unmanned aircraft.
In my April column, I introduced the basic concepts behind GPS anti-jam technology, along with a bit of history around its evolution. I knew this was a popular topic, but I didn’t anticipate the enormous amount of positive correspondence I’ve received since, including many inquiries about where to buy this technology and who is entitled to have it.
So this month we return to the controlled reception pattern antenna (CRPA) topic, to look specifically at the major suppliers of GNSS anti-jam technology in a bid to help you select the best fit for your requirements.
As mentioned in April, CRPAs can trace their roots back to military radar developments in the 1970s and 1980s. It’s no surprise, then, that the main players in the CRPA market tend to be large defense primes. But there are many smaller companies, universities and research institutions that also play in the CRPA arena these days.
What about export?
When GNSS jamming was a little-known military problem, the situation was simple: anti-jam was a military technology for military applications only. Later, as GPS evolved into a dual-use technology, critical infrastructure and civilian applications brought a new demand for anti-jam in non-military domains.
Confusion then abounded about who exactly is entitled to make use of anti-jam technology. There are two distinct factors here: security classification, and export control. Let’s clear these up.
Security classification is simple: If a product is classified, it is only available to customers who hold the appropriate level of security clearance. Usually it is the performance and vulnerabilities of a product that would attract a classified status. As you might expect for in-service military products, the military would not wish everyone to know the performance and weaknesses of its deployed technology. This is why many datasheets for CRPAs omit performance information.
The second issue is export control. This, of course, varies by country. In the U.S., a CRPA developed towards a defense program is likely to have International Traffic in Arms Regulations (ITAR) restrictions attached to it. In Canada, CRPAs are subject to the Controlled Goods Program. In the UK, CRPAs sit on the “dual-use” export control list, which recognizes that CRPAs have both military and non-military application. An export license is usually required.
Before I go any further, a little disclaimer: I am not making any product recommendations in this article. There are many things to consider when choosing anti-jam technology, and you should always consult a navigation warfare expert and carry out appropriate evaluations prior to choosing a product. You should also seek guidance from your own government regarding any restrictions on export or import.
With that out of the way, let’s look at the offerings of a few suppliers. This is by no means a complete list, but I did manage to catch up with a few of the major players to ask them about their anti-jam technology offerings.
NovAtel
I spoke with Peter Soar, business development manager, Military and Defence, at NovAtel about NovAtel’s offerings.
Peter Soar: “The GAJT-710 series are retrofittable GPS anti-jam products that combine a seven-element controlled reception pattern antenna (CRPA) and the antenna electronics in a single unit. The GAJT-AE-N is a GPS anti-jam antenna electronics system that supports a separated four-element antenna.”
Photo: NovAtel
Photo: NovAtel
Photo: NovAtel
Main features: “All three products protect the GPS L1 and L2 bands simultaneously, and are suitable for military (SAASM) receivers as well as open-signal receivers, normal civil receivers and ‘survey grade’ receivers. The wideband design means that the units are ready for M-code. In the GAJT-710, there are seven antenna elements for up to six independent nulls on both frequencies, and the GAJT-AE-N supports four antenna elements, for up to three independent nulls. All products use space-frequency adaptive processing for increased degrees of freedom. System messages provide an indication of jamming presence, even when the nulling is defeating the jamming.”
Intended market: “GAJT-710ML is optimized for land use, while GAJT-710MS is used for maritime and littoral applications. Both types are currently in use on mobile platforms and fixed installations. The GAJT-AE-N is optimized for smaller platforms such as unmanned air vehicles, and is currently in use on a variety of platforms. GAJT products have been shipped to customers in 16 countries to date.”
Example customers: “The GAJT-700ML (a predecessor to the 710ML) was selected for trials by the Canadian Army through the Build in Canada Innovation Program, with exercises performed on the Artillery Observation Post Vehicle (LAV III OPV). Both GAJT variants were selected for field testing by the U.S. Army Communication-Electronics Research Development and Engineering Center (CERDEC) through the U.S. Army Rapid Innovation Fund. The United States Naval Observatory (USNO) selected the GAJT-710ML to satisfy a requirement at sites throughout the Department of Defense Information Network (DoDIN). The GAJT-AE-N is deployed on the Schiebel Camcopter S-100, and was also selected for testing on the M777C1 Howitzer by the Canadian Army.”
Situation with regards to export: “All GAJTs are designed and built in Canada. As such, they are subject to the Controlled Goods Program of Canada, but they are free from ITAR for non-U.S. customers.”
Raytheon UK
Some Raytheon products were mentioned briefly in the April column; I caught up with Alan Wright, business development executive, Force Protection, to get the latest information.
Alan Wright: “Raytheon UK offers a range of anti-jamming products ranging from high-performance products with multiple-element CRPAs to low size, weight and power products. Our current product lines utilize either analog or digital technologies to suit specific end-user requirements.”
Product
Image
Key Features
GAS-1
Analog technology, 7 antenna elements, switchable L1/L2 protection, minimal quiescent time delay, nulling, J/N, M-code signal bandwidth, AE/antenna integrated variant, fiber optic output variant.
Digital technology, 5 antenna elements, simultaneous L1/L2 protection, low size, weight & power, STAP, nulling, J/N, direction finding, anti-spoof, jamming flag, M-code signal bandwidth.
Landshield
Digital technology, integrated 4-element antenna, simultaneous L1/L2 protection, low size, weight and power, STAP, nulling, J/N, direction finding, anti-spoof, jamming flag, M-code signal bandwidth, switched antenna variant.
MiniGAS
Analog technology, integrated 4-element antenna, simultaneous L1/L2 protection or L1 with L2 passthrough, low size, weight and power, minimal quiescent time delay, nulling, jamming flag.
MicroGAS
Analog technology, integrated 2-element antenna, simultaneous L1/L2 protection, very low size, weight and power, minimal quiescent time delay, nulling.
Intended market: “With over 25 years’ experience, Raytheon UK is a world leader in the development, production and supply of GPS Anti-Jamming (GPS-AJ) systems to the majority of the world’s military forces (including the U.S. DoD and UK MOD), with solutions developed and certified for air, maritime and land applications. Raytheon UK has designed and manufactured in excess of 10,000 GPS anti-jam units for the worldwide market.”
Situation with regards to export: “GAS-1, ADAP and SAS are subject to U.S. ITAR restrictions. Landshield, MiniGAS and MicroGAS are free from ITAR and subject to UK export control.”
Rockwell Collins
I spoke with Al Simon, business development for navigation products/solutions, to get the latest on Rockwell Collins’ offerings. Rockwell’s portfolio includes some CRPA products aimed specifically at weapons. Al kindly provided the following table to summarize:
Product
Image
Platform
Key Features
Integrated GPS Anti-Jam System (IGAS)
Weapons (Embedded)
GPS receiver + AJ, nulling and beamforming, spatial, 20 in3, <2 lbs, up to 4 RF antenna inputs, 90+ dB J/S performance *, GPS (simultaneous L1 & L2), path to M-code
Strategic Anti-Jam Beamforming Receiver (SABR)
Weapons (Embedded)
GPS receiver + AJ, nulling and beamforming, STAP, 46 in3, <3 lbs, up to 7 RF antenna inputs, 120+ dB J/S performance*, GPS (simultaneous L1 & L2), path to M-code
NavStorm+
Weapons
Nulling, spatial, 6.9 in3, <.6 lbs, up to 5 RF antenna inputs, 20,000 G shock, 90+ dB J/S performance*, GPS (simultaneous L1 & L2), path to M-code
NavFire
Weapons
Nulling, spatial, 2 in3, <.2 lbs, 1 or 2 RF antenna inputs, 25,000 G shock, 85+ dB J/S performance*, GPS (L1 or L2), path to M-code
DIGAR-200
Airborne, Maritime, Ground
Nulling and beamforming, spatial, 218 in3, <11 lbs, up to 7 RF antenna inputs, 110+ dB J/S performance*, GPS (simultaneous L1 & L2), path to M-code
DIGAR-300
Airborne, Maritime, Ground
Nulling and beamforming, STAP/SFAP, 69 in3, <5 lbs, up to 7 RF antenna inputs, 125+ dB J/S performance *, GPS (simultaneous L1 & L2), path to M-code
Small Platform AJ (Pre-Production)
Ground, Airborne
Nulling and beamforming, STAP/SFAP, 45 in3, <3 lbs, up to 7 RF antenna inputs, 95+ dB J/S performance*, GPS (simultaneous L1 & L2), path to M-code
STAP (Space Time Adaptive Processing); SFAP (Space Frequency Adaptive Processing)
* Beamsteering mode. Actual performance is classified
Situation with regards to export: All listed products are unclassified, but are subject to U.S. ITAR restrictions.
Roke Manor Research
This column wouldn’t be complete without a few words on my own organization. Roke has been developing anti-jam CRPAs since the 1980s, but rarely offers its own products. Typically Roke develops bespoke anti-jam and anti-spoof technology for other defense organizations, including for some products already listed above. Examples of bespoke developments for more specialist markets include Gincan and the Helium antenna.
Photo: Roke
Photo: Gincan
Main features: Both these products are aimed at the commercial civilian market, but do also have defense interest. The Gincan is a very basic low-cost CRPA, with just two antenna elements. The Helium is a conical spiral design, using four antenna elements, and is primarily aimed at protecting GNSS in critical infrastructure. The Helium has excellent low-elevation performance. Both antennas feature very low latency, making them particularly suitable for timing receivers.
Intended market: The Gincan is primarily aimed at providing a basic level of anti-jam capability to the automotive mass market, including cars and trucks, but also has been adopted by some lightweight UAV platforms. The Helium is aimed directly at timing receivers for critical infrastructure, including mobile base stations, digital TV networks, stock exchange and financial institutions, and power and utility grids.
Example customers: Gincan has been delivered to 42 countries, with a mixture of commercial, defense and national security customers. Helium is a relatively new product, and is being trialed on infrastructure in two countries.
Situation with regards to export: Both products are unclassified and suitable for commercial use. They are subject to UK export control as dual-use items, and are ITAR-free.
Others
There are many other suppliers of CRPA technology — unfortunately, too many to cover in this column. Mayflower Communications offer a good range of CRPA products in the form of their NavGuard range. Some other suppliers include Cobham Antenna Systems, BAE Systems Rokar, Thales, Harris Corporation, L-3 Interstate Electronics and Lockheed Martin. I encourage you to contact these companies for the latest information if you are contemplating a CRPA product. If you’re a CRPA supplier and I’ve missed you, please feel free to post a link to your products in the comments section below.
So, that was a bit of a whirlwind tour through some of the products currently around. CRPAs come in all shapes and sizes, and they all have their own particular characteristics and subtleties.
I conclude by reiterating my earlier point. Always conduct a threat analysis, seek the help of a navigation warfare expert if necessary, and properly evaluate your choices. Happy choosing!
On April 24-25, 2017, the National Geodetic Survey (NGS) hosted the 2017 Geospatial Summit in Silver Spring, Maryland, to discuss its plans for replacing the North American Datum of 1983 (NAD 83) and the North American Vertical Datum of 1988 (NAVD 88) in 2022.
The summit was a day and a half long and provided an opportunity for NGS to share updates and discuss the progress of projects related to National Spatial Reference System (NSRS) Modernization. Stakeholders across the federal, public and private sectors also provided feedback and impacts of New Datums on their products and services.
The absolute differences between the new vertical reference frame, North American-Pacific Geopotential Datum of 2022 (NAPGD2022), and NAVD 88 are going to be large but, in most regions of the country, the relative differences over small areal extents will be small.
NGS is developing geodetic routines and tools to transform heights from NAVD 88 to NAPGD2022, and to facilitate the incorporation of geodetic leveling data into NAPGD2022 to establish NAPGD2022 heights. To prepare for the new datums and develop implementation plans, stakeholders should obtain an understanding of the differences between NAPGD2022 and NAVD 88.
My previous columns provided figures that demonstrated the approximate differences between NAPGD2022 and NAVD 88 heights at a national level. (See figure 1.) This column will provide feedback from stakeholders that participated in the Geospatial Summit and, using NGS’ GPS on BMs dataset, a discussion on the differences between NAPGD2022 and NAVD 88 (and NGVD 29) at a local level.
Figure 1 – Approximate Change Between NAPGD2022 and NAVD 88 Using GPS on BMs Data (units = cm). (Image: National Geodetic Survey)
If you check on the tab titled “Summit Documents” you can download the agenda and documents provided to participates. Read excerpts from the summit here.
The first day consisted of presentations by NGS leadership and personnel providing updates and discussing the progress of projects related to the NSRS modernization. The presentations by NGS employees can be downloaded from NGS’ presentations library at this web link. View an excerpt from NGS’ presentations library here.
The afternoon of day 2 were presentations by partners and stakeholders. (See box titled “Excerpt from NGS 2017 Geospatial Summit Agenda – Afternoon of Day 2.”)
Excerpt from NGS 2017 Geospatial Summit Agenda – Afternoon of Day 2 Day 2 Afternoon Agenda from NGS’ 2017 Geospatial Summit Day 2: Tuesday, April 25, 20171:30 – 3:05 Impacts of New Datums on Programs and Partners (Part 1)
Coastal Mapping Program and VDatum: Mike Aslaksen and Stephen White, NOAA/NGS
Federal Emergency Management Agency (FEMA): Kimberly Pettit, FEMA
U.S. Geological Survey (USGS): Kari Craun, USGS
U.S. Army Corps of Engineers (USACE): Jim Garster, USACE
National Geospatial-Intelligence Agency (NGA): Stephen Malys, NGA 3:05 – 3:25 Break 3:25 – 4:55 Impacts of New Datums on Programs and Partners (Part 2)
Geospatial and Remote Sensing Customers: Amar Nayegandhi, Dewberry
Geographic Information System (GIS) Customers: Kevin Kelly, Esri
Global Navigation Satellite System (GNSS) Equipment Customers: Hamid Mahmoudabadi, Trimble Kyle Snow, Topcon
State Government Partners: Gary Thompson, N.C. Department of Public Safety
Local Government Partners: Vickie Anglin, Fairfax County Government, Virginia; Patrick Simon, Baltimore County Land Survey, Maryland 4:55 – 5:00 Wrap-up and closing
In order for consistency, NGS provided guidance and a set of template slides for guest presenters to use. Guest presenters were allotted 10 minutes to present and limited to four slides. The presentation by the guest presenters are not on NGS’ Presentations Library but I’ve been told that they will be available on the Summit website later this year. Gary Thompson, Chief of the North Carolina Geodetic Survey (NCGS), provided me a copy of his slides and gave me permission to include them in this column. (See box titled “Power point Slides Presented by Gary Thompson, Chief of NCGS, at the NGS 2017 Geospatial Summit.”) North Carolina has been very proactive in addressing the impacts of the new datums on NC products and services. North Carolina Geodetic Survey has established a North Carolina Geodetic Survey Advisory Committee that reviews NCGS products and services, and they have established the North Carolina 2022 Reference Frame Working Group to prepare for the new datums.
Slide: National Geodetic Survey
Powerpoint slides presented by Gary Thompson, chief of NCGS, at the NGS 2017 Geospatial Summit
All of the presentations by the invited guest speakers were interesting, and everyone followed NGS’ guidance which helped to focus the Summit on the main issues associated with a datum change. As expected, each stakeholder had their own set of issues and concerns about transitioning to a datum. The following are some common themes that I heard from the participants:
(1) There are a lot of products and services that will be effected by a datum change,
(2) An official transformation model between the old and new datum(s) published by NGS is critical for a successful transition to a new datum,
(3) Guidance documents that are “easily” understood by “non-geodesists” is required for a smooth implementation of a new datum, and
(4) More frequent geospatial summits and webinars are needed to provide updates on the status of the projects associated with NSRS modernization and to ensure user involvement in the process.
I contacted a couple of the guest presenters to discuss their feedback on the New Datums. As NAVD 88 Program Manager, I collaborated with many of them during the development and implementation of the NAVD 88. As in the transition from NGVD 29 to NAVD 88, it’s not the conversion of coordinates that’s a problem; a good transformation tool should meet that requirement. Saying that, it was stated that many users rely on commercial and open source software to convert their data, so they would like NGS to collaborate with others to ensure that these software suppliers are using the appropriate algorithms/information in their products. The integration with legacy data referenced to older datums may be complicated for some products and services; therefore, the process of transforming each product and service will need to be addressed individually. If all data are in digital form with the appropriate metadata, then the transformation should be relatively easy to accomplish and maps with new contour lines or new base flood elevations referenced to the new datum could be generated. However, how these new maps are integrated with old maps is a different issue. I will address some of these potential issues in future columns.
To prepare implementation plans, users must obtain a working knowledge of the differences between the old and new datums. As previous mentioned, the absolute differences between the new vertical reference frame, NAPGD2022, and NAVD 88 are going to be large but, in most regions of the country, the relative differences over small areal extents will be small. To evaluate the relative differences at the local level, the differences between NAPGD2022 and NAVD 88 (and NGVD 29) were computed for bench marks in the NGS’ GPS on BMs dataset. The NAD 83 (2011) latitude, longitude, and ellipsoid height of each station was transformed to the IGS08 reference frame using NGS’ HTDP web tool, and then the GNSS-derived orthometric height was computed using the following formula:
Approximate NAPGD2022 GNSS-Derived Orthometric Height Equals IGS08 Ellipsoid Height minus xGeoid16b Geoid Height (referenced to IGS08).
Figure 1 is a plot of the difference between the approximate NAPGD2022 height and the published NAVD 88 height for bench marks that are part of the GPS on BMs dataset and have the published attribute of “Adjusted.” It should be noted that these are only estimated changes because the final NAPGD2022 reference frame will not be exactly the same as the current IGS08 reference frame, but these estimates should serve the purpose of providing approximate changes for users to develop transition plans.
Since some users are still converting NGVD 29 heights to NAVD 88 heights, the approximate change between NAPGD2022 and NGVD 29 is provided in figure 2. VERTCON values were used to convert the NAVD 88 published heights to NGVD 29 heights, and then the difference between the approximate NAPGD2022 orthometric height and the NGVD 29 orthometric height was computed.
Figure 2 – Approximate Change Between NAPGD2022 and NGVD 29 Using GPS on BMs Data (units = cm). (Image: National Geodetic Survey)
As shown in figure 2, the absolute differences between the new vertical reference frame, NAPGD2022, and NGVD 29 are also going to be large but, once again, in most regions of the country, the relative differences over small areal extents will be small.
What does this look like in a local area? Figure 3 is a plot of the approximate change between NAPGD2022 and NAVD 88 in North Carolina and surrounding states, and figure 4 is plot of the approximate change between NAPGD2022 and NGVD 29 in North Carolina and surrounding states.
Figure 3 – Approximate Change Between NAPGD2022 and NAVD 88 in North Carolina and Surrounding States Using GPS on BMs Data (units = cm). (Image: National Geodetic Survey)Figure 4 – Approximate Change Between NAPGD2022 and NGVD 29 in North Carolina and Surrounding States Using GPS on BMs Data (units = cm). (Image: National Geodetic Survey)
Figure 5 provides a more detailed depiction of the change between NAPGD2022 and NAVD 88 along the North Carolina Atlantic Coast. The differences appear to vary by several centimeters but some of these differences are due to errors in published heights (both ellipsoid and orthometric). These differences can be used to develop a transformation model but the user will need to know the accuracy of the model, globally and locally.
Figure 5 – Approximate Change Between NAPGD2022 and NAVD 88 along North Carolina Atlantic Coast Using GPS on BMs Data (units = cm). (Image: National Geodetic Survey)
Figure 6 is a detailed depiction of the change between NAPGD2022 and NGVD 29 in the same area as shown in figure 5. Comparing figures 5 and 6, the reader should notice that the differences between NAPGD2022 and NGVD 29 are about 30 cm larger (more negative) than the differences between NAPGD2022 and NAVD 88.
Figure 6 – Approximate Change Between NAPGD2022 and NAVD 29 along North Carolina Atlantic Coast Using GPS on BMs Data (units = cm). (Image: National Geodetic Survey)
Figure 7 is the difference between NAPGD2022 and NAVD 88 in western North Carolina. The local difference in the NC mountains is around -35 cm which is about 10 cm different from the NC Atlantic Coast. Questions that users need to address include: What is the accuracy of the transformation model? And What is the accuracy of the product or service being transformed? The transformation model will not replace the original survey results but may be useful for transforming some products and services.
Figure 7 – Approximate Change Between NAPGD2022 and NAVD 88 in the Western North Carolina Using GPS on BMs Data (units = cm). (Image: National Geodetic Survey)
Table 1 provides the average difference between NAPGD2022 and NAVD 88 (and NGVD 29) by State using the GPS on BMs dataset. This table shows that there are large differences between NAPGD2022 and both NGVD 29 and NAVD 88. No matter which datum the product or service is referenced to, it will probably need to be transformed to NAPGD2022.
Table 1 – Average Difference Between NAPGD2022 and NAVD 88 (and NGVD 29) by State Using GPS on BMs Dataset (units = cm). Click to enlarge. (Date: National Geodetic Survey)Average Difference Between NAPGD2022 and NAVD 88 by State Using GPS on BMs Dataset (units = cm). Click to enlarge. (Date: National Geodetic Survey)
Table 2 provides the standard deviation of the average difference between NAPGD2022 and NAVD 88 by State. For example, North Carolina has a sample size of 1600 stations and its average difference is -28 cm with a standard deviation of 4.8 cm. Looking at figures 5 and 7, there appears to be a difference of 10 cm across the State. The States in the northwestern region of the United States have a larger difference between NAPGD2022 and NAVD 88 as well as a larger standard deviation. Oregon has a sample size of 195 stations and its average difference is -100.7 cm with a standard deviation of 13.0 cm, and Washington has a sample size of 266 stations and its average difference is -108.8 cm with a standard deviation of 9.0 cm. Figure 8 is a plot of the approximate change between NAPGD2022 and NAVD 88 in the northwest region of the United States.
As mentioned previously, these differences will vary from station to station because of a bias and trend between the two datums and due to remaining errors in published heights (both ellipsoid and orthometric). As I have noted in previous columns, many of the large relative differences between stations in a local area could be due to an invalid NAVD 88 published height because the bench mark moved since the last time the height of the bench mark was adjusted and published, and/or an undetected error in an ellipsoid height due to a weak GNSS project design. Either way, in my opinion, most of these stations with large relative differences don’t accurately represent the current NAVD 88. NGS’ modernization of the NSRS will provide a more accurate and consistent reference frame, and improve the user’s ability to obtain a current and accurate orthometric height.
Figure 8 – Approximate Change Between NAPGD2022 and NAVD 88 in the Northwest Region of the United States Using GPS on BMs Data (units = cm). (Image: National Geodetic Survey)
This column highlighted some of the feedback provided by guest presenters at the NGS’ 2017 Geospatial Summit held on April 24-25, 2017, in Silver Spring, Maryland. The column also provided a discussion on the approximate differences between NAPGD2022 and NAVD 88 (and NGVD 29) at a national and local level. To prepare for the new datums and develop implementation plans, users should obtain an understanding of the differences between NAPGD2022 and NAVD 88. This column is the first in a new series of columns addressing topics associated with transitioning to the new North American -Pacific Geopotential Datum of 2022 (NAPGD2022).
GNSS and PNT markets continue changing, sometimes very rapidly. No news there. Technology advances relentlessly, opening up new application areas and new price points as it goes.
The market for inertial navigation systems (INS), a subset of that PNT universe, is no exception. The number of available options in inertial has grown substantially. Micro-electrical-mechanical systems (MEMS) sensors lead the charge. Smaller, lighter, lower power and less expensive than previous inertial measurement units, they are truly changing the game and exploding past their previously limited deployment.
So much so that I now need to find a MEMS expert to join our editorial board, advise me on article selection, and attend an ever-widening spectrum of PNT-relevant conferences on behalf of this magazine.
That’s not the only smaller, faster, lighter, cheaper advance warping the speed of change in PNT. Our reporter Robin Wrinn got a look at the 33rd Annual Space Symposium at the ways 3D printing is changing how GPS satellites are put together. I had to rub my eyes when I read her account. Yes, GPS satellites. The column in The System of Systems (page 10) touches only lightly upon this phenomenon. I had to edit all the rest out as we are so short of space in this issue. But go online, where space no longer constrains us, for a fuller account and startling photos.
If this trend goes on much longer, I’ll need a 3D printing expert on the editorial board as well. Indeed, we gave some consideration a few years back to bringing 3D printing “under the umbrella,” so to speak, inside the magically expanding tent — like something out of Harry Potter — that encloses all the technologies we must cover, just to keep up with you folks.
I sense something else lurking about, awaiting an entrance. And for this I’ll really need an expert adviser. I don’t even know what to call it. Somehow it combines virtual reality and gamification. Yes, really. Games are about to begin playing a role in PNT. First in mapping, through the visualization of data; this is explored in our May Defense PNT & Geointelligence Insidernewsletter column.
Gamification is “the application of game-design elements and game principles in non-game contexts.” To what purpose? To improve productivity, of course. Though we may call it accuracy, or availability, or robustness in our realm. It begins with crowdsourcing, probably. Though I feel the ice getting thinner, the limb weaker beneath me as I climb out upon it. Think I’ll stop now.
Space Debris: Artist’s impression based on density data, shown at an exaggerated size to make objects visible. Image: ESA
In April, the European Space Agency (ESA) hosted the 7th European Conference on Space Debris at ESA’s Satellite Control Centre in Darmstadt, Germany. There, international experts discussed ways to head off the threat of space junk.
ESA estimates there are roughly 5,000 objects larger than 1 meter, 20,000 objects over 10 centimeters and 750,000 “flying bullets” of around one centimeter.
Risks of a collision are statistically remote, but “The growth in the number of fragments has deviated from the linear trend in the past and has entered into the more feared exponential trend,” warns Holger Krag, in charge of ESA’s space debris office.
Many of the objects are traveling at enormous speed, up to 56,000 kilometers per hour, giving them the potential explosive force of a hand grenade on impact, said ESA experts.
In the U.S., more than 16,000 objects are tracked and cataloged daily by crews in the Joint Space Operations Center at Vandenberg Air Force Base. Only 1,100 of the tracked items are functional spacecraft, including GPS satellites.
Dealing with existing debris will call for innovative solutions — the purpose of the four-day summit, held every four years since 1993.
“It’s clear to us that the issue of space debris is serious,” Jan Woerner, ESA chief, told the conference. “No country can stand or act alone.”
According to the Intel CEO Brian Krzanich’s keynote address, I was among more than 7,000 attendees and 650 exhibitors. Krzanich and the Intel folks dazzled us with live indoor drone flying and a demonstration of highly detailed bridge inspection using the Intel Falcon 8+ drone.
Then we had a few Shooting Star light drones flying around in a small swarm — all before the show really got cooking. Management of big data was Intel’s pitch for the keynote, but all we nav guys wanted to know was how they flew those things inside.
Intel shows off its light drones in October 2016. (Source: Intel)
Attempts later in the show to establish their guidance recipe were met with a wall of silence from Intel. We know both drone types carry inertial. The Falcon 8+ has three and more than one GNSS receiver, and the light drone has inertial and GNSS, but Intel’s secret is that they use “wireless.” So something to determine where they are and in relation to the inspection article, and to others in the swarm, hooked up to inertial? Intel will tell us sometime later, they say.
In the meantime, Intel promoted the Falcon 8+ heavily at its booth, with its configurable payload capability. Intel indicated that it hopes also to sell light-show swarms for event providers.
The show was indeed huge, and it was impossible to touch base with everyone, so in no particular order and without any leanings towards anyone, I’ll try and capture some flavor of what went down at the Kay Bailey Hutchinson Convention Center at the AUVSI Xponential show.
Duro – Piksi enclosure.
Swift Navigation/ Carnegie
Swift released the rugged Duro enclosure for its Piksi Multi dual-band GNSS receiver. It’s yellow with lots of heat fins, and looks like it would survive being driven over. With dual-frequency real-time kinematic (RTK), Swift claims an all-time low price for board-level RTK.
VectorNav
Based in Dallas, VectorNav took advantage of home turf with a significant presence at the show. VectorNav released a number of use-case studies to illustrate the varied customer applications for its VN series of miniature, high-performance MEMS-inertial and GPS/INS modules. Applications include:
ground robotics for highly accurate, high-speed attitude data
a medium-range UAV with GPS/INS for primary navigation
integrated lidar for mapping capabilities
autonomous ground vehicle module waypoint navigation with a number of system functions
high-precision antenna pointing
camera pointing with a gyro-stabilized gimbal.
Gryphon Sensors
Drone detection and prevention systems had a significant presence at AUVSI. Gryphon Sensors combines radar, RF direction finding and optical sensors in a integrated “intelligent drone detection system.”
Gryphon has been around for some time, using technologies from military applications to also provide vehicle-mounted drone security and UAS traffic management (UTM) capabilities.
Fortem has gone one step further with drone detection — its Dronehunter flies a drone within feet of an intruder, fires a net at the unwanted vehicle and takes it down. The company’s video encounter was at low altitude and the intruder was undamaged — for higher, larger vehicle take-downs, they have a net with a parachute.
Other components of the system include a compact airborne radar for Beyond Visual Line of Sight (BVLOS) and a ground-based radar detection system.
Countries
Several country pavilions exhibited at the show, including China, Spain, France, UK, Denmark and Canada. Highlights included Drone Hopper, a Spanish firefighting drone concept; Chinese UAV antennas and avionics; a French “cluster” of drone-related companies; and Canada, which included a multi-rotor drone dealer and introduced the Foremost drone test range.
Aeronix and Rajant
Secure radios are key to any drone operations. Aeronix displayed a secure software-defined datalink product for providing data, video and voice onto and off drones. The company also introduced significant radio and interface capability for military and secure commercial operations.
Rajant featured mesh radio systems, providing the wireless backbone in UAV applications in mining and on mine trucks. Once again, U.S. Department of Defense technology developed over many years has been spun off into commercial operations.
Aeronix software-defined datalink. Photo: Aeronix
Rajant BreadCrumb LX5.
Trimble
It was good to see Trimble in force again at a trade show; the company had a nice booth with lots of people. We talked with Chris Wheeler about Trimble’s approach of providing an antenna with down conversion, integrated with an RTK software API on existing on-board computing hardware – it’s a good way to potentially reduce costs for UAVs.
Sold through a software license, this reduced-hardware solution could be a new way to get high performance at much reduced prices for larger UAV fleets. It might be significant for lots of other OEM solutions too.
AsteRx-m2 UAS receiver.
Septentrio
The recently released AsterRx-m2 receiver has an optional UAS interface board with record-and-store capability so that real-time images can be readily geo-coded. It directly connects to an on-board autopilot. Self-interference issues coming from existing UAV control electronics are minimized by further enhanced AIM interference mitigation processing on the –m2 receiver.
NovAtel
NovAtel’s military business group continues to make headway with the GAJT integrated anti-jam antenna with more than 600 sold to date. Other applications include the use of the anti-jam electronics processing solution in the GAJT anti-jam Antenna Electronics unit.
If you were not convinced that these are rugged units designed for difficult outdoor applications, they were recently evaluated under firing conditions by the Canadian forces mounted on an M777C1 Howitzer — “No problem,” said Peter Soar, business development manager, Military and Defence.
The anti-jam antenna electronics unit is well suited for UAV applications in signal-rich environments where GPS tracking might otherwise be untenable.
The NovAtel GAJT-710ML GPS anti-jam antenna.
GAJT-AE-N
Aspen Avionics
As the FAA makes progress toward integration of UAS into the National Airspace System (NAS), the interest in using ADS-B (Automatic Dependent Surveillance) for UAV location awareness seems to be growing. ADS-B equipment on both manned and unmanned vehicles provides an output signal containing position, velocity and altitude which can be used by other similarly equipped aircraft and terrestrial/satellite tracking systems.
Aspen Avionics supplies FAA-approved ADS-B equipment for manned and unmanned aircraft, as well as approved GPS navigation receivers for selected classes of certified navigation and landing.
Rockwell Collins/Harris
BVLOS demonstration work under the FAA Pathfinder program with BNSF Railway has continued, with significant technical contributions by both Rockwell Collins and Harris. Monitoring and control of the UAV during inspection flights along the BNSF track test-section in Clovis, New Mexico, was achieved through the deployed Rockwell radio network and CNPC-1000 datalink transceiver installed on a Latitude Engineering UAV. Reliability is now well established, and BNSF is able to operate without visual observers during regular inspections for bad track.
Latitude UAV, similar to those flown on BNSF program. Photo: Latitude
Rockwell CNPC-1000 datalink. Photo: Rockwell
Harris has also provided extended ADS-B coverage throughout the BNSF test section and provided an aircraft-tracking feed from its FAA flight database, to ensure there are no manned aircraft conflicts during UAS track inspection flights.
Insitu
Insitu has conducted very successful business with military and government for many years with its ScanEagle, Blackjack and Integrator UAS. The company is now approaching the commercial world through a turnkey inspection service that it will now offer as its INEXA Solutions.
The intent is not to just offer data collection by flying UAVs for customers, but to first put together the best business case, then collect and process data and deliver the information required.
Lockheed Martin
Lockheed Martin also is approaching the commercial market with a services offering: Commercial Aviation Inspection Services. LM’s UAS capability extends beyond the Stalker fixed-wing surveillance drone, the quadcopter Indago and the military-looking Fury heavy-payload fixed-wing vehicle, to include an autopilot, a vision-processing unit and a dual-sensor gimbal. The LM Hydra-Fusion Geospatial toolset provides post-processing capability for applications including construction, surveying, agricultural, inspection and tactical.
AeroVironment
AeroVironment is another company offering turn-key flight services, from UAS operations through to data processing and custom results. AeroVironment had two new product announcements to add to its extensive UAS capability: the Mantis electro-optical/infrared gimbal sensor suite, and the Snipe man-carried UAS.
The Mantis is designed for installation on the AeroVironment Puma fixed-wing UAS to provide enhanced imaging capabilities, while the 5-ounce Snipe is small enough to be worn by an operator and can be rapidly deployed for close-in surveillance/reconnaissance.
Snipe UAS. Photo: Snipe UAS
…And More
Other news on the show floor:
Airbus Aerial is being established in the U.S. and Europe to provide imagery services for commercial industries, such as insurance, agriculture, oil and gas, and utilities as well as state and local governments.
Spirent promoted its GSS6450 portable GNSS record-and-playback simulator for UAV systems testing and verification.
Multi-rotor drone manufacturer DraganFly indicated that it has been in the UAS business since 1998, so it has lots of capability and experience.
Canadian UAV autopilot supplier MicroPilot continues to do well, and now claims to have 1,000 customers in 85 countries. Looking to future requirements for onboard systems that will make possible UAS integration into manned airspace, MicroPilot is now working toward airborne (RTCA DO-178C) software qualification.
The 2017 AUVSI Exponential convention measured up to all its expectations and pre-show hype. The atmosphere was energetic and positive, with almost every booth getting the attention of attendees & the whisper of deals was everywhere in the many corridors and rooms of the huge Dallas convention center. The UAS industry didn’t only come to show off its wares, but also to do business.
Several UAS flight centers were represented, each with the strong backing of its own home State and vying to attract test center users and to establish new UAS businesses. The industry is apparently ready and able to create those local jobs that have been forecast to grow out of new UAS applications.
While attention has previously been on flying small UAS (sUAS, and there is now a set of FAA rules allowing controlled commercial operations to get underway, there did seem to be an growing expectation that work towards getting larger, longer endurance drones into commercial operations was coming into focus. Many fixed wing applications currently operate under FAA Certificates of Authorization (CoAs), so their scale of operations is limited. But on-going efforts to develop Sense & Avoid and BVLOS solutions are hopefully leading towards the next phase of larger UAS applications in the US National Airspace System.
The Association for Unmanned Vehicle Systems International (AUVSI) Xponential 2017 show, May 8-11 in Dallas, convened a global community of commercial and defense suppliers in intelligent robotics, drones and unmanned systems. It showcases the broad forefront of autonomous vehicles generally, but in-flight in particular, and there were plenty of expanded capabilities and expanding applications on display.
In one of several keynotes over the course of the four-day show, Intel Corporation CEO Brian Krzanich predicted that in the oncoming era of driverless cars and autonomous aircraft, the most important aspect of such vehicles will be the data they collect rather than their performance. Big data and cloud processing are somehow tied into UAVs in his vision of things. Sometime soon, he forecast, autonomous devies “will have the ability to make decisions.”
Swarming drones have military potential, according to a 33-year career Marine who now works at the Potomac Institute for Policy Studies. Bill Powers described how a Navy program, the Low-Cost UAV Swarming Technology (LOCUST) uses drones to jam enemy communications and waste its resources by drawing fire. The Naval Research Laboratory dploys Close-in Covert Autonomous Disposable Aircraft (CICADA), with onboard sensors that relay atmospheric conditions as well as possition, time and altitude relating to battlefield conditions.
Watching the Watchers
With all the drones in the air, managing them and keeping the commercial airspace safe and uncluttered has become a towering problem. Several companies at AUVSI introduced unmanned traffic management (UTM) systems.
Unmanned traffic management becoming a priority (image courtesy Gryphon Systems).
Among them, Gryphon Sensors introduced Mobile Skylight, an operational mobile UTM system designed for rapid deployment.
Drone security applications span, according to the company, airport security, critical infrastructure protection, VIP security, embassy protection and border security. In the beyond visual line-of-sight (BVLOS) realm, UTM applications to be enabled by Mobile Skylight include: first responders (EMS, fire and police), precision agriculture, delivery, utility and infrastructure inspection, media and entertainment, mapping and surveying, construction and mining.
In short, everywhere drones go, they will need to be tracked and managed.
Mobile Skylight combines multiple technologies and an array of self-contained sensors, to serve as a mobile command center. The system is provided in a four-wheel drive van with off-road capabilities. It also integrates with third-party sensor inputs, and automatically records essential data for post-mission analysis and playback.
Using a dual-band mesh network, Mobile Skylight is capable of forward deploying a multispectral suite of sensors. Its integrated radar has been designed for 3-D detection of low-flying, small UAS and general aviation at ranges out to 10 kilometers and 27 kilometers, respectively. The system has built-in target tracking and classification to help quickly identify cooperative and non-cooperative targets. It also tracks multiple, simultaneous targets, providing a comprehensive picture of the airspace.
One novel application is heavy-lift drones for the construction and perhaps open-pit mining, quarrying and other weighty sectors. Griff Aviation, a Norwegian company that has set up a manufacturing plant in Florida, displayed its Super Heavy-Lift model, the Griff 300.
Super Heavy-Lift Drone from Griff Aviation image courtesy Gryphon Systems
The GRIFF 300 is an unmanned aircraft with customizable payload options that make it suitable for a variety of professional applications. The company states that it can lift 225kg (496lbs) in addition to its own 75kg (165lbs) weight. It features a flight time of 30-45mins, depending on payload. “The next model that will be produced will be able to lift 800kg (1,764lbs). Then we will continue to increase lifting capacity even further,” said CEO Leif Johan Holand.
Skylift Global drone prepping for flight. image courtesy Gryphon Systems
Several aisles over on the show floor, Skylift Global also featured a drone in the heavy lifting class. “Current prototype is 100 pounds and carried an additional 100 pounds easy. Currently undergoing testing for up to 400 pounds,” says its CEO Amir Emadi.
Skylift has signed agreements with companies in southern California to start deliveries of cold-chain logistics. Its heavy-lift capability can carry the added weight of refrigeration (think Amazon Fresh, says Emadi). Skylift also is in collaboration with JPL and Caltech to showcase a platform to DARPA for autonomous sense and avoid.
Neither company has GPS aboard their workhorses yet but see no problem and plenty of opportunity in adding it as their business develops.
Experienced GNSS Companies
NovAtel had on display its range of high-precision GNSS receivers, antennas, and augmented systems for ground, marine and airborne unmanned applications. Its equipment meets requirements for military and commercial applications, and specific to UAV applications the company offered the OEM625S SAASM GPS+civil RTK receiver, GAJT anti-jam antennas, TerraStar PPP correction services and SPAN GNSS+INS for 3D position, attitude and velocity.
The latter will be featured in the cover story of GPS World’s June issue, differentiating performance of various grades of IMUs in a tightly-coupled inertial/GNSS integration. Exploring IMU specifications and correlating them to performance of a final product can be daunting, as differences between MEMS sensors are not always apparent. The article will present achievable performances in fusion technology across a range of IMUs among the best in their respective performance categories.
Spirent Communications took a dual approach, displaying what they termed an entry-level simulator (although fully upgradeable as needs develop) for UAV manufacturers who are new to GPS signal testing, and even the need for it. They also had on hand their fully configured GSS7000 for multi-frequency testing, also with a modular approach to enable the precision GNSS simulation system to expand with users’ needs.
The GSS7000 series offers emulation of all civil GNSS systems and regional augmentation systems, and allows devices to be tested under a multitude of operating environments and error conditions, the company said. The GSS7000 has the flexibility to reconfigure satellite constellations, channels and frequencies between test runs or test cases. Four software control variants are offered.
This e-newsletter marks the sun setting on the career of GeoIntelligence Insider columnist and contributing editor Art Kalinski, long active in geospatial circles. Art is handing the journalistic reins to William Tewelow, a former intelligence specialist with the U.S. Navy. He also served a special assignment at the U.S. Department of Transportation and is currently a manager with the U.S. Federal Aviation Administration (FAA). The following discussion muses about the direction of our geospatial tradecraft in the coming years.
Tewelow’s Geointelligence column will alternate monthly with Mike Jones’ Defense PNT column. Every issue of this newsletter also brings you the latest news on both expanding fronts, hardware and software, in the defense and security realm.
Passing the torch
A conversation between retiring GeoIntelligence editor Art Kalinski, GISP, and his successor, William Tewelow, GISP.
Counter-drone technology research and operation efforts are helping to prepare for the potential threat of drone swarms. This Lockheed Martin concept is explored in “Technology That Counters Drone Swarms.” (Image: Lockheed Martin)
Art: A factor of life is that you just can’t predict with certainty where technology is headed or what the issues will be. Several weeks ago I attended a UAV (unmanned aerial vehicle) users group that seemed like a glimpse of the Wild West. I thought the key discussion topics would be the latest technology which seems to change almost weekly. That was not the case. The key discussions were the same as the early days of GIS: legal liability, jurisdictions, data ownership, administrative issues and so on, as the FAA changes the rules and regulations. I began to see that there will be more employment opportunities for lawyers than techies and pilots.
Although most of the attendees at the conference were geospatial/first responder users, I’ve learned of a growing community of non-traditional users such as power line inspectors and even tower painters. Yes, a tower painting company using tethered UAVs to paint in dangerous locations such as bridges, tanks and towers. At first I thought that would be difficult but by using a tethered system, heavy batteries are eliminated and bigger UAVs will permit heavier hoses, etc. Although the FAA had little interest in tethered balloons and UAVs, that could change as the size, altitude and potential crash radius expands.
This is just one example of how our technology is moving in many unplanned directions, everything from UAVs with new ways of collecting imagery to more exotic topics such as artificial intelligence, machine learning, augmented reality, virtual reality (VR) and gamification. The entire trade craft is evolving in ways I don’t think anybody could have predicted just a few years ago, much less a decade ago. It will be interesting to see where it goes.
William: You mentioned several new technologies mixing things up. Small sats are also making a significant impact. They are game changers. Imagine the traditional 2D satellite imagery base map. With the tech we have now 3D base maps are possible and have been for a long time with DEMS. Now, small sat imagery can be overlaid atop the 3D basemaps providing fresh imagery with periodicities of 24 hours or less, including multi-spectral. I’ve even seen small sat video overlays. That’s game changing.
Art: Not only small sats but the work being done with drone swarms is an exciting new area. If data needs to be collected in a hostile area or if flight clearance in a busy air corridor was limited, a swarm of maybe 100 drones could capture a wide swath of data at high resolutions, with multiple spectrums in very short order.
Virtual reality and augmented reality are two areas which have always intrigued me and they are coming to fruition. When I started out in GIS, I told people working for me to do the best we could building our regional database because at some point we would have construction workers wearing goggles that will augment the reality of what they are seeing with GIS data. That day is here and people are finally starting to do that. So, the entire concept of AR (augmented reality) and VR I find extremely exciting.
William: Yes, absolutely, in fact I believe they used drone swarms in the hostage situation in Algiers in 2014. And you are right. VR and AR use for first responders is especially critical. Say you’re a disaster relief person at night in a smoke-filled building. Night vision and thermal vision reach a practical limit. However, combining the vision devices with AR you may be able to navigate through the environment well enough. AR shows at least what should be there so accurate and timely data is critical. I can see this is where things are headed. Additionally, more mundane tasks such as design and modifications of structures could be enhanced. Work is already being done using AR and VR to facilitate the design process.
Art: VR started as fun and games but to me serious use VR is where the new and exciting action will be for geospatial practitioners. Virtual trainers I saw recently included small arms and artillery trainers for the military to a less exciting but equally impressive virtual trainer to teach arc welding and even spray painting a car. Significantly more critical was a VR surgical trainer where the muscle learning and hand eye coordination required is significant. It’s obviously quicker, easier and cheaper to practice virtually than on a real human or real equipment and the VR environment is just one short step away from surgical robots operating in remote locations.
William: Right, and you are touching on gamification, where VR can be used to train toward certain results. Take the military, for example, gamification can save all manner of resources – bullets, people, buildings the environment. Additionally, users can also scale up or down. The VR environment doesn’t just mean roads, maps or mountains. You can get down to a micro level.
Art: It’s interesting you mention that. One aha! moment I had years ago was at the first Esri User Conference in San Diego. I went through the map gallery. A lot of examples of different uses for GIS were on display and one person had created a map of the human circulatory system using ArcView Network Analyst. Looking at it I thought, of course, whether its blood vessels or interstate highways, it’s a network; so, this individual was using a geospatial tool to map the entire blood vessel network.
William: We are now in the realm of nano technology, where things are small enough to work on blood cells. Imagine steering straight towards a cancer cell by pinpointing a location in relation to the body.
Art: It’s almost like the movie “Fantastic Voyage” except in a virtual environment.
William: Yes. Being able to put the nano technology right where it needs to be means entering an age of focused medicine so that a pill releasing nano particulates doesn’t impact the whole body just the area needed. That’s another discussion in itself. Of course, all of that will have to be controlled, mapped and understood in terms of what it’s doing and where it’s going in relation to the body.
Art: One area that is very concerning to me is cyber. All of this stuff we’ve talked about is very vulnerable whether stealing data or doing damage to a society. Thwarting those threats is getting into machine learning, AI and other topics bordering science fiction.
William: Yes, and you are getting into artificial intelligence. IBM, Google, Amazon, Facebook, Microsoft and our three letter agencies are all investing into the world of Geospatial AI. I am not sure where GeoAI will end up but we can already see some hints. The amount of geospatial data is overwhelming and imagine the explosion happening with IoT. How will all that be managed? GeoAI will do pattern recognition so in effect GeoAI is assisted intelligence.
As an example let’s consider a high profile event. There are 1000’s of parameters that need to be tracked such as surveillance cameras, social media feeds, a suite of sensors, etc. Identifying critical patterns is crucial so Geospatial Assisted Intelligence can monitor the parameters of the event then notify the analyst when a triggering event occurs. That’s where the technology is going where it has to go.
Art: One has to have a truly dizzying intellect to keep track of all aspects of our technology. At the last NGA (National Geospatial-Intelligence Agency) conference, Director Cardillo talked extensively about open systems and open sources which are growing directions for the agency. I believe it’s good to get away from everything being “inside the tent” and taking advantage of the extensive capability in the broad geospatial community. The stated goal is to be able to develop needed geospatial tools, in an unclassified environment, not in months or weeks but literally in minutes to provide those tools to analysts in the field. Things have come so far from the day I was just happy to get a pen plotter to print a simple map.
William: It really is mind boggling. I was there when full motion video began and that was dynamic 2D imagery but then it made the jump to 3D dynamic imagery and my circuits fried. I still have a hard time comprehending all the data crunching that goes into it and it is now almost standard. The future is amazing. That is the direction I want to continue to explore.
Most activity so far in the PNT community has centered around the questions of “Where am I?” and “Where am I going?” and “How fast am I going?” Positioning, navigation and timing. Seemingly that should about cover it. But no.
Mapping comes into the picture: “What fixed objects are in my environment?” This is actually a corollary of “Where am I?” though let’s not put too fine a point on it.
All this “I” business. To get to driverless cars and other autonomous vehicles, we will have to look beyond the first person singular, what some researchers call “the ego vehicle.” We must know, with a high degree of precision and certainty, “Where are other moving vehicles?” and “Where are they going?” and “How fast are they moving?” Another order of magnitude, if not several. PNT squared, as it were.
In the fast oncoming intelligent transportation systems (ITS), future driving (very much present and evolving now) will rely on accurate, reliable and continuous knowledge of the position of other so-called road participants. That’s not just cars, trucks, motorcycles and buses, but includes pedestrians and bicycles and who knows what else — skateboards?
The first approaches to this requirement use on-board ranging sensors such as camera/vision systems, radar, laser scanners and more. (Some of this “more” is explored in this May’s print cover story, “Look Around.”) This already calls for a significant level of integration with GNSS and inertial systems of the ego.
But it’s still not enough. A cooperative approach must develop, in which the other road participants actively support the continuous estimation of all relative positions. Not only must they have all the sensors the ego possesses, they must continually communicate all that data with the ego, and conversely. This is what’s called “connectivity.”
It’s almost as if vehicles are becoming sentient, expressive beings. A bit like us. Bringing new meaning to the expression “the automobile as an extension of the self.”
Ask anyone what time means to them, and they will give you a different answer. Benjamin Franklin famously stated that “time is money.” Time for the surveyor can mean being out in the field retracing a boundary, drafting a plat or working with a client to help them see their goals achieved. Just like any other profession, time can be a friend or foe for the surveyor. We seem to run out of it more than we have an excess of it. Either way, time marches on as we go about our business.
Time, however, is changing the surveyor’s world and how we go about our methods of measurement. While it seems like a crazy concept, time is the major component requiring changes to geodetic procedural processes and how we will determine our locations in the future.
We will continue to see advances in hardware and software along with new interfaces and ways to collect and display survey data almost daily, and we will continue to deal with adaptation. However, surveyors must be ready for the next big challenge: a national horizontal and vertical adjustment of the National Spatial Reference System (NSRS) into a new standard. The North American Terrestrial Reference Frame of 2022 (NATRF2022.) is currently being developed by NGS and will replace NAD83 and NAVD88. Most surveyors will ask why we are getting ready for a historic change in datums. Easy — it’s all about time.
Expanded Variables
Just as early travelers thought the Earth was flat and learned it wasn’t through exploration and science, we are learning more everyday regarding how our world is changing. To get a better understanding of how our world is changing, NGS and the geodesy community have expanded the environmental variables of geographic location to areas including gravity, geoid undulations and geopotential data, plate tectonics and crustal evolution, and additional GNSS data analysis through satellites and continuously operating reference station (CORS) installations.
By introducing new attributes affecting coordinate data, including horizontal motions induced directly or indirectly by adjoining tectonic plates, horizontal motions induced by Global Isostatic Adjustment, other horizontal motions and all vertical motions in their entirety (per NGS NOAA Technical Report NOS NGS 62), data captured will be used to create an Intra-Frame Velocity Model (IFVM). Data following this format will be now be used to monitor the movement of survey positions from implementation forward. The key factor in which all the data is centralized is time.
My GPS World colleague David Zilkoski presented a thorough explanation (“NGS to Replace NAVD88 in 2022: What GNSS Users Need To Know) of the nuts and bolts behind the changes. Here are the basic reasons behind the new adjustment as provided by NGS:
NAD 83 and NAVD 88, although still the official horizontal and vertical datums of the National Spatial Reference System (NSRS), have been identified as having shortcomings that are best addressed through defining new horizontal and vertical datums.
Specifically, NAD 83 is non-geocentric by about 2.2 meters. Secondly, NAVD 88 is both biased (by about one-half meter) and tilted (about 1 meter coast to coast) relative to the best global geoid models available today. Both of these issues derive from the fact that both datums were defined primarily using terrestrial surveying techniques at passive geodetic survey marks. This network of survey marks deteriorate over time (both through unchecked physical movement and simple removal), and resources are not available to maintain them.
The new reference frames (geometric and geopotential) will rely primarily Global Navigation Satellite Systems (GNSS) such as the Global Positioning System (GPS) as well as an updated and time-tracked geoid model. This paradigm will be easier and more cost-effective to maintain.
Plate tectonics
These proposed changes to the NSRS, however, are based upon how much we have learned about our changing Earth using GNSS equipment and data collection. Time, as it turns out, is a big factor in how we measure and document locations. A point that is determined exactly here on this day at a specific moment will have moved due to plate tectonics and other variables to there over a period of time.
New Vertical Component
Another aspect of the datum change will be the definition of a new vertical component. Surveyors are familiar with the establishment of NGVD29 based upon mean sea level, and also NAVD88 being based upon the benchmark at Father Point/Rimouski, Quebec, Canada with reference to the International Great Lakes Datum of 1985. What science has taught us in the years beyond NAVD88 is that there is a greater force at play when it comes to the vertical piece of geolocation: gravity.
Yes, gravity keeps us on the ground and causes water to flow downhill, but the development of gravitational studies has led to incredible discoveries of how gravity affects elevation. It was always assumed that the gravitational pull on the earth was uniform worldwide, but with the development of instruments that can measure and map the variations in gravity, NGS will be redefining the vertical datum through a program called GRAV-D. NGS is currently flying in various portions of the U.S. and is scheduled to be completed by 2021 in order to roll out with the new horizontal program in 2022.
So, it turns out that time has been affecting not just our productivity but also our positions on the earth. Another famous quote by Paulo Coelho does hold true: “Time neither moves nor is stationary. Time changes.” Time has passed since this article began; did you feel the earth move?
What about our survey monuments and state plane coordinates?
For many surveyors, the main question is simple: why now? What is so bad with our existing NAD83 and NAVD88 datums?
Map courtesy of GISGeography, at http://gisgeography.com/state-plane-coordinate-system-spcs/
The reason is very simple; staying current with our favorite tool in the toolbox: GNSS. Surveyors have always been about “monuments” and perpetuation of data from established points located on the face of the Earth with published and/or known values. This concept has become even more important to the surveying community once the proliferation of geographic-based and state plane coordinate data was published for all to utilize. I touched on the surveyor’s use and data collection/perpetuation of location values in a past column (GPS World November 2016). As long as NGS updated the national database with more information and a simple adjustment every so often, life was good and simple.
But now we have worlds colliding; static monuments with published horizontal and vertical values in one corner, while in the other corner is the new paradigm of ever shifting crustal plates and changing positional values monitored by GNSS data through satellites and a network of CORS located worldwide.
This situation makes me harken back to one of my favorite “Ghostbusters” lines from Bill Murray’s character, Dr. Peter Venkman: “Human sacrifice, dogs and cats living together – mass hysteria…”
Okay, maybe it won’t be quite that bad but there will be many surveyors that will have trouble wrapping their minds around the new concept of “moving monuments.” Our reliance on state plane coordinate systems (SPCS) is at an all-time high with the sharing of data by various parties being more seamless than ever. The notion that a permanent monument’s positional values will be constantly changing is a head-spinner to most.
NGS has also stated that their new system and procedures will not maintain data values for SPCS (see NGS State Plane Flyer). There are currently 125 SPCS zones and 3235 county systems throughout the US and territories in place that rely on NGS data as the main framework, so having tools for reference and conversion in place will be crucial. Thus, it will be a herculean task to create a procedure/process to easily pass coordinate values between our many static systems worldwide and the new dynamic but very robust system underway from NGS.
Based upon information currently available about the NAD2022 system, it would be more efficient for all those who use geolocation data to modify their thinking to adapt to a dynamic coordinate system. However, this is a similar situation to early scientists and geographers throwing out all references to flat-earth maps and atlases. For surveyors in the twilight of their careers, these are radical items to consider and a far cry from the standardized chain and theodolite. (Maybe there will be mass hysteria…)
The good news is that we have very intelligent people in the surveying and geodetic community who are working on solutions for the masses. The beauty of newer technology is how quickly hardware and software can be adapted to fit these new data conditions. Getting the word out on these changes and educating our profession will be a key factor to its success.
Further Refinement of Coordinate Systems
While the use of GNSS has enabled the discovery of time as a significant variable in geolocation, it has also expanded out coverage area of coordinate systems to much larger areas. Distances that could not be computed prior to GNSS are now easily attained and large projects can be managed within a common coordinate system. County, regional and state agencies can now create large-scale GIS databases that utilize a single coordinate system as well.
However, there are two differing tracks being formed with the continued development of the new datum by NGS. While the new datum will become more precise and predictable, there are movements in opposing camps to make changes in user coordinate in the furthest possible ways: statewide single zone system versus county/regional low distortion projection (LDP) systems. They both have their strengths and weaknesses, and will depend on the application of the user to choose the appropriate system.
Most states currently have two or more zones so there potential to combine all zones into one, but a major drawback will be the loss of accuracy away from the defining points. For GIS users, this accuracy will more than adequate and will allow the merging of data from across the state into one unified system.
Surveyors, however, are an interesting bunch in that they accept only the most accurate AND precise measurements. The growing use of LDP is rapidly changing the implementation and management of coordinate system in smaller areas such as counties and regional DOT districts.
However, both systems have a place in our surveying and mapping world. NGS has stated that while they will help with transformation software and apps, it will leave the decision of legislative standards to each state. It will be paramount that each state study what makes the most sense for its users and pass the appropriate legislation.
“The days are long but the years are short”
As I look back and realize how much has changed with modern technology and overall knowledge of our profession, it is with much anticipation how much more will change with advancements we don’t even know about yet. The electronic distance meter (EDM) was revolutionary for many surveyors and I’ve waxed poetic about my feelings regarding RTK GNSS in past columns (GPS World May 2016). Once again, however, technology and information based upon its use has revolutionized our data system.
As a profession, surveyors have embraced GNSS use and data collection from the early implementation of the system. And while the advances of UAV use, laser scanners and LiDAR along with software improvements have revolutionized data collection, these proposed coordinate improvements by NGS will bring more potential quality information into the surveyor’s hands.
And while time is money as Mr. Franklin famously stated, 2022 is just around the corner. A good friend of mine is famous for saying: “Good coordination begins with good coordinates.” The work performed by NGS is helping us do just that. The entire surveying, mapping and geodetic community has lots to accomplish to be ready for the changes from NGS. Let’s get to work.
 The report was commissioned by Innovate UK, the UK Space Agency and the Royal Institute of Navigation. It followed from the January 2016 accident referenced earlier, in which an error in the GPS signal from certain satellites, triggered by the decommissioning of one of those satellites, brought a number of key industrial servers to their knees. The episode lasted 12 hours.


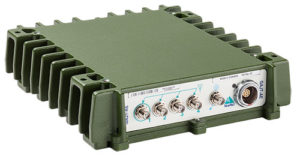
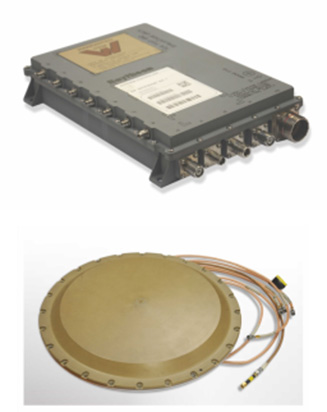
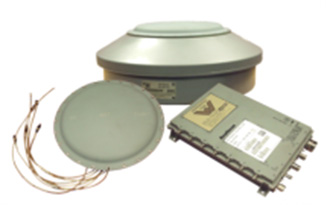
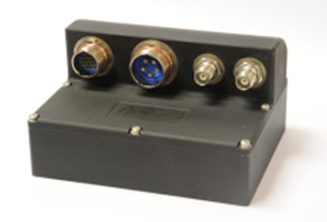
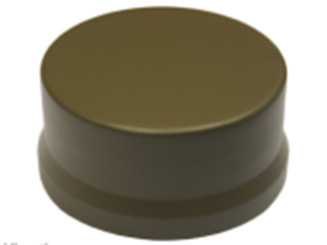
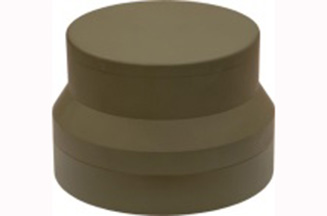
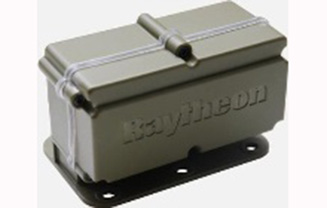
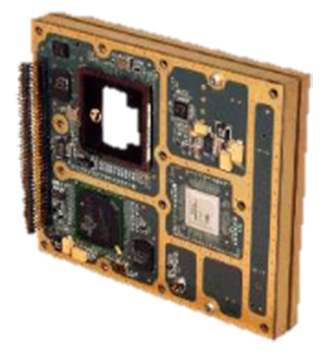
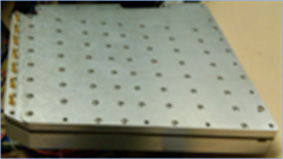
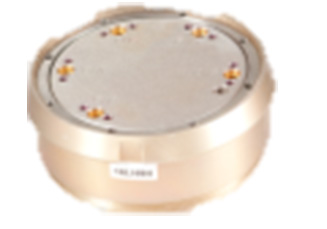

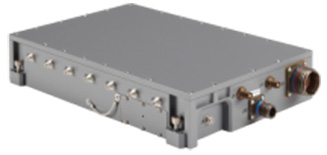
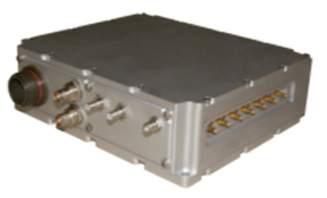
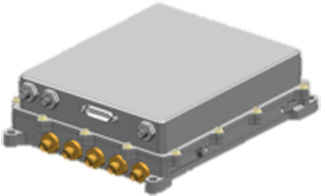
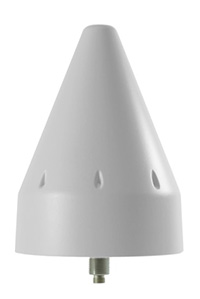
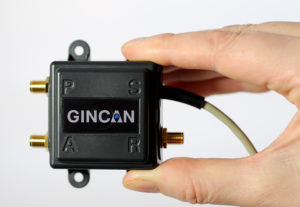
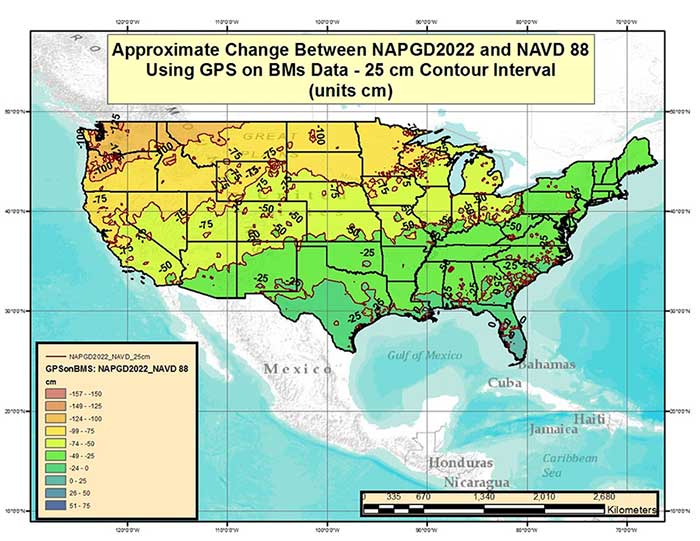


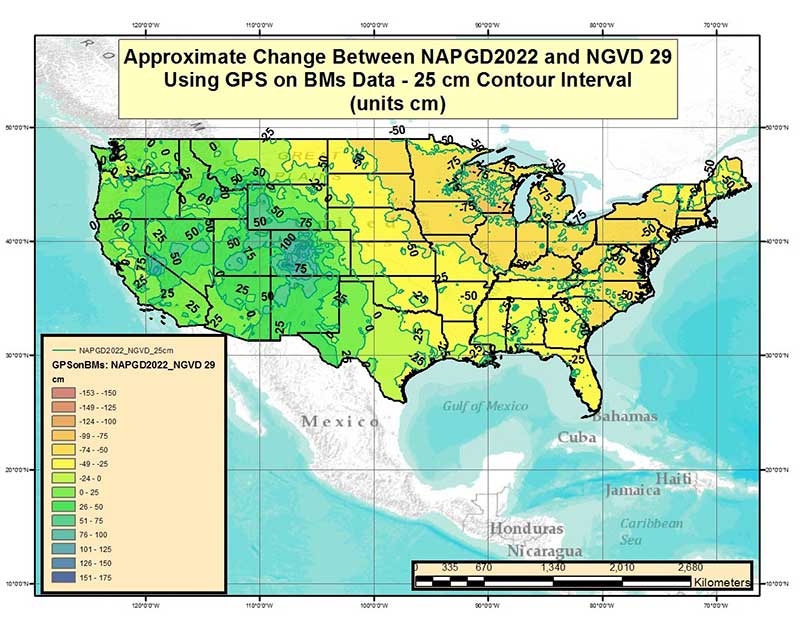
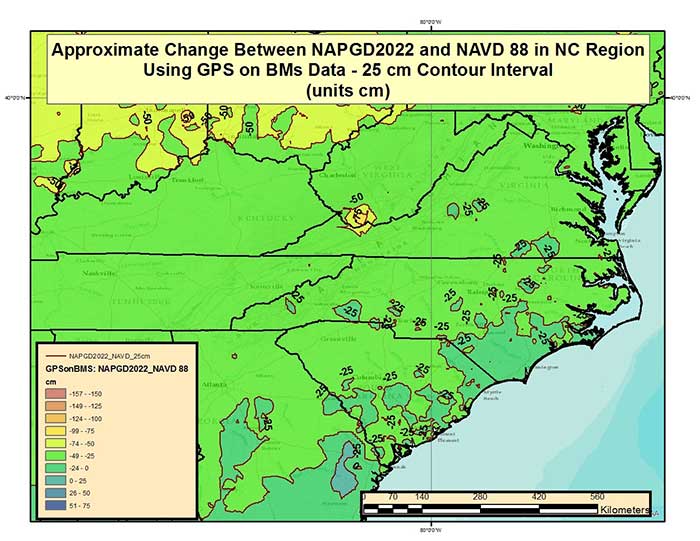
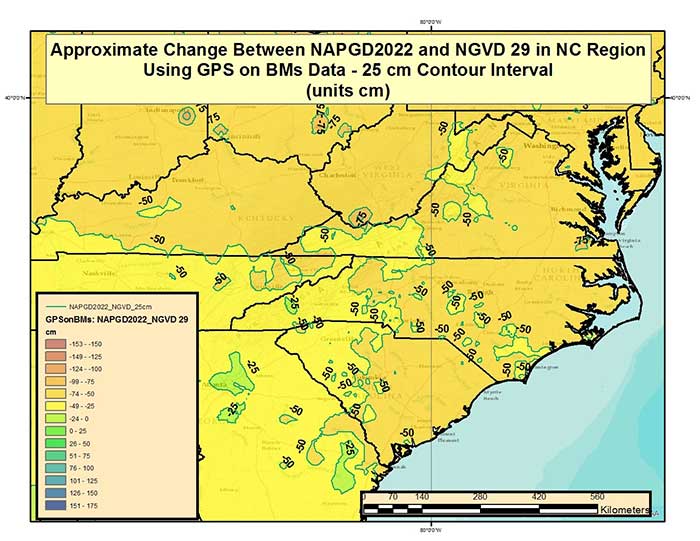
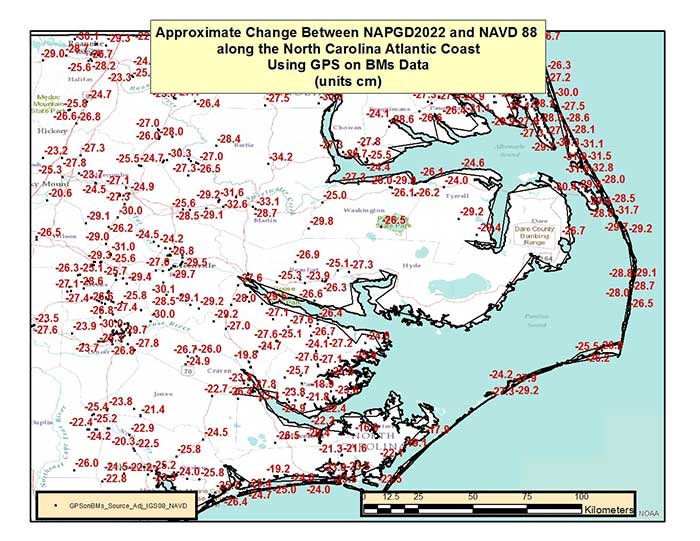
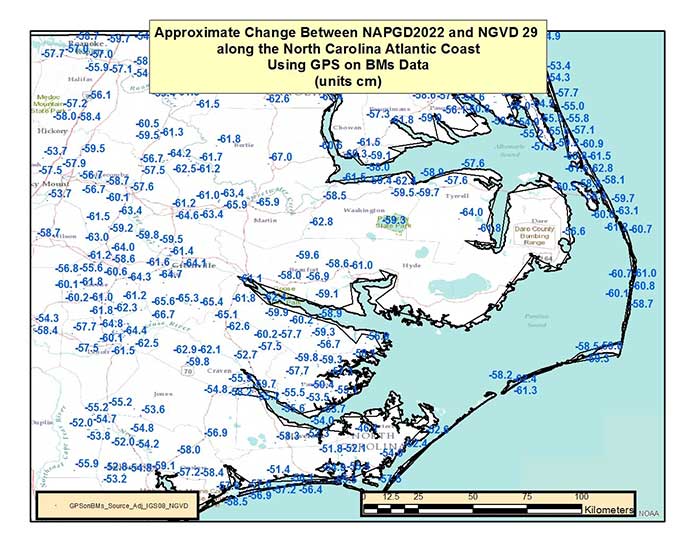
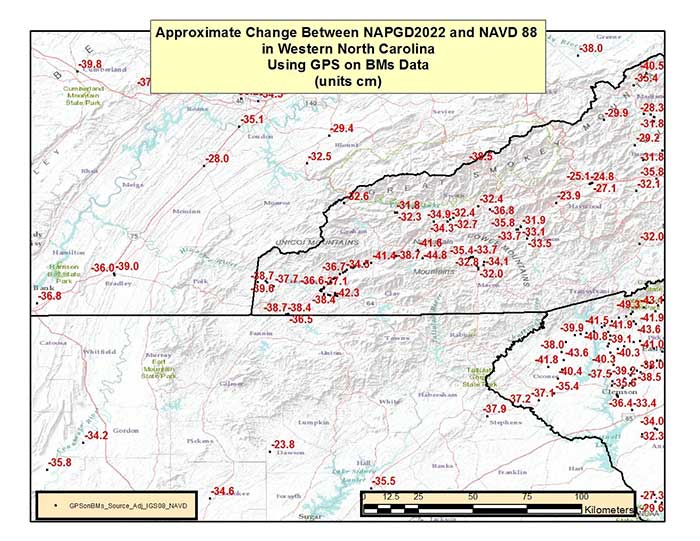
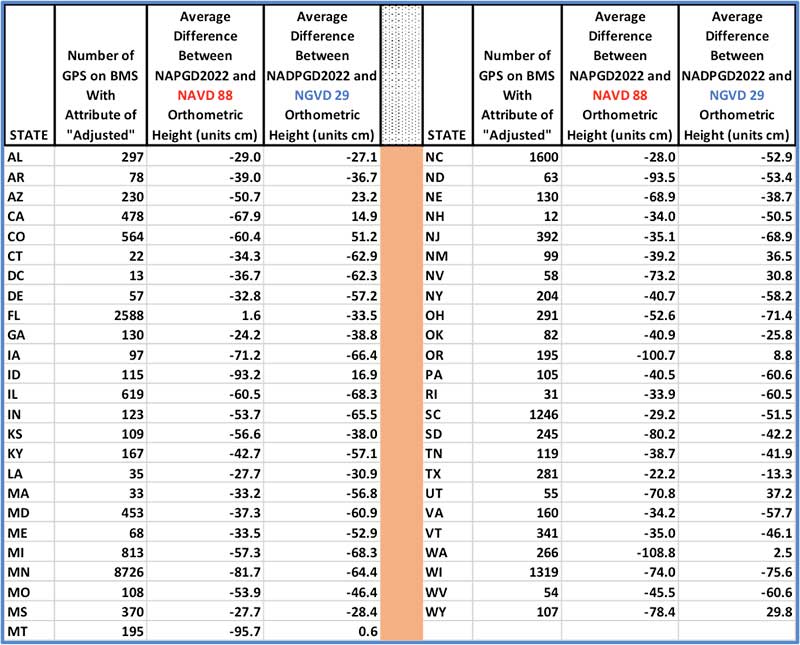
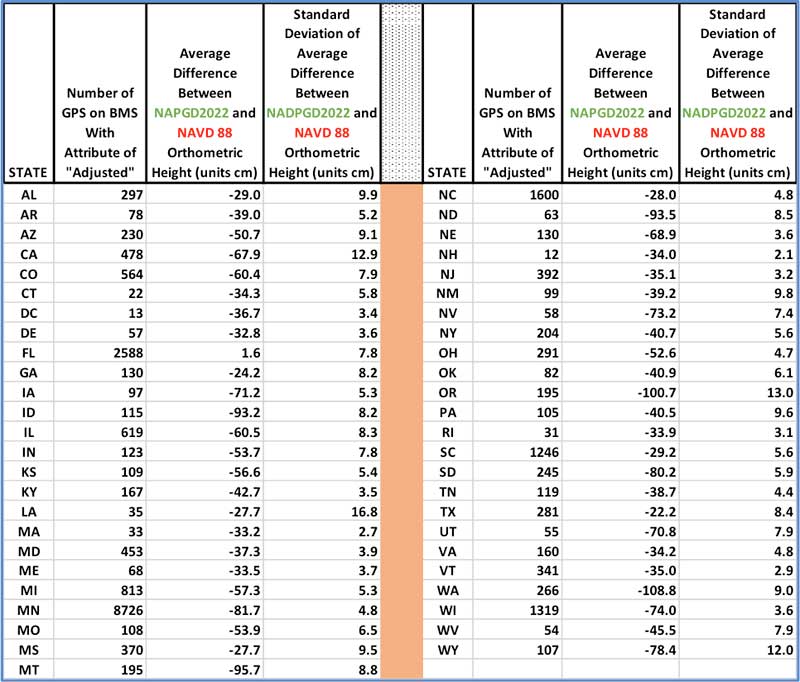
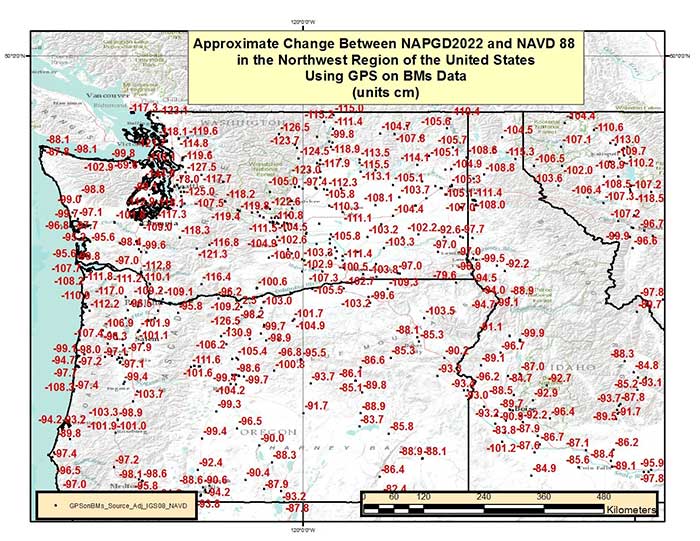


 Our reliance on state plane coordinate systems (SPCS) is at an all-time high with the sharing of data by various parties being more seamless than ever. The notion that a permanent monument’s positional values will be constantly changing is a head-spinner to most.