Category: Opinions

  • Spoofing in the Black Sea: What really happened?

    Spoofing in the Black Sea: What really happened?

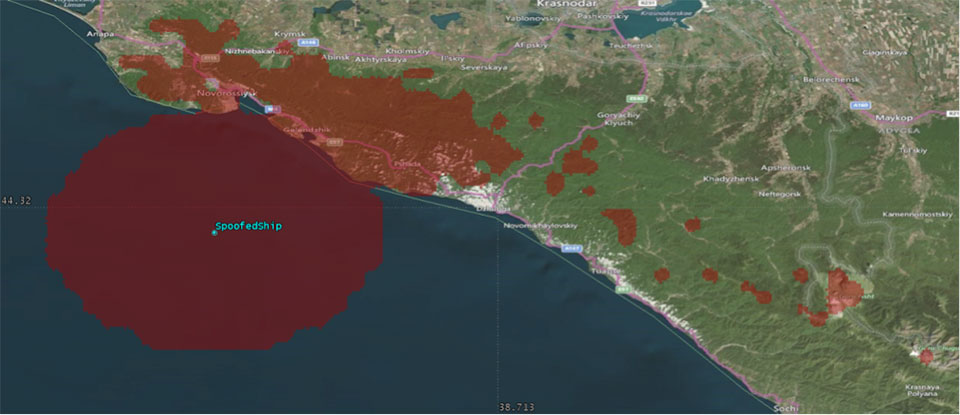
    We’ve heard a lot in the news recently about GPS spoofing, mostly centred on the story of ship spoofing in the Black Sea. Between June 22-24, a number of ships in the Black Sea reported anomalies with their GPS-derived position, and found themselves apparently located at an airport.

    What happened is open to educated conjecture. In this column, I’ll briefly cover the history of spoofing, its basic techniques, some spoofing tests that we conducted, and then return to the infamous Black Sea incident.

    As part of my day-to-day work in navigation warfare, I do a fair amount of work in defensive anti-spoofing. Naturally, in order to test anti-spoof technology, it is necessary to also perform spoofing. It’s a delicate subject and, as with any topic involving defense or national security or critical infrastructure, there’s a balance to strike between responsible disclosure, how much information is released into the public domain, and so on.

    In this article, I will stick firmly to information available in the public domain, lest I be accused of proliferating the threat, but this still gives us enough material to tiptoe around the subject for the benefit of our readers. I could have included more details about the spoofing attacks, but was advised to hold some back — it makes governments nervous. You can read some of the background in an excellent article by Norwegian broadcaster NRK and a Resilient Navigation and Timing Foundation press release. Similar GPS anomalies still continue to occur at various locations.

    Let’s start with basic spoofing background, and we’ll return to the Black Sea incident at the end of the article.

    A brief history of spoofing

    Spoofing isn’t a new threat — it’s been around for decades. But only in recent years has it received so much public attention. As with jamming and anti-jamming technology, and most other topics in the GPS domain, spoofing finds its roots back in the days of Cold War radar. In those times, it was often known as “deception jamming,” where you would transmit fake radar returns to paint an incorrect picture on your adversary’s radar screen.

    When GPS came along, it was understood at the time that the C/A code would be vulnerable to spoofing. It’s an open code, so anyone is free to reproduce it. That is, after all, what a GPS simulator is: a GPS spoofer. We legitimately test our GPS receivers by fooling them with fake signals from a GPS simulator.

    Of course, this is precisely why legacy GPS satellites also transmit the military P(Y)-code, and continue to do so. The P-code offers improved accuracy, and some other benefits, but more importantly, it is modulated with the W encryption sequence to give us the encrypted P(Y)-code. Ever since the anti-spoofing module was set to the “on” state, unless you have the key, you are unable to directly spoof the P(Y)-code. (You can still perform a meaconing attack, though, where you simply record the transmitted satellite signals and retransmit them again. Although this kind of attack can’t be used to impose a particular scenario on a GPS receiver, it might still cause havoc in unwary receivers).

    So. in the early days it can be argued that the spoofing threat was solved. It wasn’t until GPS became ubiquitous in the commercial and civilian domain that spoofing really raised its head again. The fact that the vast majority of GPS receivers in the world relied solely on the unencrypted C/A code became a cause for concern — especially where those GPS receivers were essential to critical infrastructure.

    The threat of GPS spoofing was discussed at many conferences and behind many closed doors and, although most people agreed that spoofing was a theoretical threat, some people argued that in reality it was “simply too hard” to conduct a realistic spoofing attack. And therefore we should not worry ourselves about it.

    It wasn’t until a couple of high-profile demonstrations were carried out by the University of Texas Radionavigation Laboratory that spoofing became front-page news once again. In 2012, the lab staff carried out an exercise at White Sands Missile Range where a GPS-guided drone was spoofed from a distance. The drone was fooled into thinking its altitude was increasing, causing it to compensate by dropping straight down. Then in 2013, the same team demonstrated how an $80 million yacht could be steered off course by means of a spoofing attack.

    These exercises publicly demonstrated that spoofing was indeed a real threat, and could be done. But many people still believed that it was very hard to build the complex equipment necessary to perform the attack, and thus spoofing was out of reach for most potential criminals or terrorists.

    Fast forward another two or three years, to when a new mobile phone game appeared. Pokemon GO became the game craze of the moment, where players would travel around the country with their phones, getting points by collecting creatures in an augmented reality world. It didn’t take long for people to dream up new ways of earning points in the game, without having to go to the effort of traveling around the world.

    What if you could make your phone think it was somewhere else, without ever having to leave your bedroom? And thus, bizarrely, it was a mobile phone game that brought GPS spoofing into the mainstream.

    The rise of the low-cost software-defined radio (SDR) has enabled “spoofing for everyone.” Today, the tool of choice for the casual user is often the HackRF or bladeRF. Couple small SDRs that cost around $200 with open-source GPS simulation software, and you have a basic spoofer. Plenty of websites detail how to perform basic spoofing, and at hacker gatherings, people can present how they spoofed a drone. These may not be the most sophisticated setups, but it’s good enough to do the job in many cases. With a better setup, which I won’t describe here, it’s possible to achieve a much more realistic attack, which will fool even the most shrewd and wary GPS receivers.

    Spoofing basics

    Let’s take a quick look at what it means to spoof GPS. A receiver searches for a satellite over a two-dimensional surface to find a correlation peak, and it must examine a range of Doppler frequencies and code offsets. An example is shown in Figure 1. Once the receiver finds the peak, the satellite is acquired, and it will then track the satellite as it moves and can demodulate the navigation data message.

    When a spoofer comes along, it tries to recreate this peak. By doing so, and usually with little more power than the real satellites, the receiver will begin to track the spoofed signal. Once the spoofed signal is being tracked, the spoofer can begin to manipulate reality by slowly modifying the properties of the signal.

    Figure 1. GPS correlation surface. (Image: Michael Jones)

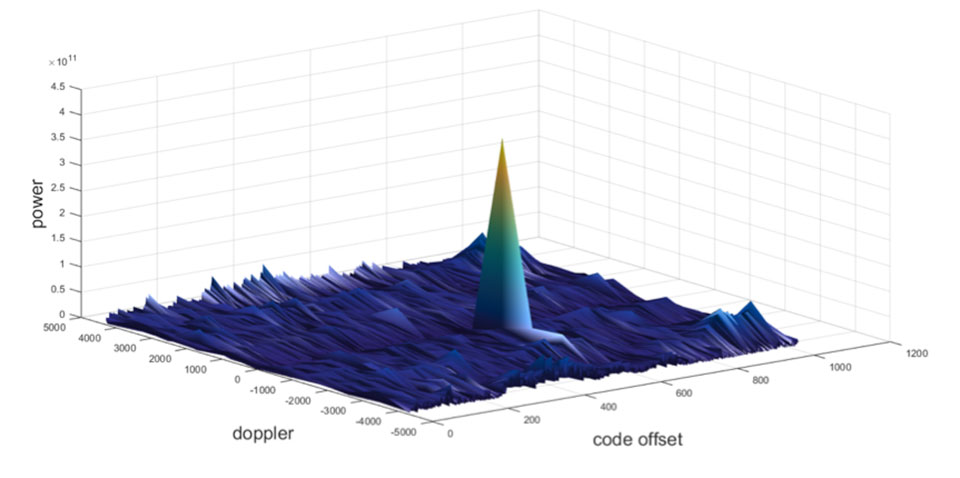
    A poor spoofer doesn’t always align itself very well with reality, which essentially creates a second peak on the correlation surface. But a gullible receiver can still be fooled by this, and may lock on to false peaks.

    The reality of spoofing and anti-spoofing

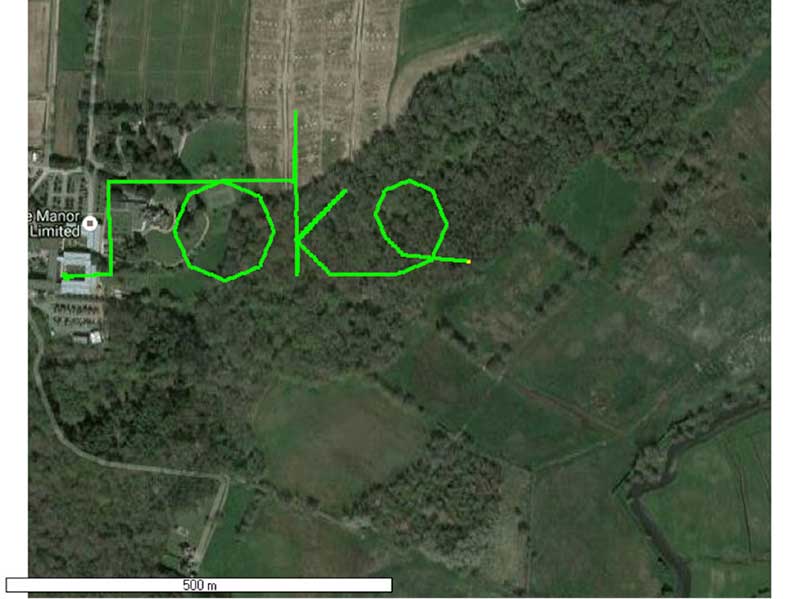
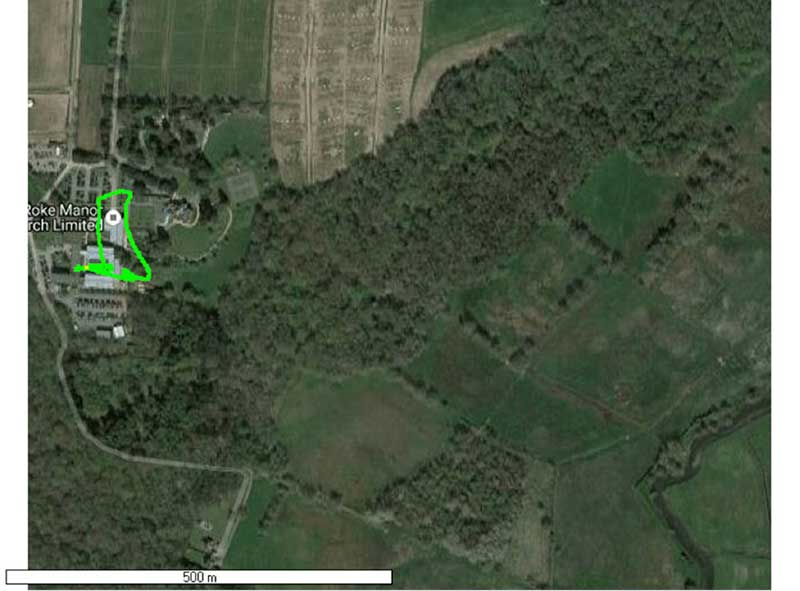
    To understand the reality of spoofing and anti-spoofing, we carried out outdoor experiments at one of the Roke Manor trials areas (thanks go to my colleague Mike Wells for letting me use some of his results here).

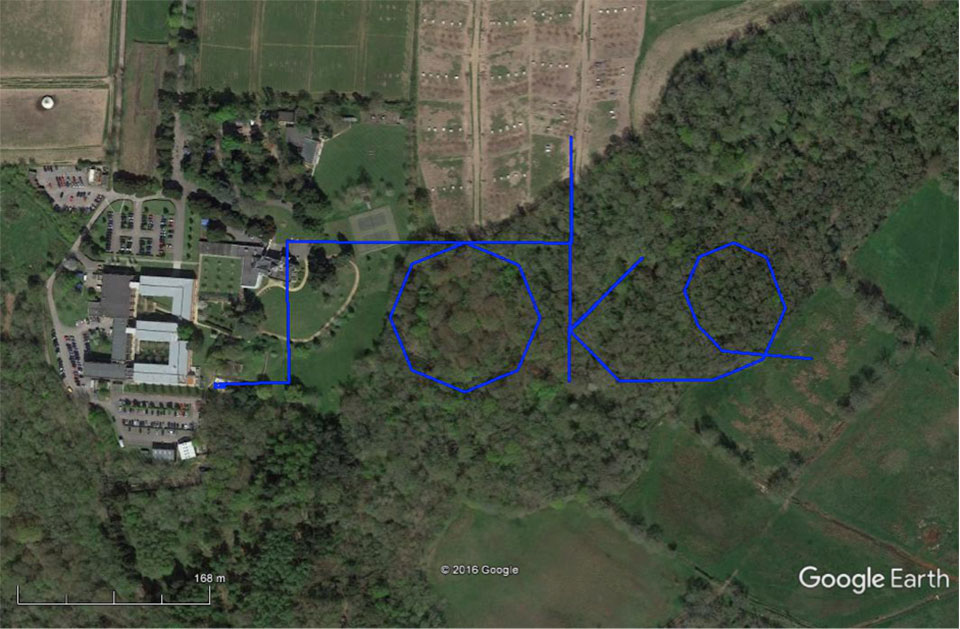
    In the first experiment (Figure 2), we spoof a commercially available mass-market receiver. The receiver is outside, reporting its correct location at Roke Manor. When we commence the spoofing attack, we are able to take control of the receiver. Once captured, we can then make the receiver appear to follow an arbitrary course. Here we make it wander off into the forest, spelling the word “roke” as it goes.

    Figure 2. Spoofed GPS receiver appears to follow a course, whilst in reality being stationary. (Image: Michael Jones)

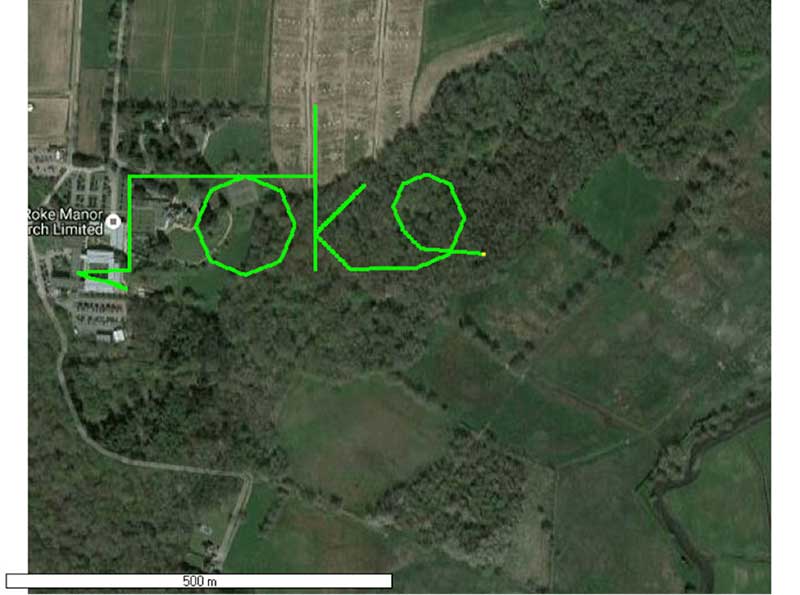
    In the next experiment (Figure 3), we place a conventional anti-jam antenna (a CRPA) on the receiver. What we observe, as you might expect, is that the basic CRPA offers no protection against the spoofing attack.

    Figure 3. A GPS receiver is still successfully spoofed when protected by a conventional CRPA. (Image: Michael Jones)

    Now let’s make the experiment more interesting. We’ll move away from the basic commercial receiver, and replace it with a unit that contains not only a GPS receiver, but also a 3-axis accelerometer, 3-axis gyro, 3-axis magnetometer and a barometric sensor. An Extended Kalman Filter (EKF) performs an optimal fusion of the various sensors to yield the position solution.

    The result, when we again try our spoofing attack, is shown in Figure 4. In short, the receiver is still successfully spoofed, despite the additional sensor inputs it offers.

    Figure 4. A GPS receiver with integrated inertial sensors is still spoofed. (Image: Michael Jones)

    Before everyone gets too depressed by the ease at which GNSS, and even GNSS fused with other sensors, can be spoofed, there are answers to this problem. Some decent, modern GNSS receivers contain a whole host of algorithms for detecting and ignoring spoof signals. The issue is that many legacy receivers are still in the field, and these can be extremely vulnerable indeed.

    Another option is to use a more advanced CRPA, which offers anti-spoof capabilities. These adaptive antennas are able to correlate on the spoof signals, and then remove them based on direction of arrival. So, in our final experiment here, we use our commercial mass-market receiver again, and protect it with an anti-spoofing CRPA.

    The result is shown in Figure 5. You can see that the receiver is briefly spoofed, and starts to wander off course. When the anti-spoof is enabled and kicks in, the position quickly drifts back to the true location and stays there. Good job.

    Figure 5. With an anti-spoof CRPA, the GPS receiver detects the spoofer and quickly returns to its true location. (Image: Michael Jones)

    Back to the Black Sea

    Let’s finish by returning to the hot topic of the day. Did spoofing occur in the Black Sea back in June? Or was it a different form of interference? Could it have been a low-level jamming incident, causing the GPS receivers to report misleading information?

    Without resorting to SIGINT (signals intelligence) data, and basing this discussion solely on public domain information and anecdotal evidence, I would say this was almost certainly a spoofing incident. A number of factors lead to this conclusion, and I’ll share some of them.

    • Firstly, it didn’t happen to one ship – it happened to over 20 separate vessels. So it wasn’t a malfunctioning GPS unit; it was an external incident of some kind.
    • Secondly, a large number of ships in the area reported identical or very close locations. This is a symptom of a large-scale spoofing attack. If it was a low-level jamming attack, then any misleading positions reported by vessels would typically have some randomness to them.
    • Thirdly, ships reported that their positions would periodically “jump” from the true location to the incorrect location. Again, this is very typical behavior in some spoofing experiments: For various reasons, GPS receivers may temporarily lose lock on a spoof set of satellites, and then reacquire  the real ones, and vice versa. This causes the characteristic random flipping between two well-defined locations.

    If we accept that a GPS spoofing attack did occur, it brings us to the million-dollar question.

    Who did the spoofing, and why?

    What I’ll do here is a bit of a lightweight analysis exercise using public information and basic physics, and you can formulate your own conclusions.

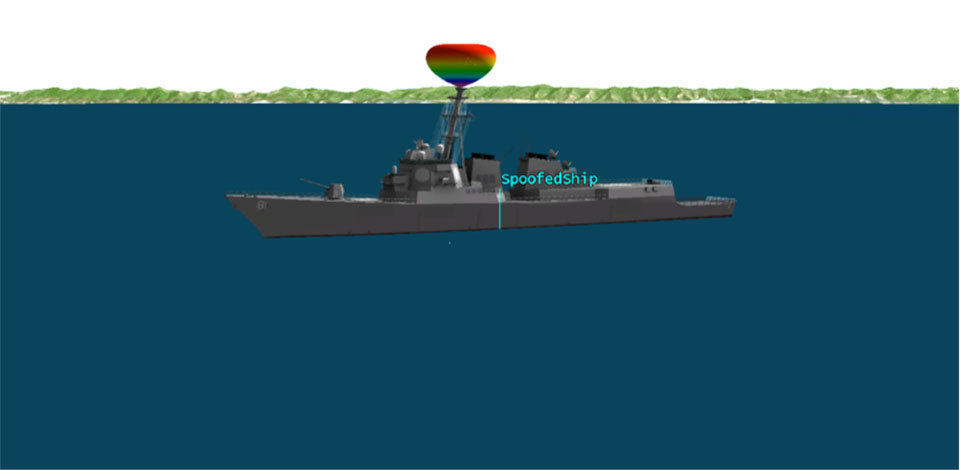
    Let’s start by placing a ship, located in the Black Sea at 44°14.0’N 037°43.1E, which is the actual position of one of the reported spoofed vessels. For this example, I have placed a representative GPS antenna on the ship’s mast, with its antenna pattern shown.

    Figure 6. Victim ship in the Black Sea, with GPS antenna pattern shown. (Image: Michael Jones)

    To get a rough handle on the scenario, consider the possible propagation of the spoofing signal. As a first-order approximation, let’s assume a standard 4/3 Earth refraction model, with obstruction by terrain. That’s a reasonable assumption at this frequency: Any obscuration by terrain will block the spoof signal. Let’s also initially assume that our GPS antenna on the ship is mounted 38 meters above sea level, and our spoofing equipment is mounted on a mast 20 meters aboveground. From this information, we can plot a map of possible spoofer locations for this particular incident (Figure 7).

    Figure 7. Possible spoofing source locations. (Image: Michael Jones)

    The first thing we might conclude from this is that the spoofing indeed originates from Russian territory, close to the Black Sea coast. To spoof the ship from further afield would require a much higher antenna, or even an airborne antenna. Which, of course, is possible, but then we would also expect vessels over a much wider area to report interference.

    To me, it’s fairly conclusive that spoof GPS signals are being transmitted from this area, to make GPS receivers in the area think they are at an airport. The final question is: “Why would someone do this?” To answer this question, we must resort to educated speculation. Why would you want to spoof GPS receivers into thinking they are at an airport?

    There’s one explanation that fits very nicely: drone defense. Many drones, especially those operated by casual users, have geofencing rules that prevent flights over airports and other restricted areas. So, if you were trying to perform aerial surveillance of the Russian border, your drone may suddenly think it was over an airport, and take action accordingly. The action taken depends, of course, on how the drone is programmed, but often includes “land immediately” or “return to launch point.” Certainly some of the drones we operate will immediately attempt to land if they find themselves in restricted airspace.

    So if your drones are falling into the sea, you now have one idea why.

  • Discussing the new North American-Pacific Geopotential Datum of 2022 — Part 3

    Discussing the new North American-Pacific Geopotential Datum of 2022 — Part 3

    My last e-newsletter column discussed the basic foundation parameters of the North American-Pacific Geopotential Datum of 2022 (NAPGD2022); that is, a global geopotential model, the GRAV-D project, and the GEOID2022 geoid model. It emphasized that NAPGD2022 will provide a more efficient and cost-effective way to maintain consistent orthometric heights, but evaluating the relative accuracy of the geoid model is critical to a successful implementation of NAPGD2022. Performing GNSS/Leveling evaluation surveys will help in evaluating the relative accuracy of GEOID2022. NGS realizes that users will still have the need to perform leveling to obtain millimeter-level accuracy between closely spaced stations, and to evaluate the relative accuracy of a geoid model. NGS is developing geodetic routines and tools to assist users in transforming heights from NAVD 88 to NAPGD2022, and enabling the incorporation of geodetic leveling data into NAPGD2022 to establish NAPGD2022 orthometric heights. This newsletter will highlight NGS’ current plans for estimating NAPGD2022 GNSS-derived orthometric heights and incorporating geodetic leveling data into NAPGD2022 to establish orthometric heights consistent with GNSS-derived NAPGD2022 orthometric heights. Dan Gillins and Kandell Fancher did an excellent presentation titled “Leveling after 2022” at the 2017 Geospatial Summit. This e-newsletter will highlight some sections of the presentation.

    First, it should be noted that NAVD 88 was realized by leveling and water-level transfer data only. To assist users in performing geodetic leveling surveys, the Federal Geodetic Control Subcommittee (FGCS) documented standards and specifications for performing geodetic leveling surveys (See Standards and Specifications for Geodetic Control Networks and FGCS Specifications and Procedures to Incorporate Electronic Digital/Bar-Code Leveling Systems). To support users to estimate consistent NAVD 88 heights using their leveling data, NGS developed a web tool called LOCUS (Leveling Online Computations User Service). LOCUS applies the appropriate corrections to the leveling data and performs a least-squares adjustment to estimate NAVD 88 heights based on user constraints. (See box “Excerpt from NGS’ LOCUS web tool” below.)

    Excerpt from NGS’ LOCUS web tool

    To support users to estimate NAVD 88 GNSS-derived orthometric heights, NGS developed guidelines and procedures for incorporating GNSS-derived orthometric heights into NAVD 88. (See NGS Constrained Adjustment Guidelines and Guidelines for Establishing GPS-derived Ellipsoid Heights.) These guidelines and procedures have been discussed in my previous GPS World Survey Scene e-newsletter series.

    As described in my last e-newsletter, NAPGD2022 will not be realized with leveling data. So, how will users access the National Spatial Reference System (NSRS) in 2022? NGS has prepared frequently asked questions about the new datums (https://www.ngs.noaa.gov/datums/newdatums/FAQNewDatums.shtml#CAN ). The following is the answer to the question How will accessing the National Spatial Reference System (NSRS) change with the release of the new datums?

    How will accessing the National Spatial Reference System (NSRS) change with the release of the new datums?The NSRS will be accessed using Global Positioning System (GPS) technology that references Continuously Operating Reference Stations (CORS) and relies on a time-dependent gravimetric geoid model. This method of accessing the NSRS is a paradigm shift from accessing NAD 83 and NAVD 88 through the use of geodetic survey marks.

    As described in previous newsletters, GNSS-derived Orthometric Heights are computed using the following formula: orthometric height (H) = ellipsoid height (h) minus geoid height (N). (See box titled “Slide 9 from Gillins and Fancher presentation titled ‘Leveling after 2022’ presented at the 2017 Geospatial Summit.”) It will not be necessary to connect to a geodetic monument, i.e., a bench mark, because the NATRF2022 ellipsoid height (hNATRF2022) is determined using the NGS CORS and the geoid model (NGEOID2022) is consistent with NATRF2022. In other words, GNSS observations combined with the geoid model will become the primary means for deriving orthometric heights on marks.

    Slide 9 from Gillins and Fancher presentation titled “Leveling after 2022” presented at the 2017 Geospatial Summit

    Gillins and Fancher addressed the expected relative accuracy of a 2022 NAPGD2022 GNSS-derived orthometric height difference in slide 11 of their presentation. (See box titled “Slide 11 from Gillins and Fancher presentation titled “Leveling after 2022” presented at the 2017 Geospatial Summit.”) Their estimation assumes a 1 cm sigma for each ellipsoid height value and 1 cm sigma for the relative geoid height value. This results in an estimated relative accuracy of a NAPGD2022 GNSS-derived height difference of +/- 1.7 cm. Gillins and Fancher also addressed the expected accuracy of leveling-derived heights in their slide 12. (See box titled “Slide 12 from Gillins and Fancher presentation titled “Leveling after 2022” presented at the 2017 Geospatial Summit.”)

    Slide 11 from Gillins and Fancher presentation titled “Leveling after 2022” presented at the 2017 Geospatial Summit

    This slide is just meant to give an idea of the error budget of GNSS leveling. Actually, if both stations are observed simultaneously, then there is a correlation term that must be tracked and added to the equation for sigma delta H. Further, the value for sigma delta N is poorly understood over very short distances (which are typical for leveling). However, it is reasonable to assume that differences in orthometric height of approx. 2 cm can be achieved with GNSS and a geoid model. The point is to say differences in height are to around 2 cm when only using GPS+geoid

    Slide 12 from Gillins and Fancher presentation titled “Leveling after 2022” presented at the 2017 Geospatial Summit

    Comparing slides 11 and 12, it’s obvious that leveling-derived orthometric height differences are more accurate than GNSS-derived orthometric height differences between closely spaced stations. NGS recognizes that some users will require a high level of relative accuracy and will continue to perform leveling; and, therefore, they will want their leveling-derived orthometric heights consistent with NAPGD2022. Gillins and Fancher’s presentation stated that NGS has ongoing research to develop models to combine and adjust GNSS-derived heights and/or observations with leveling, and to develop software applications and tools for incorporating leveling-derived heights into NAPGD2022. NGS has performed some preliminary tests of adjusting GNSS derived heights with leveling data using weighted constraints. Slides 16-18 from Gillins and Fancher presentation titled “Leveling after 2022” presented at the 2017 Geospatial Summit” depicts the basic concept.

    The basic concept is that the user will first establish NAPGD2022 orthometric heights at two stations using GNSS observations and a geoid model. Then, the user will observe leveling height differences between the two stations (see box titled “Slide 16 from Gillins and Fancher presentation titled “Leveling after 2022” presented at the 2017 Geospatial Summit”), and finally the user will perform a least squares adjustment to estimate NAPGD2022 orthometric heights using appropriated weighted constraints of the NAPGD 2022 GNSS-derived orthometric heights and appropriated weighted leveling observations (See box titled “Slide 18 from Gillins and Fancher presentation titled “Leveling after 2022” presented at the 2017 Geospatial Summit.”).

    Slide 16 from Gillins and Fancher presentation titled “Leveling after 2022” presented at the 2017 Geospatial Summit
    (Before Adjustment)
    Slide 18 from Gillins and Fancher presentation titled “Leveling after 2022” presented at the 2017 Geospatial Summit
    (After Adjustment)

    We will address this topic in more detail in another newsletter but the major takeaways are given in slide 22 from Gillins and Fancher presentation titled “Leveling after 2022” presented at the 2017 Geospatial Summit. Basically, the GNSS and a high-accuracy geoid model connects the user to NAPGD2022 and provides the overall network accuracy, and the leveling data improves the accuracy of height differences between marks and provides the local accuracy. The addition of leveling with GNSS increases the overall redundancy in a survey network which increases the ability to detect outliers and improves the relative accuracy of the final adjusted height differences.
    To assist users in obtaining accurate relative NAPGD2022 height differences, NGS has plans to develop software applications and tools for incorporating leveling-derived heights into NAPGD2022. They have a project called “OPUS-Projects for GNSS & Leveling.” The box titled “Slide 25 from Gillins and Fancher presentation titled “Leveling after 2022” presented at the 2017 Geospatial Summit” is a mockup of the proposed tool. This tool will apply the appropriate corrections to the leveling data and perform a least-squares adjustment to estimate NAPGD2022 heights based on weighted constraints.

    Slide 25 from Gillins and Fancher presentation titled “Leveling after 2022” presented at the 2017 Geospatial Summit

    This newsletter focused on NGS’ current plans for estimating NAPGD2022 GNSS-derived orthometric heights and incorporating geodetic leveling data into NAPGD2022 to establish orthometric heights consistent with GNSS-derived NAPGD2022 orthometric heights. It emphasized that after NAPGD2022 is established, the primary means for deriving orthometric heights on monuments will be using GNSS observations combined with the geoid model. Future newsletters will discuss in more detail some of NGS’ ongoing research to develop models and tools to combine and adjust GNSS-derived heights and/or observations with leveling.

  • Father of consumer car navigation addresses ION GNSS+

    In-car navigation before GPS satellites — that’s just one of the legacies of Stan Honey, who discussed his life and career during his keynote speech at the ION GNSS+ 2017 plenary.

    The ION GNSS+ trade show and conference is being held Sept. 26-29 in Portland, Oregon.

    The Etak company was founded in 1983 (and eventually acquired by TomTom.) The Etak navigation system debuted in 1985. Honey described how he was working at SRI International when he went yacht-sailing with Nolan Bushnell (Honey isn’t just an engineer — he uses practical navigation skills in world-class yacht races.) Bushnell founded the Atari company, and created the game Pong (which this writer remembers playing almost as much as Tank.)

    Honey explained that Bushnell was impressed by his yacht navigating and his electronics know-how, and wondered if he had other ideas. Bushnell ended up providing seed money for a new firm named after a Polynesian term for navigation: Etak.

    The Etak navigation device used dead-reckoning sensors and digital mapping databases stored on tapes to create a device that provided 50-meter accuracy and displayed position as a vector image. Its development resulted in more than one patent, including one for map-matching.

    Honey sold Etak to News Corp, and began working for them as a chief technical officer. He create his own R&D department within News Corp, which in 1994 developed a way to track hockey pucks visually for National Hockey League (NHL) games. Long-time fans hated it, but those new to hockey, or casual viewers, appreciated being able to see the tiny puck on pre-high-definition TVs. The puck itself had a tracker inside. Honey was concerned that it might come apart at some point, with only half of it going into the net and causing a scoring controversy. It never happened.

    More popular than the NHL puck tracker was the yellow line for the National Football League (NFL). The yellow line indicating first down was the first product of Sportvision, a company Honey founded in 1998. The 1st & Ten computer system has since become standard in college and professional football broadcasts.

    The 1st and Ten line displays the yard line needed for a first down during an ESPN Sunday Night Football broadcast.

    While it might look straightforward to add a yellow line to a broadcast, it took creating digital elevation models of the fields, which aren’t flat, but gently curved to provide drainage. That means the white yard lines aren’t straight, so the yellow line has to conform to them. A chromakey keeps the line from overlapping players. the cameras broadcasting the games are attached to bleachers, which vibrate when fans get rowdy, so each camera now compensates with a fiber-optic gyro on a tripod, calibrated by Sportvision.

    Major League Baseball came next. Baseball officials wanted no part of the K Zone technology, which tracks the baseball — until they discovered it was verifying their calls. In three weeks, the umps became the system’s biggest advocates, insisting it be installed in all ball parks.

    Another popular Sportvision product appears in broadcasts of NASCAR races. RACEf/x creates virtual flags above the cars to make them easier to follow. Beginnng in 2001, a Sportvision-developed electronics package has been installed in every race car. A NovAtel RTK receiver and Honeywell sensors tell viewers which car is which. As Honey said, the system “takes something hard to see and makes it easy to see.”

    For the Olympics, the company provided a new yellow line, this one marking the record-winning speed or finish. It also dressed things up, such as placing national flags in the lanes of speed skaters. The flags look like they’re under the ice.

    Sportvision has won several Emmy Awards for its innovations in sports broadcasts.

    Meanwhile, Honey also pursued his yachting ambitions, winning the Jules Verne Trophy in 2010 for the fastest circumnavigation of the world with a yacht. The 2010 America’s Cup winner, Larry Ellison of Oracle, encouraged the creation of LiveLine, a graphics system for yacht racing. A grid of 100-meter lines makes the previously indecipherable course look like a football field, making it much clearer which craft is nearing the finish line.

    The LiveLine System overlays geo-positioned lines and data streams at an accuracy of within an inch on live racecourse video shots taken from helicopter and water-based craft. (Image: Sportvision)

    LiveLine was first used for the 34th America’s Cup in San Francisco Bay in 2013. It uses a NovAtel SPAN-CPT GNSS/INS receiver and a KVH CNS 5000 inertial navigation system.

    Honey will be attending the conference, and invites anyone with questions to talk to him.

  • Big news from Broadcom: 30-cm positioning for consumers

    Big news from Broadcom: 30-cm positioning for consumers

    All the time I was working in the precision GNSS sector, our view of things was that we had an advantage — the technology for dual/multiple frequency was hard to do. It took years to develop and perfect robust L2 codeless tracking to enable its use in everyday challenging applications.

    So we were always looking to see who was claiming what, and waiting for the technology gap to narrow as lower accuracy providers improved performance.

    Then came L2C, which commercial providers seemed to virtually ignore, presumably causing much frustration for the GPS program office. L2C is still not a frequency in the international navigation protected band, so interference from regular commercial sources is unregulated — probably not a good long-term bet.

    But L5? Now that’s protected, and it’s the coming second frequency for not only GPS, but also Galileo (E5a). Even the Indian IRNSS system and Japanese QZSS both use the L5 frequency. So the expectation in high-precision land has always been that soon L1/L5 receivers would start to show up and start to erode the high-end market from the bottom up.

    BCM47755 uses two different frequency signals from each satellite. (Image: Broadcom)

    Well, Broadcom has just announced a new L1/L5 GNSS chip aimed at the mass market for cellphones. The chip incorporates a complete RF-to-pseudorange receiver and dual-core processing engine that currently produces data for positions and velocities, and generates ionospheric corrections from L1/L5 GPS and E1/E5a Galileo.

    Dual-frequency receiver and dual processor in Broadcom’s new L1/L5 chip.

    Why bother, when neither the L5 GPS nor Galileo constellations are fully deployed? It just so happens that there are now around 30 satellites broadcasting both frequencies, so at any one time, according to Broadcom, there are about eight  in view for a large portion of locations around the world.

    That’s plenty from which to gather all the dual-frequency signals and derive the data needed to get to 30-centimeter-accurate positions most of the time. And the chip also digs carrier phase out of these signals for dual-frequency processing and detecting cycle slips to improve positioning reliability — bad satellites are discarded from the position solution.

    So, what does taking positioning from 5 meters with L1-only (Broadcom 4774 chip) to 30 centimeters with L1/L5 (Broadcom BCM47755 new chip) do for OEM manufacturers? Without external sensor aiding, you can get lane-departure warnings for cars; with more satellite visibility, it enables much-improved down-town navigation.

    Probably the biggest gain is in reduced power consumption. With 28 nm geometry, the new chip uses 50 percent less power: “current consumption during GNSS tracking can be lower than 5 mA,” claims Broadcom. The question is will the price for OEMs be similar to what they already pay for L1 chips? Broadcom says this will probably be the case.

    The new chip has already gone through one re-spin as a result of initial testing, and is currently available in sample quantities with production to start “early next year.” Broadcom’s current Tier 1 customers are each at various stages of evaluation, so next year’s cellphones may well incorporate 30-cm positioning.

    Who can say where else this remarkable chip may find a home? Any OEM wanting a quick way to an L1/L5 receiver might want to incorporate it. Or maybe it could aid reliability if added to automotive lane departure warning systems – who knows?

    This is just the first mass-market dual-frequency chip receiver announcement. Could there be other developments already underway by other mass-market chip-makers?

  • Expert Opinions: Ensuring full utility while evolving GNSS

    Q: How can the safety, security, and full utility of GNSS applications be ensured while evolving to the best and most efficient use of limited and extremely valuable electromagnetic spectrum?

    Mitch Narins, principal consultant, Strategic Synergies, LLC

    A: (1) Agree that “No electromagnetic spectrum use will be approved, now or in the future, that impacts GNSS PNT users.” – a common mission statement essential to establishing trust!

    (2) Determine how best to migrate today’s GNSS PNT users to be more resilient to both interference and planned future adjacent band services.

    (3) Provide detailed architectures, network layouts, and implementation plans for rollout of new adjacent band services compliant with (1) and supportive of (2).


    John Fischer, VP, Advanced R&D, Orolia/Spectracom

    A: We cannot ignore fielded legacy systems, but neither can we chain ourselves to old technology and hinder progress.

    Spectrum usage cannot be solved by less regulation, but it can be with innovative regulatory ideas adhering to minimalist principles. For example, would a “cash for clunkers” program work to eliminate weak receivers from the field to enable more efficient spectrum use?

    This is one of those situations where government involvement can spur an innovative solution.

  • GPS World staff travels to industry’s largest trade shows

    GPS World staff travels to industry’s largest trade shows

    In Portland, Oregon, and in Berlin, Germany, the two largest and most important international conferences on GPS, GNSS, PNT, survey, mapping and geodesy take place this year on exactly the same dates — just 5,177 miles apart. Now that’s bad timing. Our strategy is to divide our forces and send key personnel to interact with industry leaders at each gathering — to bring you the news and developing stories you need to keep on the forefront of change.

    If you’re at ION GNSS+ or Intergeo, look for these faces, come up and introduce yourselves. We want to talk with you! If you’re not fortunate enough to attend either conference, look to our website, newsletters and this magazine for product launches, videos and in-depth stories filed from the developing frontiers of PNT. We’ll be reporting !!Live!! and for weeks, even months, to come.

    Attending Intergeo in Berlin:

    pit & quarry
    Burch
    pit & quarry
    Barwacz
    pit & quarry
    Joyce
    pit & quarry
    Gerard

    Tim Burch is our survey editor; in his day job he’s a professional surveyor and board of directors secretary of that profession’s national society.

    Allison Barwacz is digital media content producer for North Coast Media (NCM, that’s us) with a passion for videography and writing.

    Mike Joyce and Ryan Gerard, senior account manager and account manager, respectively, work closely with our marketing partners, who make this magazine and multi-media communications channel possible.

    Attending ION GNSS+ in Portland:

    pit & quarry
    Stoltman
    pit & quarry
    Whitford
    pit & quarry
    Mitchell
    pit & quarry
    Cozzens
    pit & quarry
    Harms
    pit & quarry
    Sabau
    pit & quarry
    Limpert
    pit & quarry
    Cameron
    pit & quarry
    Langley

    Kevin Stoltman is founder and president of NCM, with a distinguished career in business-to-business publishing.

    Marty Whitford is editorial director and publisher; earlier, he actually worked at GPS World and attended ION-GNSS 2004.

    Michelle Mitchell is account manager for GPS World and senior marketing and event manager for NCM. She knows the GPS industry landscape and players extremely well.

    Tracy Cozzens is our managing editor, with her hands on all the controls.

    Joelle Harms is an award-winning digital media manager, focused on content planning and creation.

    Joe Sabau is an account manager with a keen eye for market trends.

    Kelly Limpert is a digital media content producer developing a strong online and social media presence for all of our partners.

    Richard Langley is GPS World’s innovation editor and a professor at the University of New Brunswick.

    And myself. All together, we are your A-team!

  • How GPS was affected by the solar eclipse

    How GPS was affected by the solar eclipse

    I had my special ISO-certified glasses ready. Living in Oregon, I wasn’t about to miss the once-in-a-lifetime chance to see a total eclipse of the sun.

    On Aug. 21, my family drove a few miles north to get into the path of totality, which for us lasted about a minute. It was definitely worth the field trip.

    Besides regular folk like me, experts in numerous fields turned their eyes — and their instruments — to the eclipse.

    The National Center for Atmospheric Research took to the air with a Gulfstream V fitted out with sensors and equipment for atmospheric research. The flight gathered data about the sun that can’t be collected from the ground.

    With better instruments than ever before, for the first time scientists had the chance to observe the corona in the infrared spectrum, which may provide insight into the sun’s magnetic fields.

    Back on terra firma, atmospheric scientists closely monitored changes in temperature and other weather effects. The temperature dropped as much as 7 degrees in Crossville, Tennessee, reports the National Weather Service.

    Scientists at zoos and aquariums across the country closely watched animal behavior during totality. Species exhibiting unusual behavior included elephants, hippos, crocodiles and penguins.

    As for GPS, experts from the NASA Jet Propulsion Laboratory, NASA HQ Earth Science Division and the University of New Brunswick kept a close eye on the event, collecting data from GPS receivers and other ionospheric monitoring tools to better understand exactly how the ionosphere reacts to a total eclipse of the sun.

    The scientists found a “decrease in the number of free electrons in the part of the Earth’s ionosphere along the eclipse path where sunlight was temporarily blocked by the moon…

    “TEC [total electron content] time series from two continuously operating GPS monitoring stations near the path of totality…show a small dip of about 2 TECU [TEC units] or so around 18:00 UTC on Aug. 21, coincident with the timing of the eclipse.”

    The eclipse also affected WAAS real-time correction data from geostationary satellites.

    While study of the data continues, it’s clear that GPS easily withstood the eclipse. Learn more here.

  • GIS plays growing role in most counties

    Report from the National Association of Counties (NACo) Annual Conference, July 21-24, Columbus, Ohio.

    Main hall of the NaCo Conference. (Photo: Art Kalinski)
    Main hall of the NACo Conference. (Photo: Art Kalinski)

    After retiring from the Navy in 1993, my first GIS-related position was with the Atlanta Regional Commission (ARC). I was tasked with building the agency’s GIS and promoting GIS within the 10 member counties.

    Some of our counties were excited about building their own GIS capability. But some were timid if not hostile toward the new technology because of horror stories heard from a few early adopters in other parts of the country. I soon understood why.

    Horror stories for county GIS efforts

    Some of those counties were victims of ambitious sales representatives. The sales reps talked them into a GIS “dive into the deep end.” They recommended flying and collecting ortho imagery of the entire county, contracting for creation of data layers such as streets and parcels, buying ArcInfo running on Unix stations and hiring a GIS manager who was most likely the only one in the county who could run the GIS.

    Then the fun began. There was a shortage of Unix/ArcInfo programmers, so head hunters had a field day tempting GIS managers to jump ship for higher salaries. This played havoc with some counties that had only one person able to run the GIS. Those counties found themselves in the position of not even being able to print out simple maps despite an investment of several hundred thousand dollars.

    Hearing those horror stories, we acted quickly at ARC to make sure our counties understood the issues. We helped them by publishing some Atlanta regional data such as streets, hydrography, land-use and imagery on DVDs that could help our counties get started cheaply.

    We also set up an ArcView Learning Center and trained more than 1,200 individuals in the entry-level GIS. This helped counties avoid some of the early and costly pitfalls by starting small and simple using readily available free GIS data.

    It took years to shake the bad image that some had formed about GIS being too complicated. With that early experience I was happy to see that GIS had finally settled into playing a key role in county operations.

    Today, with revenue being so important, GIS is well established in most county tax assessor operations and online access is available. However, other potential county users are still somewhat hesitant to adopt the technology. A significant portion of the conference and exhibitors were focused on new applications and users of GIS.

    Key topics at NACo

    I attended the National Association of Counties (NACo) Annual Conference and Expo, held July 21-24, in Columbus, Ohio.

    The conference was very well attended with a surprising amount of time devoted to geospatial issues. GIS and related technologies are clearly major tools for most counties, with use and importance growing each day.

    Key topics discussed at the GIS sub-committee included use of GIS by first responders, unmanned aerial systems (UAS), tackling the opioid crisis, public access and even new developments in artificial intelligence (AI), virtual reality (VR) and augmented reality (AR).

    Highlights of the NACo Expo

    The expo area had a wide variety of vendors ranging from first responder/public works hardware, to accounting software, human resources software, legal and medical services support. My focus was several exhibitors in the geospatial field who were working to make GIS more accessible primarily to first responders.

    Esri

    The geospatial “500-pound gorilla” has its technology in almost every county in the United States and is working to make GIS even more accessible to all county departments. Esri had a large booth at NACo — in the following video, Philip Mielke explains some of the latest tools of interest to counties including police, fire, opioid response, public works, economic development, drone data collection and even virtual and augmented reality.

    I was hoping to see a demonstration of Esri’s photos-to-3D-model data-collection system, but the weather was too severe to venture outside the building. Last year, I did see their “drone to map” capability that spawned this system, so it should work well.

    National Aeronautics and Space Administration (NASA)

    I was surprised to see that NASA had a large display at NACo. Although not trying to sell anything, the booth was informational so other counties understood the impact on counties where NASA has a presence.

    Todd May, the director of the Marshall Space Flight Center in Huntsville, Alabama, explained that most people think that NASA’s efforts are focused in only a few locations. In reality, more than 43 states are involved in the space effort producing hardware, software and capabilities needed by NASA.

    As a side note, one of his staffers explained that Huntsville — which has the highest per-capita number of master’s degree holders, Ph.D.s and engineers of any city in the nation — also has more than 70 geospatial firms in the city.

    GlobalFlyte

    An exhibitor that especially caught my attention because of its number of innovations was an Ohio geospatial firm called GlobalFlyte.

    GlobalFlyte is working with the Air Force Research Lab (AFRL) to bring some AFRL innovations into the public sector. Working with Esri and Pictometry/Eagleview, GlobalFlyte augments GIS data and oblique imagery with live UAS video.

    One source of the video was from a tethered UAV; the tether permits an off-the-shelf drone to say aloft for hours.

    GlobalFlyte also showed off a fast-deploying compact mast for communications, lights or video cameras called a zippermast. As implied by the name, three coils of spring steel “zipper” together to create a rigid self-rising three-sided mast.

    The company also uses the Plum Case “network in a box” that I saw a GeoHuntsville last year to provide Wi-Fi and cellphone service in devastated or very weak service areas.

    The most impressive part of GlobalFlyte’s solution is the seamless integration of the above resources with an innovative radio communications management system developed by AFRL to clear up the chaos of complex fast-paced military communications. The solution creates a 3D-like aural environment that separates and clarifies multiple radio conversations by putting them into a 3D space.

    Wearing the earphones significantly reduces the confusing radio traffic by creating a 3D-like spatial environment. It’s surprising how the human ear can separate and focus on specific conversations like we naturally do in a crowded room.

    The same audio was also simultaneously transcribed and displayed as text on the geospatial display screen with surprising accuracy.

    Ricoh

    Until the capability became ubiquitous on most smartphones, Ricoh offered the first affordable digital camera in the ’90s with built-in GPS that stamped each photo with a location. This facilitated the mapping and linking of photos to a GIS layer.

    Ricoh still makes high-end digital cameras with both GPS and barcode reader accessories to facilitate data capture; however, at NACo, the company demonstrated a Virtual Self-Service Hologram.

    Although labeled a “hologram” by Ricoh, this is really a rear-projected image that acts as a virtual receptionist. It’s similar to a point-of-sale projector I saw last year at the eMerge trade show.

    The difference with the Ricoh unit is that it interacts with the viewer in real-time to provide information based on the needs and input of the viewer.

    Blue Marble Geographics

    Blue Marble Software tools support many different GIS data types (raster and vector) while serving as an all-in-one solution for data creation, visualization or conversion. Global Mapper GIS permits county employees with just a basic knowledge of GIS to develop and manage a fully functional GIS easily and at low cost to the county.

    The U.S. Geological Survey, Federal Emergency Management Agency and Census Bureau also had booths explaining data products and services offered by the federal agencies.

    Side Note

    There was an interesting start-up food vendor in the Columbus Conference Center food court that may be a sign of things to come. They grow their own produce, on-site hydroponically. Top on their list were tomatoes, greens and some fruit. The vendor, “Homegrown Market,” is not fully operational yet but was attracting a lot of attention.

  • The day GPS went away

    The day started like any other day. The land surveying crew loaded up their vehicle, equipment and marching orders to tackle the next project on the list.

    This field party is like most surveyors across the globe — they are equipped with the latest surveying technology including GPS base and receivers, robotic total station and a UAS for aerial photography. These tools are necessary to be competitive in today’s surveying arena as speed and productivity are paramount to the success of the project and the company.

    But on this day, any device with the ability to determine geographic location via satellite reception was rendered useless.

    Today became known as the day that GPS went away.

    How we  became dependent on GPS

    Let’s back up the story to the introduction of GPS and how our dependency on this technology came to be. With the invention of satellites culminating with the Russian effort to launch Sputnik, the United States became involved in a “race to space.” Our early efforts to use satellites were proven worthy with the successful ability to track submarines by reception of radio signals and trilateration.

    Further enhancements through research resulted in the development and creation of the NAVSTAR satellite in 1978. By 1993, 24 satellites were in orbit to make the GPS system fully functional (NASA.gov).


    Meanwhile, the Russians were committed to a satellite network for navigational purposes during the same time period. The first satellite, Kosmos-1413, was launched in 1982 with the full 24 satellite constellation becoming operational in 1995.

    Together, these systems (known as global network satellite systems or GNSS) allowed for location and navigation abilities never thought possible, and the surveying community began its adoption of the technology.

    Early survey adopters of GPS were usually large engineering firms, state departments of transportation (DOTs) and federal agencies that could afford the large financial commitment to the equipment (both GPS and computers), software and computing costs required to use the technology.

    The data-collection times were long, and the software analysis required enormous patience and extensive mathematical knowledge, but the results were beyond what the everyday surveyor had ever before accomplished.

    Significant distances could now be measured with the same or better accuracy than taping or using an electronic distance meter could have provided. The true revolution came when real-time kinematic (RTK) GPS was invented and was affordable to the everyday surveyor (GPS World, May 2016).

    S/A and A-S

    Most GPS users, especially operators of survey-grade receivers, are not aware of the early days of satellite navigation and the military’s use of selective availability, otherwise known as S/A (GPS World, Sept/Oct 1990). This methodology was implemented by the Department of Defense (DoD) on May 25, 1990 to limit accuracies for non-military GPS users.

    This procedure was created to allow erroneous timing at random occurrences throughout transmission of satellite radio signals. These variations in timing more than negatively tripled the normal precision of an autonomous GPS position calculation, all in the name of introducing uncertainty to potential enemy users.

    And if S/A wasn’t enough, the DoD also could implement another deterrent called anti-spoofing (A-S) and encrypt the precision or P-code of the satellite signal. The big factor here is that the general public (in our case, the surveying community) didn’t know if or when A-S was turned on. These factors were frustrating to the GPS user, so data collection and coordinate determination became a tedious operation.

    Early receiver use by surveyors relied on differential GPS data collection for high-accuracy location (<10 cm or better). This method consisted of placing one or more receivers on known positional points (usually on monuments published through the National Geodetic Survey) while simultaneously performing data collection on new points for positional establishment.

    Prior to S/A, the software utilized to analyze and reduce the data collection provided feedback on “bad” data, but there were usually environmental issues causing the problem (such as cycle slips and radio interference.) The software would highlight the suspect data for the reviewer to determine validity and acceptance.

    Because of the nature of differential GPS data collection, error checking remained the same once S/A was implemented. If the software calculated an incorrect coordinate at a known point, the same measurements to the new survey point were dismissed as a false reading.

    Surveyors were mostly left unfazed by S/A as real-time kinematic (RTK) and real-time network (RTN) follow a similar procedure utilizing a correction from a known terrestrial point. Even with the anti-spoofing activated, the surveying profession continued to use this high-tech location system that revolutionized long distance measurement. Things have been running along smoothly with steady improvement of receivers, data collectors, and data coverage until…

    The day it goes away

    …the unthinkable happens. Our national satellite system is no longer available.

    It doesn’t matter why GPS has gone away on this day. It could be for many different reasons: federal budgets; enemy interference such as geomagnetic disturbances (GMD) or electromagnetic pulse (EMP);
    conventional or nuclear war; interference from solar storms, asteroids, or comets; or the system just simply breaks.

    Artist’s rendering of a cross-section of the Earth’s magnetosphere. (IMAGE: NASA)

    Another thing for all users of GNSS to consider in these tumultuous times is how newer systems are integrating other countries’ satellite networks into their navigational observations.

    Our relationship with the Russian government can be on unsteady ground from time to time, so our use of their GLONASS signals must be reviewed for accuracy as well (See GPS World, August 2017).

    It won’t matter whether a spoofed satellite signal originates from a private Russian hacker or from their actual government; it will still lead to incorrect information and bad data. Imagine having to revise a plat because the GLONASS data was purposely corrupted!

    Obviously, the main reason they would allow transmittal of misinformation would be for military reasons, but I can only imagine their joy of messing with professional navigation and the recreational users in the U.S. These opportunities will also apply to the Chinese and Indian constellations, too.

    We’re not ready

    The bottom line is that we, the U.S., aren’t ready for it. Whatever may be the reason for the failure, we do not have a backup plan and have relied much too heavily on satellite navigation. Gone is our ability to navigate through our electronic devices, including smartphones, fitness trackers, in-car mapping and, yes, high-precision surveying equipment. These items have now become door stops and space wasters.

    This new conundrum doesn’t just stop with the surveyor and recreational GPS equipment. A significant amount of construction equipment relies on machine control, from bulldozers and road graders to high-rise cranes.

    This will also affect a large amount of agricultural equipment and processes. Those high-tech tractors with autosteer and computer-guided planters? Back to the drawing boards. So many things in our lives today are guided or controlled by navigational systems designed around GPS use, and the surveyor is squarely in this mix.

    What’s a surveyor to do?

    The first thought on the surveyor’s mind is now having to perform all surveying tasks with instruments that are not based on satellite navigation. Yes, the reason for this GPS shutdown isn’t widespread enough to affect cellphone signals and other radio communications, but it killed off the one navigation system more people rely on than any other.

    Because of this unfortunate shutdown, all GPS-based equipment is now worthless. This means your trusty RTN receiver with cellphone connection, your old base unit for those times when cellphone coverage is lacking, the fancy new UAV for taking orthophotography, and your cellphone or handheld GPS receiver for tracking down NGS monuments — all of them are done. Only your conventional equipment will complete the job.

    Is the surveying profession finished? How do we locate those remote section corners in the middle of nowhere?

    Don’t throw in the towel just yet. Surveyors have been measuring land using these types of instruments for centuries, with today’s versions being electronic and sophisticated. Robotic servos, mini computer-data collectors, efficient radio links and active tracking prisms have turned our forefathers’ simple transit into a sophisticated topographic or construction staking machine.

    Data collection is much easier than writing everything in a field book, and have graphical interfaces and remote connection capability to keep you in touch with the office from nearly anywhere. The reality, however, is that the surveyor will now have to use methods and equipment for traversing, data collections and all staking tasks that will greatly reduce our productivity and profitability.

    Experience could also end up being a big factor here as well. The average age of the professional land surveyor in the United States is 58 and climbing. This means most of these practitioners have been in the business well before GPS technology, so there is still the potential of surveying without the electronic birds in the sky.

    Surveyors can still hang their shingle and practice their craft, but we’ve now lost a big component of our world: geographical location. The key to the success of GPS was the ability to determine geographic location and subsequently convert that information into a data format compatible with one’s local system. From UTM coordinates to State Plane, the world became smaller with this technology.

    The surveyor can still determine latitude and longitude using manual surveying methods for specifically observing the sun and Polaris. The mathematics and procedures are complicated, but they still allow for determining a geographical location with high accuracy.

    We can also utilize the extensive geodetic monumentation networks established nationwide, all started around the formidable effort by the Coastal and Geodetic Survey. This key federal agency, later to become the National Geodetic Survey, laid the groundwork and set the monuments for the backbone of our national horizontal network system. This system has been augmented over the years by their own programs, as well as state and local authorities, to expand our coverage to all portions of the United States.

    By incorporating these monuments into a survey, a relationship to geographical datums is still easily obtained. While these methods of establishing geographical coordinates through use of conventional equipment sounds time consuming, without GPS and other satellite-based navigational aids, it will become much more cumbersome.

    So, what do we do next?

    Depending on which industry you are in or your necessary level of accuracy, several alternatives are being developed. For those in the shipping industry (including the trucking sector, which numbers more than 15 million vehicles), accuracy may only need to be nominal — for instance, 5 meters, give or take.

    Several systems are in development with the biggest priority on enhanced loran (short for “long range navigation”) or eLoran (also see GPS World April 2014 and GPS World Nov 2015). Several bills are currently being reviewed in the U.S. House and Senate for consideration of funding this technology.

    Differential eLoran operation concept (graphic courtesy Ursanav).

    Another government agency, the U.S.Defense Advanced Research Projects Agency (DARPA) has been exploring backup technologies for GPS for many years. Among the systems being considered are Adaptable Navigation Systems (ANS), Microtechnology for Positioning, Navigation, and Timing (Micro-PNT), Quantum-Assisted Sensing and Readout (QuASAR), Program in Ultrafast Laser Science and Engineering (PULSE) and Spatial, Temporal and Orientation Information in Contested Environments (STOIC) (love the government and their overuse of acronyms).

    These programs are still under development, but DARPA has been tasked with finding another system so our dependence on GPS will not cripple our defense in a time of war.

    Abraham Lincoln, the county surveyor — a statue at Lincoln’s New Salem State Historic Site, Illinois.

    Another alternative will be private satellite networks. With programs like SpaceX and Blue Origin, vehicles to carry new satellites into orbit are now a viable option. It will be possible for companies to create their own networks for private or commercial use.

    With the large number of construction, shipping and automobile sales, the day may come when the navigation system within each of these is proprietary. However, if we are faced with geomagnetic disturbances (GMD) or an electromagnetic pulse (EMP) as mentioned earlier, it won’t matter whose network it is — they will all be rendered useless.

    Until another viable option is created, the surveyor will be forced to take a step back in productivity and technology with conventional instruments. While not the most ideal thing, it will force the profession to retrain its entire workforce on procedures and methods that haven’t been regularly utilized for many years.

    For some, it will be like throwing away the computer for a typewriter or the remote control for the television set. For others, it will be an opportunity to truly “follow in the footsteps” of past surveyors. They will understand exactly how their predecessors went about “running the lines” and completing a true boundary survey.

    I, however, hope we don’t find ourselves in this situation, and that a suitable backup system or even a more advanced replacement for our antiquated GPS is invented soon.

    But if the day comes and our GPS goes away, I’m guessing that surveyors not having their favorite locating device will be the least of our society’s worries. It will truly be a day that will live in infamy.

  • QZS-2 signal analysis, QZS-3 launched

    QZS-2 signal analysis, QZS-3 launched

    This month we bring you a guest column by Steffen Thoelert, André Hauschild, Peter Steigenberger and Oliver Montenbruck of the German Aerospace Center (DLR) and Richard B. Langley of the University of New Brunswick.


    UPDATE: Since Sept. 10, continuously operating DLR receivers in Sydney, Australia, and Chofu, Japan, have been reporting measurements from QZSS satellite J07, which, according to the QZSS Interface Control Document, is the geostationary satellite QZS-3.


    The second satellite of Japan’s Quasi-Zenith Satellite System (QZSS) has started transmitting navigation signals. QZS-2, or Michibiki-2, was launched on June 1, 2017, and joins its predecessor QZS-1 (Michibiki-1), which has been in orbit since September 2010.

    Both satellites have been placed into inclined geosynchronous, elliptical orbits, which enable extended satellite visibility periods over Japan and are characteristic features for this regional navigation system.

    The third satellite, QZS-3, was launched on Aug. 19, 2017, into a geostationary orbit. If all goes according to plan, a fourth satellite in an eccentric orbit will follow by the end of this year and complete the constellation.

    QZS-2 Signal Tracking

    It is not straightforward to tell when QZS-2 started signal transmission exactly. About four weeks after launch, on June 27 between 10:17 and 12:37 UTC, several Septentrio PolaRx GNSS receivers in the Asia-Pacific region recorded continuous L5 observations. About one week later, on July 4 shortly after 03:02 UTC, Javad and Trimble receivers picked up L1 C/A and L5 signals from QZS-2 for a few seconds. Then again, between 23:03 UTC on July 6, and 01:36 UTC on July 7, several receivers intermittently tracked the L1 C/A, L2C and L5 signals. Finally, on July 10, starting at approximately 01:03 UTC, these three signals were continuously tracked until approximately 04:00 UTC on July 12. Up until Aug. 1, signal tracking had remained intermittent, but has been stable since. This was presumably the result of interruptions in the signal transmission due to test activities.

    Figure 1. QZS-2 signals tracked by GNSS receivers in Chofu, Japan, (top plot) and Sydney, Australia, (bottom plot). The plots depict the measured C/N0 for L1 C/A (black), L2C (red) and L5 (green) together with the observed pseudorange (grey). The frequent discontinuities in the pseudorange are due to the receiver clock adjustments. Both receivers exhibited a short tracking outage at approximately 06:00 UTC. The interruption in tracking at Chofu around 08:00 UTC is due to the low elevation angle of the satellite.

    The plots in FIGURE 1 show QZS-2 signals as tracked by GNSS receivers in Japan and Australia on July 10. The two first sets of broadcast messages were transmitted on July 16 at 6:00 and 7:00 UTC. Regular transmission of broadcast ephemerides started on July 27 at 22:00 UTC, but deviations from the hourly update rate still occur from time to time.

    Identical or Fraternal Twins?

    At first glance, QZS-2 seems like a look-alike of QZS-1, but there are many differences between the two spacecraft. Most apparent is the presence of an additional auxiliary antenna. Like QZS-1, QZS-2 transmits its navigation signals on the L1, L2, L5 and L-band Experiment (LEX) frequencies through the main antenna, while the augmentation signal L1S (formally known as Submeter-class Augmentation with Integrity Function or SAIF) is transmitted from a separate antenna. However, the new L5S signal, which is introduced with QZS-2, is transmitted with yet another antenna.

    The new satellite also has a shorter “wingspan” of only 19 meters, since it is equipped with two solar panel segments on each side, compared to three segments for QZS-1 with a width of 25.3 meters. The second QZSS satellite also follows a different attitude model: Unlike QZS-1, which switches between yaw-steering mode and orbit-normal mode depending on the sun’s elevation angle with respect to the orbit plane, QZS-2 always remains yaw-steering except for short periods of time when orbit maneuvers are performed. Further differences will become apparent in the analysis of the signal spectra in the subsequent sections.

    The Cabinet Office of the Government of Japan, which oversees QZSS as a national undertaking, has published QZSS satellite metadata information on its official website. At the time of writing, only one document for QZS-2 is available, which contains information about the satellite’s properties such as mass, dimension, attitude law and reference frame, but also antenna and laser retroreflector positions, antenna phase-center offsets and variations as well as signal group delays.

    Additional documents containing metadata for QZS-1, -3 and -4 and further information about QZS-2 are in preparation.

    Rubidium Clock

    FIGURE 2 illustrates the stability of the QZS-2 rubidium atomic frequency standard (RAFS) by means of the Allan deviation (ADEV). Data from a global network of 150 GNSS stations was processed to estimate GPS and QZSS satellite orbit and clock parameters.

    Figure 2. Allan deviation of the rubidium atomic frequency standards of GPS Block IIF satellite G32, QZS-1 (J01) and QZS-2 (J02).

    However, whereas about 60 of these stations provide QZS-1 observations, QZS-2 is only tracked by 13 stations. ADEV values for QZS-1, QZS-2 and a GPS Block IIF satellite were computed from a daily solution for Aug. 3 with 30-second clock sampling.

    At an integration time of 100 seconds, the QZS RAFS reaches an ADEV of better than 3 × 10-13.

    At longer integration times, the QZS-2 clock almost reaches the stability of the GPS Block IIF RAFS.

    Based on this preliminary analysis for only one day, the QZS-2 clock seems to perform as expected. The larger ADEV values compared to QZS-1 for integration times up to 1,000 seconds might be attributed to the significantly smaller number of tracking stations contributing to the QZS-2 clock solution. The quality of the clock solution will improve as soon as more stations are able to track QZS-2.

    Signals with High-Gain Antenna

    Complementary to the receiver measurements and analysis, the German Aerospace Center (DLR) has also recorded raw spectral and in-phase and quadrature (IQ) data of QZS-2 to get further insights into the transmitted signal structure and initial signal quality. FIGURE 3 shows a spectral measurement of the complete GNSS L-band frequency range, which shows the signal transmissions of QZS-2 in the L1, L2, L5 and L6 bands. The signal was captured with DLR’s 30-meter high-gain antenna at Weilheim, southwest of Munich, operated by DLR’s German Space Operations Center.

    Figure 3. QSZ-2 L-band normalized power spectra recorded at Weilheim, Germany, on July 18, 2017 at 20:43 UTC.

    This first view of the signal transmission shows a good spectral shape, appropriate band filtering and no out-of-band unwanted spurious emissions of the satellite. For further analysis, we looked closer at each signal-band spectrum and performed IQ-sample recording.

    Comparing the QZS-2 spectra to that of QZS-1, we see differences in the signal structure for the L1 frequency band.

    Figure 4. QZS-1 and QZS-2 L1 spectral flux density.

    FIGURE 4 shows the L1 spectra of both satellites. The additional signal component can be seen at an offset of 6 x 1.023 MHz and 18 x 1.023 MHz from the L1 center frequency of 1575.42 MHz. This is the result of the new L1C-pilot modulation, which is based on the time-multiplexed binary offset carrier (TMBOC) modulation technique using a mixture of BOC(1,1) and BOC(6,1). See here for detailed information.

    Another difference is present in the L6 band and can be seen within the signal time domain or the IQ domain. The new satellite transmits two components (one each for the I- and Q-channels) while QZS-1 transmits only one I-component. This observation is fully in line with the QZSS Interface Specification. On QSZ-2, an additional L6 signal component (Centimeter-Level Augmentation Message for Experiments, L6E) is implemented. FIGURE 5 shows the IQ constellation plots of QZS-1 and QZS-2 for the L6 band.

    Furthermore, the L5 band IQ plot of QZS-2 exhibits significant differences compared to QZS-1. These differences, which are illustrated in the plots of FIGURE 6, are due to an additional L5S signal transmitted by QZS-2.

    The QZS-2 L5 IQ diagram is fairly easy to understand as a coherent superposition of two distinct quadrature signals from two antennas. One signal is the GPS-like L5 signal transmitted from the main L-band antenna, while the other (L5S) signal originates from a new L5S antenna. This is illustrated in FIGURE 7.

    Figure 7. QZS-2 L5 IQ constellation plot including demarcation of the L5 and L5S signals.

    For illustration purposes, the dashed orange square in Figure 7 relates to the 10 MHz L5 signal, while the smaller red squares are the 10 MHz L5S signal.

    A code generator has been setup according the QZSS L5 and L5S interface control document (ICD). An analysis of the correlations of possible pseudorandom noise (PRN) codes resulted in the detection of PRN 194 and PRN 196. Based on the information in the ICDs, PRN 194 is used for L5 and PRN 196 is used for L5S.

    The performed code correlation analysis also yields the finding that the L5 signal is approximately 3.5 dB stronger than the L5S signal. Note, however, that both signals have a specified minimum receive power of -157 dBW. Due to the limited visibility of QZSS satellites from the Weilheim ground station, it is not possible to verify this value.

    Conclusion

    With the launch and activation of QZS–2, the deployment of Japan’s regional navigation system is moving forward again. The launch of a geostationary satellite, QZS-3, took place on Aug. 18. A fourth Japanese navigation satellite is scheduled to launch later this year. With this rapid  sequence, the target date of 2018 for the completion of an operational constellation with four satellites is quite realistic.


    Steffen Thoelert, André Hauschild, Peter Steigenberger and Oliver Montenbruck are from the German Aerospace Center (DLR).

    Richard B. Langley is from the University of New Brunswick and authors the monthly Innovation column for GPS World magazine.

  • The Great American Solar Eclipse of 2017 — GIS-style

    The media is buzzing about the Great American Solar Eclipse that takes place Monday, Aug. 21. 

    It’s a historic event that last occurred 99 years ago. To be clear, 99 years ago is when the last total solar eclipse traversed the entire continental United States (lower 48 states).

    To put that timeline in perspective, only one of the following inventions existed 99 years ago: FM radio, electric hair dryer, electric washing machine, frozen food, folding wheelchair and “talky” movies. Read further for the answer.

    The last total eclipse that traversed part of the United States was 38 years ago, but in 1979 the total eclipse was only visible in five U.S. states (Washington, Oregon, Idaho, Montana, North Dakota). Have a look at the following map of the 1979 total eclipse path through the United States.

    Figure 1- 1979 total eclipse path through the US. Source: NASA
    Figure 1- 1979 total eclipse path through the US. Source: NASA

    It’s painful to think that in February 1979, when this eclipse occurred, I was a junior in high school in Oregon, living right in the path of the umbra (the moon’s shadow). I don’t recall the 1979 solar eclipse, but that doesn’t surprise me given the mind of a 16-year-old, at least mine.

    Or, it could be the fact that was about 8:15 a.m. in February. Februaries in Oregon can be depressing due to the lack of sunlight. Anyway, it’s painful because today there are 37-year-old adults who were born after I graduated from high school. Time has flown by.

    One of the points I was going to make in this article is how much GIS technology has improved since the last total solar eclipse in 1979, but that was 38 years ago. Given Moore’s Law, it should have improved exponentially in the past 38 years, and it has.

    One way the evolution of GIS is displayed are the maps of the Great American Solar Eclipse of 2017. Let’s start with this basic one illustrating the path of the moon’s shadow as it traverses the United States:

    Figure 2 - Solar Eclipse 2017 path. Source: eclipse2017.org
    Figure 2 – Solar Eclipse 2017 path. Source: eclipse2017.org

    My office is in Lake Oswego, and my house is just east of Lake Oswego, as illustrated here:

    Figure 3- Solar Eclipse 2017 Oregon path. Source: eclipse2017.org
    Figure 3- Solar Eclipse 2017 Oregon path. Source: eclipse2017.org

    As you can see in the above map, my house and office are really close to the 100 percent eclipse path. In fact, using the following interactive map, I determined that from my house the sun will be 99.77 percent eclipsed.

    Figure 4- Interactive 2017 Eclipse Map (click to explore the map). Source: NASA
    Figure 4- Interactive 2017 Eclipse Map. Source: NASA

    Now, for some cool animations. Back in 1979 (even 2000), animations were tough to produce. With today’s computing power and software, it’s quite straight-forward and quick to produce high-quality animations. The following is a screenshot from a 48-second animation from NASA’s YouTube channel showing the path of the total eclipse.

    Figure 5- 2017 Solar Eclipse animation (click to play). Source: NASA
    Figure 5- 2017 Solar Eclipse animation. Source: NASA

    As GISers, you know that software is the engine. Engines need fuel to run. With GIS, fuel is data. For this next animation, two key pieces of data enable a new level of accuracy in plotting the umbra.

    The first is the topography (surface map) of the moon. It’s not as round as it appears from Earth. Its surface has jagged edges from varied terrain just like the Earth.

    The second is the vantage point on the Earth. In producing the following animation, NASA used SRTM elevation data collected from the Space Shuttle Endeavor mission in 2000. In 2014, the U.S. government released high-resolution SRTM data (30-meter) to the public. As a result, the following animation incorporates high-resolution data with unprecedented accuracy.

    Figure 6 - 2017 Solar Eclipse animation using high-accuracy topo and SRTM data (click to play). Source: NASA
    Figure 6 – 2017 Solar Eclipse animation using high-accuracy topo and SRTM data. Source: NASA

    Where are you going to be on August 21st?

    The fascinating part of this event is that no matter where you are located in the continental United States, you’re going to experience the effect of the solar eclipse.

    As I mentioned above, at my house and office, I’ll experience about 99.77 percent eclipse. If I drive 15 miles south, I can experience 100 percent eclipse. The challenge is going to be traffic. It is expected that a few hundred thousand tourists will visit Oregon for this experience.

    Traffic is already heating up. Gas stations may run out of fuel. Grocery stores may run low on food. I have no idea what to expect for traffic if I decide to make the 15-mile drive. I assume country roads as well as I-5, Oregon’s major interstate road, will be jammed and everyone will be driving at a snail’s pace and when the actual event is in progress, stop on the side of the road.

    If I was a betting man, I’d say I’ll make the trek with a tank full of fuel and a sack lunch (~10:15am is go-time in Western Oregon). I’ll take one piece of equipment to document the event, my drone. If I plan it right, I should be able to grab some incredible images, not necessarily of the solar eclipse itself, but of the crowds of people mesmerized by the event. Follow my Twitter for updates.

    Lastly, it was the electric washing machine. That’s the only invention listed in the opening paragraph that existed in 1918, when the last event like this occurred. The next one won’t be until 2045. I think I’ll make the 15-mile drive on Monday.

  • Airborne GNSS receivers: Who’s doing what?

    Airborne GNSS receivers: Who’s doing what?

    Rockwell Collins new generation GPS-4000-100 receiver

    It’s still exceptionally difficult to qualify GNSS receivers for airborne use so there are only a few existing suppliers.

    They include CMC Electronics with its line of OEM and enclosure products, Rockwell Collins with a new generation of airborne receivers just entering the market, Thales in Europe continuing to offer ARINC standard and multi-mode packaged receivers, Garmin still leading the panel-mount market for business aviation, Trimble/Ashtech continuing to promote its GPS/GLONASS airborne receiver, and newer entrants including Aspen/Accord with the NexNav GNSS line, and Avidyne with a home-grown embedded receiver in its flight management systems.

    It’s been a while since we reviewed the status of certified airborne receivers, and I was prompted to do so by news that Rockwell Collins has a new generation of receiver which has just received Technical Standard Order (TSO) approval from FAA.

    Rockwell Collins has fielded GPS products for 20+ years, and the GPS-4000S — with SBAS capability — has been fielded for more than 8 years, so parts obsolescence may become an issue. With new constellations, and with more countries implementing Space Based Augmentation Systems (SBAS), the 10 channel + 2 SBAS design needed an update. So Rockwell Collins undertook a bold step to develop and certify a radically new architecture for airborne applications — a software defined receiver.

    Some Members of the Rockwell Collins Navigation Center of Excellence, in Melbourne FL (L-R); Jeremy Kazmierczak – Senior Systems Engineer; Eyal Wilamowski – GNSS Project Engineer; De Yao – Senior Electrical Engineer; Angelo Joseph – GNSS Architect, Technical Project Manager; and Principal Systems Engineer Vikram Malhotra – Senior Systems Engineer

    A multi-frequency prototype first came together during two years of intense work by a couple of individuals, led by Angelo Joseph, an ex-NovAtel Aviation Group engineer with 15 years of GNSS design experience. When this proof-of-concept receiver demonstrated the required capability, a new GNSS receiver team was put together in Melbourne, Florida, to develop a fully qualified receiver, designed and built to stringent airborne standards.

    Over the next six years, hardware was proven to meet performance, environmental, electrical, safety, high-integrity and reliability standards, and software was carefully developed and tested to meet the highest aviation qualification requirements — referred to as “Level A.”

    In the process, a number of patents were generated — two have so far been approved in the United States:

    • Low-cost high integrity integrated multi-sensor precision navigation system, US 9513376 B1
    • Universal channel for location tracking system, US 9702979 B1

    The universal-channel technique enables the new receiver  to be configured to track any satellite navigation signal on all 14 + 4 SBAS channels (ultimately, this GNSS engine is anticipated to be able to track 100+ GNSS satellite signals), so the receiver is ready for when other constellations are approved for airborne navigation — for instance, European approval for Galileo use may be high on the list of new capabilities.

    CMA-6024 GPS/SBAS/GBAS sensor

    The new receiver is capable of LPV (localizer performance with vertical guidance) precision approaches to CAT I (down to ~200ft height in ~1/2 mile visibility). It features combined Required Navigation Performance (RNP) and approach capability, 10-Hz deviation output computations (20-Hz outputs), plug-and-play replacement for existing Rockwell Collins GPS receivers. It is Automatic Dependent Surveillance (ADS-B) compliant and has fast cold-start (<2 mins @ low SNR).

    With production spooling up in Melbourne, Florida, it is available now for installation on business and regional aircraft.

    An additional TSO application is underway to enable anticipated installations on Airbus and Boeing commercial transport aircraft. Work on the Rockwell Collins Next Generation Multi-Mode Receiver, the GLU-2100, is well advanced with an estimated availability at the end of this year.

    In Europe, Thales markets the TopStar-C certified GNSS receiver solution for aircraft and helicopter navigation and approach, providing LPV, RNP and ADS-B, with Ground Based Augmentation System (GBAS) capability promised in the near future. Compliant with all these latest navigation functions, TopStar-C is available as both standard fit (installed as basic fit on a new aircraft) and for retrofit on aircraft and helicopters alike.

    CMA-4124 GNSSA Precision Approach Receiver

    The Thales Multi-Mode Receiver (MMR) is part of the TopFlight Line, which includes comprehensive solutions for communication, navigation and surveillance. The MMR is configured with GNSS landing system (GLS) and navigation capability, Instrument Landing System (ILS) and Microwave Landing System (MLS) receivers in one package.

    ILS still provides Cat III precision landing system (effectively 700 ft visibility of the runway down to 50 ft) capability at a few key airports where severe weather can really disrupt scheduled airline operations. Nevertheless, ILS may encounters integrity problems due to FM interference and multipath reflection, which may degrade landing capabilities under low-visibility conditions — just when its most needed. MLS can provide Cat. III B (effectively 600 ft visibility of the runway down to 35 ft) landing alternative to ILS, but is fielded at very few airports.

    Meanwhile, GLS is part of the international strategic plan to provide precision approach capability worldwide to an increasing number of runways. So airlines may soon have a number of precision-landing options at airports around the world — ILS, MLS or GLS — and the Thales MMR provides all three capabilities.

    Garmin GTN-650 panel-mount Nav/Comm System

    CMC Electronics introduced the CMA-6024 GPS Satellite Based Augmentation System and Ground Based Augmentation System (SBAS/GBAS) CAT-l/ll/lll Precision Approach Solution at the National Business Aircraft Association show in November 2016. CMC has been in the business of supplying certified GPS receivers for commercial air transport, business aviation and helicopter markets, either directly or through Honeywell and other partners for over 35 years — almost as long as GPS has been around! The CMC family of airborne receivers also has another connection with NovAtel — they were developed as a collaborative effort with NovAtel and incorporate patented Narrow Correlator signal tracking technology.

    The CMA-6024 aviation GPS/SBAS/GBAS sensor has an embedded VHF Data Broadcast (VDB) receiver and an integrated GPS navigation sensor, is self-contained, and fully certified Precision Approach and navigation GBAS/GLS solution, certified to Design Assurance Level A.

    Garmin GPS/Nav/Comm/Multi-Function Display.

    The CMA-6024 provides a navigation solution that is fully compliant with Automatic Dependent Surveillance-Broadcast (ADS-B) and Required Navigation Performance (RNP). It comes with SBAS Localizer Performance/Localizer Performance with Vertical Guidance (LP/LPV) and GBAS Global Navigation Satellite System Landing System (GLS) GAST-C/D Precision Approach guidance for all aircraft. And it meets or exceeds the most stringent environmental requirements set out in RTCA/DO-160G, meeting additional requirements for specific aircraft, such as higher vibration levels for helicopters.

    CMC’s family of GPS products includes the CMA-5024 GPS Landing System Sensor that meets the requirements for Instrument Flight Rules (IFR), civil certified GNSS, and also the CMA-4124 OEM GNSSA receiver card for embedded applications.

    An SBAS/WAAS-certified, 15-channel GPS with 5-Hz outputs is embedded in the Garmin GTN-650 Nav/Comm unit, enabling GPS-guided LPV glide-path instrument approaches down to 200 ft. The system also includes VHF navigation capabilities, with a 200-channel VOR (VHF Omnidirectional Range) and ILS receiver for approaches with ILS localizer and glideslope. VOR navigation using the extensive ground VOR beacon system uses radial direction and distance to each VOR beacon within receiver range.

    FreeFlight FMS/GPS

    In addition, course deviation and roll steering outputs may be coupled to compatible autopilots so that IFR flight procedures may be flown automatically. And, when coupled with a flight display and compatible autopilot, the aircraft can fly fully coupled missed approaches, including heading legs as well as holds and search and rescue patterns.

    In 2015, Aspen Avionics acquired Accord Technology, an Indian company which claims to have developed the first GPS WAAS airborne sensor to be authorized under US FAA TSO-C145c. These receivers are now marketed as the ‘NexNav’ product line. This receiver was apparently the first to comply with FAA AC20-165A for ADS-B GPS position source and is also sold as an OEM GPS SBAS card-level receiver authorized to TSO-204.

    There are currently three NexNav receiver versions:

    • Mini (TSO-C145c SBAS Class Beta-1 only)
    • Max (TSO-C145c SBAS Class Beta -1, -2, -3) and
    • Micro-i GPS SBAS for TSO-C199 TABS for aircraft and experimental aircraft.
    SBAS/GNSS (WAAS/GPS) 1201 Sensor

    All NexNav GPS WAAS receivers are compatible with other SBAS systems around the world, including the European EGNOS, Japanese MSAS and Indian GAGAN.

    FreeFlight also markets two GNSS sensors and a suite of aircraft avionics.

    The 1203C sensor houses a high-performance 15-channel GPS engine with advanced interference protection and quick update rates, and is designed for business, regional, airline transport and heavy rotary-wing aircraft. The 1203C is certified to TSO-C145c and meets position source requirements for ADS-B and Required Navigation Performance (RNP) and other L-NAV operations. Another 1201 Sensor GNSS is specifically for General Aviation aircraft.

    Bendix/King KSN 770 Flight Information Management System

    Bendix/King GNSS navigation capability, like other General Aviation avionics suppliers, is often buried within a cockpit display system that serves to tune radios, and display information from weather radar, Enhanced Ground Proximity Warning System (EGPWS), XM Datalink Weather, Terrain awareness and warning System (TAWS) and Traffic Collision Avoidance System (TCAS).

    Nevertheless, the KSN 770 features Wide Area Augmentation System (WAAS) and Localizer Performance with Vertical Guidance (LPV), and is specified as a “WAAS GPS enroute and approach navigation system.”

    Ashtech, now a Trimble subsidiary, still lists the venerable GG12 OEM GPS/GLONASS receiver on its website, now somewhat updated to include SBAS as the GG12W.

    Ashtech is careful to describe its OEM receiver as “capable of being qualified” within a TSO-ed FMS systems — presumably the approach has been to provide all the required qualification data to integrator companies, who include this receiver within the FMS as the GNSS navigation and approach receiver. The integrator then submits the Ashtech data to FAA to support their system TSO application.

    Avidyne now integrates its own in-house-developed GNSS receiver into its line of cockpit mount FMS and related GNSS navigation and approach systems. And here there is another connection with Angelo Joseph — his work at Avidyne before he went to Rockwell Collins was to develop this Avidyne receiver to replace a bought-out embedded OEM GNSS receiver. The FMS has been certified using this new receiver to TSO-C146d — Stand-Alone Airborne Navigation Equipment using GPS augmented by WAAS, including Airborne Supplemental Navigation Equipment using the Global Positioning System (GPS) — Gamma 3.

    Avidyne IFD540 display

    There are clearly other companies who supply avionics for GA and Commercial Air Transport aircraft, but this article has attempted to capture a cross-section of GNSS offerings. Other notables include Sagem/Safran in France, Universal Avionics in Tucson, and quite possibly several others that we will no doubt hear about shortly!

    As aviation agencies move towards adding the use of other constellations beyond GPS into approved, international navigation standards, there surely has to be significant change across the board for aviation as a whole as improved integrity and availability provide more options and capability. The existing avionics suppliers should be able to maintain market by offering more capability, and there might even be more opportunity for new entrants to come into the market with disruptive products, but for sure the future looks good for the industry.