Aman Enterprises introduces NMEA-BT — a Bluetooth iOS adapter that enables any high-precision GNSS receiver with a serial port to connect to an iPad or iPhone.
The NMEA-BT adapter is a small, weatherproof device that solves the problem of connecting non-iOS GNSS receivers and other field sensors to iOS devices. It connects to the iOS devices wirelessly using the native Bluetooth built into the iOS devices.
By replacing the iOS device’s internal GPS location information with the location information from the intrinsically more accurate external GNSS devices used by mapping and survey professionals, NMEA-BT allows users to pair external GNSS devices to their location-enabled iPhone or iPad app. The patent-pending product helps preserve the user’s investment in sub-meter and centimeter GNSS receivers and other sensors while users migrate their workforce to iOS devices.
A free app from the Apple iTunes App Store (NMEA Talker) enables the user to specify any required GPS connection parameters; connect to a local cellular RTK network (NTRIP) or a Direct IP (DIP) based correction service; and feed the corrections to the GNSS receiver, allowing for centimeter accuracy in real time in the field. The app can also be used to display error notifications like high PDOP, loss of an RTK correction, loss of satellite lock.
In addition to connecting to GNSS devices, users can connect to other sensors like laser rangefinders, resistographs, underground cable locators, and commercial weigh scales that output NMEA-formatted data.
For developers, they have full access to the entire raw NMEA stream of data from multiple devices without sacrificing app security or design architecture. No proprietary libraries are required to access the NMEA data stream.
GPS/GNSS Receiver Compatibility
The NMEA-BT has been tested with the following receivers:
John Deere StarFire
Trimble Pro 6, Geo Explorer, 372
Casel H372
Topcon HiPer series
Septentrio APS and NR series
Geneq SXBlue series
Ag Leader 6000 and 6500 series
Raven Industries – Envizio Pro series
Novatel
The only requirement to interface the NMEA-BT adapter is that the GNSS receiver must output at least the $GPGGA and $GPRMC messages via serial port.
GNSS receiver maker Septentrio has announced the availability of its geographical information systems (GIS) PinPoint-GIS on the ArcGIS Marketplace.
PinPoint-GIS was developed to enable straightforward GIS data collection without the need for expensive additional software linking a GNSS receiver with the Esri ArcGIS Platform
PinPoint-GIS helps ArcGIS users make informed and timely decisions, Septentrio said. It turns GNSS data collected by Septentrio’s receivers such as the Altus NR2, Altus GeoPod and the AsteRx-U into actionable GIS data. Height and other project parameters are available directly in the ArcGIS workflow without any additional steps by the user.
Pinpoint GIS makes ArcGIS easily accessible through existing hardware — consumer commercial and ruggedized device, tablet or even smartphone — regardless of operating system. PinPoint-GIS Web makes ArcGIS available from a standard web browser or from an Android app, downloadable from Google Play.
The Android app works with Esri’s Collector for ArcGIS and provides an accuracy widget which confirms horizontal and vertical accuracy in a highly visible way. This brings the user the immediate security that the captured data meets the required accuracy in both the horizontal and vertical.
“Integrating ArcGIS functionality into PinPoint-GIS empowers ArcGIS Online users,” said Gustavo Lopez, PinPoint-GIS Product Manager. “With the click of a button, a PinPoint-GIS user can turn accurate and reliable GIS data collected from their Septentrio GNSS receiver into actionable data needed for smarter decisions, effective analysis and customized maps all within the easy-to-use ArcGIS.”
As technology continues to march forward, and storage and data evaluation use grows, the surveyor and the farmer will begin to use each other’s skillsets to increase their own productivity. So how do we get there? First, we must establish how each side uses their prospective GPS tools.
As a child, I spent several summer vacations at my relatives’ farms in central Illinois. My early impression of working on a farm was one of long hours and hard work. Work and chores completed by my family members was very physical with no set hours to look forward to. My uncles didn’t get to set the schedules for rain and sun and had no say in whether or not a piece of equipment would break down.
What I encountered as a child taught me that there was no technology in farming; it was nothing but hard work. The thought of using something as high-tech as GPS would have made most old-time farmers laugh you right out of the coffee shop.
My career as a land surveyor has had its share of hard work at times, but it has been the technology that has always fascinated me. When I began as a rodman, the electronic distance meter allowed surveyors to measure distances more than a mile instead of hand taping the entire way, and with much more accuracy. Along the way, I’ve watched computer technology grow, with total stations that incorporate cameras and video and GPS receivers that provide accurate locations instantaneously.
That brings us to our modern-day crossroads. As surveyors, we are constantly trying to find ways to incorporate our skills into other occupations to increase productivity. We also see the modern farmer moving away from small family operations with only several hundred acres, morphing into farm management corporations with tens of thousands of acres as well as millions of dollars of equipment.
Efficiency is what they are after, and they are spending significant amounts of money on technology to make it happen. My own curiosity and research has opened my eyes to how far the farming profession has grown, and in many ways surpassed the land surveyor with technology. But I think there is still common ground that needs to be explored, so let’s start at the root of each profession.
The Farmer and the Surveyor
As different as the two professions may seem, farming and surveying have one large common link: data. More specifically, the tools, methods and procedures they operate to acquire the data used in their everyday jobs and projects.
The implementation of GPS equipment and the ability to collect location data has greatly improved the productivity of both professions, but for drastically different reasons. However, as technology continues to march forward, and storage and data evaluation use grows, the surveyor and the farmer will begin to use each other’s skillsets to increase their own usefulness.
So, how do we get there? First, we must establish how each side uses their respective GPS tools.
The Land Surveyor
The land surveyor and his or her staff use GPS daily, with varying degrees of accuracy. Here are a few examples:
Mapping-Grade GPS Device (>= 3 meters)
This handheld unit is primarily used for mapping utilities and improvements that don’t require high accuracy. The data and attributes acquired by this unit will be inserted into geographic information system (GIS) databases for inventory, and maintenance logs for future review and upgrade needs. Surveyors use these units for mapping items that require additional attributes and information necessary to improve the overall usefulness of a GIS database.
Differential GPS (<= 1 meter)
Differential GPS provides live positional solutions for applications that require more accuracy than mapping-grade GPS, at a reasonable equipment and operational price. These systems are used by aeronautical companies for mapping assistance, logistics companies for asset tracking, and emergency operations for 911 systems. These systems are also used by hydrographic surveyors for use in mapping lake and river bottoms as well as surveyors working in open pit mines, producing existing condition maps and volumetric surveys.
Survey-Grade GPS
Surveyors began implementing GPS equipment into their measuring repertoire in the mid 1980s with the introduction of data collection by static methods. This technique allowed for long-distance measurements with good accuracy and precision, but it came at an incredibly expensive cost.
By the mid 1990s, real-time kinematic (RTK) equipment was introduced, and gave the land surveyor a new gateway into long-distance measurement with shorter occupation time and less cost. Additional enhancements to RTK systems included on-the-fly initialization, increased data-collector capability, and cellular/long-distance radio networks.
These improvements allowed increased data-collection productivity, including mobile collection on all-terrain and survey vehicles. A topographic survey of a 40-acre parcel that would take several days of walking now is completed in less than 6 hours on an ATV. Boundary retracements of large parcels that used to take weeks of traversing the perimeter can now be done in a few days.
Many credit GPS technology and functionality for greatly improving land surveying production as well as increasing accuracy and precision of the work.
Farming has been passed down from generation to generation for hundreds of years. History tells us this has been a hard life for many of these families as manual labor was at the root of the occupation. Livestock and family members were used to pull the necessary implements for planting each year’s crop, with most harvesting being done by hand.
The Industrial Revolution brought the tractor and planting and harvesting equipment. After World War II, equipment manufacturers retooled their factories to increase the size and capacity of tractors. Even with the reduced manual labor that a farm tractor allowed, it was still a physical burden on the farmer planting crops and driving the miles of rows necessary to plant fields.
Also, many agricultural areas became more organized, with local farm bureaus and associations being formed to help the farmer. These organizations provided information on how to increase yields in their crops; this data became the basic form of a GIS database for soils and drainage mapping well before digital mapping. These databases provided the initiative for the farmer to analyze planting methods and rates; herbicide, pesticide and fertilizer applications; and to review crop yields for notable increases and deficiencies.
In the 1980s, yield monitoring equipment became a new tool for the forward-thinking farmer to invest in, analyzing how well his crops were producing. The only negative was the inability to accurately map the location of the various yield rates that would occur in the harvest. The farmer was forced to spend more time reading the yield analyzations in smaller parts of his fields in order to identify where adjustments were needed for increasing the output. Many farmers didn’t see the return on investment for this system, and those who did purchase such a system soon gave up.
In the early 1990s, Rockwell International debuted the Vision System, a GPS unit using a U.S. Coast Guard correction system paired with a yield monitoring unit to map the location of yield rates during field operations. Trimble, John Deere and others were soon developing their own systems. All of these systems were expensive, delicate and too complex for most farmers to justify installing in their tractors.
However, new discoveries in GPS technology during the late 1990s brought sweeping changes to this new tool for the farmer. While the term “precision agriculture” had floated around for a while, it wasn’t until the introduction of high-accuracy GPS that the statement reflected correctly on the industry.
Differential GPS (<= 1 meter)
John Deere began its pursuit of GPS technology in the early 1990s along with many others, but the company’s decision to continue pursuing this competitive edge is what led to several advancements for the farming industry. Deere’s work with Stanford University and NASA led to the revision of differential corrections for GPS locations to gain additional accuracy for a guidance system for Deere equipment.
By 1998, John Deere presented a differential GPS system that provided 1-2 meter accuracy to assist farmers with smaller tolerances of precision field planting and harvesting. Innovations such as this led to many more advancements in the farming industry.
Real-Time Kinematic (<= 2.5 centimeters)
Today’s precision farming is more accurate than ever, with RTK networks providing a bulk of the coverage necessary to supply the farmer with corrections. In places where a local correction provider is not available, the farmer has choices of setting up his own base for correction or subscribing to other real-time networks via cellphone coverage. These systems allow for highly accurate mapping and guidance systems so the farmer has more control and information on his field and crops than ever before. Farmers now using GPS control in precise methods have more tools for increasing yields and production, including crop planning, soil sampling, pesticide/herbicide/fertilizer application and harvest analyzation.
Crop planning used to be strictly in the hands of the farmer who drove his tractor in his field in an effort to follow the lay of the land. Today’s farmer uses topographic maps, aerial photography and mapping software to create planting patterns that make farming more efficient. By maximizing the planting configuration, this is also an opportunity to minimize fuel consumption. Soil sampling and weed mapping are now staples of many farmers’ activities.
The farmer uses these methods to reduce the number of contaminants within the crop. He can also analyze the field’s health in order to apply the appropriate amount of necessary chemicals. These procedures are now computer controlled to vary the rate of application depending on the location within the field.
Harvest analyzation has become the biggest source of data collected. Yield monitoring equipment was the first tool introduced into the electronic farming age. Now, coupled with GPS mapping of yield rates and volumes, farmers can accurately predict spot, regional and overall crop production from their fields. This data, along with soil mapping, is reviewed after the harvest and is used to determine a strategic plan for the next year’s planting.
The biggest improvement, in most farmers’ opinions, is the implementation of steering-guidance systems. Initially produced to be strictly a guide to the driver, systems are now automated into the steering system to follow a predetermined path within a 1-inch tolerance. This frees the driver to monitor planting, spray application and harvesting operations.
By turning the driving over to an automated system, field row overlap is reduced by up to 30 percent. This decreases double coverage of seed and spray application and it minimizes fuel consumption. This system also allows for less driver fatigue with the ability to work around the clock as needed or conditions dictate. Coupling this steering system with variable rate planters and sprayers, the farmer has a system that allows him to be more effective in managing and monitoring operations.
Bringing the Two Occupations Together
Both of these noble professions are using a highly accurate form of measurement and data recording, but we must review further how they can help each other. To do that, we must analyze what each is doing with the technology.
Surveyors and GPS Use
Roles of the surveyor are to measure land, provide his professional knowledge regarding parcel boundaries, and collect data for engineering and drainage purposes. A majority of this data is now collected by GPS methods and is in NAD83 state plane coordinates with NAVD88 elevations. This information can be supplemented by county and state GIS data as well. Surveyors also have knowledge of existing monuments by local, state and federal authorities tied to these coordinate systems/datums so all future surveys can be related to each other geographically.
Farmers and GPS Use
Farmers who have embraced GPS technology now have the power not only to map and collect data, but to also utilize previous data for crop efficiency. This ability to run a more efficient farming system is happening now for many farmers. The farmer is educated in regard to seed germination, weed and bug prevention, and maximizing crop yields so collecting this data has become a necessary task.
The Farmer and the Surveyor — Harvesting Data
The farmer and the surveyor can use their knowledge in many ways for the mutual benefit of increasing crop yields, efficiently working the land, and maximizing production.
The surveyor’s knowledge of topography and drainage can assist the farmer with shaping of land to minimize water runoff and loss of key nutrients in the soil. This loss is estimated to be an average of two to three tons of soil per acre per year. Installation of drainage tile in addition to grading can be a critical part of minimizing soil loss, and the surveyor can help with this analysis.
Accurate boundaries allow the farmer to know the limits of his property. The surveyor can provide this information so the farmer can maximize his planting configuration, yet not encroach on the adjacent property. The surveyor can also help with the creation of land-management systems to help farmland owners plan for financial decisions and tax strategies.
The biggest opportunity for the surveyor is to offer assistance to the farmer who has little or no knowledge of data collection. This geospatial data can be confusing to those not familiar with this information. Farmers who become educated in analyzing and reading crop data can increase production and yields.
Surveyors have the math skills and background to assist with the management of the data from a location standpoint. This effort will help the farmer know soil conditions, germination, spray application and harvesting to maximize the cost effectiveness of his investment in the land.
Together, the farmer and the surveyor can create a successful partnership that can increase crop production worldwide. Data is the crop that brings them together, and planted with the right amount of care and nurturing, this data can become more valuable than ever.
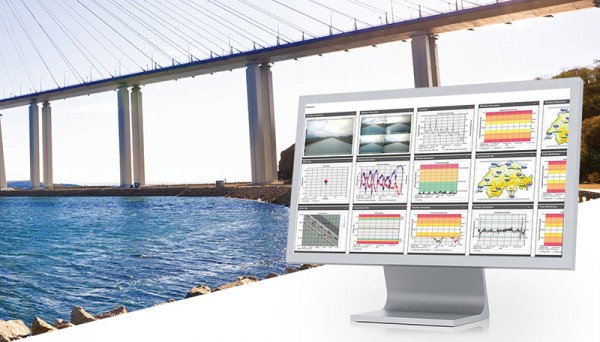
Users of the system can now create comprehensible visualizations and customizable reports, which enables powerful sensor data fusion for applications, such as air or water quality monitoring and construction or building management.
With GeoMoS AnyData and GeoMoS API, multiple open interface standards are accessible to provide more information to projects than just classic geodetic monitoring applications, according to a news release from Leica.
The open solution offers flexibility; it is capable of automatically acquiring, processing and distributing intelligent information locally or via the Internet in real time. Leica GeoMoS integrates, processes and distributes all project data within one software program.
With these additions to Leica GeoMoS, necessary information is made easily accessible via web-based visualization. The program provides an efficient way to convert raw data streams into intelligent information.
Integration for infrastructure monitoring, navigation
By Desislava Staykova and Nico Zill
Rapid development in the technology of combined sensors within complex systems has taken place over the last decade. Such systems provide different accuracy levels, offering the possibility of use in application areas such as surveying, railway and automotive engineering, land administration, and for navigation purposes.
Multi-sensor integration and fusion is a comprehensive process of reading and combining sensor signals to ensure a higher level of data reliability and accuracy. Input data from every sensor and further combination with specially developed algorithms ensures the complete identification of observed features, which would be impossible with data from each individual sensor operating separately.
Because of its flexibility and the possibility for fast and continuous data measurement, multi-sensor integration and fusion has evolved rapidly in different areas. The object of this article is to overview the use of high-end and low-cost system complexes and software solutions for the purposes of the engineering geodesy, transportation and navigation.
Deformation Monitoring
Geodetic measurements for monitoring and displacements analysis of various engineering objects have always played an important role in maintaining structures like bridges, dam walls, building columns, wind power generators, and other construction.
This requires properly designed network schemes enabling continuous and highly accurate measurements. For such angular and length measurements of millimeter-level accuracy that must be performed in intervals of minutes, hours or a day, standard total stations are being replaced by automated ones (ATS) comprising precise servomotors, automatic target recognition sensors, electronic inclinometers, self-calibration control systems and other sensors.
The synchronized process of high-accuracy measurements (angular accuracy better than one second and distance accuracy better than one millimeter) and simultaneously adjustment software enables real-time or post-processing deformation monitoring and analysis. This type of hardware and software combination is often used during the life cycle of a project for construction and reconstruction of objects and for regular monitoring of the object’s stability.
Terrestrial Laser Scanning. The need for precise modeling and geometrical characterization of large structures and open areas as dams, mines, landslides and others cannot be covered by traditional surveying methods which require the use a huge number of points for describing the object’s surface. The development of laser scanning technology in the last decade offers a new way for deformations measurements and becomes part of the infrastructure monitoring.
The high scanning speed, dense measurement of huge numbers of points and high accuracy gives terrestrial laser scanning (TLS) an advantage other technologies used for large structural monitoring. Compared with the technologies using single point monitoring approaches where the displacements detection is limiteded to specific benchmarks, TLS provides high data redundancy. Combined with proper software products, this technique offers the possibility for high-accuracy surface modeling and displacement detection at the millimeter level. The scanned object consists of a large number of points, which allows implementation of mathematical algorithms for modeling and analyzing the object’s behavior.
Another advantage of TLS as a remote sensing measurement tool is the minimized impact of the operator over the observed points and network.
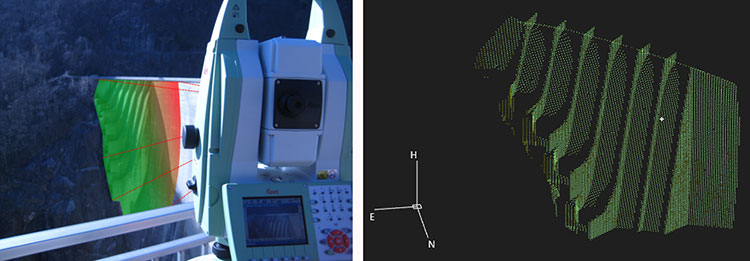
A new method for structural monitoring has emerged recently, comprising the advantages of the TLS, GNSS, geotechnical and meteo-sensors, enabling wide-area coverage and surface monitoring. One such tool is shown in Figure 1.
Figure 1. Terrestrial laser scanning combined with GNSS and other sensors enables wide-area coverage and survace monitoring. (Images courtesy of Leica Geosystems)
Mobile Laser Scanning
For different navigation purposes, for monitoring and investigation of wide areas, static measuring methods are being replaced by complex mobile measuring combinations of both high-end and low-cost sensors, to ensure fast, continuous and accurate data acquisition.
Recently mobile laser scanning (MLS) has experienced rapid development and proved its usage particularly in the railway and automotive sectors, for deformation analysis, for monitoring and documentation of as-built street and railway networks and the corresponding infrastructure objects.
MLS for Rail and Road. The advantages of MLS for fast, high-accuracy and complete scanning of the surroundings make it an important part of current railway and road conditions monitoring.
Continuous data acquisition and processing minimizes operator errors, and significantly reduces the time for performance of the surveying work and a-posteriori data analysis.
Localization and recognition of infrastructure objects forming part of railway and road environment has long been of primary importance in the transportation sector.
For determination and documentation of as-built railway and street networks from acquired data, Technet-Rail (Berlin, Germany) developed two software solutions, SiRailScan and SiRoadScan, for point-cloud analysis. The integrated mathematical algorithms ensure high-accuracy extraction and adjustment of the as-built left rail, right rail and center line, as well as of the roads’ border lines.
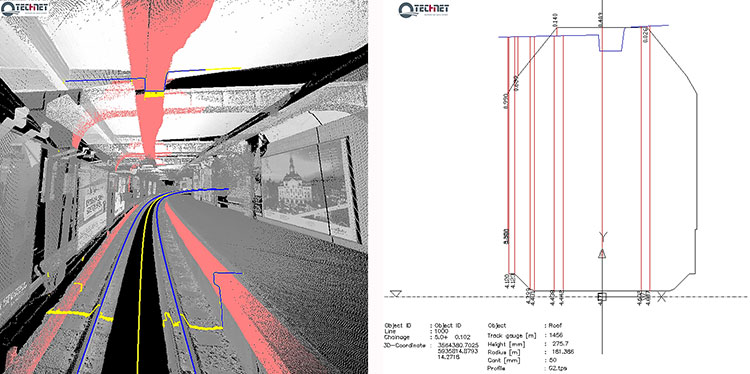
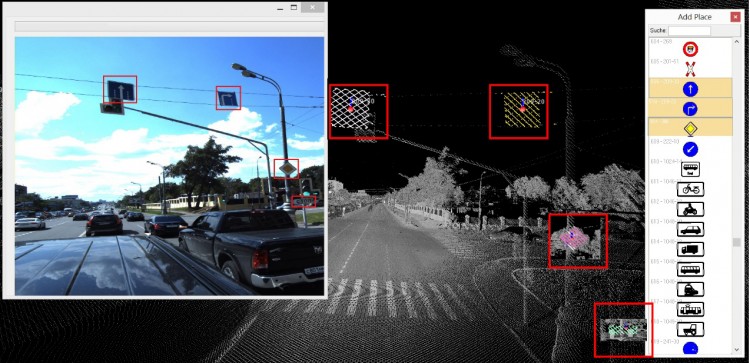
The adjusted geometry forms the basis for driving speed control tests, determination of the as-built environment for clearance detection and documentation, investigation of catenary wire deviations, ballast and road settlements, traffic signal positions, and any changes in the existing situation (see Figures 2 and 3).
Figure 2. Adjusted as-built rail geometry with SiRailScan used as basis for performance of clearance analysis and documentation in chainage based railway system.Figure 3. Adjusted with SiRoadScan road border lines. Detection and recognition of the roads signals.
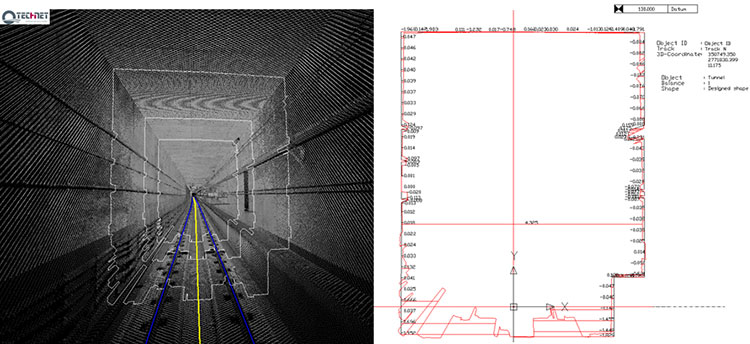
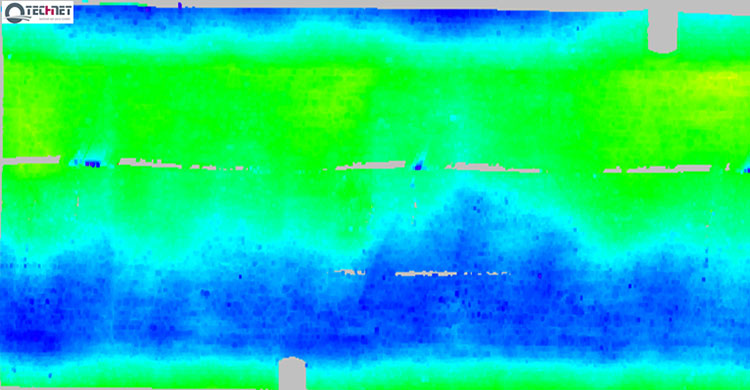
In response to the growing interest in application of the MLS technique and a-posteriori data adjustment for monitoring purposes, Technet-Rail developed additional tools for deformation analysis of structures such as tunnel bodies, railway bridges and road surfaces. The integrated software solutions enable comparison between the designed and as-built situation, epoch-wise analysis, modeling of the structure, development into 2D followed by color-coded deformation map (see Figures 4 and 5).
Figure 4. Tunnel deformation analysis performed with SiRailScan based on the as-built rail geometry. Automated calculation of differences between designed and as-built tunnel structure.Figure 5. Tunnel deformation analysis with SiRailScan based on a pre-defined form and direction.
MLS for Navigation. Multi-sensor integration is the basis for operation of the moving measuring systems integrating hardware devices such as laser scanning devices, GNSS, inertial measurement units (IMU), distance measuring instruments (DMI) and specific software algorithms for data synchronization. A milestone in the development of such systems is the measurement and navigation in indoor places or in areas with low or no GNSS coverage.
The need for safe and reliable navigation in transportation systems such as train control systems, intelligent vehicle systems, system tracking, in urban environments, underground areas, and other areas with no available GNSS signal stimulated much research in the area of multi-sensor integration and fusion. the main scope of some studies is the integration of different sensors delivering information for the attitude, velocity, acceleration such as the IMUs, inclinometers, wheel sensors, and correspondent filtering algorithms to achieve the best possible position accuracy without usage of GNSS signals.
Conclusion
For decades, infrastructure objects such as dam walls, bridges, tunnels, roads and railway tracks form a substantial part of civil engineering and engineering geodesy. The integrity of their structure requires deep knowledge of the behavior of these objects and the various methods for their optimal and high accurate monitoring. The rapid development evolution of multi sensor integration in combination with laser scanning technology makes it an essential method for accurate, continuous and dense measurement for the purposes of the engineering surveys.
Desislava Staykova and Nico Zill are engineers with Technet-rail 2010 GmbH, Berlin, Germany.
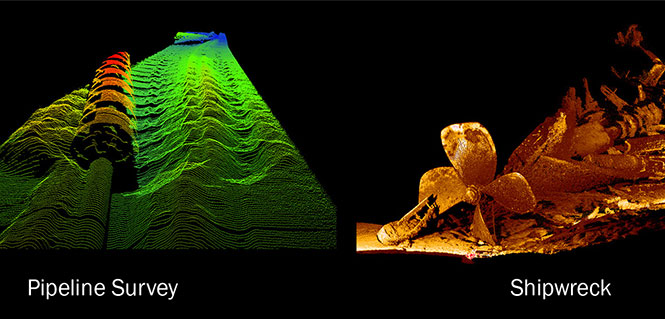
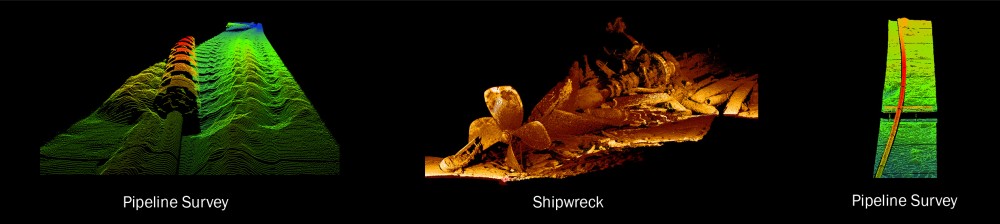
2G Robotics has delivered two deep-rated ULS-500 subsea laser systems to Oceaneering International Inc.’s business unit, Oceaneering Survey Services, a provider of deepwater seafloor mapping and subsea surveys.
Including these two ULS-500 systems, Oceaneering now uses six of the ULS-500 systems with its autonomous underwater vehicles (AUVs) as part of its advanced survey and inspection services for assessing pipeline and flowline integrity for the oil and gas industry.
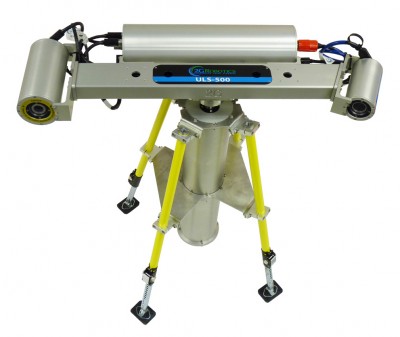
The ULS-500 deep-rated system. (Photo: 2G Robotics)
Oceaneering has been using the ULS-500 since 2013 to perform dynamic flowline and pipeline inspections with its AUVs, and most recently used the 2G Robotics ULS-500 system to inspect 2,500 kilometers of pipeline and flowline.
The ULS-500 can be used to perform high-quality stationary scans, but the system delivers greater operational value when integrated with subsea vehicles to perform dynamic scanning, 2G Robotics said. The ULS-500 is designed for dynamic scanning with development focused on subsea vehicle integration, high sample rates, and timing synchronization for efficient and accurate data acquisition.
The ULS-500 uses PPS (pulse per second) time synchronization because it provides better timing accuracy than a standard NTP (network time protocol) time synchronization approach, ensuring better data accuracy.
The 3D point cloud models generated by the ULS-500 provide Oceaneering with the detail needed to accurately assess pipelines and flowlines, and measure displacements and deformations.
(Center) The National Oceanic and Atmospheric Administration (NOAA) used the ULS-500 to explore the Monohansett shipwreck site at the Thunder Bay National Marine Sanctuary. The ULS 500 captured detailed 3D models of the Monohansett at a range of approximately 3m to 5m. (Credit: 2G Robotics)
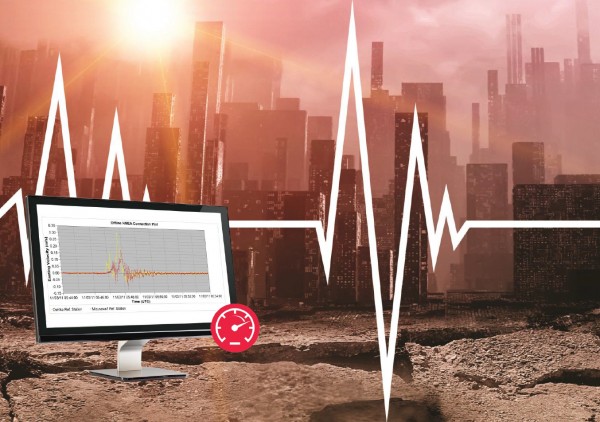
A GNSS monitoring solution integrated into a stand-alone receiver detects fast movements of man-made and natural structures in real time.
The new product from Leica Geosystems, dubbed VADASE, runs onboard Leica reference stations and monitoring receivers. The Leica Velocity and Displacement Autonomous Solution Engine (VADASE) provides an in-depth look into fast movements using unique processing algorithms. In real time, accurate high-rate velocity and displacement information of various activities and structures are provided to engineers and researchers for a complete, precise and reliable monitoring solution, Leica said.
Leica VADASE delivers actionable information independent of any GNSS real-time kinematic (RTK) correction service in real time. Displacement events are recorded on board a single stand-alone GNSS receiver, and the user can be notified by email. With this instant information, professionals receive a deeper understanding of how structural movements occur and can take necessary actions to mitigate damages and potentially save lives, the company said.
Leica VADASE does not require additional hardware or infrastructure for differential processing (such as one or more reference stations or global correction services for precise point positioning); it provides autonomous processing capability with no extra equipment or services needed.
Users can also apply the latest versions of Leica SpiderQC, Leica GeoMoS or any other customized software for advanced data visualization, analysis, threshold verification and notification.
In a previous article, “JAVAD GNSS 5 Hz “Beast Mode” RTK Base Station Corrections Reduce the Time to Acquire a Fix by 72 Percent,” the benefits of RTK base station correction rates greater than 1 Hz were discussed. This article will investigate and compare the accuracy and precision of JAVAD TRIUMPH-LS RTK positions with a JAVAD TRIUMPH-2 base station with both 1 Hz and 5 Hz corrections in an open-sky environment with a short baseline.
Procedure
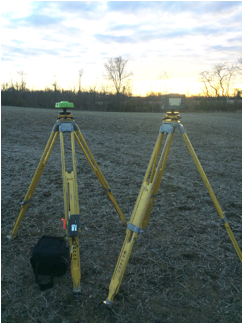
A TRIUMPH-LS RTK rover and TRIUMPH-2 base station were set up on tripods in a farm field. The base and the rover were adjusted to be at the same height as checked with a 4-foot level. The horizontal distance between the base and rover was measured with a tape measure to be 2.93’.
A TRIUMPH-2 and TRIUMPH-LS set up on tripods in a farm field as the sun sets in the background.
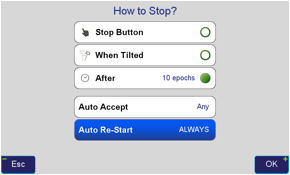
Using the TRIUMPH-LS’s field software, J-Field, the TRIUMPH-LS was configured to automatically accept collected points and continuously collect points until manually stopped.
“How to Stop?” configuration screen in J-Field set to collect 10 epochs, Auto Accept points and Auto Re-Start.
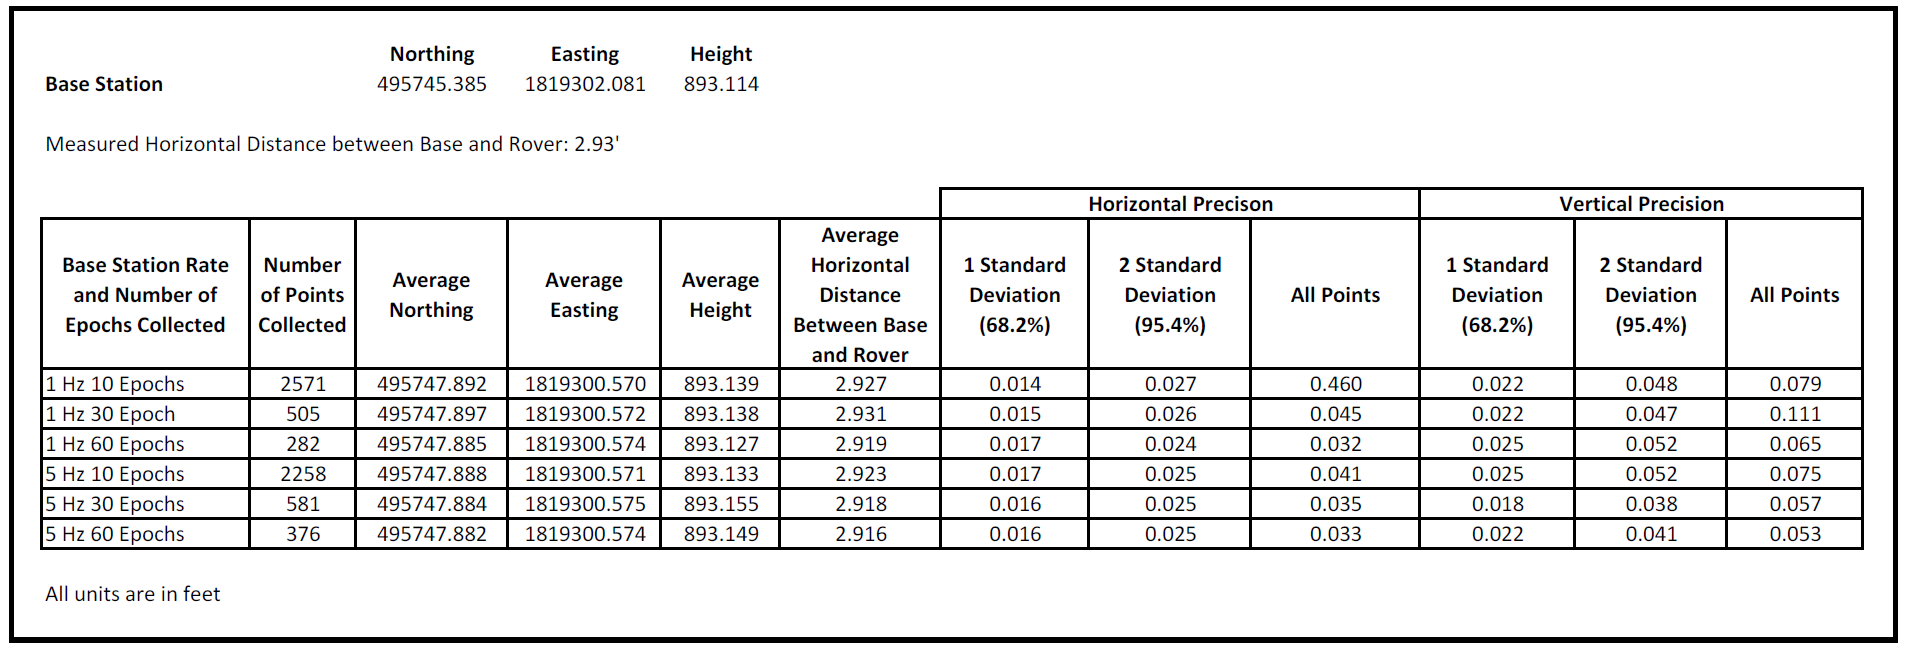
Six sessions of points were collected: points with 10, 30 and 60 logged epochs with both 1 Hz and 5 Hz corrections rates. The RTK engines were configured to automatically reset after each point was collected.
Results
Analysis
All points had good horizontal precision and 95.4 percent of all points (2 standard deviations) fell within 0.027’ of the average position in the worst group of “1 Hz 10 Epochs.”
The point groups had good horizontal accuracy. The physically measured distance between the base and rover matched the averaged RTK groups’ position within 0.014’.
All points had good vertical precision and 95.4% of all points (2 standard deviations) fell within 0.052’ of the average position in the worst groups of “1 Hz 60 Epochs” and “5 Hz 10 Epochs.”
The point groups had good vertical accuracy. The base and rover were set up at the same height. The error between the averaged heights of the groups was at most 0.041’.
The vertical precision tended to improve as the number of epochs collected increased. The horizontal precision had marginal improve as the number of epochs collected increased.
The base station broadcast rate does not appear to have any substantial effect on the precision but allowed points to be collected with less time. With 1 Hz corrections, a point with 60 epochs requires 60 seconds to collect, but with 5 Hz corrections, it only requires 12 seconds to collect.
Conclusion
In an open sky environment with a short baseline, the RTK position precision is only marginally improved as more epochs are collected. Higher RTK broadcast rates made possible with JAVAD RTK systems allow points to be collected faster.
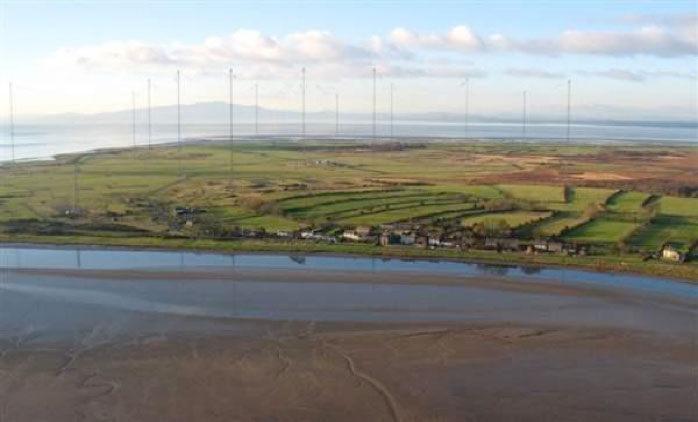
eLoran Antenna Park of 13, 200-meter masts at Anthorn, UK.
Readers of GPS World, its e-newsletters, website — and all interested PNT parties — are invited to register their opinion in the current poll at gpsworld.com/janpoll.
Should the U.S. government install a full eLoran network of broadcast stations to back up GPS in case of jamming, interference or other emergencies?
Yes.
No.
More study is needed before answering this question.
Don’t know.
Voters may enter their name in a drawing to receive a $50 gift card. Vote by Jan. 11, 2016.
Results will be published in the February issue of GPS World magazine.
A new high-accuracy technique using one dual-frequency GNSS receiver, precise point positioning (PPP) offers the possibility of cost-effectively obtaining coordinates. This study investigates the accuracy of kinematic PPP for hydrographic applications on rivers, and shows results comparable to double-difference solutions.
By Ashraf Abdallah and Volker Schwieger
Duisburg Harbor, Germany: site of the PPP survey.
Precise Point Positioning (PPP) is a challenging surveying technique for high-accuracy results. It offers the advantage of using one dual-frequency GNSS instrument. Estimation of a PPP solution is based on the ionosphere-free linear combination for code data and carrier-phase data.
Bernese Software. Bernese software V. 5.2 is a GNSS post-processing software, using GNSS measurement data for static and kinematic surveying. It processes the data in double-difference (differential GNSS) and zero-difference (PPP solution) techniques. The software was developed at the Astronomical Institute of the University of Bern.
Bernese software contains a group of different tools or programs to complete the processing for double-difference or zero-difference mode. The estimation of the two techniques has the same processing schedule in most of the pre-processing stages. The change appears later within the parameter estimations section.
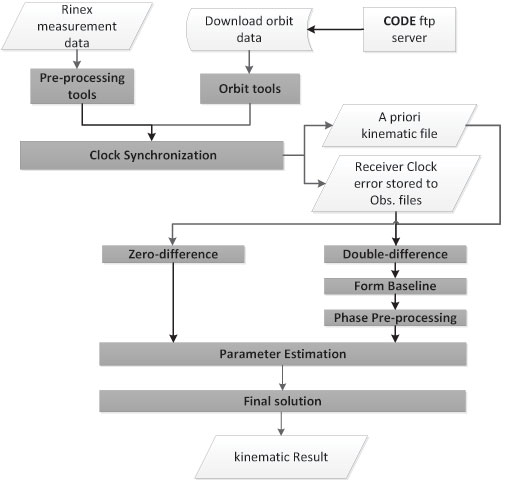
As shown in Figure 1, the processing starts with downloading the related orbits from the CODE (Center for Orbit Determination in Europe) FTP server. The orbit tools include the updating of the Earth orientation parameters to be in Bernese format, converting the satellite data to a specific format and generating the standard orbit format for Bernese software. A preprocessing program contains the smoothing of the RINEX data from outliers and cycle slips.
Figure 1. Bernese software processing schedule.
This smoothing step is following by converting the RINEX into Bernese binary format. The receiver clock is synchronized with respect to the GPS time and stored to observation files using clock synchronization tools. Using the code solution, a kinematic file is written to be inserted in the next parameter estimation procedure. For double-difference solution, a baseline is created, and this baseline is corrected from cycle slips for phase data. Parameter estimation is carried out by least-square estimation for the phase and code GNSS observations.
Kinematic PPP Solution. Bernese software provides the possibility to obtain the PPP solutions in automatic script (Bernese Protocol Engine [BPE]). The satellite orbit and clock ephemeris data from CODE center were used with intervals of 5 seconds to obtain highly accurate results. Satellite and receiver phase center offsets are considered. Tropospheric correction is applied using the Global Mapping Function (GMF) model for the hydrostatic and wet delay estimation. Regarding ionospheric correction, the estimation of the PPP solution is based on the linear ionospheric-free combination, with high-order ionospheric parameters to improve the estimation.
The ocean tidal loading correction is considered in the PPP estimation. Atmosphere tidal loading is also corrected.
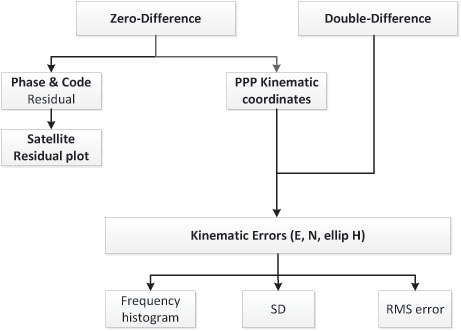
Figure 2 gives the analysis flowchart. Some outputs of the PPP solution could be visualized, such as the satellite phase and code residuals. The high residuals might come from the lower elevation angles of the satellites. Moreover, the residuals appear because of the effect of the remaining observation errors, such as atmospheric delay, multipath, or even the satellite orbit and clock residuals.
Figure 2. Flowchart of analysis strategy.
Regarding kinematic PPP solution, the error values in the east, north and ellipsoidal height are calculated with respect to the double-difference solution from Bernese software. The root-mean-square (RMS) error, which refers to the double-difference solution, and the standard deviation (SD), which is related to the mean value of the PPP solution error, are calculated, and the frequency histogram is plotted.
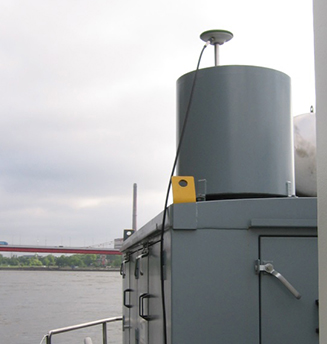
An antenna and a receiver were mounted on the surveying vessel to collect the GNSS data with an interval of 1 second during two days.
Experimental Work. Two kinematic trajectories were observed on the Rhine River in Duisburg, Germany, as a part of the project “HydrOs — Integrated Hydrographical Positioning System.” The project was launched in cooperation with Department M5 (Geodesy) of the German Federal Institute of Hydrology (BfG) and the Institute of Engineering Geodesy at the University of Stuttgart (IIGS) .
An antenna and a receiver were mounted on the surveying vessel (inset photo, opener) to collect the GNSS data with an interval of 1 second during two days. The virtual SAPOS (SAtellitenPOSitionierungsdienst der deutschen Landesvermessung) reference station was considered as a reference station, provided from the SAPOS-NRW team. SAPOS is a continuously operating reference station (CORS) GNSS service collecting data throughout Germany.
Results and Discussions
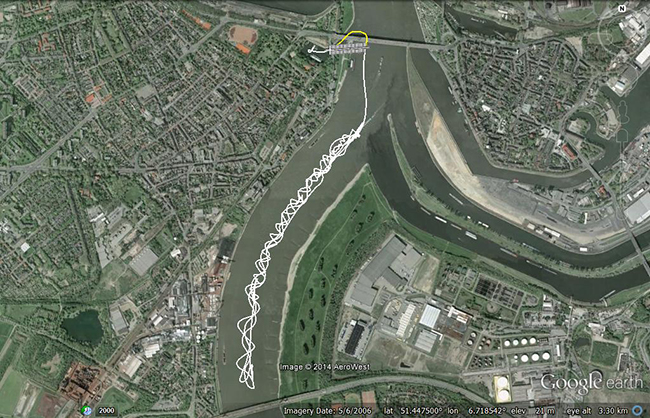
The layout of the first trajectory, which was observed for more than three hours, is presented in Figure 3. The measurements started from the inner harbour in Duisburg. The left figure shows the overview layout, and the right figure illustrates a zoom-in of the trajectory below two bridges. The white line refers to the kinematic PPP trajectory; the cross-hatched white line shows interpolated points between two solved points from the PPP solution. Because of loss of GNSS signals from the bridges, the yellow line indicates the actual vessel trajectory below bridges.
Figure 3. Layout of the first trajectory [DOY: 2014/126], zoom-in on bottom. (Photos: Google Earth)As mentioned before, the double-difference solution of the Bernese software is considered as the reference solution for the PPP solution. The PPP residuals for phase and code observations (not using double-difference solution) are presented in Figure 4. Here the residual values in phase and code have a gap because of the loss of GNSS signals, which starts from epoch 438 to 486 [GPS week second = 199845: 200115]. Additionally, there are some cycle slips from epoch 883 to 892 [GPS week second = 202105: 202150].
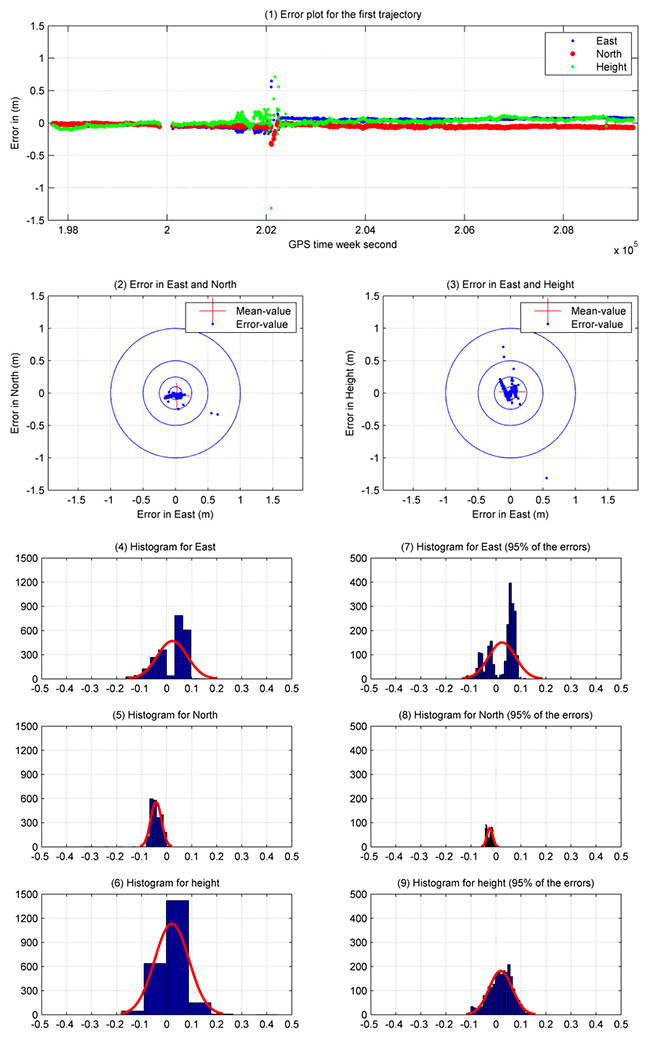
Figure 4. Satellite residuals for the first trajectory [DOY: 2014/126].To assess the accuracy of the PPP solution for this hydrographic trajectory, Figure 5 illustrates the analysis results for this trajectory between the double-difference and PPP solutions. The X-axis refers to the number of observations (one epoch/5 seconds), and the Y-axis indicates the error value in meters. Figure 5.1 shows the error plot (m) in east, north and height. As shown previously, the error values have a gap in the solution because of the loss of lock below the bridges. Moreover, there are some cycle slips later on, which decrease the estimated kinematic PPP accuracy.
Figures 5.2 and 5.3 provide the error plot for the east and north and east and height directions. The blue points refer to the errors, and the red cross refers to the mean value. Table 1 summarizes the PPP results.
Table 1. Statistical results of the first trajectory [DOY: 126/2014].Five percent of the PPP errors are eliminated to get outlier-free results. The SD (95%) of the kinematic PPP solution is obviously improved to reach 5.0 cm, 1.20 and 5.0 cm in east, north and height directions, respectively.
To distinguish between the standard deviation and the standard deviation based on 95 percent of the data, Figure 5 shows additionally the histogram of SD in Figures 5.4, 5.5 and 5.6 for east, north and height respectively. Figures 5.7, 5.8 and 5.9 provide the error with 95 percent of the results. Absolutely, the error range is improved by eliminating 5 percent of the data including outliers.
Figure 5. Analysis results for the first trajectory. Standard deviations shown in plots on the left, with outliers excluded, right.
Second Data Set. The second trajectory on the Rhine River was observed [DOY: 127] for more than 5 hours (see Figure 6). Sixteen satellites were observed during the measurement time.
Figure 6. Layout of the second trajectory [DOY: 127/2014]. (Photo: Google Earth)In Figure 7, the phase and code residuals are plotted. Some outliers are reported in this graph, which refers to cycle slips during the observations.
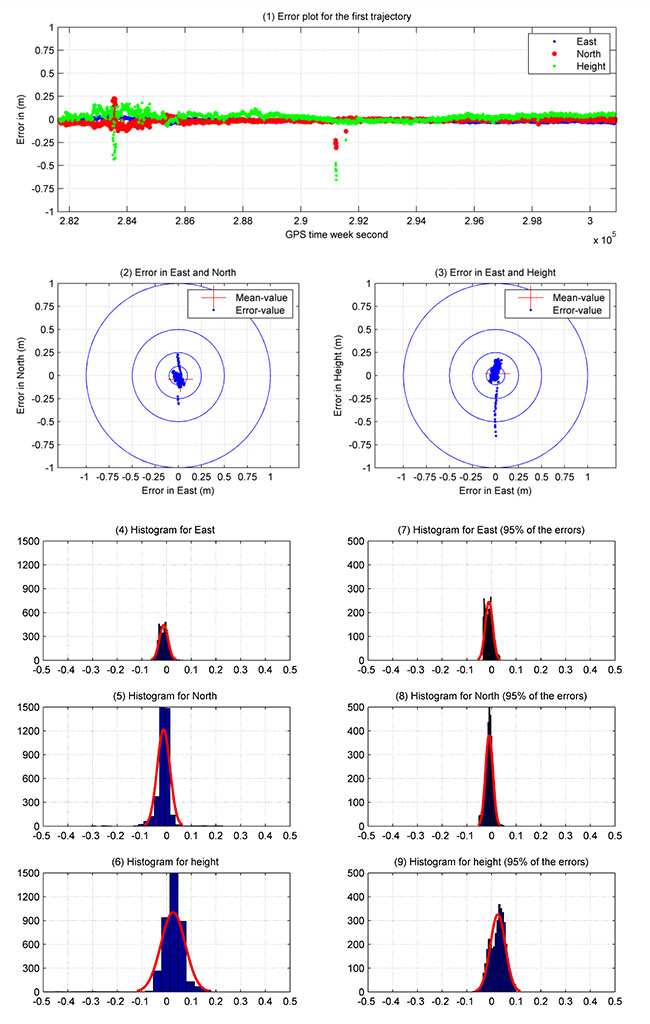
Figure 7. Satellite residuals for the second trajectory [DOY: 127/2014].Figure 8 illustrates the PPP results for this kinematic trajectory. Figure 8.1 shows the PPP error values in the east, north and height directions with respect to the double-difference solution from Bernese software.
Figure 8. Kinematic PPP solution for the second trajectory. Standard deviations shown in plots on the left, with outliers excluded, right.
The first 40 minutes of that trajectory were realized in a quasi-static observation technique (nonmoving vessel) from GPS week second 281660: 284060. The result obtained from this solution is more accurate due to the high number of satellites, and the trajectory did not include the bridges area. Figure 8.2 and 8.3 show errors in east and north, and east and height.
As shown in Table 2, the maximum and minimum values for the error range, which are presented in detail in Figure 8.4, 8.5 and 8.6, are reported in the east, north and height directions. These figures show the frequency histogram for the PPP errors. The RMS error from the solution is 2.10 cm and 2.90 cm in east and north respectively, with an RMS error of 5.60 cm in height. The standard deviation is definitely improved after eliminating 5 percent of the PPP errors as outliers. The standard deviation for 95 percent of the results shows 1.5 cm in east and north and 3 cm in height. The error histograms for 95 percent of the data are provided in Figures 8.7, 8.8 and 8.9.
Table 2. Statistical results of the second trajectory [DOY: 127/2014].The second trajectory clearly provides a higher accuracy than the first. Its data has a higher number of satellites and lower outliers than the first. Figure 8 shows the histogram of the second trajectory is similar to the Gaussian distribution curve.
Acknowledgments
The authors would like to thank Annette Scheider for receiving the GNSS measurements through the HydrOs project, our BfG partners Harry Wirth and Marc Breitenfeld, and Bernhard Galitzki form SAPOS-NRW for providing us with the reference stations.
This article is based on a peer-reviewed paper presented at the FIG Working Week, May 2015, in Sofia, Bulgaria.
Manufacturers
A Leica 1203+ antenna and GX1230+ GNSS receiver collected the data shown here.
Ashraf Abdallah is an assistant lecturer in engineering, Aswan University, Egypt, and a Ph. D. student at the Institute of Engineering Geodesy (IIGS), Stuttgart University, Germany. He received a master’s degree from Aswan University in applications of single-frequency GNSS.
Volker Schwieger is a full professor at the University of Stuttgart and director of the IIGS. He received a Ph.D. from the University of Hannover, focusing on GPS for monitoring applications.
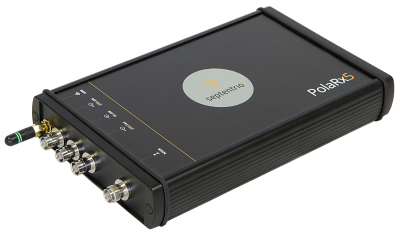
Septentrio has launched its next-generation GNSS receiver for precise scientific and geodetic applications — the PolaRx5. This new receiver in the PolaRx product line is developed specifically to support the most demanding applications for the Earth science community offering a select range of advanced features that enable maximum accuracy and functionality.
Powered by Septentrio’s next generation multi-frequency engine, the PolaRx5 offers 544 hardware channels for robust and high-quality GNSS tracking. The receiver supports all major satellite signals including GPS, GLONASS, Galileo and BeiDou, as well as regional satellite systems including QZSS and IRSS.
Septentrio’s Advanced Interference Mitigation (AIM+) technology enables the PolaRx5 to filter out both intentional and unintentional sources of radio interference, from narrowband signals over high-powered pulsed signals to chirp jammers and Irridium interferers. Furthermore, Septentrio’s patented APME+ multipath mitigation technology — which eliminates short delay multipath without introduction of bias — guarantees superior measurement quality. If needed, the user has the ability to activate or deactivate APME+ to obtain completely unmodified measurements.
Various independent tests have shown PolaRx5 consistently ranks high among GNSS receivers in many areas of measurement quality, including fewest number of cycle slips and lowest power consumption well below 2W.
PolaRx5 also introduces a new standard in ease-of-use. Thanks to Septentrio’s comprehensive web interface and the built-in Wi-Fi and Bluetooth interface, users have complete control and visibility of the receiver. The user’s web browser provides secure access to all receiver settings and status, data storage and firmware upgrades, as well as advanced monitoring such as a built-in spectrum analyzer.
“With PolaRx5, Septentrio has developed an advanced GNSS reference receiver to meet the advanced needs of our customers,” said Jan Leyssens, PolaRx5 product manager. “The selection of PolaRx by UNAVCO for their reference receiver needs illustrates the strengths of Septentrio’s robust technology and PolaRx’s innovative features such as its interference robustness, spectrum analyzer and web interface to make the PolaRx5 the leading GNSS reference receiver on the market today.”
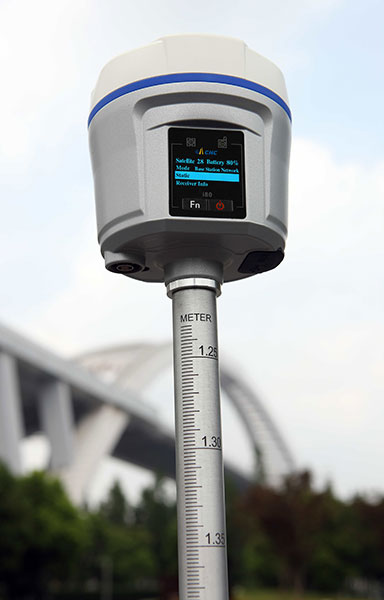
CHC Navigation has announced in a news release the availability of its new GNSS receiver, the i80.
The i80 receiver for surveyors and contractors is able to compute a true triple frequency RTK tilted pole sub-centimeter solution using all four worldwide and multiple regional constellations.
“Over two years of R&D and testing went into the creation of our Linux OS i80 platform,” said George Zhao, CEO of CHC.
The i80’s LCD GUI allows for common workflow operations, such as Static Logging, AutoBase, AutoRover, and UHF channel selection to be easily performed without the need of a data collector or computer. The CHC i80 is the smallest receiver on the market with dual hot-swappable batteries, CHC says. The receiver contains a full array of sensors and modules: multiple MEMS, Internal Tx/Rx UHF, multi-band cellular modem, Wi-Fi, Bluetooth, Serial, USB and more.
“This innovative design will allow us to add new functionality [with over the air updates] for years by combining the sensors and modules in new ways — this is illustrated by our LCD supported work modes, and our MEMS enabled unleveled pole surveying added in the last couple months during product rollout,” Zhao said. “We are bringing GNSS in to a new era of productivity and ergonomics in a low-cost open platform allowing for unrestricted third-party integration via our i80 API.”


![Figure 3. Layout of the first trajectory [DOY: 2014/126], zoom-in on bottom. (Photo: Google Earth)](https://stage.globalpositioningnews.com/wp-content/uploads/2015/12/Figure-4-W.jpg)
![Figure 4. Satellite residuals for the first trajectory [DOY: 2014/126].](https://stage.globalpositioningnews.com/wp-content/uploads/2015/12/Figure-5-W.jpg)
![Table 1. Statistical results of the first trajectory [DOY: 126/2014].](https://stage.globalpositioningnews.com/wp-content/uploads/2015/12/Table1.jpg)
![Figure 6. Layout of the second trajectory [DOY: 127/2014]. (Photo: Google Earth)](https://stage.globalpositioningnews.com/wp-content/uploads/2015/12/Figure-7-W.jpg)
![Figure 7. Satellite residuals for the second trajectory [DOY: 127/2014].](https://stage.globalpositioningnews.com/wp-content/uploads/2015/12/Figure-8-W1.jpg)
![Table 2. Statistical results of the second trajectory [DOY: 127/2014].](https://stage.globalpositioningnews.com/wp-content/uploads/2015/12/Table2.jpg)