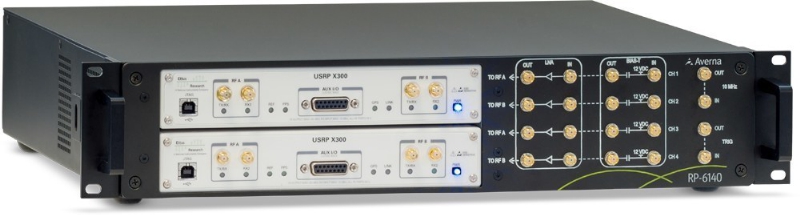
Averna has launched an RF tool offering high-performance record-and-playback and real-time simulation in one platform.
The Averna RP-6100 series is a self-contained, record-and-playback solution for RF application validation. It can capture all GNSS bands, as well as HD Radio, Wi-Fi, LTE, radar, and cognitive radio — plus impairments — to significantly advance RF projects and harden product designs. The RP-6100 series features up to four channels, 160 MHz of recording bandwidth, tight channel synchronization, an extended frequency range of 10 MHz to 6 GHz, and 14-bit resolution.
The RP-6100 can also be equipped with Skydel Solutions’ software-defined, real-time GNSS simulator, which delivers easy setups, integrated maps, dynamic scenario creation, high precision and tight parameter controls to enable highly repeatable simulations of current and future GNSS conditions, as well as corner cases.
Features include:
Frequency range of 10–6000 MHz, covering all GNSS bands, plus HD Radio, WiFi, LTE, and more
Multi-channel (1-4): Up to 160 MHz of bandwidth at 14-bit resolution (< 1 Hz)
3.8 TB SSD storage or 16 TB HDD storage (for up to 22 hours of recordings)
Preloaded with RF Studio software for quick setups and in-depth analysis
Four models: RP-6120 (2 ch.), RP-6120P (2 ch. portable), RP-6120D (2 ch. desktop) and RP-6140 (4 ch.)
Optional real-time Skydel GNSS Simulator for complete GNSS corner-case/testing scenarios
“We are very excited to partner with Skydel Solutions as a way to continue to provide our customers with the latest technologies and products,” said Benoit Richard, VP of Innovation & Strategy at Averna. “Their technology maps perfectly with our portfolio of RF instrumentation solutions, which empower device manufacturers to efficiently generate, record, simulate, analyze, and play back all common radio, video, and navigation signals, ensuring complete test coverage and the highest quality for their RF products.”
“Today, Skydel is proud to introduce its software-defined GNSS Simulator, running in real-time Ettus and NI USRP hardware,” said Stéphane Hamel, co-founder and CEO of Skydel Solutions. “We are also very pleased to announce that our GNSS Simulator can be combined with Averna’s RP-6100 Series. These technologies complement each other perfectly, making the combined solution the ideal platform for high-performance design validation of RF and GNSS devices.”
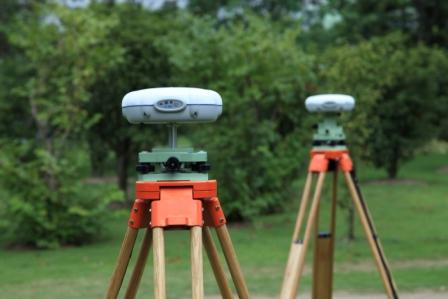
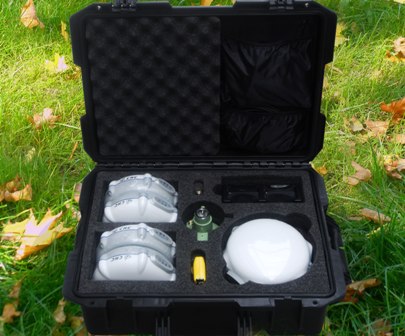
The UAV Ground Control (UAV GC) and post-processing kit for high-precision UAV systems by CHC Navigation.
CHC Navigation has launched a new UAV Ground Control (UAV GC) and post-processing kit for high-precision UAV systems. This kit is designed to provide an easy-to-operate complete system, and be cost-effective for producing centimeter-level control for UAV projects.
The standard kit includes five GNSS receivers with expansion of additional receivers in pairs. The core of the system is the X900+OPUS, a dual-frequency triple-constellation receiver capable of cm positioning of the project at 200 km in absolute geodetic space. The secondary X20+ receivers serve as ground-control points for orthorectification, project verification, and other high-accuracy positional tasks.
“Low cost and easy to use, the CHC UAV GC system is a necessity for any UAV manufacturer or operator who is interested is promoting/proving the high accuracy of their deliverables,” said George Zhao, CEO of CHC Navigation. “The UAV Package offers unrivaled performance at an unheard of low price, and fills the last remaining gap for a complete whole product solution in the UAV market.”
The UAV GC kit is now available through the existing CHC distribution channel worldwide.
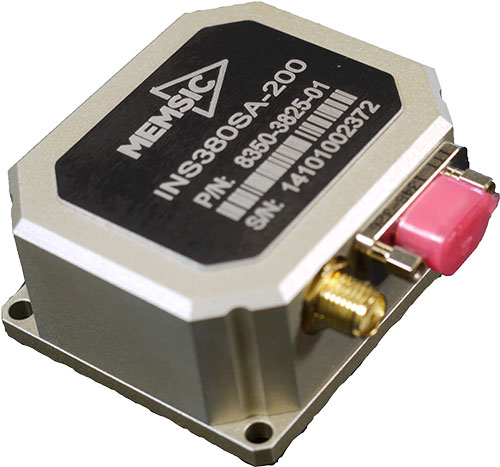
MEMSIC has launched its latest inertial system, the INS380 — a complete inertial navigation system with a built-in 48-channel GPS receiver. The INS380 is part of a portfolio of inertial systems enabled with MEMSIC’s SmartSensingtechnology for a broad range of precision-motion sensing applications.
The MEMSIC portfolio consists of inertial measurement units (IMU), vertical gyros (VG), attitude and heading reference systems (AHRS), inertial navigation systems (INS) and tilt measurement systems in a variety of packages for system designers and end-equipment manufacturers.
The SmartSensing technology enables a turnkey system with better than 0.01 m/s velocity measurement accuracy. The integrated 3-axis magnetometer allows for accurate operation when the GPS signal is lost or when the vehicle comes to a stop. SmartSensing provides users with sensor fusion and performance in critical motion sensing applications.
SmartSensing combines enhanced and patented Kalman-based algorithm with proprietary temperature, motion and alignment calibration for consistent and high-accuracy performance over a wide range of extreme operating conditions. Applications include unmanned ground and aerial vehicles, platform stabilization, avionics, precision agriculture, construction and more.
INS380SA-400 EVALKIT is available for evaluation and ships completer with an INS380 unit along with necessary accessories for quick installation. Designers can evaluate and configure the system using MEMSIC’s NavView Software, available for download.
Advanced driver-assistance systems (ADAS) are now integrated in all luxury cars and moving into mainstream models. Governments are getting involved to prevent accidents and minimize the related economic impacts with them. Manufacturers are not far behind; every one of them wishes to be seen as a technology master. Most car and truck companies are working actively on qualifying fully driverless technology today. The military also has a high interest in this area, and has developed autonomous convoy capability for large trucks and supply vehicles.
Although no driverless car is expected to operate freely on public roads for the next 10 years, some open test drives have already taken place, including one 100-mile highway cruise by a driverless Mercedes. This technology is restrained by legal issues and the lack of reliable nationwide mapping data — but the platforms are nearly ready to go.
Join us as we explore the current state of affairs and the likely near-term future developments.
Speakers:
John Fischer, Chief Technology Officer, Spectracom
Fischer has more than 30 years experience creating navigation and communications systems, received his Masters in electrical engineering from SUNY at Buffalo and has worked in radar, command and control, and wireless systems prior to joining Spectracom. To learn more, visit www.spectracom.com.
Lisa Perdue, Applications Engineer, Spectracom
Perdue is an applications engineer at Spectracom and a specialist in GNSS simulation. She has more than 15 years of navigation and RF systems experience, including 10 years of Naval Service.
Topics:
Accurate positioning of ADAS vehicles on the test track using similar methods as used in military UAVs – John Fischer
GNSS and Hybrid Navigation Testing Issues for ADAS and Driverless Cars – Lisa Perdue
Realtime Testing Issues for V2V and V2X for ADAS and Driverless Cars – John Fischer
Screenshot of a mobile mapping service integrating USGS topographic data; hiking and biking trails south of Golden, Colo. Imagery with road and contour data overlaid via AlpineQuest.
Are you a developer, firm, or organization using mobile or web applications to enable your users? The United States Geological Survey (USGS) has publicly available geospatial services and data to help your application development and enhancement.
The USGS’ National Geospatial Technical Operations Center (NGTOC) will be hosting a 30-minute webinar on “Using The National Map services to enable your web and mobile mapping efforts” on June 16 at 9 a.m. MT.
Screenshot of a mobile mapping service integrating USGS topographic data; hiking and biking trails south of Golden, Colo. Trail data in KML/GPX overlaid via AlpineQuest.
This webinar will feature a brief overview of services, data and products that are publicly available, a quick overview on how AlpineQuest, a leading private firm, is leveraging this public data to benefit their users, and a Question & Answer session with a USGS developer to help you get the most out of the national geospatial services.
“This is an opportunity from NGTOC to bring developers and users together for some demonstrations and starting some dialogue,” said Brian Fox, the NGTOC Systems Development Branch Chief. “The webinar format allows us to improve awareness of USGS geospatial services and develop a better understanding of what users and developers need to make our data and services more available and usable.”
To access the webinar, you’ll need to activate Cisco WebEx and call into the conference number (toll free) 855-547-8255 and use the security code: 98212385. The webinar will display through WebEx.
Use this system diagnosis to ensure that you have the appropriate players installed for this WebEx enabled webinar.
The session will be recorded and closed caption option is available.
Click here to find out more about this and other NGOC webinar conferences.
Researchers experimentally demonstrate the first wireless network synchronized with accuracy of a billionth of a second.
A new timing protocol, dubbed “Blink,” would allow for timing greater than that provided by GPS satellites. According to researchers, the protocol would allow for wireless transmission over longer distances with less energy — while improve the overall efficiency of wireless networks.
Such an enhanced timing technology could result in applications like coordinated signal jamming of enemy military receivers; extremely precise localization; coordinated navigation, tracking, and operation of UAVs; convoys of autonomous vehicles; and distributed beam forming.
At the 2015 IEEE International Conference on Communications, being held June 8-12 in London, Andreas Molisch, professor of Electrical Engineering at the University of Southern California’s Viterbi School of Engineering, presented the paper, “Experimental Demonstration of Nanosecond-Accuracy Wireless Network Synchronization.”
Molisch co-authored the paper with Marcelo Segura and S. Niranjayan, former post-doctoral students at USC, and Hossein Hashemi, also professor of Electrical Engineering at USC Viterbi.
In the paper, the researchers experimentally demonstrate the first wireless network synchronized with nanosecond accuracy.
Segura, Niranjayan, Hashemi and Molisch have developed a prototype, consisting of four nodes that synchronize to each other with an accuracy of approximately three nanoseconds. They also introduced a scalable protocol, which they call the “Blink” algorithm, that extends the same accuracy of the current small-size prototype (in this case, four wireless devices) to hundreds or even thousands of wireless devices.
“Previous research has addressed precision synchronization, but, in the publically available literature, nanosecond accuracy was achieved only by connecting devices via cables, and only between few wireless devices. Even though GPS is widely used and is considered very precise, it does not easily provide this level of accuracy, and cannot be used in many indoor settings,” Hashemi said.
Instead of requiring a precision of minutes, wireless devices have to make their clocks match within very small fractions of a second. This “clock synchronization” is needed for a large range of purposes — from increasing cellphone coverage, to increasing data speed rates, to enabling precision localization in places where GPS is not available. Some of these activities require synchronization within “only” a millionth of a second, a requirement that has been achieved by a variety of methods.
One nanosecond, a billionth of a second, is how long it takes light to travel over one foot through the air. It is at this focused level that researchers have competed to develop solutions to push synchronization to a billionth of a second, or what is known as “nanosecond accuracy.”
Synchronizing a whole network of wireless devices to such accuracy would enable a host of new possible applications, from precise localization to energy-efficient transmission for “Internet of things” sensor networks. However, it is remarkably hard to achieve such a level of synchronization, especially when the clocks in the devices are low-cost and not very precise.
While this work has considerable applications for the military, it also has indications for other instances in which increased precision is necessary such as communication among a group of driverless cars to share location information. Other possible applications include helping a person with limited sight navigate an indoor physical space, or providing a map for robots employed in the home or in industrial settings.
The research was supported primarily by the Office of Naval Research and the Ming Hsieh Institute at USC.
Forsberg Germany has begun a strategic partnership with Septentrio Satellite Navigation. Forsberg Germany is an OEM component supplier and system integrator, and Septentrio is a designer and manufacturer of GPS/GNSS receivers.
Under the partnership, Forsberg Germany will become a distributor of Septentrio’s OEM boards. Forsberg Germany will sell and support Septentrio OEM receivers in Germany, Austria and Switzerland. This partnership combines Septentrio’s cm-accurate GNSS positioning technology and products with Forsberg Germany’s extensive market experience and engineering expertise, the companies said in a statement.
“We are excited about this new partnership with Forsberg Germany,” said Koen Gutscoven, vice president of sales at Septentrio. “Forsberg Germany is a pioneer in European professional navigation systems and has in-depth knowledge of our technology and markets. They are an excellent partner in guiding and supporting our customers towards winning implementations in which reliability and accuracy matter.”
“We believe that our partnership with Septentrio to supply their products and services will bring enormous benefits to our customers and Forsberg Germany,” said Charles Forsberg, managing director of Forsberg Services Limited. “Septentrio are renowned throughout the industry for first-class positioning technology and customer support. We highly value the opportunity to work with Septentrio.”
Hurricane Fran at peak intensity on Sept.4, 1996. (Image: NOAA)
More than 6.6 million homes on the Atlantic and Gulf coasts are at risk of hurricane storm surge inundation with a total reconstruction cost of nearly $1.5 trillion, according to a new storm surge analysis released today by CoreLogic.
The CoreLogic analysis examines risk from hurricane-driven storm surge for homes along the Atlantic and Gulf coastlines of 19 states and the District of Columbia, as well as for 84 metro areas. Homes are categorized among five risk levels, including Low, Moderate, High, Very High and Extreme.
In addition to the number of homes at risk, the analysis provides reconstruction cost values (RCVs), which indicate how much is required to rebuild the property, including labor and materials, and assuming worst-case scenario at 100-percent destruction (see Table 1).
Table 1: Residential Exposure by Storm Category for the Entire U.S.
Storm Surge Risk Level (Storm Category)
Total Homes Potentially Affected
Total Estimated RCV(U.S. dollars)
Extreme (Affected by a Category 1-5 storm)
1,651,978
$393,494,752,074
Very High (Category 2-5)
1,438,526
$324,225,419,007
High (Category 3-5)
1,654,925
$371,135,087,394
Moderate (Category 4-5)
1,178,196
$267,395,972,220
Low (Category 5)
685,391
$132,090,242,053
Total
6,609,016
$1,488,341,472,748
At the regional level, the Atlantic Coast has more than 3.8 million homes at risk of storm surge in 2015 with an RCV of $939 billion, and the Gulf Coast has just under 2.8 million homes at risk and nearly $549 billion in potential exposure to total destruction damage (Table 2).
Table 2: Residential Exposure by Coastal Region
Region
Atlantic Coast Homes
Atlantic Coast RCV (U.S. Dollars)
Gulf Coast Homes
Gulf Coast RCV (U.S. Dollars)
Extreme
1,018,371
$264,963,399,509
633,607
$128,531,352,565
Very High
911,091
$223,821,396,433
527,435
$100,404,022,574
High
860,657
$212,741,476,684
794,268
$158,393,610,710
Moderate
686,061
$172,277,118,076
492,135
$95,118,854,144
Low
332,984
$65,334,507,800
352,407
$66,755,734,253
Total
3,809,164
$939,137,898,502
2,799,852
$549,203,574,246
“The number of hurricanes each year is less important than the location of where the next hurricane will come ashore,” said Tom Jeffery, senior hazard risk scientist for CoreLogic. “It only takes one hurricane that pushes storm surge into a major metropolitan area for the damage to tally in the billions of dollars. With new home construction, and any amount of sea-level rise, the number of homes at risk of storm surge damage will continue to increase.”
Table 3 shows that six states account for more than three-quarters of all at-risk homes nationally. Florida has the highest total number of properties at various risk levels (2,509,812), followed by Louisiana (760,272), New York (464,534), New Jersey (446,148), Texas (441,304) and Virginia (420,052). Even though Louisiana has the second most homes at risk of storm surge, only one-quarter of these homes are in the extreme or very high storm surge category due, in large part, to the upgrade and expansion of levees in Louisiana.
Table 3: State Table (Ranked by Number of Homes at Risk)
Rank
State
Extreme
Very High
High
Moderate
Low*
Total
1
Florida
793,204
461,632
524,923
352,102
377,951
2,509,812
2
Louisiana
97,760
104,059
337,495
138,762
82,196
760,272
3
New York
127,325
114,876
131,039
91,294
N/A
464,534
4
New Jersey
116,581
178,668
73,303
77,596
N/A
446,148
5
Texas
45,800
70,894
112,189
116,168
96,253
441,304
6
Virginia
94,260
115,770
98,463
84,015
27,544
420,052
7
South Carolina
107,443
57,327
65,885
46,799
30,961
308,415
8
North Carolina
73,463
51,927
48,595
40,155
37,347
251,487
9
Massachusetts
31,420
65,279
74,413
49,325
N/A
220,437
10
Maryland
47,990
39,966
27,591
28,975
N/A
144,522
11
Georgia
41,970
52,281
28,852
19,190
8,465
150,758
12
Pennsylvania
1,467
45,776
37,983
32,426
N/A
117,652
13
Mississippi
14,809
20,643
29,387
27,507
10,588
102,934
14
Connecticut
25,292
23,656
22,230
26,529
N/A
97,707
15
Alabama
7,403
12,707
10,182
13,749
14,086
58,127
16
Delaware
11,523
10,854
13,528
13,811
N/A
49,716
17
Rhode Island
6,595
5,988
6,720
7,187
N/A
26,490
18
Maine
5,159
2,753
7,368
7,211
N/A
22,491
19
New Hampshire
2,514
3,470
4,234
2,272
N/A
12,490
20
District of Columbia
N/A**
N/A**
545
3,123
N/A
3,668
Total
1,651,978
1,438,526
1,654,925
1,178,196
685,391
6,609,016
* The “Low” risk category is based on Category 5 hurricanes, which are not likely along the northeastern Atlantic coast. States in that area have N/A designated for the Low category due to the extremely low probability of a Category 5 storm affecting that area.
** Washington, D.C. has no Atlantic coastal properties, but can be affected by larger hurricanes that push storm surge into the Potomac River. Category 1 and 2 storms will likely not generate sufficient storm surge to affect properties in Washington, D.C.
“The levee system in and around New Orleans is one of the most extensive in the world,” said Jeffery. “After Hurricane Katrina in 2005, upgrades were planned for the network of levees and pumping stations to reduce the potential devastation from future storms. Upgrades were completed in 2013, and CoreLogic analysis shows a significant number of homes are now protected from all but the higher category hurricanes as a result.”
At the local level, five Core Based Statistical Areas (CBSAs) rank the highest in both number of homes at risk and total RCV. They include New York-Newark, NY-NJ-PA; Miami-Fort Lauderdale-West Palm Beach, FL; Tampa-St. Petersburg-Clearwater, FL; Virginia Beach-Norfolk-Newport News, VA-NC; and New Orleans-Metairie, LA (Table 5).
Table 5: Storm Surge Risk for Top 5 Metro Areas
Rank
Metropolitan Area
Total Properties Potentially Affected By All Categories of Hurricane
Total RCV (U.S. Dollars)
1
New York, NY
685,152
$244,312,501,442
2
Miami, FL
564,913
$105,134,042,455
3
Tampa, FL
447,990
$78,191,384,320
4
Virginia Beach, VA-NC
395,341
$86,393,517,790
5
New Orleans, LA
380,120
$84,242,355,537
Additional findings in the CoreLogic storm surge analysis:
The five states with the highest RCV for homes at risk include: Florida ($491,119,183,016), New York ($177,398,620,779), Louisiana ($162,096,659,527) New Jersey ($126,829,146,685) and Virginia ($91,049,049,641).
The five states (including the District of Columbia) with the lowest RCV for homes at risk include: District of Columbia ($351,443,177), New Hampshire ($3,215,714,570) Maine ($5,807,400,656), Rhode Island ($7,476,741,658) and Alabama ($9,954,390,796).
The five states (including the District of Columbia) with the lowest total number of properties at risk include: the District of Columbia (3,668), New Hampshire (12,409), Maine (22,491), Rhode Island (26,490) and Delaware (49,716).
Virginia Beach-Norfolk-Newport News, VA-NC has the highest percentage of homes (87 percent) at risk of storm surge, but not designated in a FEMA flood zone. Philadelphia-Camden-Wilmington, PA-NJ-DE-MD and Jacksonville, Fla. also top the list at 85 percent and 77 percent, respectively.
The CoreLogic storm surge analysis also complements Federal Emergency Management Agency (FEMA) flood zone information to provide a snapshot of potential damage exposure at the property level, as many properties located outside designated FEMA flood zones are still at risk for storm surge damage. Standard FEMA flood zones are designed to identify areas at risk for both freshwater flooding, as well as storm surge, based on the likelihood of either a 100-year or 500-year flood event. They do not differentiate risk based on storm severity, and as a result, do not accurately define the total extent of potential risk along coastal areas.
Homeowners who live outside the FEMA flood zones frequently do not carry flood insurance, given that there is no mandate to do so, and therefore may not be aware of the potential risk storm surge poses to their properties.
To illustrate varying degrees of flood risk exposure, the analysis compares homes that are not located within FEMA 100-year floodplains against the number of homes located in surge inundation zones, as well as those located in both surge and FEMA Special Flood Hazard Areas (SFHA). This data can be found in the full report.
Table 4: Reconstruction Value of Properties at Risk by State (U.S. Dollars)
Rank
State
Extreme
Very High
High
Moderate
Low
Total
1
Florida
$166,127,920,621
$87,593,956,407
$100,948,271,678
$66,046,901,592
$70,402,132,718
$491,119,183,016
2
New York
$50,677,202,371
$43,738,512,048
$47,941,521,073
$35,041,385,287
N/A
$177,398,620,779
3
Louisiana
$19,219,426,239
$20,723,521,330
$73,585,253,144
$30,455,626,839
$18,112,831,975
$162,096,659,527
4
New Jersey
$32,539,401,471
$49,279,239,412
$21,290,996,129
$23,719,509,673
N/A
$126,829,146,685
5
Virginia
$21,749,493,964
$24,472,282,097
$20,790,731,449
$17,769,718,808
$6,266,823,323
$91,049,049,641
6
Texas
$7,378,747,508
$10,949,102,801
$19,458,405,318
$21,932,930,066
$18,483,135,047
$78,202,320,740
7
South Carolina
$27,968,086,462
$12,767,874,946
$13,882,875,874
$9,539,308,384
$6,213,580,227
$70,371,725,893
8
Massachusetts
$10,293,155,124
$17,512,619,612
$21,563,396,990
$15,311,723,734
N/A
$64,680,895,460
9
North Carolina
$13,933,404,480
$10,330,860,954
$9,906,870,506
$7,751,458,704
$7,201,904,492
$49,124,499,136
10
Maryland
$11,764,631,642
$9,641,288,327
$6,381,209,263
$6,920,924,916
N/A
$34,708,054,148
11
Connecticut
$9,162,361,469
$8,157,864,151
$7,292,127,632
$8,774,300,132
N/A
$33,386,653,384
12
Georgia
$11,052,557,614
$10,521,985,895
$5,291,887,200
$3,457,728,530
$1,389,552,868
$31,713,712,107
13
Mississippi
$2,828,758,155
$3,858,574,230
$5,351,501,617
$4,850,283,320
$1,766,898,284
$18,656,015,606
14
Pennsylvania
$314,850,616
$5,812,076,371
$6,283,697,262
$4,819,045,458
N/A
$17,229,669,707
15
Delaware
$3,604,927,907
$3,338,893,060
$4,202,564,034
$3,823,191,061
N/A
$14,969,576,062
16
Alabama
$1,266,591,391
$2,252,764,464
$1,761,389,904
$2,420,261,918
$2,253,383,119
$9,954,390,796
17
Rhode Island
$1,819,637,687
$1,759,354,804
$1,917,701,002
$1,980,048,165
N/A
$7,476,741,658
18
Maine
$1,247,207,669
$728,679,536
$1,966,851,214
$1,864,662,237
N/A
$5,807,400,656
19
New Hampshire
$546,389,684
$785,968,562
$1,255,120,636
$628,235,688
N/A
$3,215,714,570
20
District of Columbia
N/A
N/A
$62,715,469
$288,727,708
N/A
$351,443,177
Total
393,494,752,074
324,225,419,007
371,135,087,394
267,395,972,220
132,090,242,053
1,488,341,472,748
Additional CBSA data, market rankings, regional, state and local-level maps are available upon request.
Methodology
The 2015 CoreLogic storm surge analysis encompasses single-family residential structures including mobile homes, duplexes, manufactured homes and cabins, among other non-traditional home types. Year-over-year changes in the number of homes at risk and RCV can be the result of several variables, including new home construction, improved public records, enhanced modeling techniques, fluctuation in labor, equipment and material costs, and even potential rise in sea level.
As a result, direct year-over-year comparisons should be avoided. To estimate the value property exposure of the single-family residences CoreLogic utilized it’s proprietary Marshall & Swift/Boeckh reconstruction cost valuation methodology.
This methodology estimates the cost to rebuild the property in the event of a total loss and is not to be confused with property market values or new construction cost estimation. Reconstruction cost estimates more accurately reflect the actual cost of damage or destruction of residential buildings that would occur from hurricane-driven storm surge since they include the cost of materials, equipment and labor needed to rebuild, and also factor in geographical pricing differences.
Actual land values are not included in the estimates. The values are based on 100-percent or total destruction of the residential structure. Depending upon the amount of surge water from a given storm, there may be less than 100 percent damage to the residence, which would result in a lower realized reconstruction cost value.
Storm surge is triggered primarily by the high winds and low pressure associated with hurricanes, which cause water to amass inside a storm as it moves across the ocean before releasing as a powerful rush overland when the hurricane moves onshore. In addition to the property damage and potential lives lost to flooding, the speed and force associated with storm surge waves can significantly increase geographic and economic impact in hurricane disaster areas.
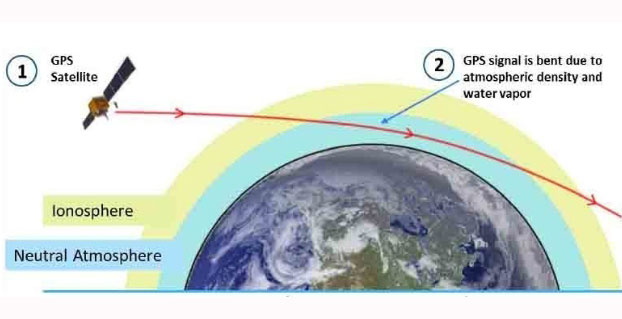
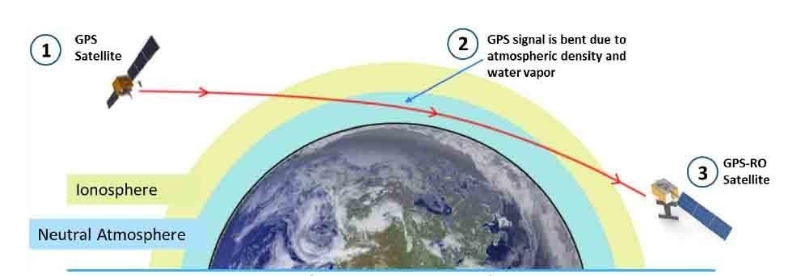
PlanetiQ has started testing its first Pyxis weather instrument with successful processing of GPS signals. The Pyxis represents a new paradigm in satellite weather sensor technology that can penetrate through clouds and storms to produce the highly calibrated data required to dramatically improve weather forecasting, climate monitoring and space weather prediction, all at a much lower cost than traditional satellite weather instruments, PlanetiQ said.
Pyxis will track GPS signals traveling through Earth’s atmosphere and convert them into dense, precise measurements of global temperature, pressure and water vapor — similar to data collected by weather balloons but on a global scale — using a technique called GPS radio occultation (GPS-RO).
Pyxis is the only GPS-RO sensor in such a small package that is powerful enough to routinely probe down into the lowest layers of the atmosphere where severe weather occurs. In addition, Pyxis is able to track signals from all four major satellite navigation systems (GPS, Galileo, Beidou and GLONASS).
PlanetiQ’s planned microsatellite constellation, with an initial set of 12 satellites launching in 2016 and 2017, will deliver more than 8 million observations per day of temperature, pressure and water vapor, or more than 10 times the amount of data available from GPS-RO sensors currently on orbit.
GPS-RO has shown the highest impact per observation on forecast accuracy among the satellite data sources ingested into computer weather models, and is particularly effective at improving predictions of high-impact weather such as hurricanes, severe weather outbreaks and winter storms. However, the amount of GPS-RO data available to date has been sparse.
The Pyxis sensor development team is based in Boulder, Colo., and led by PlanetiQ Founder Chris McCormick, who was instrumental in designing the sensors on the U.S.-Taiwan Constellation Observing System for Meteorology, Ionosphere, and Climate (COSMIC), the world’s first and only satellite constellation of proven GPS-RO sensors.
“Weather has an immense human and societal impact and affects businesses on a daily if not hourly basis, with a $9.7 trillion economic influence globally,” said Anne Hale Miglarese, president and CEO of PlanetiQ. “Improving the weather forecast and developing innovative risk analytics tools are critical to mitigate these growing costs, and the key is more high-quality weather data.”
“The Earth’s atmosphere is radically under-sampled at present especially over the oceans, which cover 70 percent of the Earth’s surface. With the speed of innovation in sensor technology, space hardware and launch, the weather forecast will dramatically change for the better in the near future,” McCormick said. “The Pyxis represents a major step forward in improving forecast accuracy for both routine weather and big storms, while leveraging the latest advances in science, technology and miniaturization to drive down costs.”
Explore further:
PlanetiQ President and CEO Anne Hale Miglarese discussed the project on The Weather Channel in August 2014.
Attila Komjathy, a NASA Jet Propulsion Laboratory principal investigator and adjunct professor in the University of New Brunswick’s Department of Geodesy and Geomatics Engineering, was named a Fellow of the Institute of Navigation in January for his work on remote sensing of the Earth’s ionosphere using signals from GNSS.
The OriginGPS Multi Spider module provides high sensitivity and noise immunity by incorporating its proprietary Noise Free Zone technology for faster position fix and navigation stability even under challenging satellite signal conditions.
SiRFstarV — CSR’s GNSS receiver that tracks both GPS and GLONASS satellites — has the CSR mbed Shield, which comes fitted with the OriginGPS Multi Spider module (ORG4572) requiring 1V8 supply, ground, UART interface and connection to GNSS capable antenna. Additional IOs are available for interrupts, turning the receiver on and off, reset, fix status and power mode information.
The OriginGPS Multi Spider is a tiny GPS + GLONASS module designed to support ultra-compact applications in which size is at a premium, such as smartwatches, wearable devices, trackers and digital cameras. It is a fully integrated, highly sensitive GPS + GLONASS receiver module measuring 7 x 7 x 2.1 millimeters.
The Multi Spider continuously tracks all GPS and GLONASS satellites in view and provides real-time positioning data in the standard industry format, defined by the U.S. National Marine Electronics Association (NMEA).
For more information about GPS/GNSS modules, visit OriginGPS.
This Landsat 8 image, Caltech acquired on Sept. 6, 2014, is a false-color view of the Holuhraun lava field north of Vatnajökull glacier in Iceland. The Bárðarbunga caldera is visible in the lower left of the image under the ice cap. Photo: U.S. Geological Survey / Caltech
Access to satellite images and GPS data has allowed scientists to document the collapse of the Bárðarbunga caldera, a volcano beneath the Vatnajökull ice cap in Reykjavik, Iceland.
Mark Simons, a professor of geophysics at the California Institute of Technology (Caltech), traveled to Reykjavik with 15 students and two faculty members on Aug. 16, 2014, to lead a tour of the volcanic, tectonic, and glaciological highlights of Iceland. That day, earthquakes occurred — the seismicity was related to the Bárðarbunga caldera.
Simons is one of the leaders of a Caltech and Jet Propulsion Laboratory (JPL) project known as the Advanced Rapid Imaging and Analysis (ARIA) program, which aims to use a growing constellation of international imaging radar satellites that will improve situational awareness and response following natural disasters, according to Caltech. Under the ARIA umbrella, Caltech and JPOL, managed for NASA by Caltech, had formed a collaboration with the Italian Space Agency (ASI) to use its COSMO-SkyMed (CSK) constellation — consisting of four orbiting X-Band radar satellites — following such events.
CSK used an interferometric synthetic aperture radar (InSAR) technique to gather images of the surface of the glacier above the caldera. By the evening of Aug. 28, Caltech says the first interferogram showed that the ice above the caldera was subsiding at a rate of 19.685 inches a day.
Simons took the data to researchers at the University of Iceland who were tracking Bárðarbunga’s activity on Aug. 29.
“At that point, there had been no recognition that the caldera was collapsing. Naturally, they were focused on the dyke and all the earthquakes to the north,” Simons said. “Our goal was just to let them know about the activity at the caldera because we were really worried about the possibility of triggering a subglacial melt event that would generate a catastrophic flood.”
The flood never occurred, but Caltech says the researchers at the University of Iceland increased their observations of the caldera with radar altimetry flights and installed a continuous GPS station on the ice overlying the center of the caldera.
The Icelandic researchers published a paper in December 2014 in Nature about the Bárðarbunga event, largely focusing on the dyke and eruption. Simons and his colleagues have developed a model to describe the collapsing caldera and the earthquakes produced by that action. The new findings appear in the Geophysical Journal International.
Bryan Riel, a graduate student in Simons’s group and lead author on the paper, used the interferogram of the Bárðarbunga area, along with four others collected by CSK in September and October, to show that the earthquakes were not the primary cause of the surface deformation inferred from the satellite radar data.
“What we know for sure is that the magma chamber was deflating as the magma was feeding the dyke going northward,” Riel said in the article. “We have come up with two different models to explain what was actually generating the earthquakes.”
“Because we had access to these satellite images as well as GPS data, we have been able to produce two potential interpretations for the collapse of a caldera — a rare event that occurs maybe once every 50 to 100 years,” Simons said. “To be able to see this documented as it’s happening is truly phenomenal.”