Esri has published an interactive Wildfire Public Information Map and a 2015 California Wildfire Activity Map.
Wildfire Public Information Map
The Wildfire Public Information Map provides continuously updated information about wildfires and their perimeters from the U.S. Geological Survey and other agencies. It provides live weather warnings and wind information from the National Oceanic and Atmospheric Administration, as well as live weather radar from AccuWeather. A local perspective on events is available by turning on geotagged social media from Twitter, YouTube and Flickr on the Layers tab.
2015 California Wildfire Activity
This story map provides a detailed look at 15 active fires throughout California. As you scroll through the map, you can view fire perimeters and hot spots for each active fire, and get up-to-date statistics about each blaze, including total acreage, percent containment and damage caused.
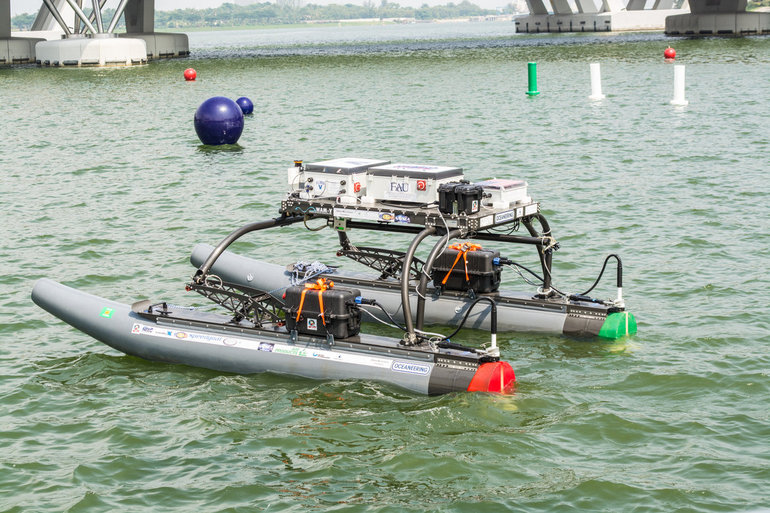
A research team at Florida Atlantic University’s (FAU) College of Engineering and Computer Science has received a $187,000 grant from the Florida Department of Transportation (FDOT) to develop autonomous waterborne vehicles that can assist in bridge inspections.
Although the technology is still in the early stages of development, the long-term aim is that the unmanned surface vehicles (USVs) could be used by the agency to make bridge inspectors’ work safer and more efficient, according to GovTech.com. FDOT currently uses a variety of methods and equipment to inspect and test the sections of the state’s 11,451 bridges that are above water level. However, the only method that can be used to check the sub-surface areas is divers, who search for cracks, erosion, damage and defects that might impact on a bridge’s safety. A high percentage of Florida’s bridges are in corrosive salt water, and divers frequently experience problems with low visibility from silt, sediment, debris and algae, weed or other plant matter.
The team from FAU’s Department of Ocean and Mechanical Engineering have experience in USV research, and won second place at the eighth annual International RoboBoat Competition in Virginia Beach, Va., according to GovTech.com.
Two months into a 12-month project, the team has upgraded a watercraft used for past research projects with a new propulsion system that allows the craft to maintain its position and heading during a bridge scan. The next phase of research will be to equip the craft with an acoustic scanning system that functions in a similar manner to a LiDAR (Light Detection and Ranging) system. By installing the scanner on a mount that can tilt and pan, researchers expect to obtain 3D models of the parts of the bridge that are below the water.
The current vessel is equipped with an automatic control system that uses GPS and a compass to direct the craft toward programmed waypoints, and can keep it steady in a variable current, allowing scanning to take place. Once the acoustic scanner is equipped in September, the team will begin testing the craft’s scanning capabilities on three bridges that have been recommended by FDOT for their diverse representation of the state’s bridge environments.
“These sorts of technologies aren’t really meant to replace wholesale divers and so forth,” the FAU project’s principal investigator, Karl von Ellenrieder, told GovTech.com. “It’s to make their jobs easier, and it’s another tool that can help them do their jobs better. The way I view it is, you would take a vehicle like this and it would allow you to more rapidly scan bridges, and then when you detect a problem, send out a diver to verify the problem through testing. If you’re going to send divers out into strong currents with nasty snakes and stuff, it’s better to have a good sense there’s a problem before you do that.”
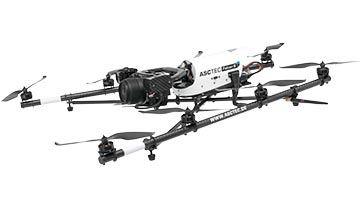
Topcon Positioning Group announces a worldwide distribution partnership with unmanned aerial system (UAS) provider Ascending Technologies. The agreement gives Topcon exclusivity for the global distribution of the AscTecFalcon 8 rotary-wing model, plus the GeoEXPERT and the InspectionPRO sensing and feature packages.
“We are excited to add the brand new Topcon Falcon 8, powered by Ascending Technologies, to our scope of aerial mapping solutions,” said Eduardo Falcon, executive vice president and general manager for the Topcon GeoPositioning Solutions Group. “By distributing both core target models on a worldwide level, Topcon can offer more end-users the flexibility and proven advances that these patented rotary-wing systems provide for survey, inspection and monitoring applications.” The Topcon-branded UAS includes the latest AscTecTrinity autopilot technology.
Based in Germany, Ascending Technologies is a developer and manufacturer of micro UAS for professional, civil and research use. “The AscTecFalcon 8 has been in series production since 2009 and still is the first choice UAS of world market leading inspection and surveying service providers,” said Jan Stumpf, one of the four CEOs and co-founder of Ascending Technologies.
“We are proud that our proven and advanced technology can now be easily accessed throughout the world. With the help of Topcon and its reseller network we can provide our high standards of support and customer service everywhere. This partnership gives us the freedom to continue the development of game changing technologies our customers need, while quickly extending our active fleet of reliable UAVs,” said Stumpf.
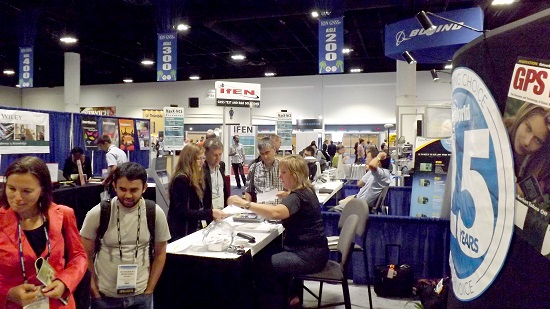
Crowds gather at the GPS World booth at ION GNSS+ 2014.
ION GNSS+ 2015 is the 28th International Technical Meeting of the Institute of Navigation’s Satellite Division and the world’s largest technical meeting and showcase of GNSS technology, products and services and other sensors in today’s marketplace. The conference will be held Sept. 14-18 (tutorials Sept. 14-15) at the Tampa Convention Center in Tampa, Fla.
James L. Green, director of Planetary Science for NASA, will take the audience on a journey navigating through the solar system during his keynote address. He will show new worlds and new discoveries through the eyes of NASA’s planetary spacecraft.
This year’s conference will feature panels of industry experts, policy updates, the world’s largest GNSS commercial exhibit and more than 300 technical presentations presented through both Peer-Reviewed Tracks (Multisensor Navigation and Applications; Algorithms and Methods; and Advanced GNSS Technologies) and Systems and Application Tracks (Mass-Market Applications; High Performance & Safety-Critical Applications; and System Updates, Plans and Policies).
GPS World staff will be moderating the Lightning Talks section of the plenary session, as well as hosting a booth in the Exhibit Hall.
Tap into our up-to-the-minute show coverage here at gpsworld.com and via Twitter (@GPSWorld).
Alan Cameron, GPS World Editor and Publisher, provides the following video introduction to the conference.
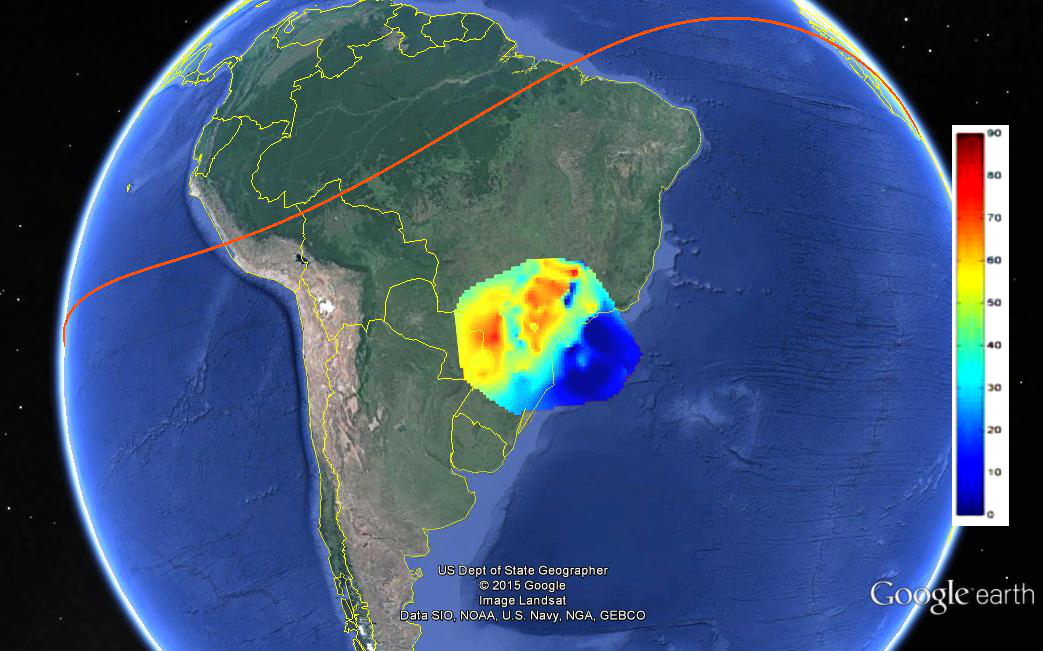
FIGURE 2. TEC map over São Paulo state as forecast by the CALIBRA model on Sept. 26, 2012, at 2:00 UT. The range of the TEC in the image is from 0 to 90 TEC units (blue to red). The red line is the geomagnetic equator.
Countering Ionospheric Disturbances Affecting GNSS in Brazil
By Marcio Aquino
After 27 months of intense research, the CALIBRA project ended successfully in February 2015, with the project team devising solutions to tackle the effects of perturbations typical of the Brazilian ionosphere on high-accuracy GNSS positioning. CALIBRA was funded by the European Union and the European GNSS Agency.
Kicked off in 2012, CALIBRA first confirmed the vulnerability of GNSS high-accuracy techniques to ionospheric disturbances through a thorough user performance review, where degradation in GNSS Precise Point Positioning (PPP) and real-time kinematic (RTK) positioning was seen to correlate with the occurrence of ionospheric scintillation and high Total Electron Content (TEC) variability. This is especially so in Brazil, because of its geographical location extending across the magnetic equator in one of the most troublesome ionospheric regions of the Earth, qualifying the country as a test-bed for worst-case scenarios.
The team established a suitable metric to characterize these disturbances, which was used in developing the new models and algorithms to counter their effects. The short-term empirical CALIBRA Forecasting Model (CFM) for TEC and scintillation was developed and tested.
To counter scintillation, a number of approaches were proposed and their benefits demonstrated. Building on the project’s success, CALIBRA partner INGV (Istituto Nazionale di Geofisica e Vulcanologia) filed a patent for the CFM and a new spin-off company — SpacEarth Technology — was set up. SpacEarth aims to secure the software’s commercialization for potential applications and services, while also improving and adapting it to evolving market needs.
Another outcome of commercial interest is that project partner Septentrio developed several rover-level mitigation approaches, notably a new model for ionospheric delay estimation.
Monitoring Network. To support the research and operational activities of the project, a dedicated network of ionospheric scintillation monitor receivers (ISMRs) was deployed, forming the CIGALA-CALIBRA network of 12 monitoring stations equipped with PolaRxS receivers. A web interface for data analysis — the ISMR Query Tool — was developed by project partner UNESP (São Paulo State University) and is available for public use, collecting and treating more than 10 million observations of GPS, GLONASS, Galileo, BeiDou and other augmentation systems on a daily basis. Data visualization and data mining techniques support users in data analysis and knowledge extraction.
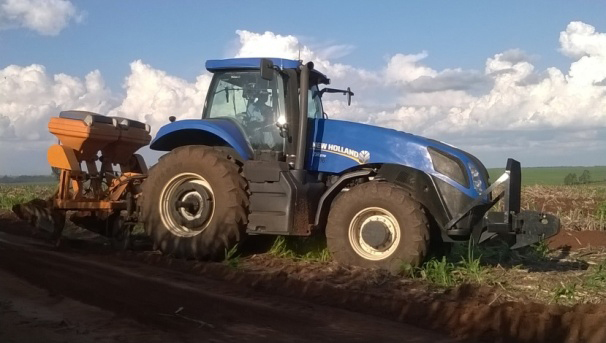
Finally, two important field trials aiming to validate the new algorithms were carried out in Brazil, involving actual precision agriculture and offshore operations. For the precision agriculture trial, the Brazilian company Agro Pastoril Campanelli provided expert operational environment and support.
The tractor used in the precision agriculture trial at Agro Pastoril Campanelli’s premises.
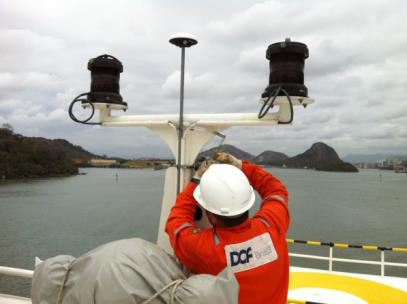
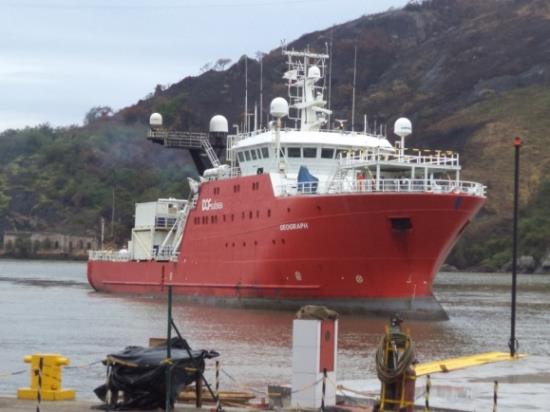
For the offshore trial, the project counted on the collaboration of the DOF Brasil Group representing Norskan Offshore, a provider of high-end offshore services to the Brazilian oil and gas industry. Detailed results of both trials are in the project’s final report, which can be accessed through the GSA.
The Geograph vessel is operated by DOF Brasil.Setting up the receiver antenna for the offshore trial on board the Geograph vessel.
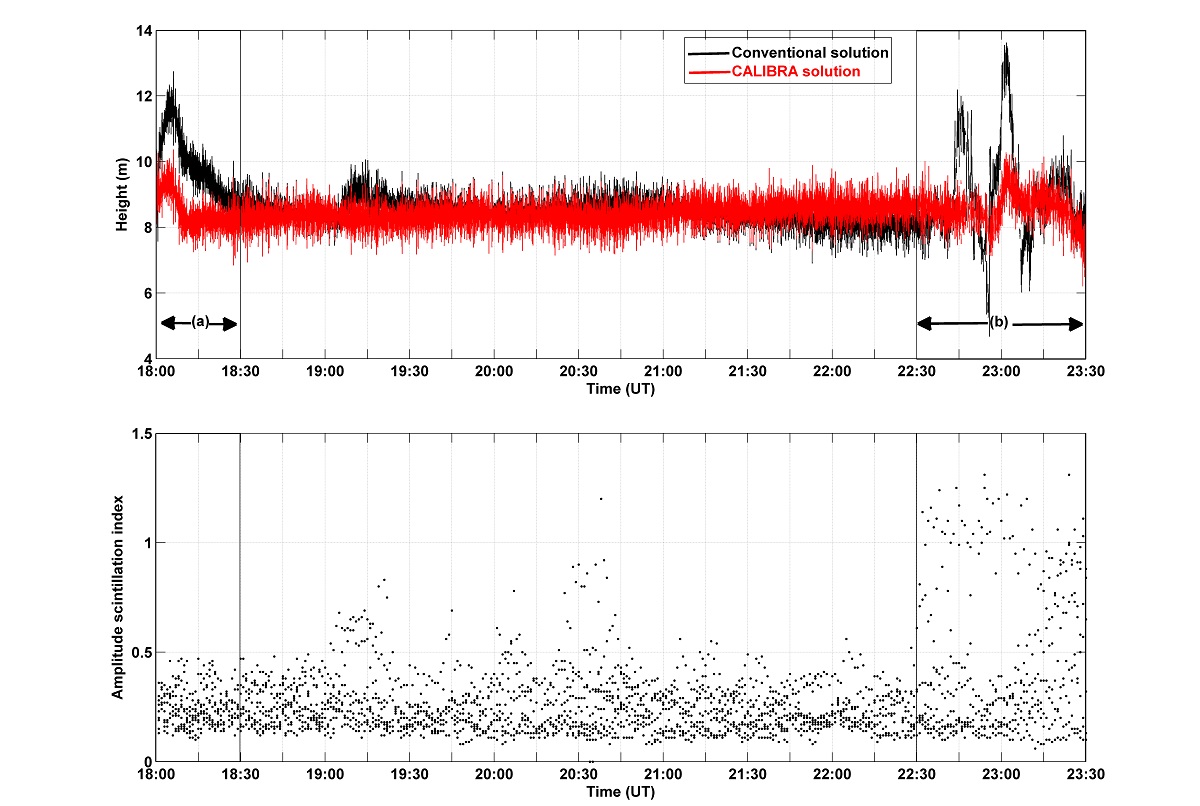
To provide a glimpse of the performance of the CALIBRA algorithms during the offshore trial, in FIGURE 1 we selected a period when strong scintillation conditions were encountered. In the top plot, two height component time series for kinematic PPP processing are shown, respectively, for the case where no mitigation is applied (black time series) and the case where the CALIBRA algorithm is applied (red time series).
FIGURE 1. Performance of CALIBRA algorithms in the offshore trial.
The bottom plot shows the level of amplitude scintillation (S4 index) affecting the GPS satellites over a 10-degree elevation angle.
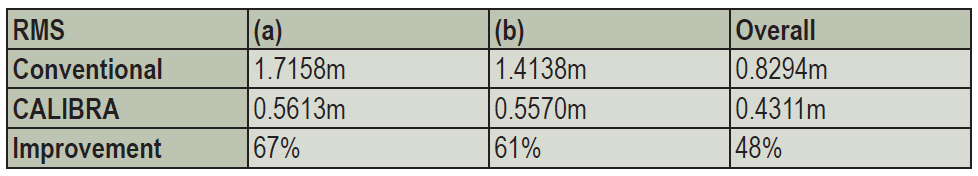
The improvement obtained with the CALIBRA solution can be seen in particular during the PPP convergence period (18:00 to 18:30 UT) and during the period of strong scintillation (22:30 to 23:30 UT). As there was no accurate ground truth available, the RMS values with respect to the mean height, taken from the quiet period (between 19:00 and 22:00 UTC), along with the percentage of improvement when applying the CALIBRA mitigation approach are summarized in TABLE 1.
TABLE 1. RMS values with respect to mean height, 19:00–22:00 UTC.
Despite all the successful work carried out by CALIBRA, the team notes that research must be continued to accomplish further improvement in models and algorithms to finally develop processes for real-time operation. The challenge would be to counter these ionospheric threats in the scope of an operational service aimed to provide robust high-accuracy positioning to support user applications.
Furthermore, there were strong indications that the addition of Galileo will assist in mitigating the problems addressed in the project when more signals are available in space.
Marcio Aquino is a Principal Research Fellow at the Nottingham Geospatial Institute of Nottingham University and leader of CALIBRA.
The first and best step to combat the growing worldwide problem of GPS jamming is to pursue technologies that can detect and locate the jammers. Signal Sentry 1000 uses arrayed sensors to do just that: look out for jamming and track down its source once sensed.
An array of sensors can be deployed for sensitive and high value entities such as infrastructure installations, including airports, railroads, chemical plants, electric power plants and grids, cargo ports, wireless communication systems and financial transfer centers. The sensors will connect to servers that assimilate the sensor data and provide operator interfaces.
Signal Sentry 1000 is based on a server/client model. The user accesses Signal Sentry using a URL and secure log-in specific to the user’s system. The user’s particular home screen displays a map with each installed sensor displayed with an icon reflecting status. Interferers are displayed as red stars or as error ellipses.
The Signal Sentry web page lists all the interferers stored in the database with their start and end times. The user can manipulate the list by changing the minimum duration of the event to be displayed as well as if the interferer had been geolocated or not, or both. If an interference event was less than a minute long, it may not have a geolocation entry.
Geolocation Methodology. Geolocation of jammers is accomplished through proprietary algorithms running at the network server that utilize digitized, timestamped I and Q samples of received interference waveforms, GPS observables, and other parameters captured by each sensor. This data is processed in a Kalman-filter based location algorithm to determine an initial jammer position and track the position of the jammer throughout the jamming event. This improves performance with moving jammers (that is, vehicle-based) and enables continued jammer location with a limited sensor set (potentially due to signal blockage, erroneous data due to multipath, or out-of-range conditions). Upon detection of an interference event by any sensor, the server polls the entire sensor network for data and determines if the information is sufficient to perform geolocation.
The user receives near-real-time status of event detections and geo-location of the interferer (if possible). Sensor data polling, geolocation processing and GUI updates continue until the interference stops or the emitter goes out of sensor range. Sensor data from each event is stored for later replay and processing using Signal Sentry event analysis tools.
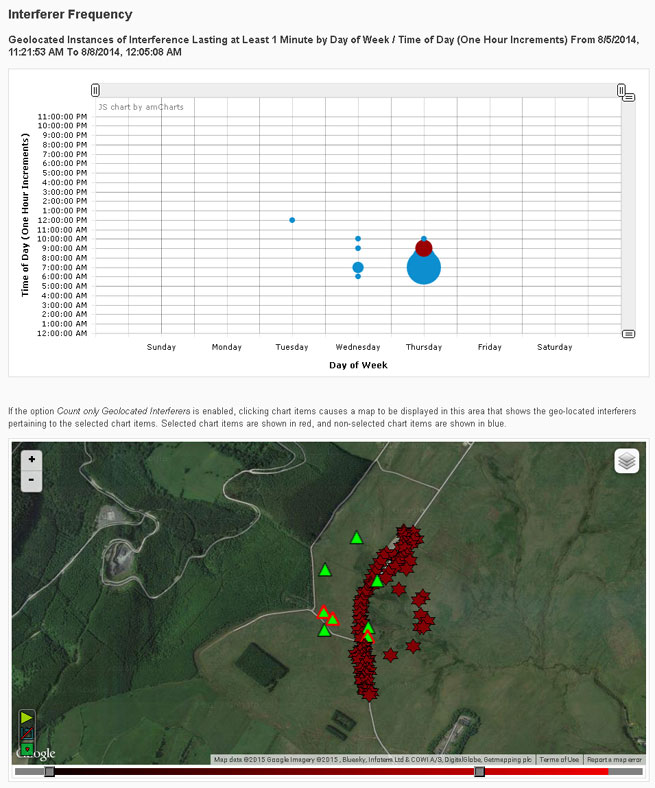
An interference event frequency chart (Figure 1) provides a tool for forensically evaluating the occurrence of interferers. It displays interference events as circles; the size of the circle represents the number of events that occurred at that day of the week and time. When dots are selected on the chart, a map below the chart shows the location of the interference events. More than one dot can be selected at a time. This allows a user to find correlations in time and space, to determine if events occur at specific locations at certain times of the day and/or days of the week.
FIGURE 1. Interference event frequency chart.
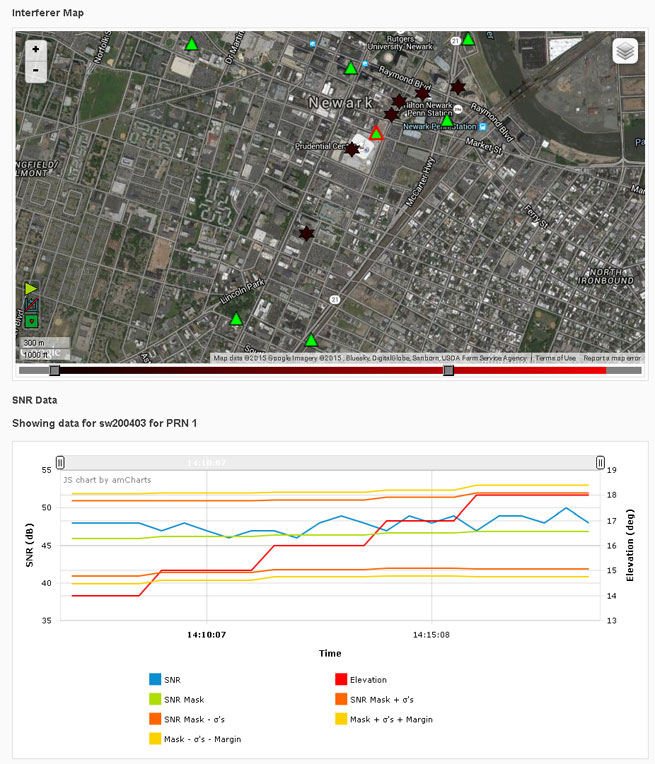
Selecting the interferer on the map and then the details button on the popup brings up the interferer details page (Figure 2). Users can sign up for interferer alerts to be sent to their email or phone by text.
FIGURE 2. Interferer details.
Testing
Signal Sentry 1000 was deployed and tested in GPS jamming trials at Sennybridge, United Kingdom, in August 2014. Testing included stationary jammers and mobile jammers moving at up to 50 mph, in open fields and built-up areas.
Sentry Arrayed. The sensors used in these trials were custom units designed and built to Harris specifications by Chronos Technology Ltd. Each consisted of an embedded GPS receiver, an interference signal receiver and a local processor with a network communications interface.
An array of eight sensors was geographically distributed around the test facility. Each sensor and a centralized Signal Sentry processing server were equipped with a mesh data networking capable radio for wireless data communications of commands, status and event data. In other Signal Sentry deployments, the server software is typically hosted on a cloud server, and sensors communicate with the server either via hard-wired internet connections or wirelessly through cellphone network-compatible data adapters.
Jammer Profile. Two jammers performed during the trials, a 150mW and a .5W jammer, used to disrupt the GPS L1 C/A code at 1575.42 MHz.
Open Field. Atest in an area with no obstructions included static jammers and dynamic jammers. Five waypoints along the road, in an area measuring 320 by 444 meters, were surveyed prior to the test using a handheld GPS receiver, to evaluate location accuracy.
Table 1 shows static test results. The accuracy error is the average delta between the Signal Sentry-reported jammer positions versus the actual surveyed jammer positions. The number of points column contains the number of measurements reported by Signal Sentry during the test scenario for each waypoint. The overall average accuracy error for the static jammer test was 17.25 meters.
TABLE 1. Open field static accuracy.
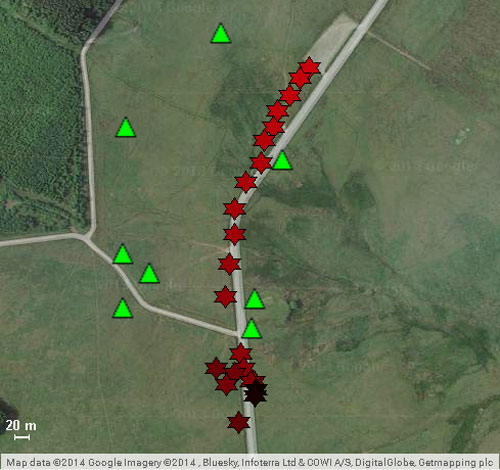
Open Field, Mobile Jammer. In these tests, the jammer was driven in a car on the road through the sensor field. The car was driven at 25 mph north to south, then 50 mph south to north (Figure 3). Cars in the north parking lot caused multipath errors when the jammer came in contact with that area.The overall average accuracy error for the dynamic tracking was 10 meters.
FIGURE 3. Jammer locations detected by Signal Sentry, when jammer was driven at 50 miles per hour, north to south. Green triangles denote sensor locations.
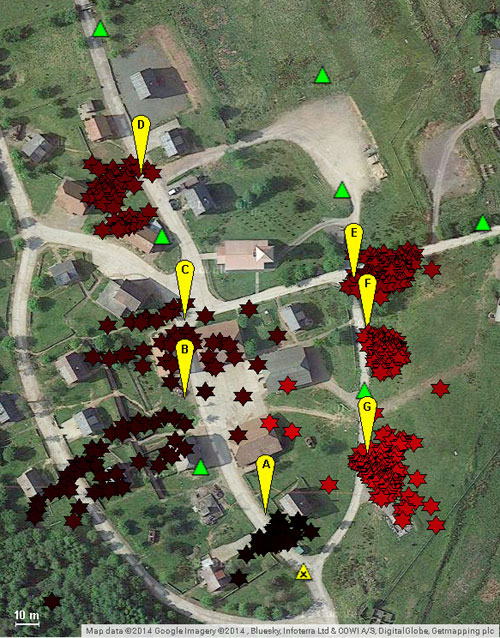
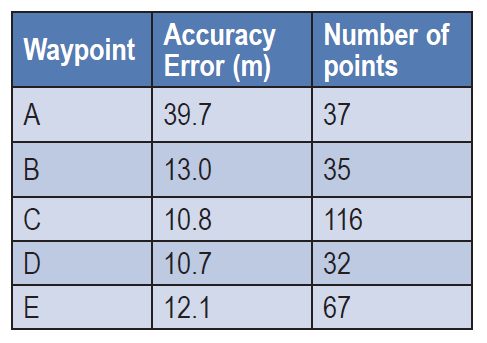
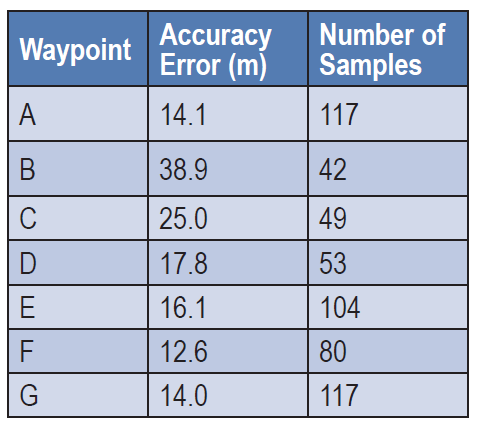
Obstructed Area Test. This test evaluated performance in an urban environment called a FIBUA (Fighting in Built-up Areas), using stationary and dynamic jammers. Seven waypoints in an area 176m x 253m were surveyed for the purpose of evaluating location accuracy. Table 2 shows the results with the 150mW jammer held stationary at the waypoints. Figure 4 provides a graphical view of the jammer position in relation to the waypoints. The overall average accuracy error is 21.40 meters.
TABLE 2. Urban static accuracy.
Obstructed Area, Mobile Jammer. In these tests, the jammer was driven in a car at approximately 20 mph on the road through the sensor field, using a .5W jammer. The overall average accuracy error for this dynamic tracking was 50 meters.
FIGURE 4. Urban area test; jammer locations in yellow, locations delivered by Signal Sentry in red, sensor locations in green.
All figures provided by Jeffrey Coffed and Joseph Rolli.
A Kentucky man shot down a drone when it crossed into “his airspace” over his backyard, and was subsequently arrested and charged with criminal mischief and wanton endangerment.
William Merideth told Ars Technia that he never would have shot the drone with Number 8 birdshot if it had only been flying past. But since it hovered, he felt it was an invasion of privacy. He claims the drone was flying 10 feet above his property and had been spying on his neighbor’s sunbathing daughter.
“It was just right there,” he told Ars. “It was hovering, I would never have shot it if it was flying. When he came down with a video camera right over my back deck, that’s not going to work. I know they’re neat little vehicles, but one of those uses shouldn’t be flying into people’s yards and videotaping.”
Merideth’s claims are disputed by the drone’s owner, who has evidence that rebuts Merideth. David Boggs, who was flying the drone, showed WDRB-TV a video of the flight path of the altitude of the drone, showing that the drone did not drop as low as 10 feet. Boggs, one of four owners of $1,800 drone, confronted Merideth and called police. Boggs told WDRB that he bought the drone just a few days before it was shot down and planned on using it to shoot video of his children riding motocross.
“I would just like [the drone owner] to get some education on his toy and learn to respect the rights of the people,” Merideth said. “It’s fine and dandy, and I think it’s cool there’s a camera on it, but just take it to a park or something — he’s not a responsible drone owner.”
In another incident involving drones and guns, an 18-year-old mechanical engineering student attached a semi-automatic gun to a quadcopter drone, and posted the result on YouTube in early July.
The video has been viewed more than 3 million times and was covered by the national media. The Federal Aviation Administration is investigating.
Peter Sachs, an attorney and drone advocate, welcomes the FAA investigation into the armed drone. “Drones should be used for good, not for evil,” Sachs said. “There are countless ways that drones can be useful. Using one as a remote-controlled weapon is not one of them, and I question the judgment of anyone who would attempt to do so.”
CSR is becoming Qualcomm Technologies International.
Qualcomm started the acquisition process for CSR in October 2014. With the expected close of the acquisition in two weeks on Aug. 13, the name of the company — Cambridge Silicon Radio Limited, or CSR — will be changed to Qualcomm Technologies International Ltd. (QTIL).
Here is the renamed company’s contact information:
Qualcomm Technologies International, Ltd.
Churchill House, Cambridge Business Park, Cowley Road
Cambridge, CB4 0WZ, UK
Emails will retain an @csr.com address until a QTIL address is created.
CSR is known to the GPS/GNSS industry as the maker of the SiRFstar series of chips, which are used in many consumer devices. Qualcomm is a leading maker of chips used in smartphones.
CSR issued a letter to its customers explaining the change, sent by Chris Dale, senior manager, CSR Global Procurement. Dale asked that customers make the appropriate change in their purchase order systems before Aug. 13. “As part of an ongoing program of review and improvement to trading arrangements and business processes, we will be updating our standard terms of purchase. You will be able to review the revised terms at qualcomm.com/procurement.”
The revised terms of purchase will apply to purchase orders issued by QTIL on and after Aug. 13.” Finally, please note that for the near term there will be no changes to the Accounts Payable or purchasing process or contacts,” Dale wrote.
Amazon has announced a plan for its package-delivery drones, according to NBC News.
The proposal includes tiered flight zones that would limit small unmanned aircraft systems (sUAS) to slow speeds in airspace below 200 feet and allow them to fly faster for long-distance travel between 200 and 400 feet.
Commercial aircraft are governed by the Federal Aviation Administration’s (FAA’s) Air Traffic Control, and in Amazon’s vision, there would be a similar central command and control network that takes in data about the position of each drone and shares it with every other vehicle connected to the network. The command and control network would also have vehicle-to-vehicle communication, similar to networks proposed for autonomous automobiles.
Amazon’s plan would be to use the space below 500 feet — minus a 100-foot buffer — for small drones such as its Prime Air vehicles.
Access to the various layers of the airspace would be governed by how well a drone can communicate with its pilot, the command and control network and other drone, according to The Verge website. “Everyone can have access to the airspace,” said Gur Kimchi, who heads up Amazon’s Prime Air program. “It doesn’t matter if you’re a hobbyist or a corporation. If you’ve got the right equipment, you can fly.”
Someone operating a radio-controlled quadcopter with no Internet connection would be relegated to the area below 200 feet.
In a striking contrast, the positive and negative sides of unmanned aerial vehicles were highlighted in a single day, July 17. First, in a government-approved demonstration, drones were used to deliver prescription medicine to patients at a temporary health clinic in rural Virginia, reports the Wall Street Journal. The event, reported previously by GPS World, aimed to show how UAVs can alleviate the problem of health-care access while creating economic opportunity for communities.
A manned aircraft carried the packages most of the way, and the flight plan originally called for the drone to make six round trips to carry a total of 10 pounds. But after two successful deliveries, officials decided to send the rest of the payload in one flight.
In stark contrast to that beneficial use of drones, efforts by firefighters to battle a fierce wildfire in California on July 17 were hampered by hobbyists flying consumer drones to capture video of the flames. Planes attempting to deliver water drops found their flights delayed or blocked by the presence of the drones, with private drones flying over the wildfire grounding firefighting aircraft for almost half an hour.
State lawmakers in California are drafting a bill that would impose heavy fines and potential jail time on anyone whose personal drone interferes with firefighting efforts.
Avineon, Inc., a global provider of information technology, geospatial, and engineering support services, will distribute discount coupons for its new Metrics Extension to ArcGIS for Server at the 2015 Esri User Conference. Ten customers who activate the permanent Metrics Extension license with the coupon code will receive it for free. All others using the coupon will receive a 50 percent discount off the $4,995 price if the permanent license is activated by Aug. 31, 2015.
Avineon will be handing out the discount coupons in booth #1015 at the Esri User Conference being held July 20-23 at the San Diego Convention Center in California.In addition, Avineon will be holding a drawing each day for a Windows Tablet. Anyone who registers at Booth #1015 will be entered into the drawing, no purchase required.
The Metrics Extension enhances the value and usability of GIS data in ArcGIS by creating a spatial data warehouse in which key business intelligence metrics can be created and stored for historical reporting. It computes and stores key metrics such as asset quantity, length, or area coverage for a specified period. Storing this data permits important historical trends to be documented and evaluated for potential performance improvements and cost savings.
“Metrics Extension gives ArcGIS users better visibility into their enterprise geodatabase by revealing trends in their global and regional data sets,” said Joel Campbell, Avineon vice president of commercial systems. “The return on investment for Metrics Extension will be fast.”
Avineon developed the Metrics Extension for ArcGIS users across all markets, especially in applications where the installation, operation, and decommissioning of assets need to be tracked over time. Asset changes and trends can be tracked by timeframe and by geographic area, such as neighborhood, zip code, and political district. The most common applications will be in energy and water/waste water utilities, telecommunications, and local/state/federal governments.
Avineon will also showcase its entire portfolio of geospatial services and solutions available to the Esri community. As a long time Esri business partner, Avineon specializes in data centric services and solutions serving a variety of industries.