In recent years, the architecture, engineering and construction (AEC) industry has benefited greatly from growing GNSS accuracy, smaller laser scanners, UAVs, and more efficient management, collaboration and visualization software. We asked five companies operating in this space to address three questions:
What are the key challenges of surveying for the AEC industry today, compared with traditional boundary surveying and other types of surveying?
Which of your products are particularly relevant for this kind of surveying?
What was a recent AEC surveying success story?
In the following articles, five companies briefly describe their experience with the AEC industry:
Increasing urbanization is creating pressure to manage housing, utilities and infrastructure holistically. Hence the concept of digital twins. Digital twins enable the integrated operation and maintenance of any geospatial asset to meet the increased demand for efficient and intelligent transportation systems, the green expansion of urban areas and sustainable infrastructure.
Traditional GNSS or optical measurement instruments no longer suffice to capture all the necessary information in a timely manner and with the right levels of detail. Integrating technological advances — GNSS, inertial systems, lidar sensors and 360° spherical imagery — into a single mobile-mapping system has greatly increased the ability to produce complete 3D models with high accuracy and precision. Mobile mapping also directly reduces workload, lowers project costs, simplifies data use, and provides reality-based design.
Mobile mapping surveys have been proven to be four to 10 times faster and three to seven times less expensive than traditional methods, delivering the required results up to three times faster. Integrated, multi-platform mobile-mapping solutions bridge the gap between the real world and the digital world for greater interoperability and accessibility of data in near real-time.
The high-accuracy and cross-platform design of CHC Navigation’s AlphaUni 900 lidar system provides an innovative solution for 3D spatio-temporal data acquisition, which is necessary for the digital transformation of the AEC industry.
Smart Cities
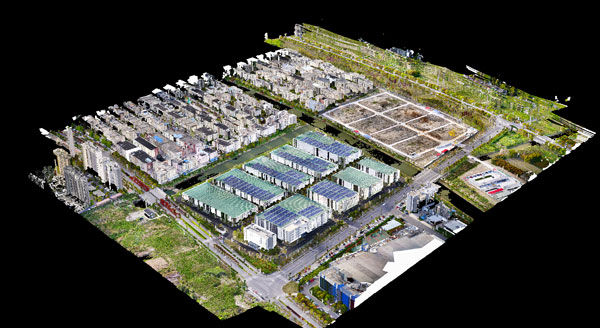
After developing for more than a decade, digital-twin technology is now a complex and comprehensive technical system to support the construction of new smart cities. It is an advanced model for the continuous innovation of urban development and a future form of modernization combining the virtual and real worlds. The creation of digital-twin cities brings to the forefront high-level topographic tools capable of providing comprehensive, multi-dimensional, large-scale, high-resolution data sets.
To illustrate typical digital-city projects, CHC Navigation conducted a proof-of-concept demonstration in the Jinshan District of Shanghai, which covers an area of about 600 square kilometers. This area has rich terrain features and characteristics typical of large modern cities, such as tall buildings, power lines, rivers and vegetation.
Versatile and easy-to-use platforms are essential for the democratization of lidar systems. Capturing 3D data with a single-platform lidar system can leave some areas blank in the point-cloud data. The AlphaUni900 lidar solution, with its multi-platform capability, can easily capture complete data from a UAV, car, backpack or unmanned surface vessel (USV) and provide a sophisticated and comprehensive 3D model. The AlphaUni 900 integrates seamlessly with real buildings, provides exterior and interior mapping, and dramatically changes the way high-precision data is collected.
The derived 3D models can be easily merged and correlated with social or economic spatial data, for example from building-integrated internet of things (IoT) and cloud computing data. As a result, complex operations can be optimized in real time, potential problems can be anticipated, and planned maintenance can be implemented to ensure the sustainability of urbanization projects over their entire lifespan, all in a fully connected model.
Affordable, user-friendly solutions for capturing and processing airborne lidar data and imagery have triggered a strong adoption of UAV technology in the AEC industry. For CHC Navigation, 2021 was marked by the huge success of the AlphaAir 450, a breakthrough in 3D UAV mapping technology. With its ease of use, high accuracy and affordability, the AA450 expands the scope of lidar surveying to non-professional users in geospatial reality-capture applications and to those who have never been able to afford such technology before.
A U.S. Secretary of Defense once predicted that navigation would eventually be based on inertial devices that were set at the factory, and then always knew where they were forever after. Recently published research has reported on steps in that direction. However, according to navigation expert Brad Parkinson, the outlook is not as bright as some might think.
RNT Foundation President Dana A. Goward recently discussed the issue with him.
Goward: Dr. Parkinson, you are well known for your contributions as the chief architect of the Global Positioning System. But you have more than a passing familiarity with inertial systems also, is that right?
Parkinson: I do. Long before I was involved in radio navigation, I was the chief analyst for all the U.S. Air Force testing of inertial navigation systems. I earned my masters degree in Doc Draper’s Inertial Lab at MIT in 1961. I am a major advocate and defender of inertial systems. I also have in-depth understanding of their limitations.
Goward: Have you been following the recent media coverage about advances with inertial systems?
Parkinson: I enjoy reading about these advances in physics devices. At the same time, I am a little impatient with media articles that do not appreciate the differences between building a device that measures specific force (or senses rotation) and a working inertial navigation system.
Goward: What are some of the inherent limitations of these systems?
Parkinson: I find it interesting that some of the articles speculate they may be able to supplant GPS and other GNSS. There is no way an inertial navigation system, even with perfect gyros and force sensors, can provide its accurate position (say, better than 10 meters) after extended periods (hours to days). In fact, attaining better than 200 meters accuracy after a few hours will be very difficult in a moving vehicle.
Today, farmers require even greater accuracy from GPS. They routinely use GPS for row operations, with accuracies of a few centimeters. The economic value is indirectly measured by the farmer’s purchase of such equipment — the agriculture market for GPS equipment is well over a billion dollars a year. Thus, a general replacement for GPS must provide centimeter accuracies.
Goward: So, what is it about inertial systems that stands in the way of them becoming autonomous substitutes for GPS?
Parkinson: There are some very simple and fundamental reasons that inertial positioning systems cannot hope to deliver such capability.
First, force sensors are not accelerometers, because they cannot sense gravity. To find acceleration, one needs to add vector gravity to their outputs. But gravity, or g force, varies a lot at the micro-g levels, and the inaccuracies are fed to the double integration that produces position. Errors grow as time or time squared and, without outside reset, are essentially unbounded. The physics devices described in some of these articles are definitely instruments that Doc Draper described as “specific force sensors.”
What we loosely call g force, or just g, is actually the inverse of the reaction to maintain stationarity on Earth. G is defined to include the centrifugal force due to Earth’s rotation, which varies greatly as a function of latitude — the radius of the merry-go-round called Earth. Mountains and chasms affect the local g. Further, it is a vector quantity: its direction can change locally by many arc seconds. In other words, down does not generally point to Earth’s center. Gravity gradiometers might be of limited help, but they are very large and not made for dynamic environments.
In a nutshell, estimating acceleration requires calculating and adding gravity to the three-dimensional specific force sensor.
Second, to use these devices for extended navigation, coordinate frames would have to be defined and stable to milli-arc seconds. All instruments would have to have input axes and cross-axis sensitivity calibrated to corresponding levels. Generally, this problem is ignored in many lab projects.
Third, for inertial navigation sensors to work, they need to accurately know their initial position. Any initial velocity or position errors will grow as a function of time.
Fourth, the vertical position axis is inherently unstable and diverges exponentially.
Physicists have been enamored with instruments that can use atoms to sense specific force and rotation. While scientifically interesting, even if perfect they cannot overcome these challenges.
Goward: But there is still a role for inertial systems in navigation, isn’t there? How good are they, and what are some of the applications?
Parkinson: I suspect the best inertial systems of today (which are in nuclear submarines) can maintain an accuracy of about 0.1 nautical miles or about 200 meters for a few days. I am sure the real number is classified. These systems are very large, expensive and complicated. They rely on a very low acceleration environment and are periodically reset with GPS. Furthermore, they probably use gravity gradiometry to calculate the local variations in gravity to the first order. They do not calculate the vertical position, and use water density and knowledge of the local geoid to keep the vertical axis stable.
An aircraft with inertial can, to some extent, keep the vertical dimension errors bounded, provided it has knowledge from elsewhere of local sea-level barometer settings and by assuming adiabatic pressure variations.
I strongly support the inertial/GPS/directional antenna marriage for users who want assured PNT. Aviation is a good use case for this. Inexpensive inertial components (called micro-electromechanical systems, or MEMS) can improve the jamming resistance of the GPS receiver by 15 dB or more. This step alone can reduce the effective line-of-sight jammer denial area by more than 95%.
Goward: So, inertials can be a good part of the solution but are not necessarily the whole solution themselves.
Parkinson: Exactly. Despite what some media outlets might publish to lure in readers.
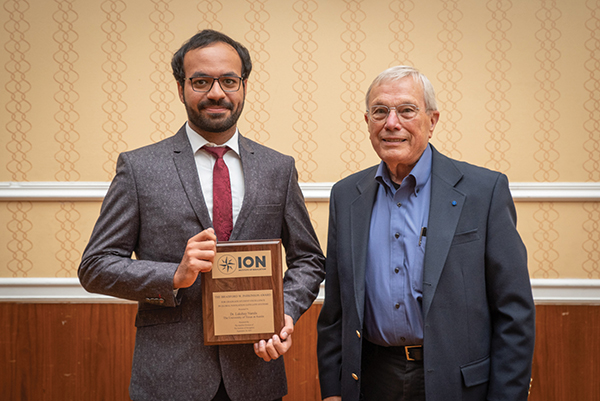
At the ION GNSS+ 2021 conference in St. Louis, Missouri, the annual meeting of the Satellite Division of the Institute of Navigation, Brad Parkinson bestowed Lakshay Narula with the division’s Bradford W. Parkinson Award for his Ph.D. thesis “Towards Secure & Robust PNT for Automated Systems” at the University of Texas at Austin. The award honors Parkinson, known as the “father of GPS,” for his leadership in establishing both GPS and the Satellite Division of the ION. Narula is now an applied scientist at Amazon Lab126 in Sunnyvale, California, where he researches robust navigation and state estimation methods for robots, from self-driving cars to aerospace applications. (Photo: ION)
While some tasks for AEC surveying are similar to other types of surveying — such as original ground surveying, creating site control and live monitoring — the biggest differences and challenges arise in data management, timeframes, communication and deliverables.
In AEC surveying, the project timeline is the primary factor driving everything, creating a different kind of pressure on the surveyor. As data experts and problem solvers, surveyors for AEC must quickly adapt to construction progress, as their survey knowledge can be needed on site at any point.
Information transfer challenges also exist — such as clearly communicating data to non-surveyors who perform measurement tasks — along with creating unique deliverables across construction stages. These include 3D terrain models with real-world coordinates for architects; fit-for-purpose computer-aided design and Industry Foundation Class models for machine operators and mechanical, electrical and plumbing installers or off-site fabricators; and progress reports for project owners.
Several AEC firms have opted to create their own inhouse survey teams. This allows greater control over the consistency and clarity in communication and deliverables, because they focus exclusively on surveying for AEC and are therefore familiar with its specific challenges.
The main challenge for the surveyor in AEC is sifting through and processing the data, assessing quality, understanding relevance, producing results and crafting deliverables to meet the clients’ needs.
An integrated total solution is important for AEC surveyors who must decide not only which technology to use, but how to process data from different technologies together. Our products fit within this integrated solution concept.
Leica Geosystems‘ automated total stations, multistations and GNSS blend innovation and traditional technology, such as the Leica GS18 I with tilt and visual positioning, enabling surveyors to measure more, faster.
For mass data collection, the Leica RTC360 3D laser scanner operates at two million points per second and contains visual inertial system (VIS) technology simplifying the registration process. The Leica BLK series combines intelligence and accessibility, including the BLK360 imaging laser scanner, the handheld BLK2GO, and the latest autonomous technology of the BLK2FLY and BLKARC.
Finally, our software connects surveyors to their sensors and data in the field with Leica Captivate and Leica Cyclone Field 360 and to the office with Leica Infinity and Leica Cyclone, extending to existing CAD software with the Leica CloudWorx suite of CAD plug-ins.
Bringing an Aqua Park to Life
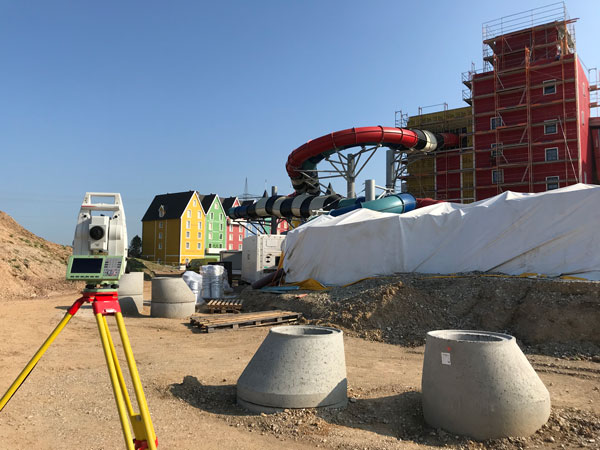
One memorable success story was the use of our products for AEC survey tasks during construction of Germany’s biggest aqua park, Rulantica. The survey work was led by Saladin Keller of Keller planen + bauen. The project involved the creation and construction of a Nordic-themed water world featuring 25 attractions, including water slides, a wave pool and a lazy river.
Alongside all the typical surveying for AEC tasks — establishing site control, staking out pipes, and planning and staking the entire traffic infrastructure — Keller had the challenge of measuring and positioning the complex internal geometry. These tasks required skilled surveyors and a variety of survey tools, such as total stations, GNSS rovers, laser scanners and powerful processing software.
Operating within the AEC environment also meant that communication and flexibility were key to the success of the project. Keller needed to provide the right data to different trades and handle urgent maintenance requests requiring surveying skill, such as rebuilding parts and adjusting utilities.
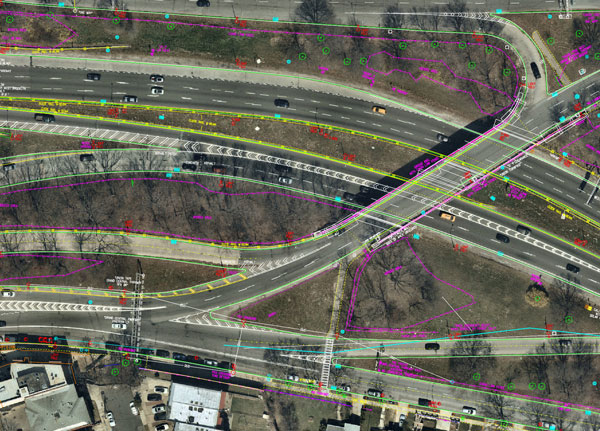
Nearmap aerial imagery is used as a basis for survey linework. Photo: Nearmap
With Congressional approval of $17 billion in infrastructure funding, the largest single allocation ever, the scramble to win contracts is about to get red hot and AEC firms are gearing up. In this very competitive game, top engineering firms are relying on their experience, technology, business acumen and ability to execute.
Advances in aerial mapping play a key role in how AEC firms pursue these contracts. Savvy firms have been using this technology for years. Rather than rely on lower resolution satellite imagery or local drone imagery, they use wide-area-coverage aerial maps to clearly display the detail needed to plan and execute.
Over the past decade, maps made using aerial photogrammetry have played an important role in the AEC space. Using high-performance cameras, fleets of planes capture hundreds of square miles per plane per day, provided that the weather is clear. The imagery is processed and made available to engineering companies within days of capture, allowing them to see very clear imagery.
AEC organizations use different forms of aerial maps to evaluate sites, improve their survey designs, and build and maintain infrastructure (roads, highways, bridges, tunnels, overpasses, rail, airports, housing, commercial building development, water resources, parks, pavement and more). Imagine you’re a state or local government that needs to build a bridge, or a developer who wants to contract with an engineering and construction firm to build affordable housing. Why travel to perform time-consuming site evaluations when you can meet with engineering teams in your office and review hundreds of potential sites instantly using current aerial photos that show change over time?
The engineering teams point out elevation changes, the presence and height of vegetation, neighboring communities, bodies of water, ponding and more. They easily navigate from one location to another as you discuss where the entrance to the community could be, how the road network might be configured, and the proximity to retail, schools and healthcare. Within minutes you measure risk, understand the landscape, make decisions, and begin to estimate the project costs. Your teams collaborate, discuss the pros and cons, measure distances and navigate across the terrain virtually.
Aerial mapping provides a competitive advantage for AEC companies to win their fair share of the infrastructure bill. It also gives governments and developers the confidence they need to make the right decisions. Typically, this involves looking at sites from all angles. The classic form of aerial mapping used by engineers is a top-down perspective. Increasingly, these organizations have used oblique imagery captured at an angled perspective, which shows height.
Artificial Intelligence and Aerial Photography
Starting a few years ago, 3D imagery and digital surface models began to allow engineers to navigate through the imagery and query it based on elevation. More recently, aerial mapping has leveraged artificial intelligence (AI) to classify properties and the landscape. Do you need to see nearby construction sites? AI applied to aerial photography can do that automatically. This rich set of data includes attributes such as tree overhang, roof condition, roof material, building footprints, vegetation height, surface material, swimming pools and even solar panels.
The blend of all these imagery types and AI into a single solution makes everything discoverable. Users can search by address, city, location or point of interest. They can visualize the imagery along with lat/long coordinates and quickly switch from top-down views to obliques to 3D. As they learn more about the landscape, they begin to turn on AI attributes, gaining deeper insights.
Sometimes, the analyses go even further. Engineering organizations export the imagery to tools of their choice from such companies as Autodesk, Esri or Bentley Systems, use field-collected ground control points to ensure that it is survey grade, then use it as a base layer for their designs. They even create marketing presentations and video content to help them win the business. Current high-resolution aerial maps have become a cornerstone of how these organizations operate.
This approach provides unique advantages for engineering firms. For example, they can combine geospatial and construction datasets in a common operating environment to reduce complexity, streamline communication, ensure that all stakeholders are up to date, and check their progress toward meeting contractual obligations.
Planners have current, contextual designs and models to make accurate decisions about planning and development activities. They can view asset locations and conditions to facilitate maintenance and upgrades, leverage aerial maps inside other platforms to improve work orders and reduce field visits, and ensure regulatory compliance.
Whether it’s improving highway safety, constructing ferry terminals, improving transportation systems, developing land or building a network of recreational trails, aerial imagery provides engineering and construction companies with a competitive advantage to win new business, improve client satisfaction and meet growth targets. With $17 billion on the line, sophisticated firms are finding a way to secure their fair share of the pie.
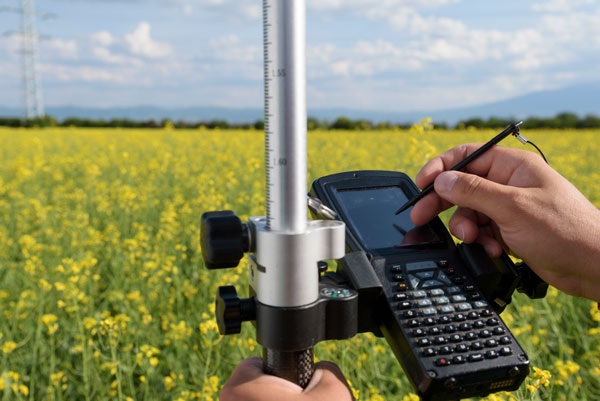
In this issue’s cover, a man with a backpack lidar unit, a GNSS receiver and a tablet computer is surveying in a complex and challenging urban setting. That same lidar unit also can be mounted on a UAV. One of the contributors to this month’s cover story describes the role of aerial photogrammetry in the architecture, engineering and construction (AEC) industry. Satellite navigation, remote sensing, mapping software, a great variety of platforms, and ever more powerful handheld computers — those are the key ingredients in today’s ecosystem of geospatial technologies. The current generation of surveying equipment has more than halved fieldwork in the past two decades while greatly improving the quality of the data collected.
The AEC industry relies on surveyors to be “a bridge between the existing landscape and the design landscape,” said another contributor to our cover story. Unlike traditional boundary surveying, he explained, surveying for AEC requires consideration of a detailed 3D world. It also involves many more stakeholders and much greater liability.
The tight integration of GNSS, inertial systems, lidar sensors and 360° spherical imagery into mobile mapping systems makes 3D modeling possible and traditional GNSS or optical measurement instruments obsolete. However, while inertial systems are invaluable to bridge brief gaps in the availability and reliability of GNSS signals, they are far from the panacea they are sometimes claimed to be, as Brad Parkinson reminds us in an interview with Dana Goward, also in this issue.
Surveying for AEC requires at least centimeter accuracy. The challenges of surveying in urban settings include urban canyons that occult signals and create multipath, traffic and multiple layers of underground, ground-level and above-ground infrastructure.
Beyond the construction phase, 3D survey data is increasingly used to create digital twins of buildings, which facilitate their operation and maintenance throughout their life cycle and help lower their carbon footprint. Once they have completed an initial survey, surveyors often set control to be used for machine control — the theme of our cover story in next month’s issue.
In this issue we also:
• Inaugurate a “letters to the editor” section to make more room for debate in the GNSS/PNT community on the critical issues it faces.
• Report on a Jet Propulsion Laboratory study of the impact on the ionosphere of the enormous volcanic eruption in Tonga and the beginnings of a GNSS-based early warning system for natural hazards.
• Continue our series of articles on GNSS constellations, with an update from Japan’s QZSS constellation.
• Feature three studies: one on real-time simulator testing using an NMEA data stream, one on the first transmission of L1C/B signals by QZSS, and one on self-driving cars in major metropolitan areas.
All these advances, however, are threatened when GPS is threatened. Earlier in the month, three members of our editorial advisory board comment on the recent threat to GPS satellites by the Russian government.
“Seen & Heard” is a monthly feature of GPS World magazine, traveling the world to capture interesting and unusual news stories involving the GNSS/PNT industry.
GO, FISH!
Scientists at Ben-Gurion University in Israel discovered goldfish are good drivers. An aquarium on wheels uses lidar, an onboard camera, and motion-detection software to track a fish in the tank. When it swims toward a side of the tank, the vehicle rolls in the same direction. Fish learned to navigate a small area to hit a target for a reward at least 15 times per half-hour, showing their sense of direction isn’t limited to a watery environment.
North Korea’s recent missile tests are being guided by GLONASS rather than BeiDou, claims a source close to the Chinese military. In January, Pyongyang fired at least four short-range ballistic missiles into the sea off the coast of the Korean peninsula. North Korea also tested hypersonic missiles on Jan. 5 and 11. As reported by the South China Morning Post, the source said North Korea has been using GLONASS and has benefited from Soviet technology.
The National Highways Authority of India (NHAI) will start using GNSS/3D automated machine guidance to construct highways. First up: the new Lucknow-Kanpur Expressway. Three machine-control systems will be integrated, guided by a computerized 3D model of the project. NHAI expects the technology to almost double the speed of highway construction, as well as provide stakeholders with mobile updates.
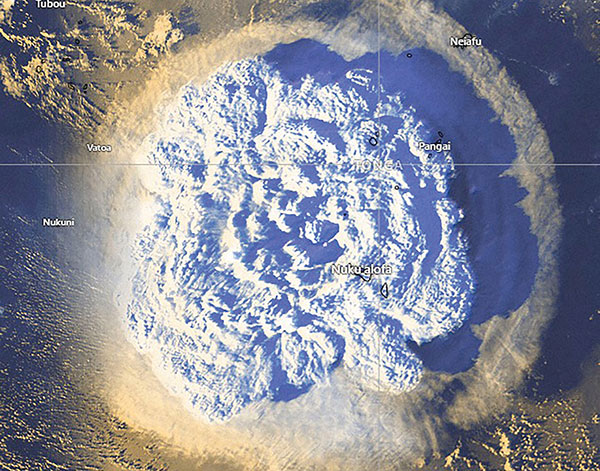
Photo: Tonga Meteorological Services, Government of Tonga
SATELLITES REGISTER OCEAN ERUPTION
While imagery satellites captured the explosive Jan. 15 underwater volcanic eruption in Tonga, GNSS satellites also registered its effects. The energy released reached the ionosphere and was picked up by GNSS signals passing through it (see JPL’s findings). The eruption blanketed Tonga’s main island in ash and devastated its western coastline, affecting up to 80,000 people, according to news reports. It also caused damage to an underwater cable, resulting in a major communication outage. The tsunami that followed reached as far as Japan and the U.S. West Coast, and caused a massive oil spill off of Peru.
On Jan. 15, Hunga-Tonga-Hunga-Ha’apai, an uninhabited volcanic island on the Tongan archipelago in the South Pacific Ocean, erupted with spectacular force, churning ocean waters halfway across the globe.
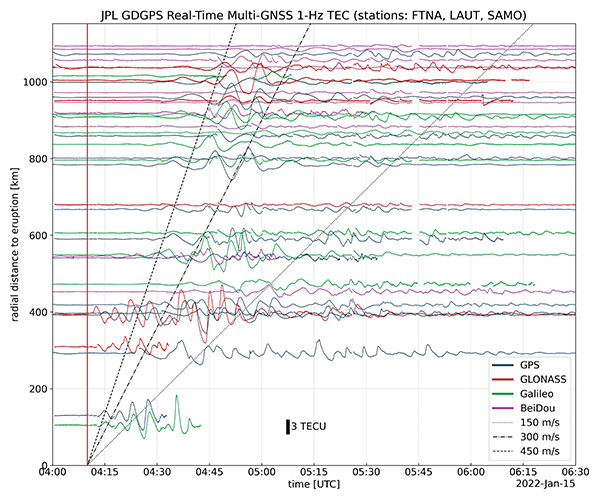
GNSS engineers also detected its effects hundreds of miles above, in the ionosphere. The GNSS community is now moving from such after-the-fact detection to real-time monitoring using NASA’s Global Differential GPS (GDGPS) system, according to a team with the Tracking Systems and Application Section at NASA’s Jet Propulsion Laboratory (JPL) in Southern California.
“We monitored, in real time, four GNSS satellite constellations from numerous stations around the world using the GDGPS network. In particular, the three stations closest to the volcano, in Samoa, Fiji and Tahiti,” said postdoctoral associate Leo Martire. “We could see extremely high and strong signals in the ionosphere, which is very unusual. As a function of radial distance from the eruption, the first detected ionospheric perturbation likely originated directly from the explosion. Then we see patterns propagating at increasing distances at different radial propagation speeds.”
Monitoring such events adds information to the catalog of signals from natural hazards, pointed out Siddharth Krishnamoorthy, a research technologist who manages JPL’s GUARDIAN near-real-time tsunami warning system, currently under development. “That is useful because, in the future, if you want to be able to spot natural hazards and issue alerts, you need to know what the signal looks like. There have been reports of a tsunami in Tonga due to this event, so we will look at potential tsunami-induced signatures in the ionosphere. We are trying to get to a place where we pick up a signal like this and we are able to say, ‘This is a tsunami propagating at this speed and in this direction.’”
Chart: Jet Propulsion Laboratory
Before being detected in the ionosphere, signals from natural hazards must travel all the way from the surface. For tsunamis, this usually takes more than 10 to 20 minutes, but the volcanic eruption only took a couple of minutes to reach the ionosphere because it shot straight up. “We do not know yet, based on observations, how exactly different events on the surface caused by natural hazards couple with the atmosphere,” said research technologist Panagiotis Vergados. “Every event is unique in its spectral properties.”
The event did not affect the quality of GDGPS’s GNSS positions or orbits, because dual-frequency measurements remove significant ionospheric effects. “Instead of looking at the direct effects on the position of our available reference stations, which is what our traditional real-time monitoring does and which was basically negligible, imagine the links from each of those stations to a dozen or more satellites,” said Larry Romans, GDGPS chief technologist. “Every time one of those many links pierces the ionosphere, we can monitor that signal for ripples as waves go by. So, this is an incredibly powerful method for seeing disturbances, just in terms of the density of data. It is very complementary to position-based natural-hazards monitoring because the data is much richer.”
In addition to volcanoes and tsunamis, several other natural events, such as earthquakes and very large thunderstorms, also produce these effects. “These natural forcings cause large-scale, low-frequency pressure perturbations that tend to travel up and be visible in the ionosphere,” Krishnamoorthy said. “There are also perturbations of the ionosphere due to events from outside the Earth, such as solar flares or bolide impacts.”
Many of these perturbations start from the troposphere, which ranges between 10 km and 15 km in altitude — including hurricanes, which overshoot gravity waves all the way to the ionosphere, and thermal tides that have been observed to go all the way up to 600 km, said Vergados. “There are also geomagnetic storms and sub-storms that, during electron precipitation, can change the ionization of the ionosphere. So, the coupling can happen from either below or above or simultaneously, and then the effect can be dramatically enhanced.”
Most of the perturbations that come from below are of a pressure nature — that is, they start out as mechanical waves — while most of those that come from above are electromagnetic. “Aside from nuclear explosions, very large chemical ones, such as the 2020 Beirut explosion, also cause a signature on the ionosphere because they create very large pressure waves,” Krishnamoorthy said.
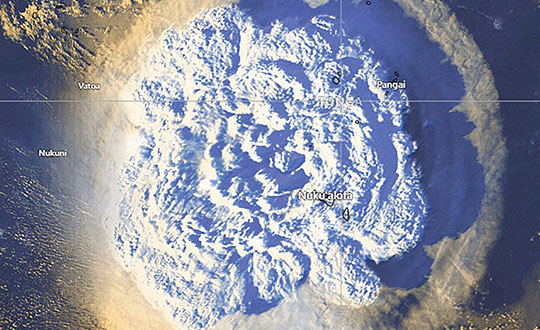
Photo: Tonga Meteorological Services, Government of Tonga
Photo: Stanislav Ostranitsa/iStock/Getty Images Plus/Getty Images
Is Russia’s recent threat to destroy GPS satellites technically realistic? Specifically, how many satellites would it have to destroy to essentially incapacitate GPS-dependent U.S. weapons systems? Would the 1,100-km separation between the orbits of GPS and GLONASS satellites spare the latter from the debris field?
Ellen Hall
“It appears technically possible because they destroyed one of their own retired Soviet satellites on Nov. 15 with anti-satellite technology. Russia threatened to destroy up to 32 satellites, which would incapacitate GPS-dependent weapons and create a virtual mine field of debris with little ability to project trajectories of debris fallout. It is imperative that LEO and ground-based sensor alternatives be developed that will make an enemy attack less likely to be incapacitating.” — Ellen Hall, Spirent Federal Systems
“Some still appear to believe that the number of satellites and their orbital height offer some level of protection. They refuse to look to the ground for resilient solutions using proven and highly reliable technology — which, coincidently, both Russia and China continue to operate as their resilient PNT solutions. The United States and its allies cannot continue to be dictated to by financial analysts who resist these solutions for fear of exposing the poor decisions they supported in the past and continue to support regarding a solution with a higher power and low frequency.” — Mitch Narins, consultant
Bernard Gruber
“Yes, it is technically realistic, but this act of war against a truly worldwide utility would be politically and economically disastrous. GPS IOC was based upon 24 MEO satellites that offered full, but not overlapping, worldwide coverage with spares — there are now 31 satellites that can be utilized through the control segment. The GPS constellation is ~1,100-km deeper than GLONASS. As made evident by the now-destroyed Kosmos 1408 debris cloud simulations, and the actual debris cloud spread by the Chinese 2007 ASAT test that now encompasses most of the LEO regime, the debris field will expand, thus increasing risk to GPS satellite placement and possibly risking physical damage to currently orbited satellites.” — Bernie Gruber, Northrop Grumman
How inertial systems and GNSS availability will help
By Kana Nagai, Matthew Spenko, Ron Henderson and Boris Pervan
Self-driving cars in urban environments can be problematic. The required multi-sensor automated systems will include GNSS, but buildings block and reflect GNSS signals, reducing system availability and accuracy. Researchers from the Illinois Institute of Technology report on how inertial navigation systems coupled with wheel-speed sensors and vehicle dynamic constraints can help.
Innovation Insights with Richard Langley
ARE WE THERE YET? This was a familiar refrain from the backseats of parents’ cars when traveling to a holiday destination or to grandparents when I was growing up. We didn’t have videos on a display attached to the seats in front of us or (who could imagine?) our own personal communication device on which we could call up games, movies or social media channels.
But I’m not talking about that complaint from our childhoods. I’m asking if we have arrived at the era of the self-driving car. The answer is yes and no. It all depends on what you mean by “self-driving.” We reviewed some of the technologies needed for self-driving or autonomous vehicles in this column in June 2019. And we indicated in the introduction to that column that vehicle autonomy has several levels. SAE International, formerly known as the Society of Automotive Engineers, has defined six levels of autonomy that can be briefly described as Level 0 – no automation; Level 1 – hands on/shared control; Level 2 – hands off; Level 3 – eyes off; Level 4 – mind off; and Level 5 – steering wheel optional.
Already, Level 1 automation is widely available in modern cars with adaptive cruise control, parking assistance, lane-keeping assistance and automatic emergency braking among the features being offered.
Level 2 automation, where the automated system takes full control of the vehicle’s acceleration, braking and steering, is available in some production models, although the “hands-off” designation is not to be taken literally — most motor vehicle laws require drivers to keep their hands on the steering wheel.
Between Level 2 and Level 3, we have conditional automation — the car can drive itself, but the driver must stay alert and be prepared to take over immediately.
Level 3 is high automation, where a computer fully drives the car at certain times on certain routes such as a highway; while the driver can perform other tasks such as reading a book, they must be prepared to take over operation of the vehicle within a few seconds if alerted by the automated system. While test campaigns are still ongoing, some jurisdictions permit Level 3 operation by ordinary drivers on some roads, and customers will soon be able to buy vehicles with this level of automation. Widespread use of
Level 4 and Level 5 automation is further off (some would say quite a way off) and remains in development. But famously, last year, Toyota operated Level 4 self-driving shuttle vehicles around the Tokyo 2020 Olympic Village.
A lot more work needs to be done before we will have arrived at the era of the fully self-driving car that will be able to travel on any road, anywhere in the world, all year around, in all weather conditions. In particular, self-driving cars in urban environments (as opposed to highway driving) can be problematic.
The required multi-sensor automated systems will include GNSS, but buildings block and reflect GNSS signals, reducing system availability and accuracy. In “Innovation” this month, researchers from the Illinois Institute of Technology report on how inertial navigation systems coupled with wheel-speed sensors and vehicle dynamic constraints can help.
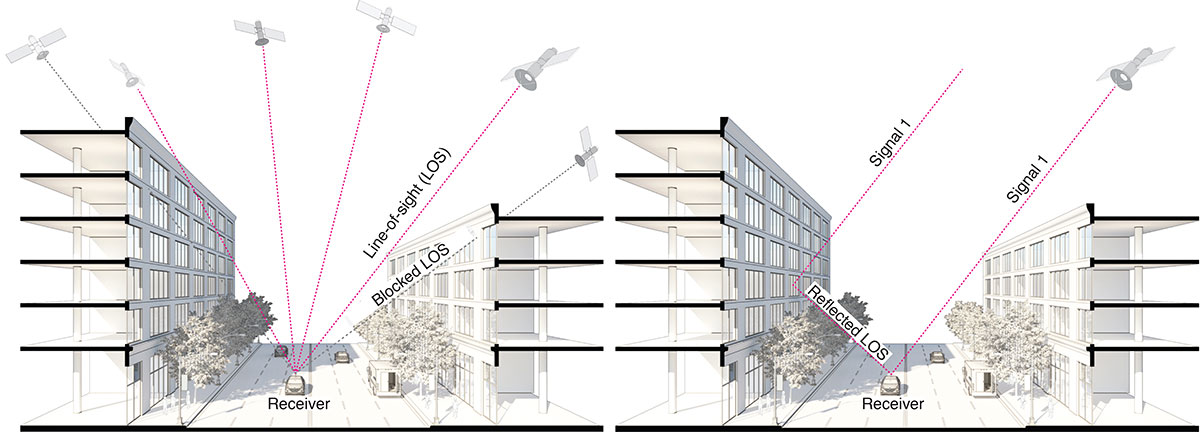
GNSS provides navigation services globally, but satellite visibility in urban areas is limited by high-rise buildings. This creates a mixture of GNSS available and denied environments (see FIGURE 1) — users do not generally know where the system can maintain sufficient levels of accuracy and integrity for a particular application. To begin to address the issue for self-driving cars, we evaluated GNSS-only availability in downtown Chicago.
FIGURE 1. The figure depicts three types of potential GNSS signal reception: direct LOS signals and blocked LOS signals (left) and reflected LOS signals (right). (Image: Authors)
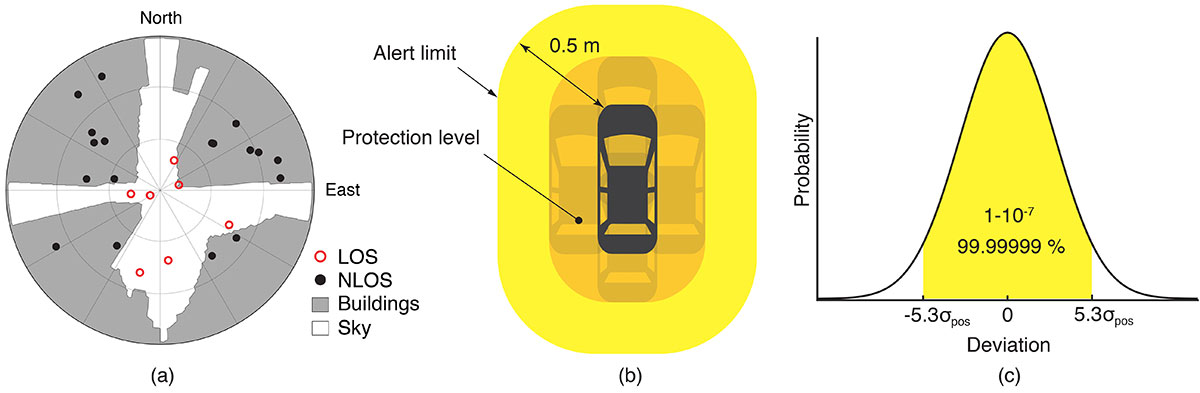
GNSS signal prediction in urban environments has been conducted in previous work. For example, the concept of “shadow matching” was developed to identify GNSS signal blockages in urban canyons. Overlaying sky plots on a hemispherical sky view can be used to distinguish between line-of-sight (LOS) and non-line-of-sight (NLOS) signals (see FIGURE 2a). Reflected rays can be predicted using Householder transformations to reveal potential multipath conditions. Satellites producing blocked or reflected (NLOS) signals should be excluded to maintain integrity.
FIGURE 2. (a) A hemispherical sky view in an urban environment. (b) Illustration of a protection level and an alert limit. To ensure integrity, the protection level must not exceed an alert limit. (c) The allowable probability of exceedance is assumed to be 10−7 in this work. (Image: Authors)
When the number of visible satellites is greater than three, GNSS can resolve vehicle position. However, even in cases where enough satellites are visible, the satellite geometries are generally weak because the dilution of precision (DOP) is adversely affected by the buildings partially blocking the sky. Horizontal positioning error must be bounded by a protection level computed by the vehicle. Then, for navigation to be deemed available, the protection level must not exceed a required alert limit (see FIGURE 2b). The maximum allowed probability of exceedance (see FIGURE 2c) and the alert limit can together be used to determine the maximum allowable position error standard deviation.
Even if the protection level is far below the alert limit in an open-sky environment, it will frequently exceed the alert limit once the vehicle enters a city. GNSS alone is generally not able to maintain availability, so integration with other sensors is needed. Tightly coupling inertial navigation systems (INS) with GNSS using the extended Kalman filter (EKF) provides better estimation in urban environments. The EKF algorithm also enables integration of wheel-speed sensors and vehicle dynamic constraints. These integrated navigation systems will improve availability, but it is still unclear how long such a system can be expected to maintain fault-free integrity in a congested city.
Focusing on the problem of self-driving cars in urban environments, we evaluate protection levels of navigation with practical integrated sensors: GNSS, INS, a wheel-speed sensor (WSS) and vehicle dynamic constraints (VDC). The goal is to develop the means by which we can determine locations where external ranging sources (such as lidar) are needed to maintain continuous navigation with fault-free integrity.
GNSS-ONLY AVAILABILITY
For GNSS availability evaluation, we assume an integrity requirement that the probability of exceeding a 0.5-meter alert limit must be lower than 10−7. The 0.5-meter alert limit therefore corresponds to approximately five times the position standard deviation, so the maximum allowable position error standard deviation is then approximately 0.1 meters. Accuracy at this level clearly requires differential GNSS carrier-phase measurements. We assume a nominal GNSS double difference (DD) carrier ranging error standard deviation of approximately 0.02 meters, and that carrier cycle ambiguities can be readily resolved in an open-sky environment prior to initiation of vehicle motion.
Given the assumptions made of the maximum allowable position error standard deviation and the GNSS ranging error standard deviation, the maximum allowable horizontal dilution of precision (HDOP) is about 5.
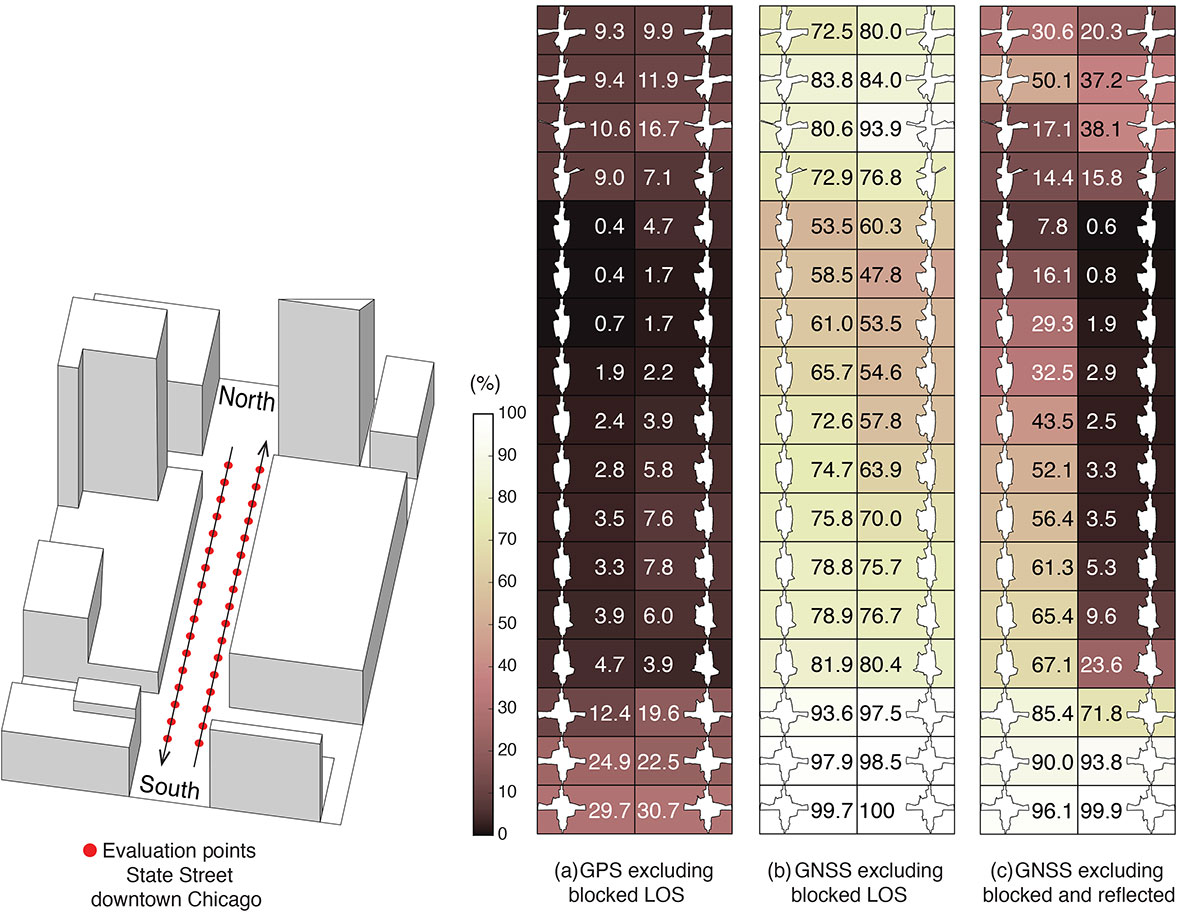
FIGURE 3 shows GPS and GNSS availability — the fraction of time the HDOP requirement is met over 24 hours — along a section of State Street in downtown Chicago. The availability results using GPS only and excluding only blocked LOS signals ranged from 0% to 9% along the block and 9% to 30% at the intersections (see FIGURE 3a). Using four full GNSS constellations (GPS, Galileo, GLONASS and BeiDou), availability ranged from 48% to 82% along the block and 72% to 100% at the intersections (see FIGURE 3b).
FIGURE 3. The percentage of GPS or GNSS availability in 3D-mapped downtown Chicago. We exclude satellites producing blocked LOS signals or both blocked and reflected LOS (NLOS) signals from the measurements. Each column expresses a lane of southbound or northbound travel. The availability is the percentage of total time when HDOP meets the self-driving car integrity requirements in 24 hours. (Image: Authors)
When we also excluded satellites producing reflected LOS signals that reach the vehicle, the availability dropped significantly at every point (see FIGURE 3c). We assert that FIGURE 3c expresses the reality of GNSS availability because building-reflected multipath signals degrade positioning accuracy and would affect integrity negatively. It’s obvious from these results that GNSS alone is insufficient to meet the autonomous driving requirements in an urban environment, and multi-sensor integrated navigation systems are needed to augment poor GNSS signal availability.
MULTI-SENSOR INTEGRATION
We begin by considering tightly coupled INS/GNSS integration using an EKF, and then integrate a realistic sensor suite including WSS and vehicle dynamic constraints that enforce resistance to lateral sliding and vertical movement. If it is known from another source that the vehicle is not moving (for example, it is in the parking gear), a static mode constraint (SMC) can also be applied.
INS/GNSS Integration. Tightly coupled INS/GNSS integration with an EKF uses the INS measurement to predict vehicle motion. The continuous process model uses a state vector having the position in the navigation frame, the velocity, the attitude, bias errors and cycle ambiguities, with the input vector having accelerometer-specific force measurement in the body frame and gyro-rotation-rate measurements. A white-noise vector drives the inertial measurement unit (IMU) states.
The GPS/GNSS measurement model includes the measurement vector having carrier and code phases, and the observation matrix containing LOS vectors and the vector of white receiver thermal noise.
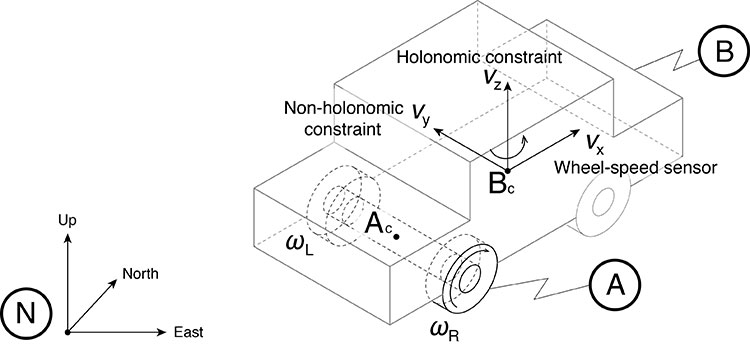
INS/GNSS/WSS/VDC Integration. For the vehicle in motion, we developed a model consisting of a WSS measurement in the along-track direction, a non-holonomic constraint resisting lateral sliding, and a holonomic constraint on vertical movement (see FIGURE 4).
The INS/GNSS/WSS/VDC integration using the EKF consists of the process model and the measurement models.
FIGURE 4. The measurement model consisting of the WSS measurement in the along-track direction (vx), non-holonomic constraint resisting lateral sliding (vy), and holonomic constraint on vertical movement (vz). N is the navigation frame, Ac is the rear-axle center point and Bc is the center point of the body-fixed frame. (Image: Authors)
INS/GNSS/SMC Integration. The static mode constraint provides zero-velocity measurements to the EKF measurement update to mitigate position error propagation. We use SMC only when it is known that the vehicle is not moving; for example, when the vehicle is in the parking gear.
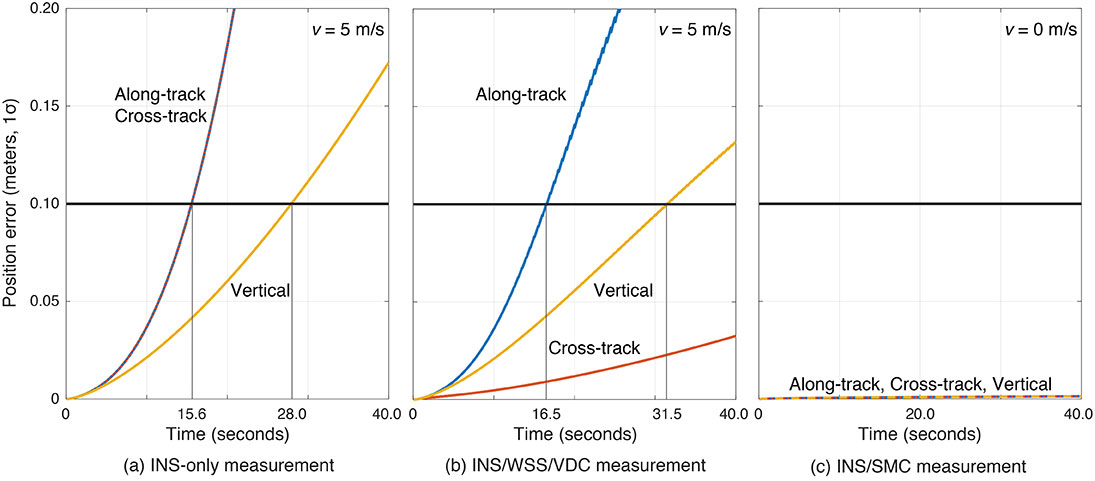
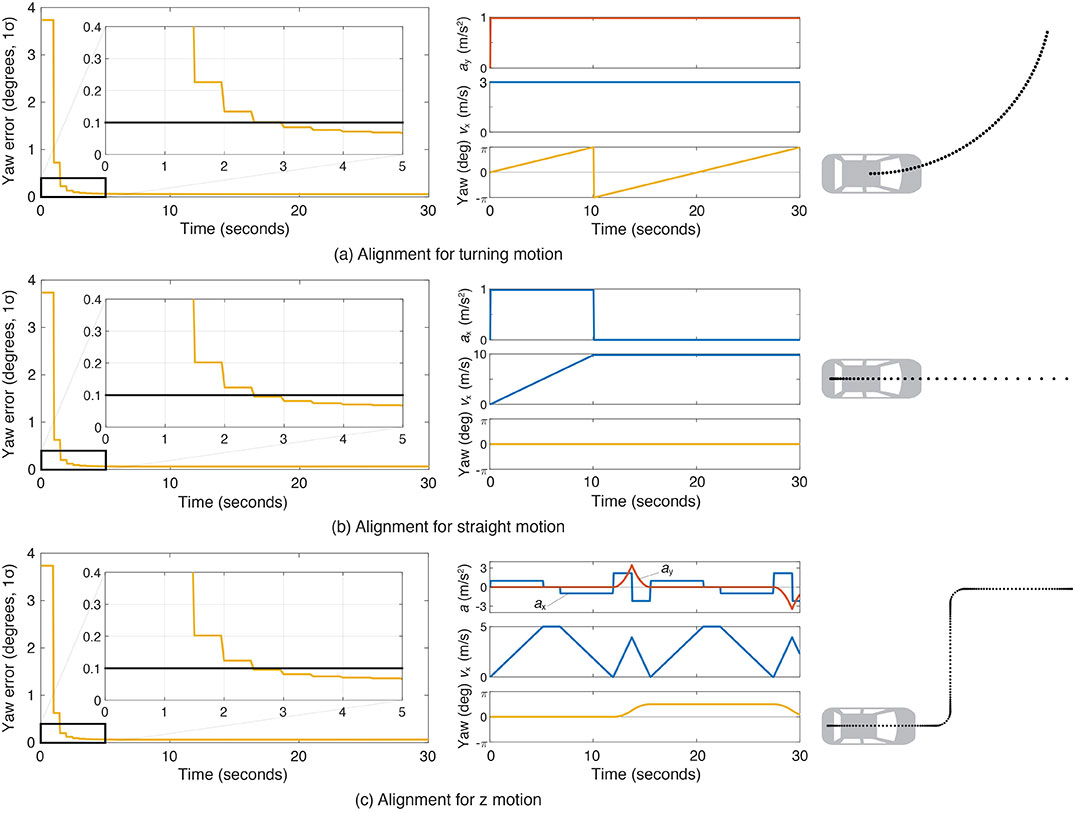
Error Propagation Analysis. We tested the time from perfect initialization to when position error exceeds 0.1 meters in GNSS-denied environments. FIGURE 5 shows the error growth in the along-track (x), the cross-track (y) and the vertical (z). The error specifications for a STIM300 tactical-grade IMU are used in this analysis. The standard deviation of the WSS measurement noise is assumed to be 0.05 meters per second, and the standard deviation of the movement constraint violations is 0.001 meters per second. The vehicle is moving at 5 meters per second except when we test the SMC.
The INS can coast 15.6 seconds before the position error standard deviation exceeds 0.1 meters in both the along-track and the cross-track directions (see FIGURE 5a). The INS/WSS/VDC can coast 16.5 seconds in the along-track direction, and significantly more than 40 seconds (the simulation duration) in the cross-track direction (see FIGURE 5b). In static mode, INS/SMC estimate errors do not grow with time in any direction, as expected (see FIGURE 5c). In GNSS-denied environments, the non-holonomic constraint suppresses the cross-track position error, but the WSS measurement hardly affects the along-track position error. The SMC works perfectly, but the usage is limited to when the vehicle is known to be stationary.
FIGURE 5. The vehicle position error growth vs. time in the along-track (x), cross-track (y) and vertical (z) directions. Each graph represents the navigation system introduced in the multi-sensor integration section. The vehicle is moving at 5 meters per second (a and b) or 0 meters per second (c). (Image: Authors)
SIMULATION SCENARIO
We imagine a future driverless-car mission scenario in which multi-sensor navigation systems are practicable. To minimize congestion in a city, autonomous vehicles will be held outside the urban core when not in use. In the clear open-sky environment, a vehicle in a parking lot completes GNSS initialization using the INS/GNSS/SMC system. Once requested for action, the vehicle departs for the city from the parking lot, and the motion of the vehicle improves alignment by the INS/GNSS system. Safe navigation can be ensured using the system to provide continuity under overpasses and bridges in the open-sky environment. Upon entering the urban core, navigation becomes more dependent on the INS/WSS/VDC system.
A reasonable numerical target for differential GNSS initialized position error is 0.02 meters, and for the INS alignment yaw angle error 0.1 degrees.
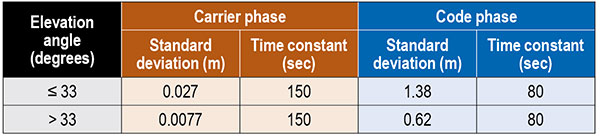
Local GNSS multipath errors from nearby vehicles will vary with the satellite elevation angle. Prior experimental results show that lower elevation-angle satellite signals (below 33 degrees) are much more likely to be impacted by multipath than higher ones (see TABLE 1).
Table 1. The nominal GNSS multipath error values in the simulation.
INITIALIZATION AND ALIGNMENT
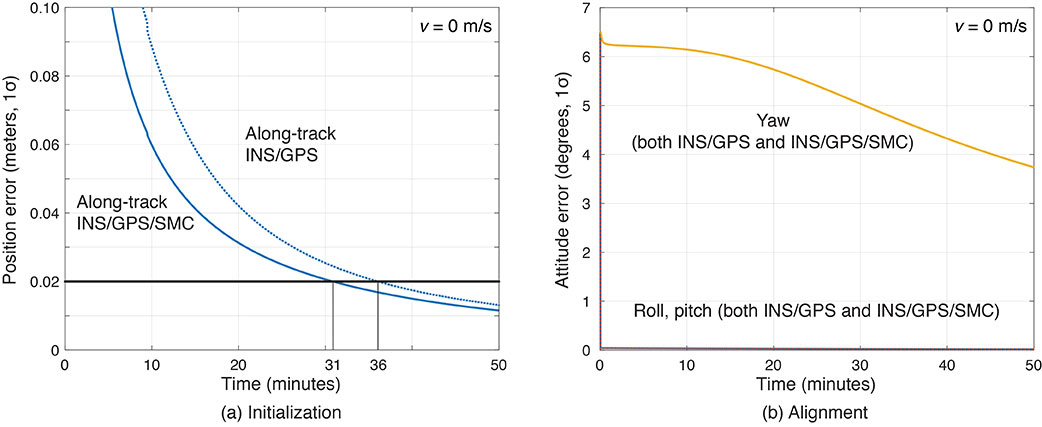
Initialization takes place in a parking lot with a clear sky view. A vehicle is in the parking gear, enabling SMC to be applied. FIGURE 6a shows a typical example: with INS/GPS/SMC, system initialization takes about 31 minutes, and with INS/GPS, about 36 minutes. Therefore, SMC does speed up GPS initialization, although the improvement is modest.
The yaw angle is not aligned during the initialization, but roll and pitch are immediately aligned (see FIGURE 6b). Earth’s gravity affects roll and pitch angle alignment but not yaw angle.
Yaw angle alignment cannot be performed when the vehicle is stationary or moving with constant velocity. Accelerated motion, either straight or turning, is required.
FIGURE 6. (a) Comparisons of initialization time between INS/GPS and INS/GPS/SMC in an open-sky environment. The INS/GPS/SMC system initializes rapidly. (b) Transitions of roll, pitch, yaw alignment during the initialization. Yaw angle alignment cannot be performed when the vehicle is stationary. (Image: Authors)
FIGURE 7 shows the behavior of the yaw angle error standard deviation using the INS/GPS system when centripetal (see FIGURE 7a) or tangential (see FIGURE 7b) acceleration is applied. The yaw angle can be aligned in a couple of seconds for either type of acceleration. To represent typical initial motions of self-driving cars, we model a parking-lot departure via a “Z”-shaped path. In this scenario, the yaw alignment error reaches 0.1 degrees within a couple of seconds (see FIGURE 7c).
FIGURE 7. The behavior of yaw angle error when centripetal (a) or tangential (b) acceleration is applied; (c) shows the behavior while following a z-shaped path. The yaw angle can be aligned in a couple of seconds in each case. (Image: Authors)
EVALUATION IN URBAN ENVIRONMENTS
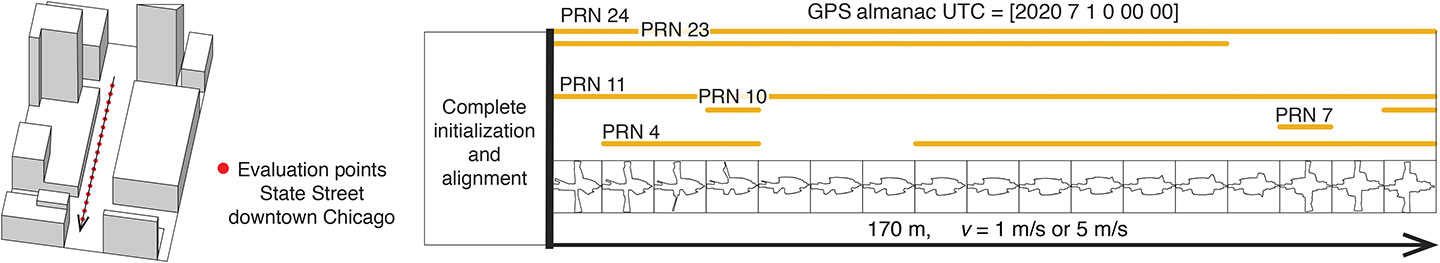
After initialization and alignment in the open-sky environment, we simulated the vehicle traveling into the urban core. The urban environment in our study is 3D-mapped State Street in Chicago, which runs north-south and transits from low-rise neighborhoods to central downtown. We selected one congested section surrounded by tall buildings and computed the position error standard deviation along the path. The evaluation points are at 10-meter intervals over a total distance of 170 meters. The yellow lines in FIGURE 8 denote the visible satellites, identified by their pseudorandom noise (PRN) code numbers, at each point. We assume for convenience that the INS/GPS system is initialized and aligned at the first evaluation point. In reality, we would expect a degraded initial condition because we are starting the simulation in an urban canyon.
FIGURE 8. Evaluation points and PRN numbers of visible satellites at each point. (Image: Authors)
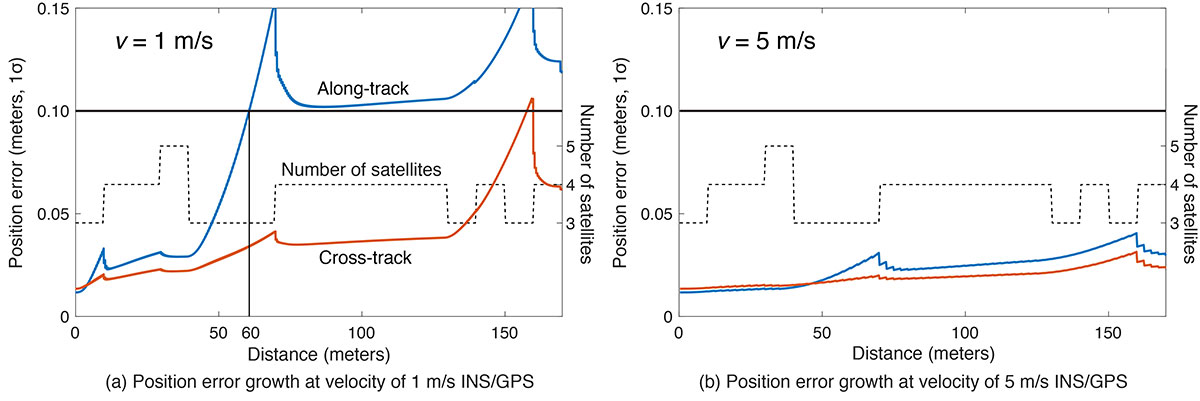
In the first simulation, the car equipped with the INS/GPS system moved either 1 or 5 meters per second. The y-axis in FIGURE 9 represents the position error standard deviation, and the x-axis represents the distance in meters. The dotted line expresses the number of visible satellites. The error when the vehicle velocity is 1 meter per second exceeded the maximum allowable position error standard deviation of 0.1 meter, at the distance of 60 meters. However, when the velocity was 5 meters per second, the maximum allowable position error standard deviation was never reached. It is also clear from the figures that error propagation is significantly affected by the number of visible satellites.
FIGURE 9. A comparison of position error growth between velocities of 1 meter per second and 5 meters per second. (Image: Authors)
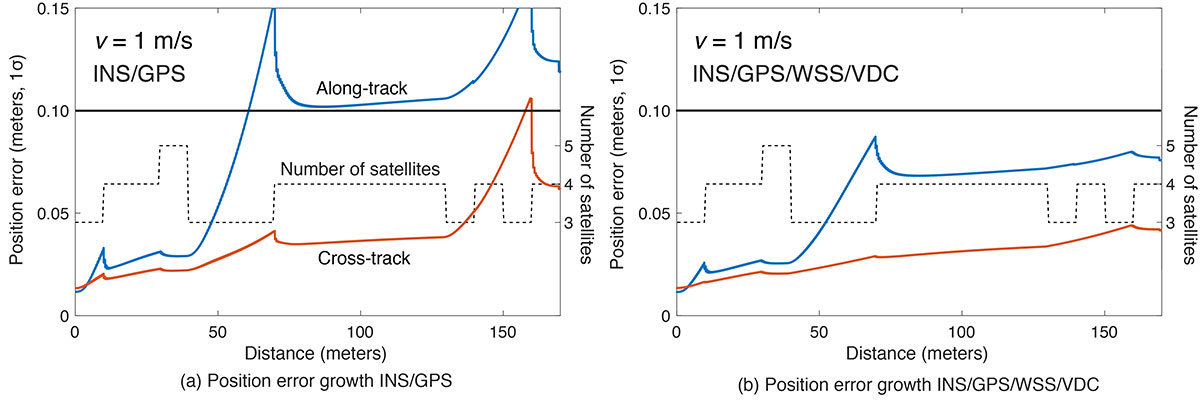
In the second simulation, we compared two different navigation systems, INS/GPS and INS/GPS/WSS/VDC. The vehicle moved at 1 meter per second in the same urban environment. The INS/GPS/WSS/VDC system does provide relief, but the error propagation is still clearly affected by the number of visible satellites (see FIGURE 10).
FIGURE 10. A comparison of position error growth between the INS/GPS and INS/GPS/WSS/VDC systems for a velocity of 1 meter per second. (Image: Authors)
In GNSS-challenged environments, INS error propagation is a function of time. When a vehicle moves faster, it clears the blockage area more quickly, reducing the impact of INS drift — a function of time, not distance. In contrast, GNSS error is completely determined by location. Because INS error propagation depends on how long the vehicle stays in an area of GNSS outage, protection levels for trips through the same area will be different if the vehicle is smoothly cruising or gets stuck in a traffic jam.
CONCLUSION
To gain a better understanding of how long and under what local conditions multi-sensor integrated navigation systems can maintain fault-free integrity, we evaluated navigation positioning errors in 3D-mapped downtown Chicago. The system we developed consists of sensors with which self-driving cars would reasonably be equipped: GNSS, INS, WSS and dynamic constraints. We showed that INS/GPS position errors along the path depend very strongly on the vehicle’s speed. When the system is augmented with WSS/VDC, position errors are suppressed, but the error propagation is still strongly influenced by the number of visible satellites.
ACKNOWLEDGMENTS
The research described in this article is supported by the National Science Foundation. Figure 1 was created by Alexis Arias of the Landscape Architecture + Urbanism Program at the Illinois Institute of Technology (IIT). The authors greatly appreciate the advice and help of Nilay Mistry from that program.
This article is based on the paper “Evaluating INS/GNSS Availability for Self-Driving Cars in Urban Environments” presented at ION ITM 2021, the virtual 2021 International Technical Meeting of The Institute of Navigation, Jan. 25–28, 2021.
KANA NAGAI is a Ph.D. candidate and research assistant in mechanical and aerospace engineering at IIT.
MATTHEW SPENKO is a professor of mechanical and aerospace engineering at IIT. He earned his M.S. and Ph.D. degrees in mechanical engineering from the Massachusetts Institute of Technology.
RON HENDERSON is a professor and director of the Landscape Architecture + Urbanism Program at IIT. He earned his Master of Landscape Architecture and Master of Architecture from the University of Pennsylvania.
BORIS PERVAN is a professor of mechanical and aerospace engineering at IIT. He earned his M.S. from the California Institute of Technology and Ph.D. from Stanford University.
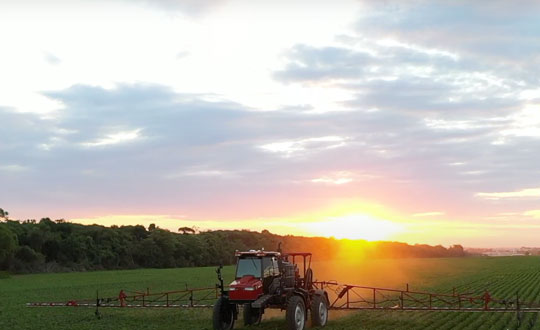
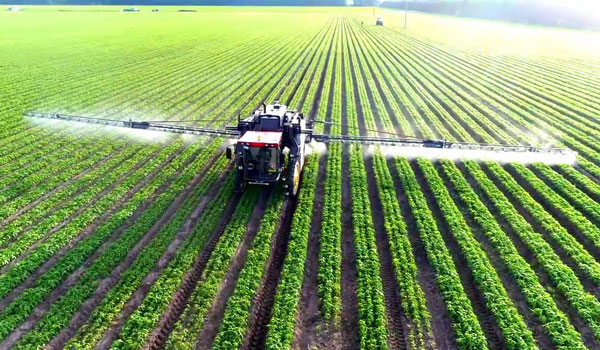
Precision agriculture — which promises to reduce inputs of water, fertilizers and pesticides by matching them to variations in soil conditions, thereby reducing environmental impacts, while increasing yields and productivity and reducing fuel consumption —has been around for a long time. This magazine published a few issues of a special supplement on the subject more than 20 years ago. In recent years, the convergence of enabling technologies — including improved satellite-based sensors, unmanned aerial vehicles, ground-based sensors, and GNSS corrections services — and greater demand has made agriculture one of the largest users of GNSS.
Compared to autonomous vehicles on public roads, autonomous tractors, sprayers, combines, and other farming equipment pose much lower safety concerns, because they need not deal with the vagaries of traffic, accidents and construction. They also are not subject to the kind of signal occultation and multipath that is the bane of GNSS navigation in urban canyons and, at least for now, they are not at significant risk of jamming or spoofing. However, they face other challenges, including severe roll and pitch due to bumpy terrain, some multipath from silos and other tall structures, occasional signal interference, occasional dense tree canopies, the requirement to maintain exact heading at very low speeds, the need to receive corrections over very large areas, complicated weather conditions (including rain, fog and dust clouds) and, like every other sector, cost constraints.
Despite this, guidance for farm vehicles must be consistently accurate at the decimeter-level, lest the machines damage the valuable crops that they are designed to service.
In the following articles, seven companies briefly describe their advancements in precision agriculture:
Although GNSS has been applied in agriculture for many years, farmers still encounter challenges caused by GNSS. No matter the farm task — planting, spraying, harvesting or specialized applications such as robotic grass mowing — position accuracy matters.
Here are the most common issues farmers have and how Unicore’s products help.
Under canopy. They are unable to get a fix under heavy foliage canopy because the real-time correction signal is interrupted or “shaded out” by the canopy. Unicore is launching two new modules that will help mitigate this problem.
Loss of lock. At times, the receivers lose lock or get large position errors when the ionosphere’s effects are severe. Driven by a full-constellation and full-frequency RTK engine, Unicore’s RTK algorithm takes advantage of triple and quad frequency observables, effectively mitigating ionospheric residuals.
Loss of 4G signals. RTK can provide real-time centimeter-level high-precision positioning, which requires real-time base station data. In practical applications, radio or wireless network communication is often interrupted. During the interruption of the base station data, RTK’s positioning accuracy decreases quickly. Unicore’s RTK KEEP technology can maintain the centimeter-level positioning accuracy for more than 10 minutes after the interruption.
Lack of CORS stations. It is challenging to provide a stable high accuracy position for an ultra-long baseline. With the mitigation of ionospheric and tropospheric delays, Unicore products’ RTK baseline can be extended to up to 50 kilometers.
The UM980 is Unicore’s new-generation high-precision RTK positioning module, supporting full constellation and full-frequency. Relying on the strengths of high reliability, precise positioning accuracy and low latency, UM980 is not only well suited for high-precision surveying and mapping, but also a good choice for rover or base station receivers in agriculture.
The UM982 is a dual-antenna high-precision positioning and heading module. Since its master and slave antennas can simultaneously track all the frequencies of all the GNSS systems, the UM982 performs fast on-chip RTK positioning and dual-antenna heading solutions without the need to initialize the IMU. Featuring great positioning performance and stability, the UM982 is a perfect choice for high-precision agriculture applications, such as drones, autonomous tractors and autonomous lawnmowers.