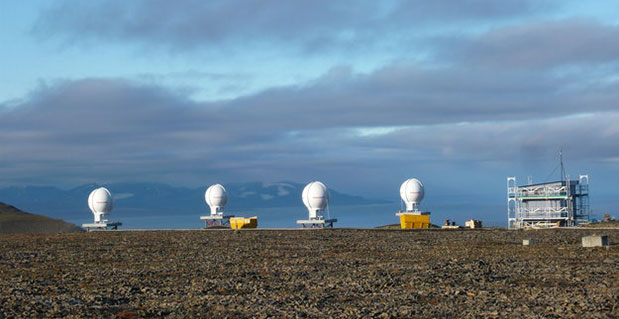
Svalbard station on Spitsbergen in the Norwegian Arctic.
The European Space Agency’s completion of a pair of dedicated ground stations at opposite ends of Europe has enabled Galileo satellites in orbit to participate in global testing of the Cospas–Sarsat search and rescue system.The Maspalomas station, at the southern end of the largest island of the Canary Islands, at the southern fringe of European waters, was activated in June. And this last month has seen the Svalbard site on Spitsbergen in the Norwegian Arctic come on line — the two sites can already communicate and will soon be performing joint tests.
This speedy progress has enabled the participation of the latest two Galileo satellites in an international demonstration and evaluation program — a worldwide test campaign for a new expansion of the world’s oldest and largest satellite-based rescue system, Cospas–Sarsat.
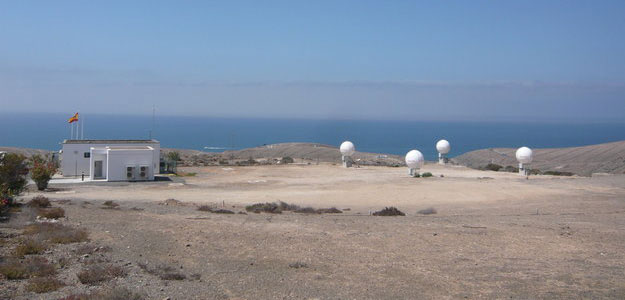
The Maspalomas station in the Canary Island has an ESA-built Maspalomas Medium-Earth Orbit Local User Terminal (MEOLUT).
Founded by Canada, France, Russia and the U.S., Cospas–Sarsat has assisted in the rescue of tens of thousands of souls in its three decades of service. Distress signals from across the globe are detected by satellites, then swiftly relayed to the nearest search and rescue (SAR) authorities.
Now the program is introducing a new medium-orbit SAR system to improve coverage and response times, with the Galileo satellites in the vanguard of this major expansion.
Supporting search and rescue is a separate function to Galileo’s main task of providing global navigation and timing services, but no less important.
The second pair of Europe’s Galileo satellites — launched together on 12 October last year — are the first of the constellation to host SAR payloads. These can pick up UHF signals from emergency beacons aboard ships, aircraft or carried by individuals, which are then relayed to ground stations. There, the source is pinpointed and automatically passed on to a control center, which then routes it to local authorities for rescue.
“The Galileo satellites, tested in combination with the same SAR payloads on Russian Glonass satellites as well as compatible repeaters on a pair of US GPS satellites, showed an ability to pinpoint simulated emergency beacons down to an accuracy of 2-5 km in a matter of minutes,” explained ESA’s Galileo SAR engineer, Igor Stojkovic.
“Our in-orbit validation tests so far have been in line with expectation and beyond, giving us a lot of confidence in the performance of the final system, once completed.
“And using a combination of satellites is just how the upgraded system will operate in practice, in order to localise distress signals.”
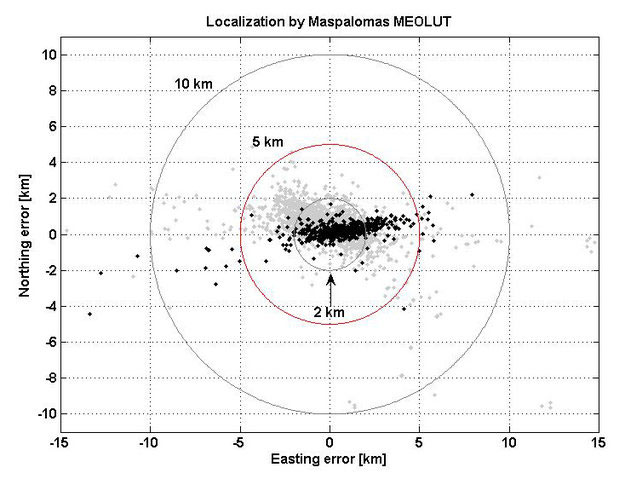
Localization test performed from the Maspalomas MEOLUT on 29-30 July 2013 as part of Galileo’s search and rescue in-orbit validation. Beacon locations obtained with four satellites are shown in black, while those using three satellites are shown in grey. More than 93% of all beacon locations, after only a single beacon burst has been received, are within the required 5 km from the actual beacon position.
TeleCommunication Systems (TCS), a provider of mobile communication technology, announced that its TCS VoLTE9-1-1 service is first into production with Tier-1 wireless carriers, including two of the largest North American operators. The fully customizable solution enables 4G/LTE carriers to provide both 911 call routing and originating coarse/precise location information, including the 10-digit callback number, to public safety access points (PSAPs).
Initially, wireless carriers deployed 4G/LTE solely for data use. Without VoLTE9-1-1 capabilities, carriers must process emergency calls over 3G networks (circuit-switched fallback), even in areas where LTE is deployed. However, with TCS’ VoLTE9-1-1 service, they can now process 911 calls in an all-LTE environment, enabling them to reclaim or reuse 3G spectrum.
“As carriers increasingly move toward LTE networks, the ability to handle 911 emergency communications is critical,” said Thomas Ginter of TCS. “By leveraging VoLTE9-1-1, network operators are helping to ensure subscribers receive the responsiveness they need in an emergency situation, while expanding coverage to areas where 3G coverage is lacking.”
TCS VoLTE9-1-1 features:
Call routing to the PSAP: The TCS VoLTE9-1-1 service routes a 4G/LTE-originated 911 call using coarse location via the route determination function component.
PSAP telecommunicators can call back if disconnected: The TCS VoLTE9-1-1 service remains fully backwards compatible, supporting necessary functions such as providing PSAPs with full 10-digit subscriber callback numbers.
Re-bid by a PSAP for precise location after call routing: The location retrieval function allows a wireless carrier complete flexibility in choosing its underlying high-accuracy location technology and supports updated/precise position requests.
Emergency voice call continuity for location service: Location continuity and location delivery to the PSAPs are supported in usage scenarios where the 911 call switches from 4G/LTE to 3G/2G networks.
Expansion beyond voice: As wireless networks advance, multimedia objects such as text, audio and video can be transferred to a compatible termination point with LTE IP networks, for example, an NG ESINet and i3 PSAP. Leveraging an all-IP network makes it easier and more cost effective to interconnect services.
Small cell support: The TCS VoLTE9-1-1 solution supports small cells, including femtocells, microcells, and picocells, which are now commonly used in dense urban, indoor areas and enterprise networks.
TCS supports half of all U.S. wireless E911 calls, serving more than 140 million wireless and IP-enabled devices. The company holds more than 280 patents, 43 of which relate to public safety, and more than 360 pending worldwide.
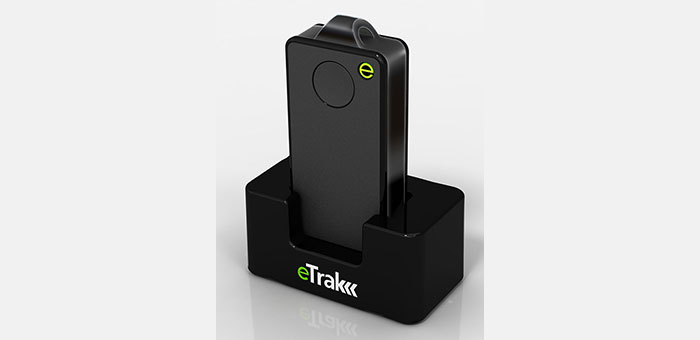
eTrak has released its GPS+ line of consumer and commercial tracking products. GPS+ is eTrak’s patent-pending technology that integrates Wi-Fi, cellular triangulation and GPS to achieve the most accurate positioning possible, both indoors and out, eTrak said.
GPS+ delivers accurate location in real time directly to a smartphone, tablet or computer. eTrak products also contain geofencing capability, which triggers notifications if the device goes beyond preset boundaries. Additionally, the notifications provide a map and address with the location of the device.
“Small and large businesses will benefit from tracking their assets with loss prevention and cost savings,” said eTrak CEO, John Harris. “They will also be able to keep their employees safe and know if they are in danger or need assistance.”
Set-up and the use of eTrak products is simple, the company said. Users can go to eTrak.com and start tracking from any smartphone, tablet or computer and instantly see the location of the eTrak device. The eTrak consumer device is also equipped with an emergency panic button that sends help requests to predetermined recipients in the event of an emergency.
“eTrak is the size of a domino and weighs less than an ounce,” Harris said. “eTrak provides the longest battery life available, and is a low cost personal emergency-response product. And with Verizon’s industry-leading coverage map, it works almost anywhere.”
The eTrak product line encompasses commercial applications, as well as consumer segments including health-impaired, special needs, teens and pets. eTrak also supplies custom design and development services.
Tractor rollovers are the leading cause of death among farmers and claim about 250 lives each year, according to the National Institute of Occupational Safety and Health (NIOSH). These accidents are deadly because they often occur far away from farmers’ homes or roads and they may be unable to reach a phone to call for help. Now, University of Missouri researchers have developed an application for smartphones that uses GPS systems to locate farmers who have rolled their tractors.
The app, called VRPETERS (Vehicle Rollover Prevention Education Training Emergency Reporting System), uses sensors and GPS capability built into smartphones that can detect rollovers. Once the app detects a rollover, it sends an automatic emergency e-mail and phone message with the coordinates of the accident location to family or emergency responders.
“The tractor is the main power source for field operations, and tractor rollover accidents have been killing people since the beginning of their use in agricultural production,” said Bulent Koc, assistant professor of agricultural systems management at MU and developer of the app. “More and more farmers are using their smartphones to monitor weather or calculate production inputs while operating machinery. Since they already have their phones with them, installing VRPETERS could help save lives.”
Data from the NIOSH show that one out of every 10 tractor operators will roll a tractor at least once. NIOSH also notes that only half of the 4.7 million tractors on U.S. farms have rollover protection. In order to minimize false alarm rollovers on the app, Koc and his research assistant Bo Liu designed a device that must be attached to the tractor. This device helps calculate the stability characteristics of the tractor and will provide a warning to the driver when the tractor approaches its rollover point.
“Many farmers think they can jump out of their tractors in the event of a rollover, but this isn’t the case usually,” Koc said. “Side rollovers can occur in just three-quarters of a second and most people need a second or more to react to an event. So, VRPETERS can benefit farmers when a rollover occurs because they often can’t reach their phones to make an emergency call.”
VRPETERS can benefit more than just farmers, as the app also can be used on construction vehicles, trucks, snowmobiles, military vehicles, riding lawnmowers and all-terrain vehicles.
In addition to the rollover device installed on tractors and other dangerous equipment, Koc and Liu designed another device that can be used with VRPETERS. This device can be installed on vehicles and can be used as a backup to stream data to a smartphone or tablet. “With this additional device, parents or fleet managers can obtain real time data on how machines are being used,” Koc said. “If the device detects improper operation, an intervention can occur before an accident happens.”
Initial testing of VRPETERS was done using a remote-controlled model tractor. Once fully tested on a standard tractor, Koc and Liu will look for an industry partner to market the app.
New technology from product development firm Cambridge Consultants can accurately detect someone’s location indoors when GPS drops out. A number of sensors and a custom algorithm determine the location, with an accuracy of within approximately 1 percent of the distance traveled.
The technology uses low-power, low-cost sensors and the device concept is small enough to clip on a belt. It also doesn’t need any existing internal infrastructure.
“We are excited about the many possibilities this cutting-edge technology opens up and the impact it can have in many different situations,” said Geoff Smithson, technology director, sensing systems, at Cambridge Consultants. “It could be used to help locate firefighters in smoke-filled buildings, for example, or to pinpoint the closest doctor in a hospital during an emergency — or to track offenders during home curfews. We are just starting to see the potential of this approach and the diverse demand for this type of low-energy, highly accurate system.”
Indoor tracking systems, which process data from one or more sources of location information to estimate where a person or object is located, are not new. But they often rely on RF signals from Wi-Fi access points or custom infrastructure, poor-quality GPS signals or expensive, high-quality sensors. The availability of low-cost smartphone components — including accelerometers, gyroscopes, magnetometers and pressure sensors — has enabled a new generation of location devices and applications, when combined with a tailored Bayesian algorithm to fuse the information.
The new technology platform can be embedded in an existing design or operate as a stand-alone unit, with options to compute the location locally or transmit the information to a remote system that can process the data before visualizing it on a smartphone app.
“Our biggest challenges were developing an algorithm which optimally combines the data from GPS and the other sensors, and overcoming the issues of using such low-cost sensors in a system without any absolute location reference,” said Smithson.
Cambridge Consultants specializes in developing low-cost, low-power connected devices for clients with a team of experts with sensing, wireless and software engineering expertise. The latest technology builds on the company’s tracking and location systems experience in a variety of market sectors ranging from defense and security to consumer, industrial, and oil and gas.
Skyhook and Philips Lifeline have announced a collaboration to incorporate Skyhook’s hybrid location positioning platform into Philips’ Lifeline GoSafe mobile personal response services. Skyhook’s hybrid location service will be part of a suite of locating technologies used with the new GoSafe system and designed to help provide the call center with the location information needed to support locating of users in the event of an emergency.
“Accurate location information is of critical value to ensuring the quick dispatch, arrival and delivery of what is often life-saving assistance,” noted Rob Goudswaard of Philips Home Monitoring. “After reviewing the market, we concluded that Skyhook’s location network and technology capabilities were consistent with our requirements for enabling timely and accurate response.”
“If an individual experiences a fall or other emergency, quickly getting help to the right location is of vital importance,” said Michael Shean of Skyhook. “Skyhook is proud to partner with Lifeline, the leading medical alert service, in order to enhance the safety and care that Lifeline provides to all of its customers.”
u-blox, the Swiss positioning and wireless chip and module company, has been chosen for global positioning and embedded 2G/3G wireless technologies by MobileHelp, an American provider of M-PERS (Mobile-Personal Emergency Response System) technology. Based on u-blox’ LISA 2G/3G wireless modem and MAX GPS modules, the comprehensive system includes compact, portable alert devices that function in and around the home, and while traveling.
“As the population ages, more and more people are choosing to remain independent for as long as possible” said Robert Flippo, President of MobileHelp. “With the help of u-blox’ reliable, low-power positioning and wireless technologies, our MobileHelp medical alert systems are giving a whole generation of people the freedom to live in their homes and travel independently knowing that simple and fast emergency assistance is just a push-button away.”
Unlike traditional 911 direct dial services, MobileHelp devices deliver instant positional information as well as personalized medical data to an emergency response center at the touch of a button. The system is integrated with nationwide wireless voice, data and satellite GPS technology to provide real-time medical monitoring services, location tracking, and instant voice contact with trained emergency response operators. MobileHelp also offers Caregiver Tools, an innovative event notification and online tracking platform that keeps families and caregivers informed of an emergency event. With AT&T as connectivity partner, the devices work in 97 percent of the inhabited areas of the USA.
MobileHelp comes in three configurations, “Classic” for home-monitoring over fixed line telephone, “Solo” for travelling and at homes without a fixed line telephone connection, and “Duo,” for travelling and at homes that have a fixed line telephone connection.
MobileHelp’s alert products have been developed with Singapore-based Daviscomms, a design and manufacturing partner providing advanced engineering services to customers in the consumer and industrial markets worldwide.
An exercise in planning for months proves timely in light of Hurricane Sandy
By Art Kalinski
I was going to write about the increasing presence of social media at GEOINT 2012, but I’ll cover that next month since Hurricane Sandy made an exercise I attended last week more significant in its timeliness.
The Disaster Response Integrative Logistics Exercise was a joint effort of the Institute for Defense & Business and Lockheed Martin. Heading up the effort was retired U.S. Ambassador David Litt of the IDB and Corey Cook of Lockheed Martin. The almost week-long event was held at the Lockheed Martin Lighthouse located in Suffolk, Virginia, near Norfolk. The 65,000-square-foot high-technology facility is designed for experimentation and prototyping using analysis, modeling and simulation. It’s a reconfigurable command and control operations laboratory that permits participants to test and analyze concepts in a gaming environment.
The stated purpose of the disaster response exercise was: “Given the nature, frequency, location and severity of disasters, inter-organizational collaboration – to include the private sector – is becoming increasingly critical to the efficiency and effectiveness of logistics in disaster responses.” The exercise involved more than a 100 participants from the private sector, government agencies, non-profit organizations, and military services. Lou Kratz, Vice president and managing director, Logistics and Sustainment, Corporate Engineering & Technology for Lockheed Martin, stated that “Today’s crisis response efforts generally struggle with effective logistics collaboration among the multiple public and private stakeholders engaged. With our 21st-century logistics capabilities and global resources available from the public sector and private organizations, together we can develop solutions that will help our communities and businesses recover more quickly and effectively after a crisis.”
And collaborate we did! The list of participants was quite extensive and quite diverse. To give you a sense of the attendees, here is a partial list of organizations represented:
commercial companies included DHL, Maersk, Florida Power and Light, Fluor, Home Depot, Walmart
federal government agencies included FEMA, DHS, GSA, HHS, USAID, State Department
military organizations included NAVSUP, NORTHCOM, USACE, USAF, USMC, USN, SOUTHCOM, National Defense University, USCG, NORTHCOM
NGOs included United Nations agencies, the Red Cross, Operation Blessing, Catholic Relief Services and many more.
Conference attendance was significantly impacted by Hurricane Sandy, which also highlighted its timeliness. FEMA, USAID, USACE, and the Red Cross, who were confirmed attendees and were instrumental in the development of the DRIL exercise, were deployed to Hurricane Sandy just hours before the start of the event. Fortunately, attendance to the DRIL by multiple organizations and substitute personnel was still robust, allowing for a highly successful exercise.
Some of the exercise objectives included defining and understanding different agency logistics capabilities, leadership structures, institutional and regulatory obstacles, differences in cultures, missions and operating procedures while developing metrics to evaluate performance in disaster response efforts. To accomplish the objectives, all the participants were organized into four integrated teams that were then separated at times into functional teams and then reassembled with representatives speaking for each team to the entire group of attendees.
Since this was the first exercise of its type, it was a learning experience for all involved and focused on the basics of personnel interactions and group consensus. Each participant had access to his or her own computer, common computer resources and pre-developed exercise parameters. There were many artificial assumptions presented to the teams, and the team members made even more assumptions and guesses as they worked through the individual scenarios. Most of the exercise consisted of reviewing the effects of Category 5 hurricanes hitting the Dominican Republic, South Florida and Virginia, so there was a domestic as well as international impact. We participated in our groups, listening to individual team members with specialized knowledge and experience, then prioritized the delivery of needed resources and services. As the exercises ramped up, there were many animated discussions in which basics such as water, food, shelter, medical, electric power and transportation infrastructure were prioritized and justification documented.
I made several observations to myself as the exercises progressed. First, there are definite cultural differences between federal, military, NGO and commercial agencies. Not bad differences, just different. Second, individual personalities can steer the group dynamics and outcomes. And third, situational awareness is critical to effective disaster response. Geospatial technology was not part of this first exercise, but would clearly have been valuable to provide a common operational picture. That level of complexity would not have been practical for this initial exercise, but it does lead me to the “Solutions” room next to the main exercise area.
In a space adjacent to the main exercise room was a “Solutions” room that showcased potentially helpful technologies. The room was open to exercise participants toward the tail end of the week. It consisted of a diverse assortment of commercial and government solutions that addressed some of the issues the teams struggled with during the week. Examples include a new computer-based system developed by the Navy Supply Systems Command (NAVSUP) that is similar to the commercial Kayak flight search system. The Transportation Exploitation Tool (TET) was explained to me by Greg Butler, division director, NAVSUP GLS Transportation, who initiated the effort. He explained that all too often resources are wasted flying parts or personnel on dedicated aircraft that are duplicate trips of other aircraft or ships with available space traveling to the same location. The new geospatial network scheduling system optimizes transportation resources across all branches of service and already saved the Navy $23M on a $750k investment.
Lockheed Martin displayed several technologies, including communications and data management technologies. One of the most interesting was its Hybrid Aircraft that was initially developed for military use. However, its ability to transport equipment and supplies efficiently to undeveloped sites while providing a persistent platform for communications and to collect and download imagery makes it a valuable asset for emergency response activities. To learn more, view the following video.
A representative from NATO explained the NATO Civil-Military Fusion Center, including a map library and custom services. Several exhibitors demonstrated the use of social media, which can be a very valuable and timely source of information to build situational awareness during emergencies. A company I work with, Soft Power Solutions, integrates GIS resources such as Google, USGS, ortho and oblique imagery married to geographically placed social media to build situational awareness that is quite robust. It was especially dramatic that during demonstrations, a 7.2 earthquake was reported off the coast of Guatemala. One could easily see the growing number of tweets that almost immediately confirmed the earthquake and level of damage. Here is a ShakeMap generated by USGS within minutes of the earthquake showing the level of impact on the Guatemalan coast (shown in yellow).
One of the exercise objectives was to develop metrics that would evaluate performance in disaster response efforts. There were many metrics developed that one would expect – roads open, electricity restored, utilities restored, etc. However, the one informal metric that was developed through personal experience of Florida emergency responders was the “Waffle House” metric. Waffle House is a ubiquitous restaurant chain with locations throughout the southeast. The Florida responders observed that driving from one county’s Waffle House to another open Waffle House was a good indicator that the location was in OK shape. Since a Waffle House needs minimal staffing and utilities compared to larger restaurants, it was a good indicator as to how bad conditions were in the location. Perhaps someone will develop a “Waffle House Open” type GIS layer as a metric to “okayness.” Sounds like a good thesis for a GIS graduate student.
Everyone who participated was enthusiastic about conducting another similar exercise. Planning is already underway to make that happen. I, for one, feel that this kind of exercise can have a significant positive impact on future disasters because it builds face-to-face relationships that are so valuable during actual events. I’m going to do what I can to help with a geospatial aspect in future exercises.
CACI builds a refined geospatial mobile application for emergency response.
As many of you have seen and experienced, a growing number of mobile applications use smartphones or tablet computers. I had occasion to see a demonstration of a specialized application, produced by CACI in collaboration with DigitalGlobe, designed primarily to support the management of diplomatic facilities during normal and emergency operations. The system is aptly called the Diplomatic Facility Support Package or DipFac for short. According to CACI engineers the system, which bridges both PCs and handheld mobile devices, was designed with a holistic approach from its inception.
DipFac is designed to prepare for, and manage, planned and unplanned situations as they affect our foreign diplomatic facilities and personnel. It helps embassy leaders manage events affecting facilities and, if needed, to develop contingency plans for the safe movement of diplomatic personnel. The rapid dissemination of geospatial information and real-time data provide a superb common operational picture while providing decision makers the support necessary for effective evacuation and recovery.
The system manages devices and data similar to an iTunes store, but as a completely secure service operating in its own environment. Below are screen shots showing the easy navigation of the system in field operations.
The mobile device accesses content via secure communications. The content is impressive in its scope and includes maps, imagery, biometrics, documents, social media, and all of it in an interactive collaborative environment. Using OGC standards, multiple layers of geospatial data and annotations can be integrated and displayed to form a common operational picture.
The data sets include the use of Open Street Map, a Wiki crowd-sourced digital street database built through the efforts of countless local contributors. Although it has no single “authoritative” source, users have found that this collaborative street base is impressive in its detail and currency. I haven’t previously used Open Street Map, but reviewing some areas I visited around the world it looked like a very good alternative and supplement to Google Maps.
Imagery is provided by DigitalGlobe and includes not only current imagery but historic imagery, where available. This is valuable for temporal analysis to identify changes that could possibly be significant. DigitalGlobe also provides numerous vector data layers such as streams, rivers, and political boundaries.
The collaboration environment is quite robust. There is a Twitter-like question-and-answer section along with the ability to annotate maps with Open Geospatial Consortium (OGC) standard symbols and the ability to draw lines and polygons to identify routes and areas of interest. There is even a biometric identification capability so accurate personnel identification can be done in the field along with document exploitation (DOCEX), media/computer exploitation (MEDEX), cell-phone exploitation (CELLEX), scene photography, and other capabilities. Users can take pictures, link them to a geographic location, and share those with others. The same is true with scanned documents that can also be run through a built-in translator. Although the translator is not perfect, it could be good enough to quickly understand the gist of a document viewed in the field. Headquarters or other users can also import and share CAD drawings, PDFs, and other digital documents and link them to facilities or geographic locations on the map. Site Exploitation (SITEX) functions include collection and sharing of site-specific information including evidence collection, room or building diagrams, dimensions, video of the site, pictures, people on site, and activities.
The entire system is similar to Palanterra, the National Geospatial Intelligence Agency (NGA) web-based GIS. Palanterra is a spatially and analytically enabled web-based GEOINT system designed to assemble, analyze, and display physical features and geographically located activities. It is also designed to integrate disparate data sources into a common operational picture, but unlike Palanterra, DipFac has a very light learning curve and can be used by operators in the field with very little geospatial training.
Above is a screenshot showing building footprints on the imagery and standard OGC-compliant annotations. The view on mobile devices is very similar. Other simulated examples permit users to annotate and share areas of interest such as a bomb blast locations and safe evacuation routes.
Based on my experience during emergency response exercises, one potential limitation of this and other web-based systems could be connectivity degradation, since the system relies on continuous updates. When I participated in a New York City Oil Spill exercise using Pictometry Online imagery, the growing number of emergency responders assembled as the event progressed, ultimately slowed all Internet activity to a crawl. I believe that being able to cache static data, such as imagery, during the early stages of an event is important to reduce total data traffic, permitting important flow of “live” data and communications. In conversations with CACI engineers, they agreed to consider adding that capability.
Although the turn-key DipFac system was designed for diplomatic facilities, one can easily see how the secure system could be very useful to any emergency responders or the military. I look forward to seeing how it performs in a real-world situation compared to other similar mobile applications. I recommended that they submit a request to demonstrate it at the next USSOCOM TNT.
The system is intuitive, easy to learn, and easy to use. With hundreds of at-risk U.S. facilities around the world, this could be a subtle game changer that may be very cost effective and save lives.
Chronos Technology, supplier of GNSS (GPS, GLONASS, and Galileo) products and services, welcomes the decision by the UK regulator Ofcom on June 20 to implement a licensing regime for the use of GNSS repeaters in the UK. Chronos Technology has been at the forefront of GNSS repeater technology for many years and is one of the largest suppliers of this technology to the military in Europe.
GNSS repeaters provide coverage for the use and testing of GNSS technology inside buildings where the GNSS signals do not normally reach. Until the recent decision by Ofcom, the use of this repeater technology in the UK was not permitted except in specialized (normally military) situations. Large numbers of consumer and industrial products use GNSS technology for positioning and timing applications including smartphones, telematics equipment, avionics and emergency service applications. GNSS technology can also be used for resource management, civil engineering and military applications.
The Ofcom consultation prior to this decision highlighted concerns about potential interference to applications by the use of GNSS repeaters; however, the conclusion was that a properly installed repeater system, conforming to the ETSI harmonized Standard for GNSS repeaters, should have no impact beyond 10 meters. This decision enables the use of GNSS repeaters in many applications and will provide significant benefits and cost savings to organizations wanting to develop, test, integrate and manufacture products and systems that use GNSS technology, Chronos said.
Chronos has installed repeater and other general GNSS infrastructure in more than 50 countries over 15 years.
When jamming interfered with GPS signals at Newark Airport, a three-month effort determined that low-power, mobile personal-privacy devices were responsible. This article describes how they were found and outlines how the observable parameters of such devices encompass a wide variation in RF spectra and internal modulation.
Personal privacy devices (PPDs) are now recognized as being responsible for causing interference to GPS receivers. However, in November of 2009, when the Local-Area Augmentation System (LAAS) installed its first Ground-Based Augmentation System (GBAS) at Newark International Airport (EWR), this fact was not known. Within the first month of its installation, anomalies in GBAS processing were correlated to the presence of radio-frequency interference (RFI). Initial efforts to determine the source of this unexpected RFI were not successful.
The Federal Aviation Administration (FAA) had a significant interest in finding this RFI source, leading to deployment of RFI detection and location equipment by several groups. Zeta Associates temporarily installed equipment in early January 2010 that was capable of detecting and characterizing RFI but did not have emitter location capability.
Determining that an RFI transmitter is in motion is more certain if the RFI is observed simultaneously by multiple sensors. However, analysis from hundreds of RFI events indicates that when an RFI source is in motion, observations collected by a single sensor can provide sufficient information to determine that the RFI transmitter is in motion.
Continuing interest in understanding PPD effects on GPS receivers led to the installation of remotely accessible monitoring equipment that provides detailed characteristics of these devices. Remote access facilitates monitoring, particularly since PPDs are present for 30 to 60 seconds at a time and only a few times a day.
Background
The January 2010 deployment included a WAAS GPS receiver, spectrum analyzer, and a Zeta custom-developed Snapshot System, assembled from commercial off-the-shelf (COTS) equipment for conducting WAAS site-installation surveys, and capable of capturing intermittent short-duration RFI events. It consists of a tuneable receiver (10 MHz to 3 GHz) whose RF front end spans 25 MHz that is digitized at a sample rate of 56 MHz, with storage capacity sufficient for up to 80 minutes. Once captured, the time-series data can be analyzed in many different ways. Possible analysis techniques include examination of the raw time samples, generation of spectral plots, or demodulation of the RFI signal. Each approach can lead to a better understanding of the underlying interference signal. If digital data is present and can be demodulated, it might be possible to associate the demodulated bits with a known transmitter.
Data can be captured manually or programmatically using a trigger determined by an algorithm that monitors WAAS GPS receiver automatic gain control (AGC) logs. The AGC function within a WAAS receiver has a well-behaved response for normal Gaussian noise RF environments. When RFI is present, the AGC exhibits atypical responses that then trigger the Snapshot System. As WAAS receivers utilize both L1 and L2, and each RF path has its own AGC, it is possible to detect the presence of potential RFI at either L1 or L2.
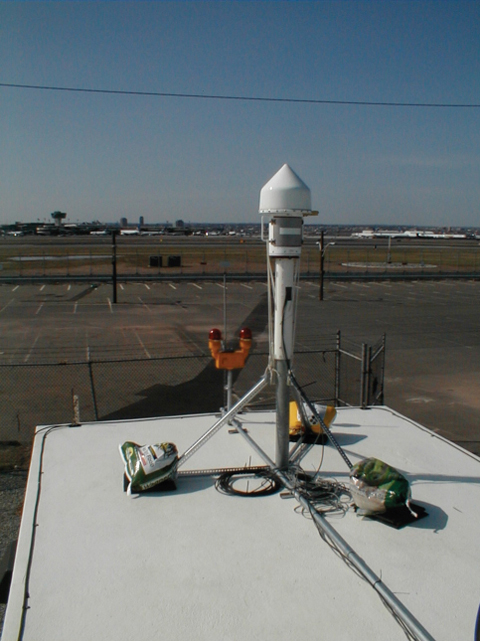
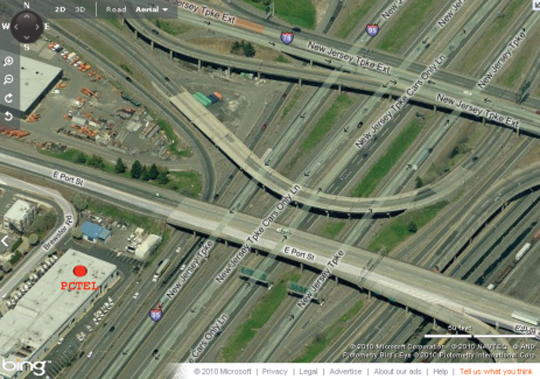
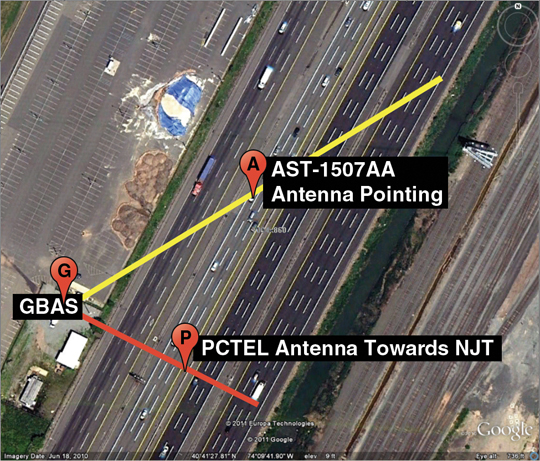
The Snapshot System RF input for this deployment was from a PCTEL antenna identical to those used at WAAS reference sites. This antenna incorporates a triplexer that provides three separate 40 MHz passbands each centered on L1, L2, and L5, with approximately 50 dB of gain. This antenna was located approximately one mile north of the four LAAS antennas within Port Authority of New York and New Jersey (PANYNJ) Building 80.
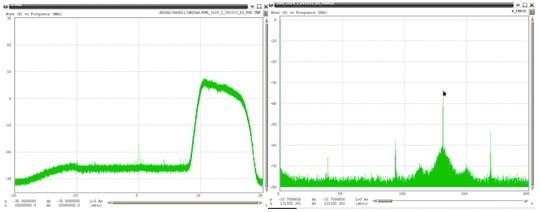
Within the first hour of being deployed on January 20, 2010 the Snapshot System had detected and captured one RFI event in the GPS L1 band. After one day, the Snapshot System had detected and captured more than 25 separate instances of RFI within the GPS L1 band. Most RFI events were narrowband (10s of kHz bandwidth) and short duration (no more than 3 seconds).
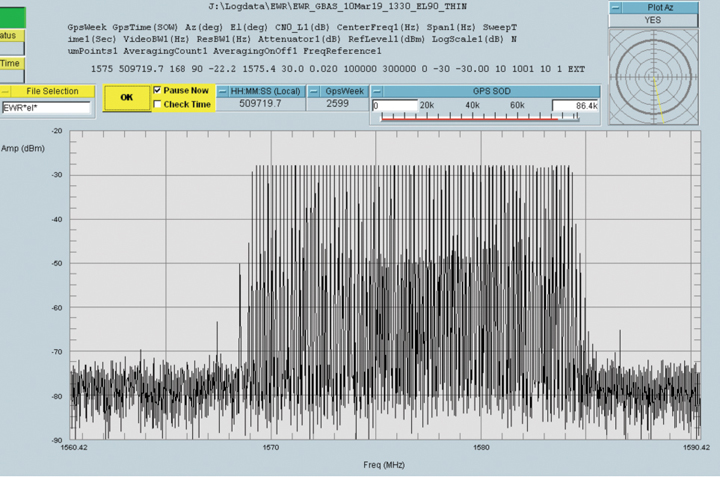
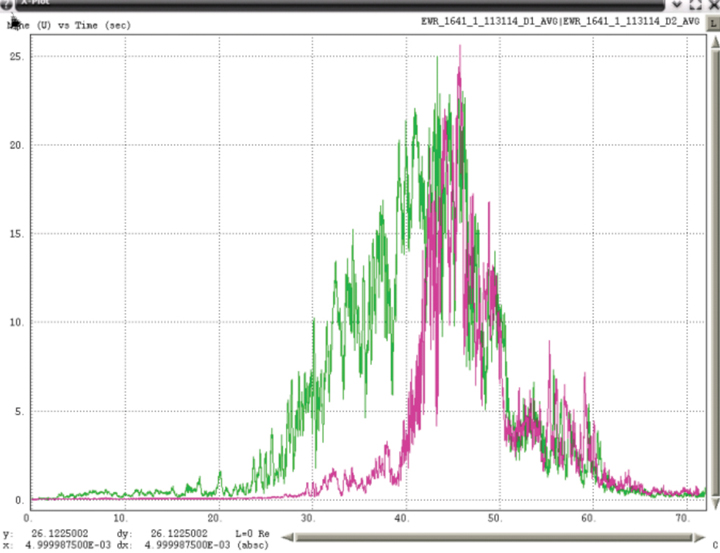
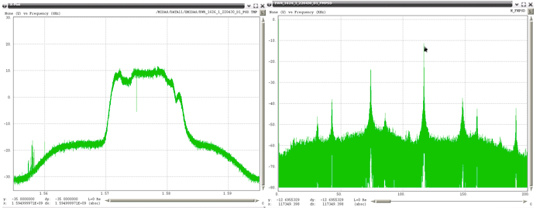
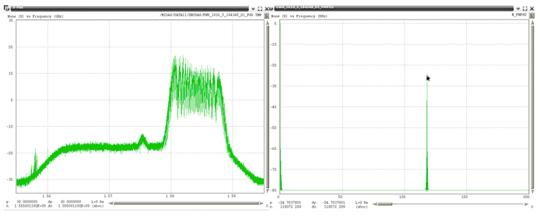
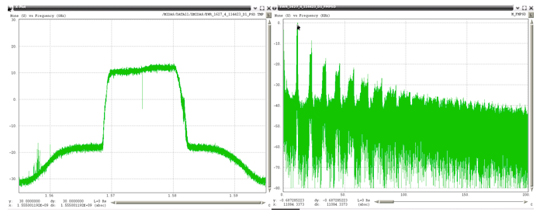
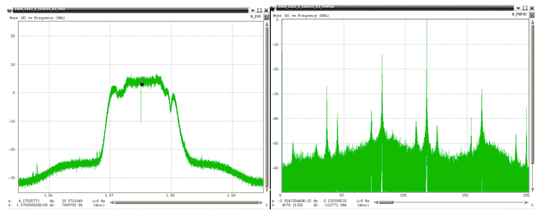
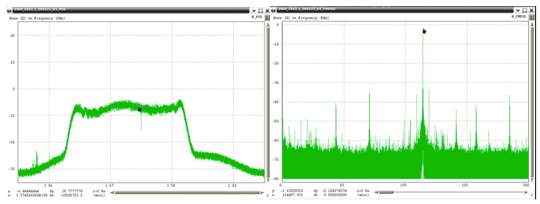
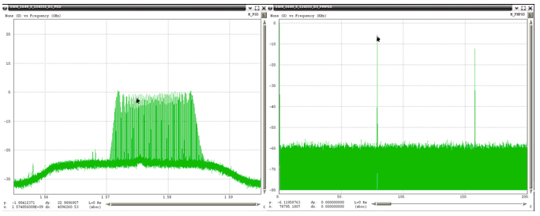
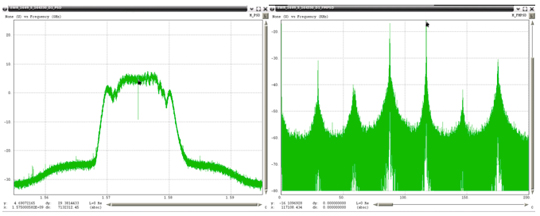
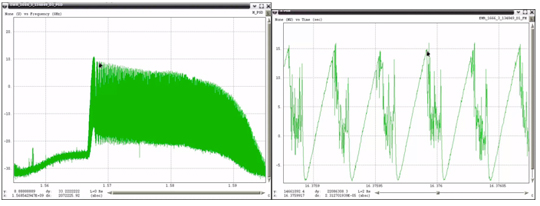
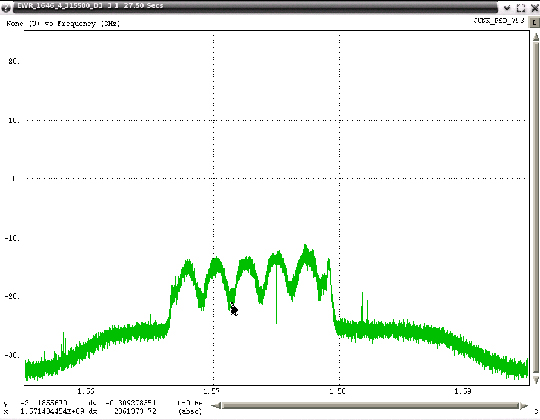
However, there also were five RFI events that spanned more than 15 MHz across L1 (Figure 1) were present as long as 20 seconds and at a power level as much as 25 dB above the receive antenna’s noise floor. Some of these RFI events were strong enough to reduce a WAAS G-II receiver C/N0 by as much as 20 dB and thereby resulted in loss of tracking for lower-elevation GPS satellites. Higher-elevation GPS satellites were able to continue tracking throughout these events but at a lower C/N0. The wideband RFI events were also detected by the SLS 4000 GBAS monitor and coincided with tracking problems in the LAAS GBAS receivers.
FIGURE 1. EWR wideband RFI.
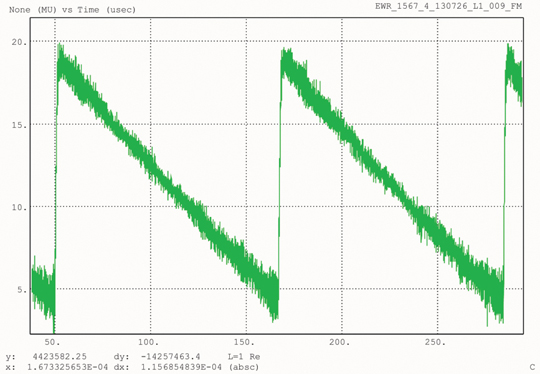
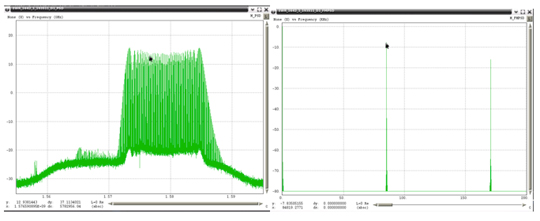
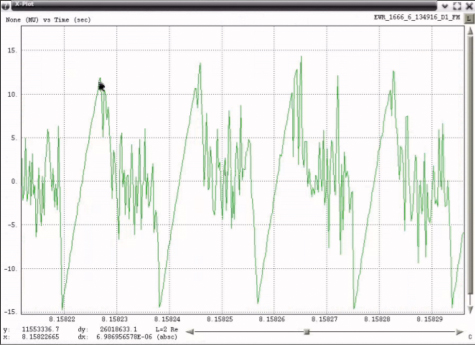
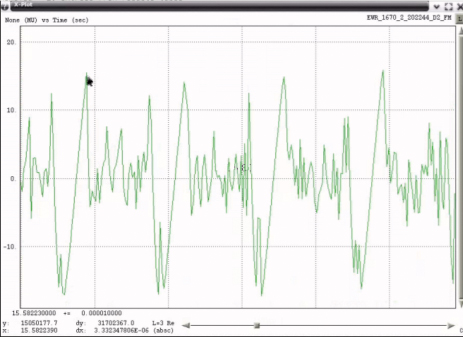
Two of the captured broadband RFI events were demodulated and analyzed. The underlying linear frequency modulation (FM) signal swept over more than 15 MHz in less than 1 millisecond (Figure 2).
FIGURE 2. FM demodulated wideband RFI.
At that time, it was not known if the source of the RFI was stationary or moving, whether it was unintentional (emanating from a licensed transmitter but with malfunctioning electronics), inadvertent (equipment normally used for test purposes and capable of operating in the GPS band but accidentally left on), or intentional (purposeful jamming of GPS).
Since the RFI was observed by GPS receivers separated by 1,700 meters, a search was undertaken to identify any other GPS receivers in the vicinity of EWR. One National Geodetic Survey (NGS) continuously operating reference site (CORS) NJI2 is located near EWR about 4,500 meters northwest from Building 80. Analysis of data from NJI2 during the same time periods that RFI was detected by the WAAS and LAAS receivers did not contain any indication of RFI, and therefore suggested that the source of RFI was more localized to EWR.
The Snapshot System remained in place for approximately two weeks before moving to another location. Collected data was analyzed, showing that wideband RFI was associated with significant degradation to both the WAAS and LAAS receivers. Additional characteristics noted the RFI was intermittent, lasting typically 30 seconds but no more than 60 seconds, was observed more often Monday through Friday, and most frequently around 8 a.m. local time.
Locating The RFI
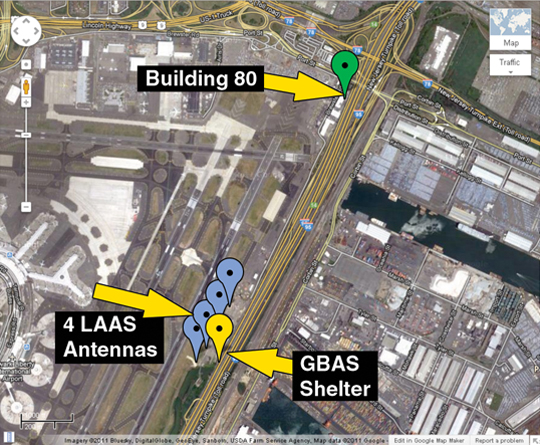
Figure 3 shows a Google map of EWR with blue dots indicating the location of the four LAAS antennas, a green dot for Building 80, and a yellow dot for the GBAS shelter. EWR is adjacent to the New Jersey Turnpike (NJT), which has seven southbound and seven northbound lanes of traffic.
FIGURE 3 Google map of EWR.
Since the Snaphsot System did not include location capability, other teams with direction-finding equipment, including beam-forming antennas, travelled to EWR to try to locate the RFI source. These teams were on site at various times from February to March. However, those efforts did not provide sufficiently reliable information to reduce the search area. By mid-March, the search area remained identical to that of January.
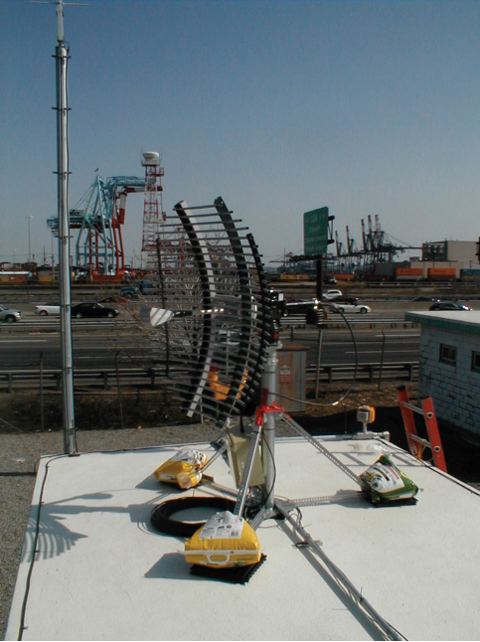
Zeta then deployed two WAAS G-II receivers separated by considerable distance (1,722 meters) to monitor for RFI, and analyze each receiver’s response only when RFI sufficient to significantly degrade GPS reception was detected. One receiver was located within Building 80, and the second receiver within the GBAS shelter near the LAAS antennas. This configuration was designed to determine degradation relative to each reference receiver and thereby establish probable search areas for the RFI emitter. The Zeta equipment also incorporated a rotating directional antenna (at the GBAS shelter shown in Figure 4) that was commanded to rotate only when significant RFI was detected.
FIGURE 4A. Antennas on roof of GBAS shelter.FIGURE 4B. Antennas on roof of GBAS shelter.
The expectation was that RFI would be detected simultaneously by both GPS receivers, and that the relative degradation in normalized C/ N0 would provide an indication as to which location lay in closer proximity to the RFI source. The rotating high-gain directional antenna would then indicate a reduced probable search area consistent with the relative degradation between the two receivers. At the time this equipment was deployed, it was still thought that the RFI was most likely stationary and high-power. However, the measurement results were quite different than expected. Subsequent data analysis from this equipment revealed that the RFI was low-power and moving, specifically moving along the NJT.
The Zeta equipment was deployed on March 19, 2010, and remained in place while operating automatically. On March 25, data collected during the previous week were analyzed. During this 1-week collection there were 11 instances when both receivers detected wideband RFI events and one antenna rotation even partially tracked one wideband RFI emitter. Such data was indicative of a non-stationary emitter, a finding that was quite significant. Based on data from the two receivers, the apparent velocity of the RFI emitters ranged between 45 miles per hour (mph) to 72 mph. Initial analysis of antenna-rotation data also indicated the RFI source was east of the GBAS shelter and moving south on the NJT.
Understanding the importance of degradations from both receivers was crucial in determining that the RFI has attributes of transmitting at low power and is moving. Had a single stationary RFI emitter been responsible for these observations, the degradations measured at each receiver would have occurred at essentially the same time, not 50 to 80 seconds apart. A high-power moving RFI emitter would also have produced degradations at both receivers at the same time, and since that was not observed, the conclusion was that the RFI emitter was relatively low in output power. Low-power RFI emitters will cause significant degradation to GPS receivers only when they are in close proximity to them, on the order of hundreds of meters.
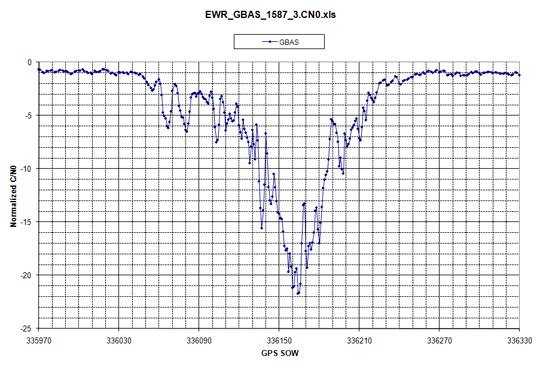
Receiver data logs were processed specifically for degradation in normalized C/N0. Normalized C/N0 was only computed for those satellites above 20 degrees, and all of those results were averaged together. Prior knowledge regarding WAAS PCTEL antennas has established an expected C/N0 versus satellite elevation that is accurate to approximately ±1 dB with a nominal mean of 0 dB. This normalized C/N0 represents an average of all satellites in view. However, individual satellite signal strength can vary greater than ± 1 dB. Significant deviations of more than –3 dB are indicative of strong RFI within the GPS processing band. Normalized C/N0 was plotted for each day that data was collected, followed by expanding those time periods where significant degradation was present.
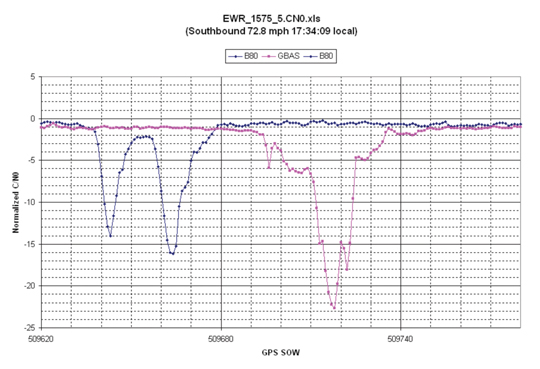
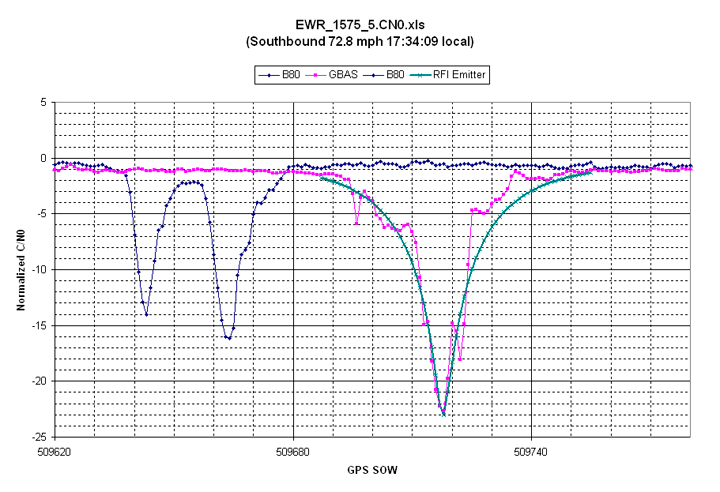
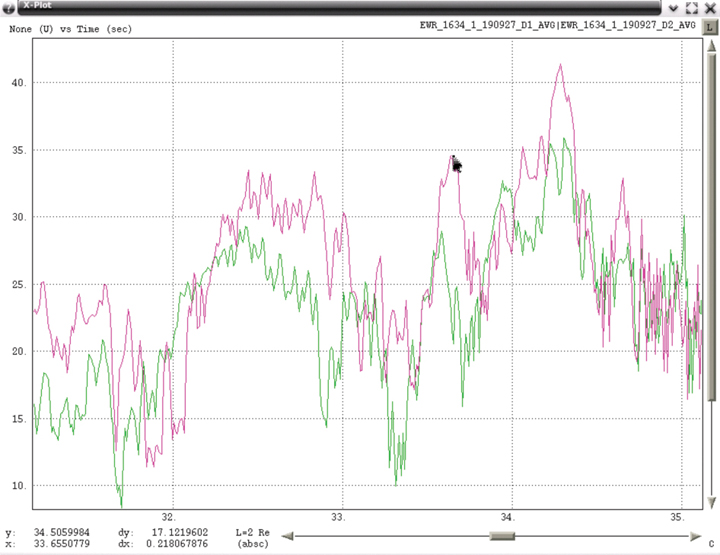
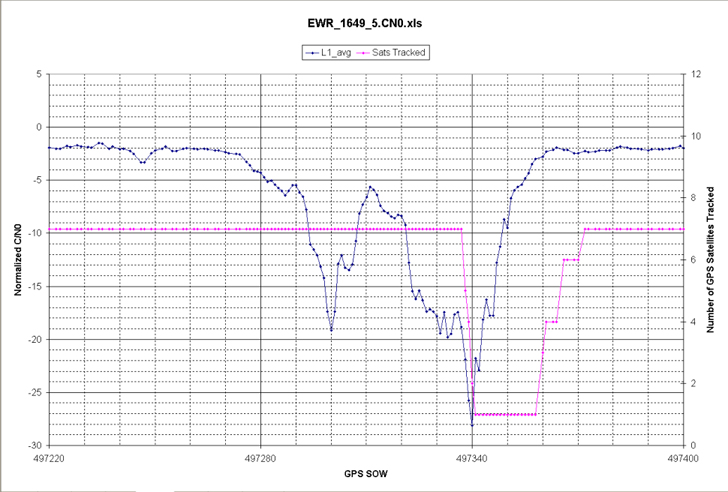
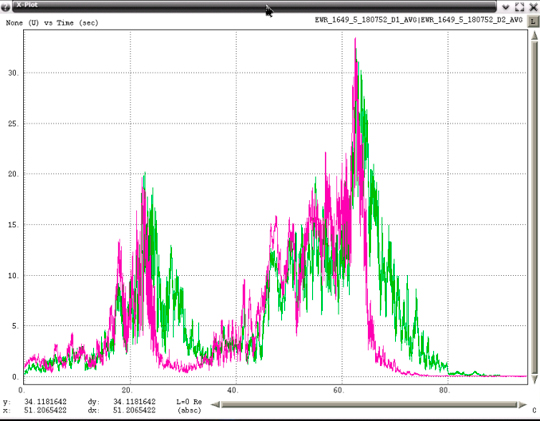
Figure 5 shows data of the first evidence of a low-power moving PPD. Data for Building 80 receiver is in blue and data from the GBAS shelter receiver in pink. Since Building 80 is north of the GBAS shelter, when degradations occurred first at Building 80, this implies that the RFI emitter is moving from north to south. Similarly, when degradations were first seen at the GBAS shelter, the RFI emitter was moving from south to north. This plot uses major time grids of 60 seconds and minor grids of 10 seconds.
FIGURE 5. Normalized C/N0 observed at Building 80 and GBAS shelter.
The double separate degradations observed by the Building 80 receiver have only been observed from monitoring equipment located at that building, and have since been associated with travel paths of PPDs on the nearby highways. Both GPS receiver and spectral data contain this same characteristic. This characteristic is due to the fact that vehicles traveling south on the NJT have clear line of sight to the roof of Building 80 (shown by Figure 6) before they travel under Interstate 78, after which they pass next to Building 80. During the time that they are under Interstate 78, their transmissions are blocked in the direction of the roof of Building 80.
FIGURE 6A. View of NJT near Building 80.FIGURE 6B. View of NJT near Building 80.
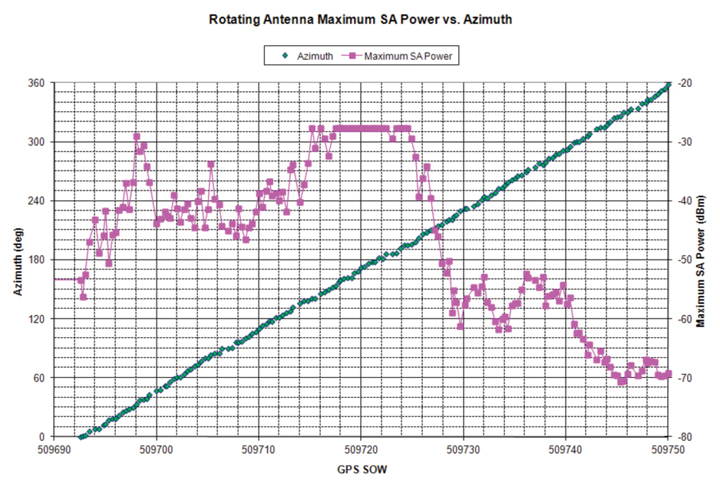
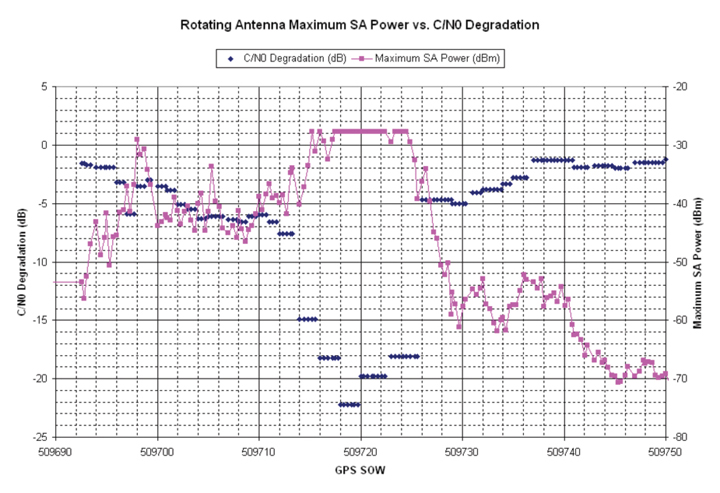
Spectral data as observed by the 4-foot reflector is shown in Figure 7. Figure 8 shows spectral maximum data as collected by the 4-foot linearly polarized reflector along with additional information.
FIGURE 7. Wideband RFI observed by 4-foot reflector (click to enlarge.)FIGURE 8A. Pink represents spectral maximum data as observed through the reflector, green represents the azimuth of that antenna, and blue the reported degradation of the GBAS shelter receiver.FIGURE 8B. Pink represents spectral maximum data as observed through the reflector, green represents the azimuth of that antenna, and blue the reported degradation of the GBAS shelter receiver.
When the GBAS shelter receiver at first detected RFI, the reflector began rotating from an azimuth of 0 degrees in a clockwise direction. At the same time, a spectrum analyzer began capturing spectra at a rate of 3 per second. The first spectral maximum was observed at an azimuth of 30 degrees, a direction in which the antenna was pointed towards the NJT, to a location approximately 900 meters away from the GBAS shelter. The next time spectra were at high levels occurred for azimuths between 145 to 195 degrees, or southeast of the GBAS shelter. The approach of using a rotating antenna was originally intended to provide a direction towards a stationary source and not to track a moving emitter. However, it appears that to some extent, the rotating antenna in fact did track a moving emitter from north to south.
On the afternoon of the day these results were communicated to the FAA lead for the EWR RFI investigation, all search activities were shifted to the NJT and away from the airport operating area. Just south of the GBAS shelter there is an official-use overpass that straddles the NJT. All detection equipment was positioned onto the overpass, under the hypothesis that the RFI was emanating from vehicles traveling the NJT. Evidence substantiating this initial finding was found within a day, and approximately one month later a concerted effort was undertaken to identify and stop a single vehicle that was using a PPD.
The Zeta equipment remained in place for many months and continued to provide additional evidence of PPD characteristics. Early in the investigation it was hoped that only a few PPDs had been responsible, but as more data was collected it became evident that many different types of PPDs were traveling along the NJT past EWR.
Modeling PPD Effect
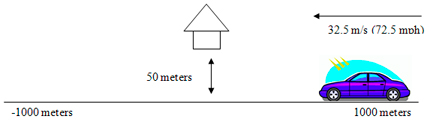
Once it was realized that the RFI was from low power moving emitters, a simple model was used to predict their degradation effect on WAAS GPS receivers. The model shown in Figure 9 was used for the purpose of computing distance between the RFI emitter and a WAAS antenna and to then compute the additional level of interference noise power that the WAAS antenna would receive. Here, the WAAS PCTEL antenna is located 50 meters from a road that is 2000 meters long and straight and has an RFI emitter transmitting +25 dBm, moving at 32.5 meters per second (72.5 mph) and with clear line of sight to the WAAS antenna.
FIGURE 9. Simple model of moving emitter.FIGURE 10. Model of normalized C/No due to a PPD.
With these assumptions it is a simple matter to compute the additional noise power at the WAAS antenna. Non-coherent summation of the RFI noise and inherent system noise was used to compute the total noise power and therefore the additional degradation in C/N0. The resulting predicted degradation was overlaid on one of the actual RFI events and is shown as a green line in Figure 10. The predicted degradation closely resembles actual event data logged by receivers.
The shape of degradation in normalized C/N0 versus time has been observed in nearly all of the EWR RFI events that have been analyzed. The magnitude of degradation depends on the power of the RFI and its proximity to the GPS antenna, while its time duration depends on the velocity of the vehicle carrying the PPD. The shape is directly related to the distance versus time between the vehicle and the WAAS antenna. Faster/slower moving vehicles with PPDs will simply shrink/stretch the time scale. Curved roadways would have different shapes that could also be readily predicted.
CORS data was revisited after realizing that PPDs were traveling the NJT. Specifically, two CORS sites CTDA (70 meters from Interstate 95) and NJDY (380 meters from Interstate 95) were identified. Data from those two sites were analyzed for a couple of weekdays. Possible evidence of PPDs was found within that data. Reported Signal to Noise Ratio (SNR) from CTDA and NJDY contained variations similar to those observed by GPS receivers at EWR during times when PPD induced RFI has been detected.
Continued RFI Monitoring
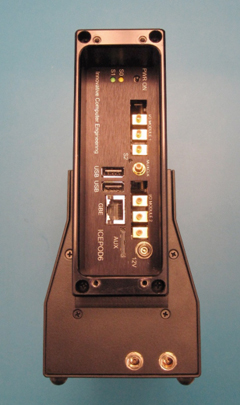
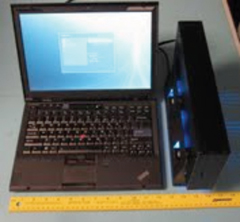
The LAAS program desired continued monitoring of RFI from PPDs near EWR, including estimates of their effective isotropic radiated power (EIRP). Additional equipment was assembled to provide this capability and installed on March 3, 2011. This monitoring equipment is located within the GBAS shelter at EWR and comprises several COTS components that incorporate improvements beyond the first Snapshot System used at EWR. Improvements include an upgraded Snapshot System (Figure 11), an RHCP directional antenna, and a wireless modem that provides remote access to the monitoring equipment.
Figure 11A. Snapshot System ICEPOD6-M5.FIGURE 11B. Snapshot System laptop.
Remote access makes it possible to analyze captured RFI data from any computer connected to the Internet, and to modify software if necessary. The new equipment configuration, specifically the use of an AEL AST 1507AA RHCP antenna, was chosen with the explicit purpose of establishing more accuracy in estimated EIRP.
Analysis of data collected during 2010 indicated three significant sources of error in estimating EIRP; Free Space Loss (FSL) from not knowing the exact position of the PPD on the NJT, polarization mismatch loss between the PPD antenna and the receive antenna, and the effects due to transmission from within a vehicle. Differences in FSL loss between the closest southbound lane on the NJT and the most distant northbound lane is on the order of 11 dB. If it is known that the PPD is traveling south, the difference in FSL between the nearest to farthest southbound lanes is less but still about 6 dB. FSL differences for northbound lanes are smaller, on the order of 3 dB. Knowing the direction of travel reduces this uncertainty but does not eliminate it. The WAAS PCTEL antenna is RHCP, but at the horizon has an axial ratio of approximately 5 dB. Many PPDs appear to be using quarter wavelength dipole antenna that are mounted with a rotatable connector. Assuming all PPD antennas are linearly polarized, there would then be an uncertainty of about 5 dB when using data observed by the WAAS PCTEL antenna. The AEL antenna has an axial ratio of 0.2 dB at L1 and significantly reduces uncertainty of polarization mismatch loss. Even though the AEL antenna has a 3 dB mismatch loss, that loss has an uncertainty of 0.2 dB for any orientation of the PPD antenna. The PCTEL antenna has a symmetric gain response relative to the NJT. The AEL antenna was pointed to the north intentionally so that observed RFI power will be stronger when a PPD is north of the GBAS shelter. Simultaneous capture of real time samples from both antennas by the ICEPOD6-M5 provides an indication of the direction in which the PPD is traveling. The third uncertainty comes from the effects of the PPD being located within a vehicle. Vehicular effects on the PPD transmitters were not accounted for due to difficulty in using a simple model. Aloi [1] has measured vehicular effects of quarter wavelength dipole antenna (typically used by PPDs) and has previously published [1] [2] on the effect of vehicles on GPS signals. His most recent findings have not yet been published but indicate that the type of vehicle, the location of a dipole antenna within it, and the position outside of the vehicle from which power is being measured, can lead to significant variation (10 to 15 dB) of the observable power. Consequently, the reported EIRP estimates from the Snapshot System have been referenced to a point just outside the vehicle and do not attempt to account for vehicular effects.
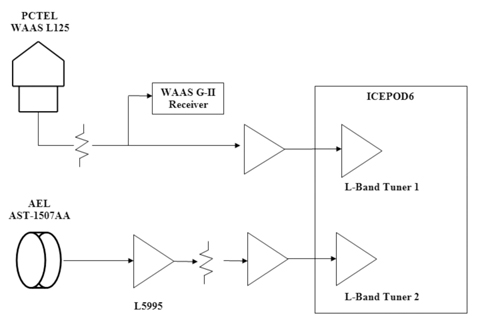
Figure 12 shows a block diagram of the current monitoring equipment. The PCTEL antenna along with the WAAS G-II receiver is used for monitoring GPS signals. WAAS G-II receiver logs are monitored continuously and saved to disk, but snapshots are only taken if the RFI algorithms indicate that RFI is present. A snapshot will be taken if any of three tests (based on AGC, normalized C/N0, or spectral power) are exceeded. Narrowband RFI tends to most impact the AGC response, while wideband RFI tends to trigger the normalized C/N0 metric. Since the Snapshot System is also continuously monitoring the RF spectra from both antennas, an additional test checks if there are significant spectra changes.
FIGURE 12. Current Snapshot monitoring block diagram.
The AEL antenna is connected to a filter/low noise amplifier (LNA) (Delta Microwave L5995) identical to those within the PCTEL antenna, before it is connected to one of the two L-band tuners (900 to 2200 MHz) of the ICE-Online ICEPOD6-M5, which includes 1 TB of long-term storage and 8 GB of high-speed RAM and is capable of sustained data transfers of as high as 400 MB/s between the L-band tuners and disk. Sample rates and RF filtering are programmable and have been set to use a complex sample rate of 40 MSPS and an RF bandwidth of 30 MHz. When RFI is present, data transfers are 320 MB/s. The internal 1 TB disk can store approximately 100 minutes of RFI. Software parameters limit RFI data capture for any single event to no more than 90 seconds. Implementation of a circular buffer within the high-speed RAM (8 seconds for each L-band tuner path) allows continuous capture of RF data while waiting for a trigger indicating that RFI is present. To reduce false alarms, RFI must be present for at least 4 seconds before data is captured. However, no RFI data is lost, because the circular buffer is longer than 4 seconds. RFI data captures typically contain 3 seconds of data at the beginning, with no RFI, and therefore make it possible to observe the onset of the RFI.
The new equipment has captured hundreds of RFI events, spanning a wide range in bandwidth (7 MHz to an estimated 150 MHz), chirp rate (9 kHz to 170 kHz), and power levels (–10 dBm to as much as +20 dBm). Accurately estimating EIRP of moving emitters is a challenge and requires detailed knowledge of the characteristics of all components used in generating the estimate. Furthermore, distance to the RFI source can only be inferred, since its movement precludes exact measurement, and consequently there will always be some uncertainty in any reported EIRP. However, even with these qualifications, there is evidence from Snapshot System data that some of the RFI sources are transmitting at power levels as much as +20 dBm.
Modeling Antenna Responses
The use and orientation of the two antennas was chosen to determine the direction that PPDs are traveling and thereby reduce some of the uncertainty with respect to their exact location. Figure 13 shows the direction (58 degrees) in which the AEL antenna is pointed.
FIGURE 13. Pointing direction of the AEL antenna.
The combination of its beam width (70 degrees) and axial ratio (0.2 dB) results in a nearly uniform gain across all lanes north of the GBAS shelter. Although FSL still depends on the exact location of the PPD, this approach does reduce many of the uncertainties associated with estimating EIRP. Since the PCTEL antenna has an omnidirectional pattern it will have a symmetrical response.
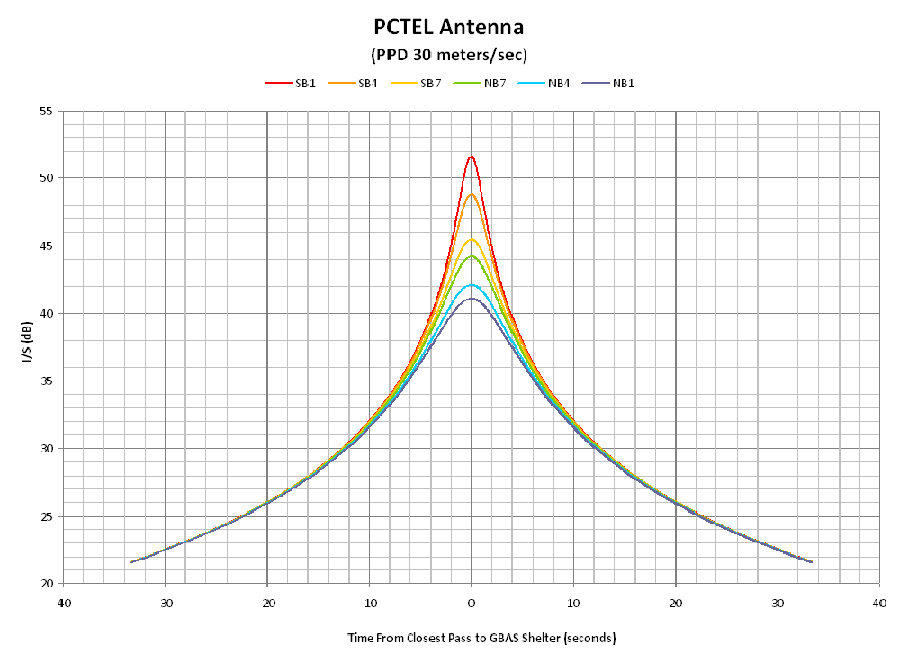
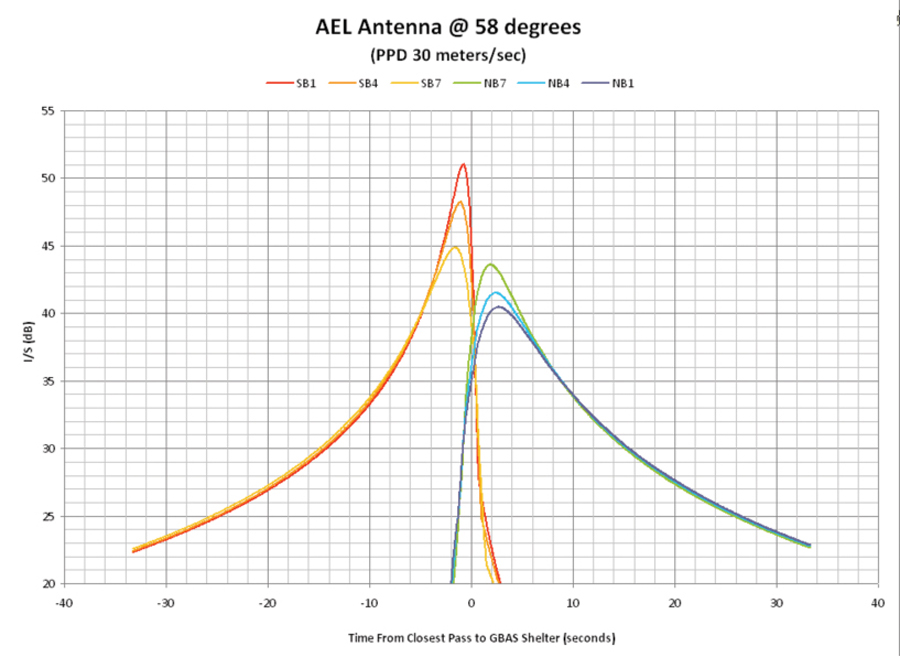
To determine the time that maximum PPD power would be observed by each antenna, a model was used that assumed the PPD was transmitting at constant power, with fixed polarization, travelling at a constant velocity, and there were no obstacles between the transmitter and each antenna. FSL was calculated for each second of travel and used to determine the magnitude of RFI power that would be received. This value was then used to calculate a nominal Interference to Signal (I/S) relative to the GPS signal. The distance between each antenna and each of the travel lanes on the NJT were also used. The intent of this model was to understand how I/S would vary with time for each of the NJT travel lanes. Figure 14 shows the predicted I/S for the PCTEL antenna and Figure 15 for the AEL antenna. In each of these plots red, yellow and orange represent 3 of the 7 south bound travel lanes and green, blue and purple represent 3 of the 7 north bound travel lanes. A time of 0 was used for the time when the PPD is nearest physically to the GBAS shelter. A nominal velocity of 30 meters/second (67 MPH) was used for the PPD and I/S was computed for 30 seconds before and after its closest approach (± 900 meters north and south of the GBAS shelter). If the PPD travels slower than 30 m/s then the following curves would be wider for the same times. Similarly, if the PPD travels faster, these same curves would be narrower.
FIGURE 14. Predicted I/S for PCTEL antenna (click to enlarge.)FIGURE 15. Predicted I/S for AEL AST-1507AA (click to enlarge.)
Modeling of the AEL antenna took into account its pattern and orientation. It has less gain towards the south, and consequently observed power from a PPD located south of the GBAS shelter is much less. A southbound PPD will initially be within the main beam of the AEL antenna; therefore the expected interference to signal ratio (I/S) will gradually increase until it passes to the south of the GBAS shelter. Similarly, a northbound PPD will not exhibit significant I/S until north of the GBAS shelter. Figure 15 indicates that the maximum I/S occurs within 2 seconds of the point where the PPD is closest to the GBAS shelter. Typical GPS receivers can tolerate an I/S of 30 dB for CW type signals.
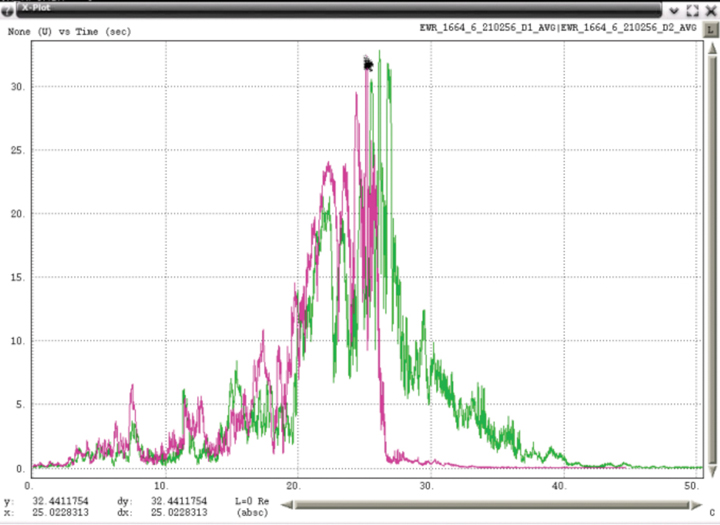
Processed RFI data does display some of these characteristics but with some important differences. PPD power was measured once every millisecond using Snapshot System data and total power within the bandwidth of that PPD was calculated. Total power from both the PCTEL (green) and AEL (pink) antennas were then plotted together with one example for a southbound PPD in Figure 16 and a northbound PPD in Figure 17.
FIGURE 16. RFI Power of southbound PPD (click to enlarge.)FIGURE 17. RFI Power of northbound PPD (click to enlarge.)
Although the envelope of the measured average power tends to have the shape that modeling predicts, there are significant variations over short periods of time. Figure 18 expands a portion of one example and indicates that RFI power varied by more than 17 dB in 0.2 seconds. Examination of spectral data for time intervals of less than one second frequently contains significant changes in observable power. Swept CW from PPDs should exhibit relatively flat RF spectral power, but typical observed spectra include sloping across the band and notches. Possible explanations for these observations include: blockage and diffraction from other vehicles near the one containing the PPD, multipath from other vehicles on the NJT, and the effect of transmitting from within a vehicle. Although some of the snapshot captures exhibit smooth power variation similar to predicted, the vast majority of the hundreds of snapshots exhibit significant variations in power.
FIGURE 18. RFI Power of southbound PPD (expanded).
Examples of Observed PPDs
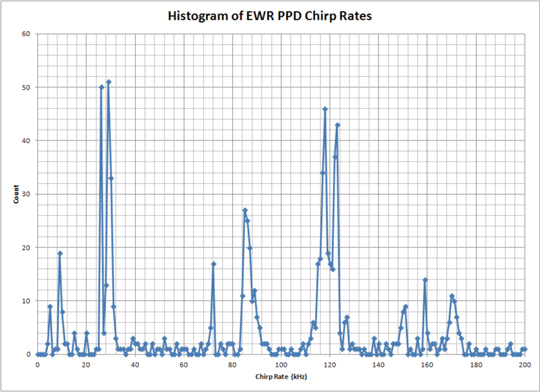
The variety of PPDs observed by the updated EWR monitoring equipment has been surprising. Within its first month of operation, more than 40 PPDs were observed with no less than 19 from unique and different PPD transmitters. Classification of PPD transmitters is based on the combination of RF spectra and the spectrum of the FM demodulated data. Although the observed PPD transmitters use a linearly swept FM sawtooth, most contain deviations from a pure linear sweep. Figure 19 shows examples of FM demodulated time series. Rather than attempting to uniquely describe the attributes of each type of deviation, it is simpler to compute the spectrum of the FM demodulated data. The fundamental frequencies of chirp rates that have been observed have spanned 9 kHz to 170 kHz. Figure 20 shows a histogram of chirp rates observed near EWR and indicates that the most frequent rates have been 9, 26, 29, 72, 85, 118, 123, 159 and 170 kHz.
FIGURE 20. Histogram of EWR PPD chirp rates.
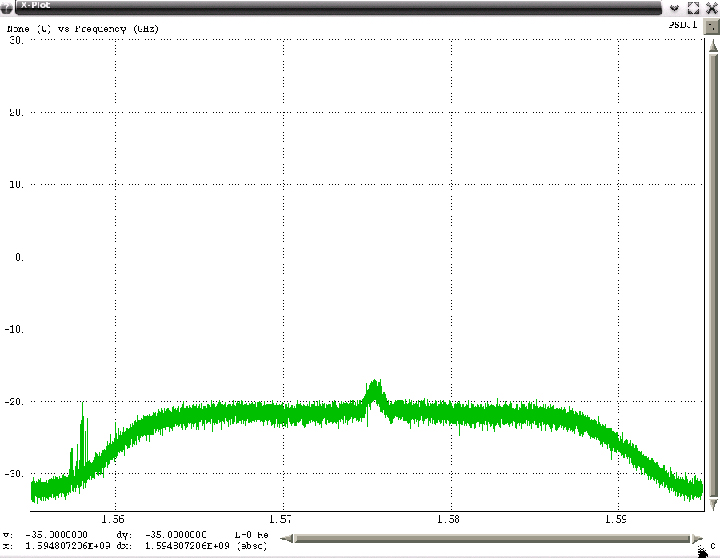
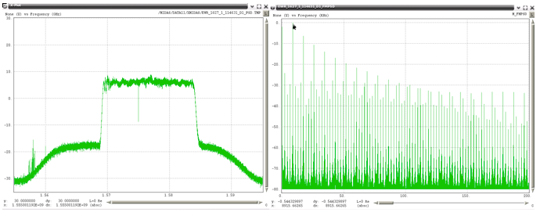
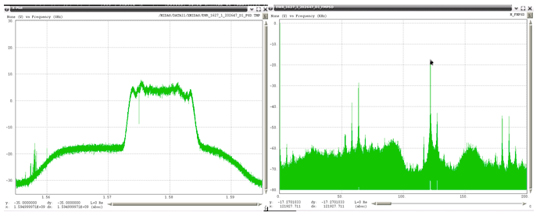
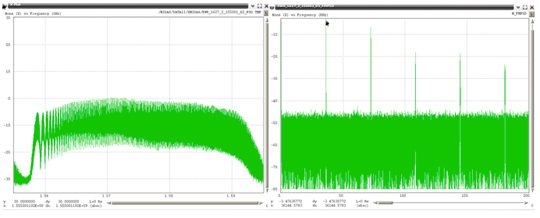
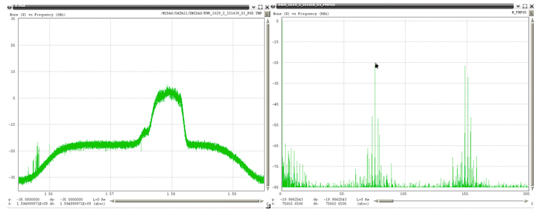
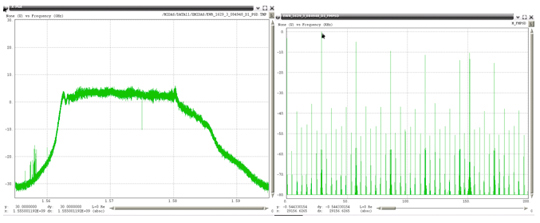
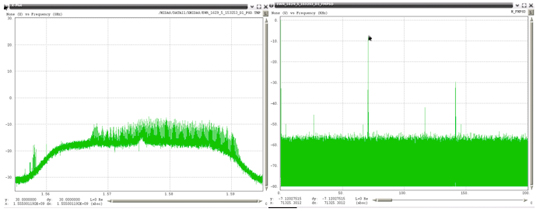
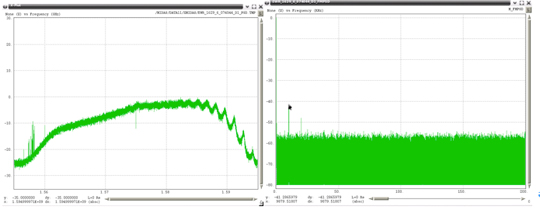
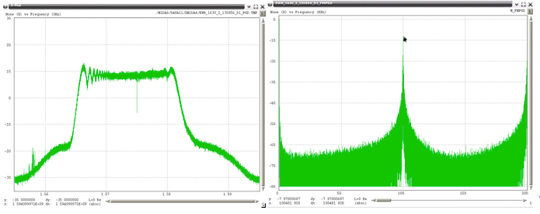
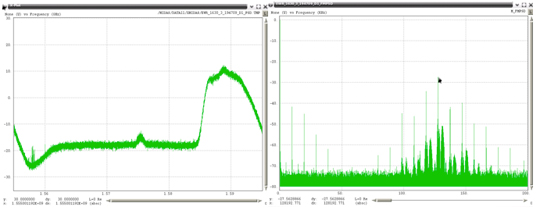
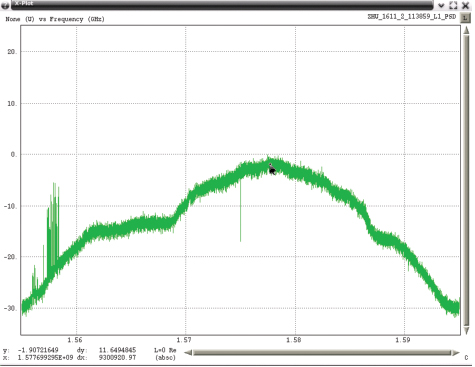
Examples of the 19 unique PPDs (detected within one month) are shown in Figure 22 through Figure 40, with the RF spectrum shown on the left, and the spectrum of the FM demodulated shown on the right. In each of these plots the scaling for the RF spectra is identical, spanning 40 MHz centered on 1575 MHz with a vertical scale using 10 dB per grid. All of the FM demodulated spectra use a horizontal axis that spans 0 to 200 kHz. For references purposes Figure 21 shows the RF spectra when no RFI is present.
Some of these PPDs were transmitting at power levels (observed by the PCTEL antenna) as much as 40 dB above the LNA noise floor. Most spectra were not centered symmetrically about L1 with some completely outside the mainlobe of the GPS C/A code. A few were transmitting outside the programmed 40 MHz bandwidth of the Snapshot System (1555 to 1595 MHz). For those PPDs transmitting outside this band, estimates were made of the upper or lower frequencies using the linear slope of the FM demodulated data, and then extrapolating that slope based on the chirp interval.
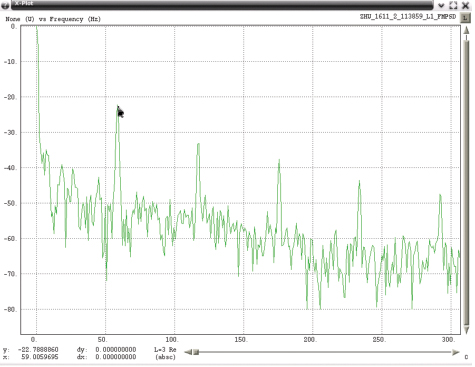
Some of the FM demodulated spectra contain a single spectral line that indicates the waveform modulating the RF has a very linear sweep. Most contain additional harmonic lines about the major component and a few appear to have bandwidth about their main spectral component. The current hypothesis is that many of these devices are poorly shielded and that the internal oscillator used to modulate the RF is affected by other nearby signals that are then appearing at the RF output. Some of the possible sources could be circuits that are within the device itself but there is some evidence that a few of these devices are susceptible to energy external to the PPD. A Snapshot System located near Houston International Airport (ZHU) has captured data from PPDs that contain strong components at 58.7 Hz in addition to its linearly swept 97 kHz waveform. Since this frequency is sufficiently different from utility AC power sources (60 ± 0.03 Hz), it has been hypothesized the vehicle carrying that PPD, also has a power inverter. Most power inverters are specified to provide a frequency output of 60 ± 3 Hz. Figure 32 shows a spectral notch that was present at that single frequency throughout the complete capture and suggests that that particular device may have had an impedance matching problem in its transmission path.
FIGURE 21. Spectra with No RFI Observed by PCTEL (click to enlarge).FIGURE 22. 1570 to 1583 MHz, Chirp 117.35 kHz.FIGURE 23. 1556 to 1583 MHz, Chirp 28.43 kHz.FIGURE 24. 1565 to 1578 MHz, Chirp 123.13 kHz.FIGURE 25. 1568 to 1583 MHz, Chirp 111.08 kHz.FIGURE 26. 1578 to 1589 MHz, Chirp 118.07 kHz.FIGURE 27. 1568 to 1584 MHz, Chirp 8.92 kHz.FIGURE 28. 1572 to 1584 MHz, Chirp 121.93 kHz.FIGURE 29. 1557 to 1622 MHz, Chirp 36.14 kHz.FIGURE 30. 1568 to 1582 MHz, Chirp 11.08 kHz.FIGURE 31. 1570 to 1585 MHz, Chirp 85.06 kHz.FIGURE 32. 1572 to 1582 MHz, Chirp 118.07 kHz.FIGURE 33. 1529 to 1577 MHz, Chirp 39.52 kHz.FIGURE 34. 1578 to 1594 MHz, Chirp 131.33 kHz.FIGURE 35. 1575 to 1582 MHz, Chirp 75.66 kHz.FIGURE 36. 1561 to 1586 MHz, Chirp 29.16 kHz.FIGURE 37. 1568 to 1592 MHz, Chirp 71.33 kHz.FIGURE 38. 1560 to 1595 MHz, Chirp 9.88 kHz.FIGURE 39. 1564 to 1582 MHz, Chirp 100.48 kHz.FIGURE 40. 1584 to 1599 MHz, Chirp 128.20 kHz.
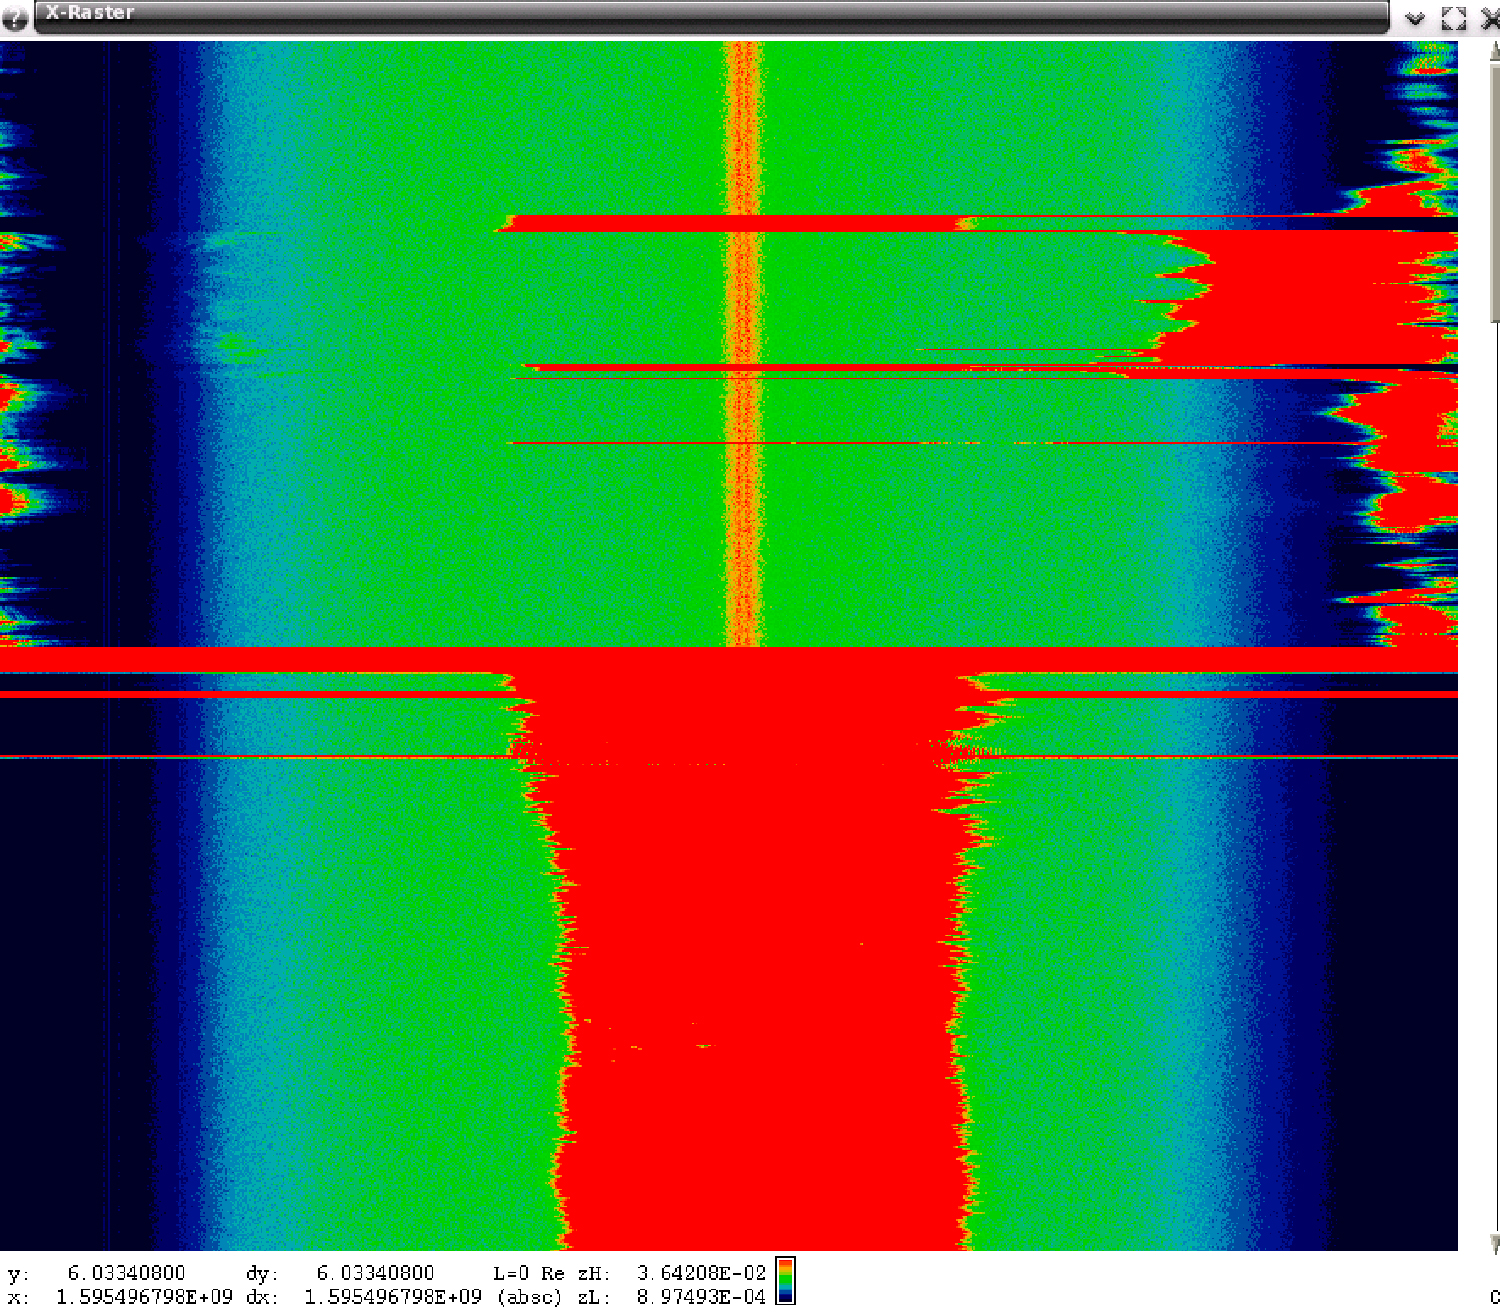
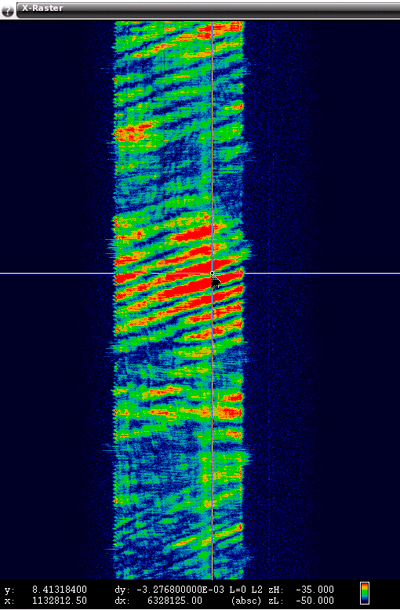
A few snapshots have also provided evidence that some of the PPDs are erratic and probably not functioning as their manufacturer intended. Figure 41 contains a raster of 6 seconds of spectral data that shows a PPD whose output was meant to be between 1560 and 1580 MHz but for short periods of time was transmitting at frequencies above 1580.
FIGURE 41. Spectral Raster, PPD with Unstable Output.
Remarks on Additional PPDs
Since April 2011 the Snapshot System has captured many additional and different PPDs. No effort has been carried out to catalog all of the different types that have been observed but the following describes interesting and notable PPDs.
Figure 42 shows characteristics of a PPD that has had estimated EIRP approaching +20 dBm, to a point just outside the vehicle, and has also been associated with GPS receiver C/N0 degradation of more than -27 dB, strong enough to cause the WAAS receiver, located at the GBAS shelter, to lose lock on all GPS satellites for a short period of time.
FIGURE 42. 1568 to 1582 MHz, Chirp 118 kHz
Figure 43 shows a PPD that is one of the most frequently observed PPDs but that has not been associated with any significant degradation to the GPS receivers. Estimated EIRP for these PPDs has been on the order of no more than +10 dBm. One device with similar characteristics was procured and its measured power at the antenna output port was no more than +14 dBm. Marketing information on the internet for that PPD specified its output power as +25 dBm.
FIGURE 43. 1572 to 1589 MHz, Chirp 85 kHz.
Figure 44 shows a PPD that is transmitting at both L1 and L2. The EWR Snapshot System has been configured to only capture snapshot data at L1 due to the fact that LAAS only uses L1. However, the WAAS receiver used to monitor for RFI is a dual frequency receiver that on occasion has indicated simultaneous RFI at both L1 and L2. Even though the EWR Snapshot System has not captured data at L2, the simultaneous presence of both L1 and L2 RFI, provides strong circumstantial evidence that this RFI source was transmitting on both frequencies. A Snapshot System monitoring the WAAS Reference Station (WRS) at Leesburg Virginia has captured simultaneous L1 and L2 RFI events. Demodulation of that data indicated the two RF outputs had similar modulation but the demodulated data was not coherent. Therefore, that PPD was probably using individual, but similar waveform generators, for each RF output.
FIGURE 44. 1562 to 1583 MHz, Chirp 114 kHz.
Almost all PPDs have been observed individually. However, there have been at least three times in the last two years when two unique PPDs have been observed within 60 seconds of each other. Figure 45 plots normalized degradation in C/N0 while Figure 46 plots snapshot measured power for the same RFI event. Analysis of snapshot data for each of the times that had strong RFI power are shown in Figure 47 and Figure 48 and confirmed that there were in fact two unique PPDs observed approximately 40 seconds apart. Both were traveling south on the NJT and approximately 1200 meters apart.
FIGURE 45. Normalized C/N0 August 19, 2011FIGURE 46. Snapshot Power August 19, 2011.FIGURE 47. C/N0 -19.0 dB, Chirp Rate 78.97 kHz.FIGURE 48. C/No -28.0 dB, Chirp Rate 117.24 kHz.
Most of the observed RFI events last for no more than 50 seconds although a few that lasted much longer have been correlated with slow traffic on the NJT. Figure 49 is from June of 2010, before the updated monitoring equipment was in place, and displays normalized degradation of C/N0. The time duration for which this RFI was observed was more than 3 minutes and was during a time when traffic was ‘slow’ on the NJT.
FIGURE 49. June 9, 2010, PPD, Estimated Velocity 10 m/s.
Very wide-bandwidth PPDs have recently been observed more often. The frequency span these devices are transmitting has had to be estimated due to the fact that the Snapshot monitor has 40 MHz of bandwidth, and these PPDs are transmitting beyond this bandwidth. Figure 50 through Figure 52 show examples of these types of PPDs. The left plot in these figures is the RF spectra and the right plot is the FM demodulated waveform. The latter each contain a linear component that is present for only a portion of the chirp interval. Under the assumption that the modulating waveform would be linear for the repetition interval, the slope of the visible linear component was extrapolated to the total chirp time interval. It is not possible to estimate the upper and lower frequency points for the last two examples, since neither of those had a frequency that began or ended within the observable 40 MHz bandwidth of the monitor.
Although the Snapshot System L-band tuners can be programmed for greater bandwidth, the limiting bandwidth is the bandpass filters contained within the LNA modules, which have bandwidths of 40 MHz.
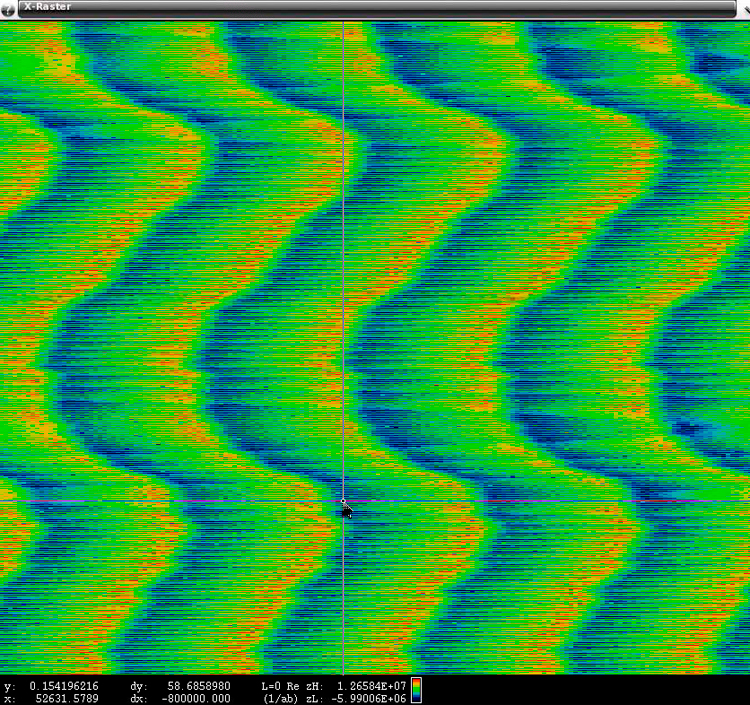
Data captured by a Snapshot System operating near ZHU contains evidence that external energy may have coupled into that PPD and affected the modulation waveform. Figure 53 shows a plot of the RF spectra and an expanded portion of the FM demodulated spectra indicating the presence of a 58.7 Hz component. A raster of the demodulated FM, shown in Figure 54, highlights the 58.7 Hertz component.
FIGURE 53A. ZHU chirp 118 kHz with 58.7 Hz.FIGURE 53B. ZHU chirp 118 kHz with 58.7 Hz.FIGURE 54. ZHU raster of FM showing 58.7 Hz (Click to enlarge).
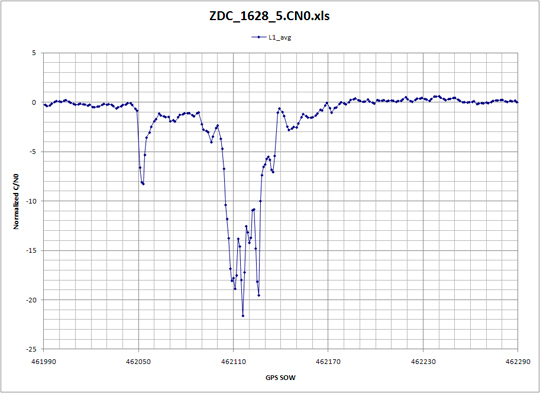
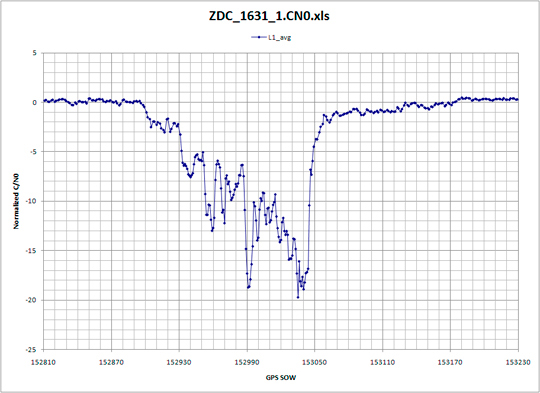
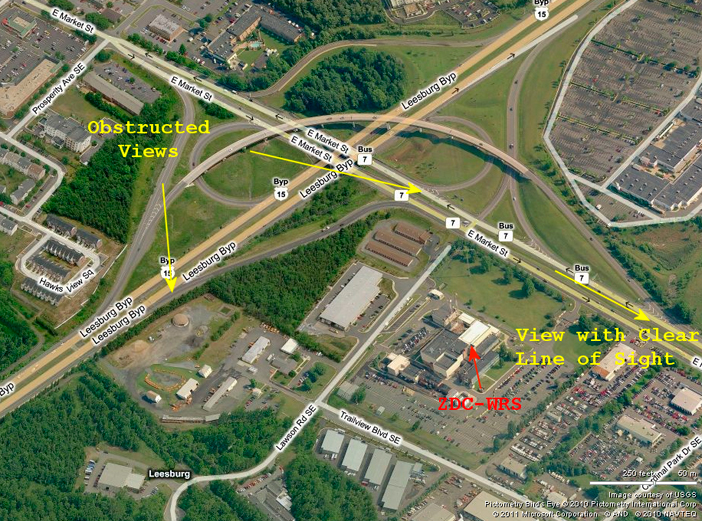
Careful analysis of normalized C/N0 has also provided clues as to the possible travel paths that a PPD might be using. RFI was suspected at the WRS located at Leesburg Virginia (ZDC). A Snapshot System was installed to detect and characterize possible RFI. Analysis of snapshot data did confirm that a few PPDs were traveling past ZDC. One of the PPDs was more disruptive than the others but fortunately was also following a very predictable schedule. It was regularly detected twice a day, first within 10 minutes of 4:30 AM local and next within 30 minutes of 2:30 PM. Normalized C/N0 contained similar patterns for each time of day and are shown in Figure 55 and Figure 56. Examination of the local roadways, shown in Figure 57, suggested the possible roads and direction in which this PPD was traveling. The WAAS antennas on the roof of ZDC have clear line of sight to state highway 7 for vehicles that are east of ZDC. Normalized C/N0 for morning events tended to have a relatively abrupt onset followed by a gradual return to normal while the afternoon events exhibited a gradual increase in degraded C/N0 followed by a quick return to normal. This observation lead to hypothesizing that the PPD was traveling east in the morning and west in the afternoon.
FIGURE 55. ZDC Typical Morning Degradation.FIGURE 56. ZDC Typical Afternoon Degradation.FIGURE 57. Roads near ZDC (click to enlarge.)
FAA Spectrum personnel were informed of this analysis and confirmed that this hypothesis was correct. Using this information they were able to detect the vehicle that was responsible and remove this particular PPD from service.
EWR RFI Event Statistics
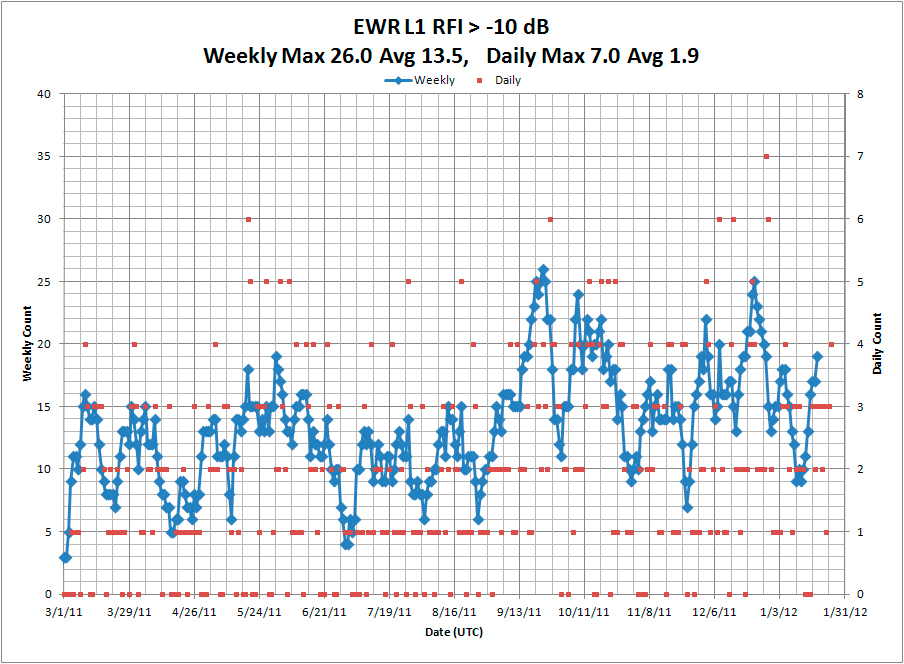
A large number of RFI events have been detected at EWR since the updated Snapshot System was installed on March 3, 2011. These RFI events have been ranked according to the magnitude of degradation in normalized C/N0, as reported by the GBAS shelter WAAS receiver. The following plots show the total number of RFI events per day (red dots) and for every seven consecutive days (blue line). On average, PPD-induced receiver degradation of at least 10 dB has been observed two times a day. Although a small number of narrowband RFI events produced receiver degradation of as much as 10 dB, the vast majority of RFI events causing 10 dB or more of receiver degradation are due to PPDs.
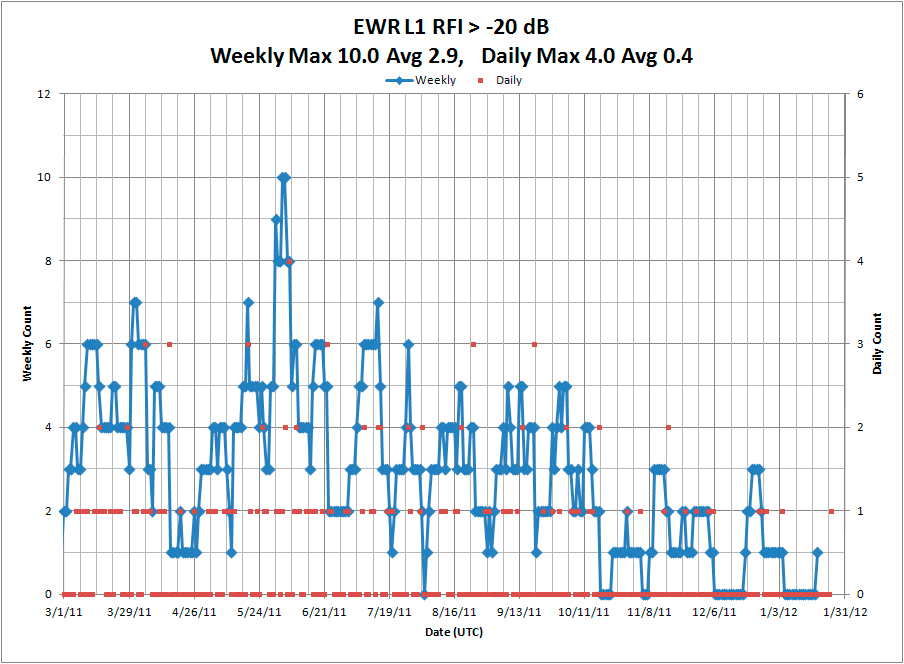
Figure 58 indicates that since March 2011, more PPD RFI events are being observed. However, Figure 60 indicates that the higher-power PPDs are not being observed as often. One possible explanation is that the previously observed PPDs have stopped working, and the individuals using them have either not acquired replacements or they have acquired different ones with less-damaging RFI.
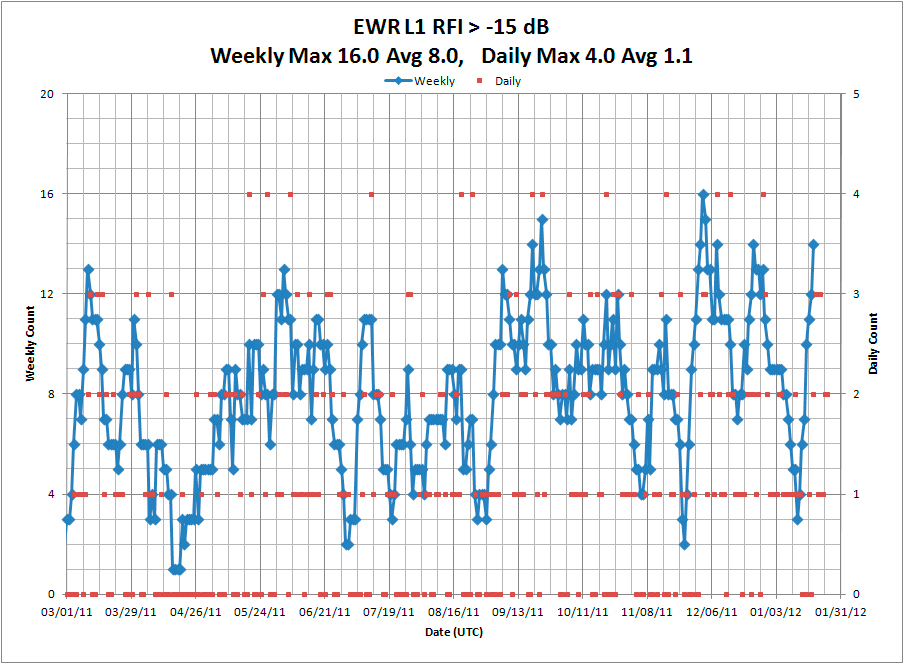
FIGURE 58. History of RFI > –10 dB (click to enlarge).FIGURE 59. History of RFI > –15 dB (click to enlarge).FIGURE 60. History of RFI > –20 dB.
Many recent PPDs have been transmitting with estimated frequency spans of 65 MHz to 140 MHz. Although the estimated EIRP of many of these very wide bandwidth PPDs has been as much as +10 dBm, their effect on GPS receiver processing has not been as damaging due to the fact that the RFI is within the GPS receiver processing bandwidth for only a portion of the time.
Spectra of Swept FM with Multipath
One of the most commonly observed characteristics in PPD spectral data has been uniformly spaced nulls as shown in Figure 61 and Figure 62. Figure 63 displays a spectral raster that shows how the nulls shift in frequency over time. Initially, there was uncertainty as to the mechanism responsible for these observations. Under the hypothesis that multipath might be responsible, a single ray multipath model was used to predict the spectral characteristics of a PPD that includes a multipath component. This analysis was pursued in the hope that it might provide additional information as to the exact location of PPDs.
The swept CW signals used by PPDs provide a useful source for characterizing multipath between the PPD and monitoring antennas. Equation (1) models observed CW that is the sum of the direct path and a single reflection in which reflected component has a path length difference of d meters.
(1)
Assuming the reflection is from a metal surface, it should experience a phase reversal. Therefore, destructive cancellation between the direct and multipath component will be present for those frequencies that have a path length difference that is an integer multiple of the wavelength. Equation (2) represents this condition.
(2)
Simplification results in the following expression.
(3)
As an example, if spectral nulls are observed at intervals of 10 MHz, then the path length difference is approximately 30 meters. Spectral nulls have been observed at frequency intervals ranging from 2 MHz to as much as 30 MHz. These null spacing’s translate to path length differences of between 150 meters to 10 meters. Multipath with a path length difference of less than 8 meters will exhibit a single null in the 40 MHz bandwidth of the Snapshot System and therefore cannot be estimated accurately using this technique. A path length difference of 8 meters is also what might be expected for two vehicles traveling side by side on interstate highways since interstate highway specifications require lanes to be approximately 4 meters wide.
Once a possible mechanism for the spectral nulls was hypothesized, additional analysis was performed on specific RFI events in which uniformly spaced spectral had been observed. Snapshot and GPS receiver data indicates the direction of travel for a PPD. With direction of travel known, it is possible to approximate the distance that the PPD is from the monitoring equipment. However, for those RFI events that were examined, the calculated path length difference was similar to or greater than the distance between the PPD and monitoring equipment. The most likely location of surfaces that would reflect the PPD transmission was other vehicles on the NJT. Had the surfaces responsible for the reflections been stationary objects nearby, then it might have been possible to hypothesize the most likely location of the PPD by combining receiver proximity and path length differences.
The magnitude of the reflection coefficient can be estimated by comparing the relative power of the spectral maximum and minimum. However the magnitude of the reflection coefficient can only be bounded since it depends on both the reflection coefficient and the relative path length difference. Since the reflected path travels farther, its magnitude will inherently be reduced, in addition to the loss from the reflection, and therefore the observed relative difference will be smaller than shown by equation (4).
(4)
For the examples shown in Figure 61 and Figure 62 the spectral max/min was on the order of 10 dB. By using 10 dB for SpectraMaxMin in equation (4), a reflection coefficient of at least 0.5 is calculated. Reflection coefficients of trucks with shipping containers will probably be much greater than 0.5 and could easily be as high as 0.9.
Direction-Finding Methods
After examining more than a thousand examples of PPDs and their effect on GPS receivers, I have concluded that any type of ground-based direction finding system intended to detect and locate low power moving PPDs over a large area using time-difference-of-arrival (TDOA) or beam forming (angle-of-arrival, AOA) techniques will face significant challenges.
Accuracy of TDOA-based location systems can be decomposed into two components: measurement accuracy, and the geometry of the equipment used to make these measurements. In 1982, Paul Chestnut calculated the relationship between accuracy and these two components, showing that geometry is a multiplicative factor. Direction-finding conceptual design typically strives to position the measurement equipment such that it surrounds the area to be monitored, if possible. For those situations where it is not possible to encircle the area, the measurement equipment will typically have a long baseline between its sensors and with a perpendicular orientation with respect to the monitored area. This strategy reduces errors due to geometry.
Measurement error depends on the observable power of the signal to be located. This component will most likely limit the ability to accurately locate low-power moving PPDs. Measurement data from GPS receivers demonstrate the ability to reliably detect the presence of these PPDs, but only when they have been within hundreds of meters. Most PPDs have been observed for 30 to at most 60 seconds. For PPDs traveling along the NJT at a velocity of 30 m/s, this time span implies that they were not detected until they were within 900 meters. Reliable detection was not demonstrated unless they were within 500 meters. This is a direct consequence of the fact that all GPS antenna are designed for hemispherical coverage for satellites above the horizon. The PPDs are at the horizon or lower relative to most GPS antenna patterns. If GPS antennas were used as part of a TDOA-based system, they would need to be positioned no further apart than approximately 600 meters. Using GPS antennas to detect and locate PPDs is inherently limited to proximity detection.
The ability to locate low-power PPDs within a larger area requires a system to be able to detect a PPD by all of its sensors simultaneously from distances much greater than 600 meters. In principal, higher-gain antennas orienting their main beam along the NJT would increase the distance over which PPDs could be detected. Even when high-gain directional antennas have been positioned along the NJT, the observed power has not followed predictions based strictly on FSL. One reason for this is that clear line-of-sight could not be achieved between the high gain antenna and the PPD. Vehicular effects might also be responsible for these observations. What is known is that the power observed by ground-based antennas has shown significant fluctuation, much greater than could be explained by FSL propagation. Ground-based direction finding systems for low-power moving PPDs must be able to simultaneously detect RFI by multiple sensors, in an environment that may at times shield the PPD from its sensors, and that also has fluctuating observable power.
The ability to observe, detect, and locate low-power moving PPDs over a large area would require a system to have its monitoring antenna located high above the NJT, and oriented to look down on the NJT and the surrounding area. Although such a system must still contend with shielding from the vehicle itself, it would be the only approach that could potentially observe these PPDs over a large area, simultaneously by all of its measurement sensors. Implementing such a concept may be expensive.
A less expensive approach might rely on proximity detection, with many sensors on the ground, each monitoring their own small area, and only report PPDs that travel close to each of them. One such approach, referred to as crowd sourcing, uses cell phones to aid in detecting and locating PPDs. Crowd sourcing is a form of proximity detection.
Summary
The first evidence of low-power moving PPDs along the NJT used two GPS receivers separated by considerable distance and then correlated their responses. This approach is only useful for detection of PPDs traveling in close proximity to the GPS receivers. Analysis of GPS receiver normalized C/N0 also provided a basis for determining if RFI might be from a moving emitter. The shape of normalized C/N0 versus time not only provides clues that the RFI source is in motion, but may even be correlated with their possible travel paths, when blockage exists between the GPS antenna and local roadways.
Autonomous operation is a necessity for detecting low-power moving PPDs, since they may be observable only a few times a day and for less than 60 seconds.
Capturing real-time samples of these intermittent RFI events determined the existence of many different types of PPDs. Almost all use some form of swept FM modulation. Analysis of their spectra and modulation indicates that many devices are probably not operating as their manufacturer intended. Modulation waveforms of PPDs have included triangle, highly linear sawtooth, sawtooth with synchronous perturbations on top of the fundamental sawtooth, and sawtooth with analog modulation. The leading hypothesis for this observation is that the devices are not shielded very well and that the internal modulator is susceptible to coupling from either other circuits within the PPD itself or from external electronic devices operating in the vicinity of the PPD.
Acknowledgments
The author thanks the FAA for support in this investigation, Rich Holley of ICE-Online for help in utilizing capabilities of the ICEPOD6-M5, and Julian Babel of the FAA Technical Center for regularly swapping external hard drives attached to the Snapshot System.
Joe Grabowski is a systems engineer at Zeta Associates where he works on a variety of GPS projects in support of the FAA, as well as communications systems and digital signal processing applications. He received an M.S.EE from Purdue University. Since 2010 he has been involved in the investigation of personal privacy device impacts on FAA SBAS and GBAS sites.
New technology and wireless carrier openness now make real-time access to telephone location information available to the enterprise with no application required on the mobile device.
Yes, that’s right: no application required! Cloud-based location, offered via direct connections to wireless operators, changes the playing field for enterprises to introduce instant operational efficiencies. Marrying location insight, privacy controls, and multi-modal communications through network application programming interfaces (APIs) provides enterprises with flexibility, cost savings, and time-to-market advantages. Whether delivering geo-targeted promotions, dispatching services, verifying worker activities, or performing other location-relevant actions, businesses now have cross-carrier access to location information for more than 85 percent of U.S. wireless subscribers — instantly!
This enables businesses to go app-less with no costly, time-consuming deployment and maintenance of handset applications. Additionally, no specialized hardware is required. Location through carrier networks also assures secure and tamper-proof delivery of the location information since no potentially hackable client software is involved in the generation or delivery of that information. It comes straight from the carrier network over secure connections.
Cloud-based deployment, such as that available through TechnoCom’s Location Platform, opens up location intelligence to all device types, including both smartphones and feature phones. This removes a huge barrier that exists with the existing smartphone-only applications and enables businesses to immediately tailor their workflows and business processes to utilize the knowledge of real-time location from a secure and dependable source. Development cycles and costs are a fraction of those required for smartphone applications, such as Droid or iPhone apps, and the adoption hurdle of user download initiation is eliminated.
Simplification of access and deployment paves the way for adoption and finally opens the floodgate for location-based services to be implemented on a large scale across all wireless networks. This is analogous to the inflection point that cross-carrier text messaging access and interoperability had on cellular text messaging adoption rates in the ’90s.
By leveraging technology similar to that in the carrier networks and proven for use in 911 emergencies, businesses instantaneously benefit when new data is exposed by wireless operators, such as device capabilities, presence, rate plan status, roaming status, and so on. Enterprises may immediately harness this insight with upgrades to their server applications and no new technology deployments required in the field. That offers businesses a huge return on investment as they integrate once and consume enhancements dynamically. Location from the cloud opens up a new, instant intelligence frontier that was not possible for businesses to leverage just last year.
This unprecedented access to location information comes with a responsibility to comply with industry-accepted privacy controls. To make this easy on enterprises that are not expert in such policies, TechnoCom Location Platform provides carrier-approved privacy management functionality, and we work hand-in-hand with our customers to ensure their implementations are in line with best practices established by CTIA.
Tapping into location from other mediums such as VoIP, Wi-Max, NFC, Wi-Fi will increase the ubiquity of cloud-based location access even further. As devices get smarter and more powerful, better communications, device intelligence, and positional awareness will catapult businesses to yet another level of efficiencies in interacting with their mobile users, workers, and assets.
Mario Proietti is co-founder and chief executive officer of TechnoCom Corporation, and a member of the Editorial Advisory Board of GPS World magazine. He has a master’s degree in electrical engineering from the University of Southern California. TechnoCom delivers cross-carrier location services to enterprises through its location platform’s web services APIs. The company also integrates location technologies into wireless networks, products, and software, and works with wireless carriers to enable E911 and location-based services.