Proteus, a provider of satellite-derived bathymetric mapping and seabed classification services, represented the mapping industry in a British trade delegation to Tripoli organized by the Libya-British Business Council (LBBC). Proteus presented potential solutions to coastal mapping challenges faced by Libya during meetings with the National Oil Corporation, Ports and Maritime Transport Authority, University of Tripoli, and Libyan Center for Remote Sensing.
“At every meeting, we were introduced to government ministers and business leaders who are eager to begin rebuilding Libya,” said Proteus CEO, David Critchley. “Libya recognizes that mapping will be the critical first step in rebuilding infrastructure across the country.”
Invited to participate by Tilden International, Proteus was the sole mapping representative in the LBBC delegation, which included British companies involved in the energy, security and computing sectors. Held in late September 2013, the delegation mission was led by Sir Dominic Asquith, former British Ambassador to Libya.
Since 2011, Proteus has been delivering offshore mapping projects for environmental, oil and gas, marine biology and other coastal zone applications in Europe, the Middle East and Caribbean, completed in a fraction of the time and cost of traditional methods. Proteus is currently engaged in a major offshore project in the Arabian Gulf, providing bathymetric and seabed classification services in the coastal zone using satellite imagery.
“Whether exporting petroleum products from its shores or bringing tourists into the country, Libya sees development of its Mediterranean shipping ports as key to future economic success,” said Critchley. “Upgrading existing ports and building new ones will require mapping the seafloor several kilometers from the coast, and that’s why Proteus was invited to join the delegation.”
Proteus uses commercially developed processes to derive bathymetric and seafloor classification information from high-resolution, 8-band multispectral imagery collected by DigitalGlobe Inc.’s WorldView-2 satellite and acquired by Proteus through its direct relationship with DigitalGlobe. Derived products have high accuracy, meeting the requirements of engineering, environmental monitoring and strategic geospatial planning applications.
“Compared with maritime sonar and airborne LiDAR, satellite-derived bathymetric surveys are completed at a fraction of the time and cost,” said Critchley. “The ecological constraints, submerged reefs, and political issues that hamper traditional hydrographic mapping methods are of no hindrance to us.”
Source: Hansen, Potapov, Moore, Hancher, et al, 2013
A multi-organizational team led by the University of Maryland has created the first high-resolution global map of forest extent, loss and gain. This free resource greatly improves the ability to understand human and naturally-induced forest changes and the local to global implications of these changes on environmental, economic and other natural and societal systems, members of the team say
According to the announcement, the team of 15 university, Google and government researchers reports a global loss of 2.3 million square kilometers (888,000 square miles) of forest between 2000 and 2012 and a gain of 800,000 square kilometers (309,000 square miles) of new forest.
Their study, published online on November 14 in the journal Science, documents the new database, including a number of key findings on global forest change. For example, the tropics were the only climate domain to exhibit a trend, with forest loss increasing by 2,101 square kilometers (811 square miles) per year. Brazil’s well-documented reduction in deforestation during the last decade was more than offset by increasing forest loss in Indonesia, Malaysia, Paraguay, Bolivia, Zambia, Angola and elsewhere.
“This is the first map of forest change that is globally consistent and locally relevant,” says University of Maryland Professor of Geographical Sciences Matthew Hansen, team leader and corresponding author on the Science paper.
“Losses or gains in forest cover shape many important aspects of an ecosystem, including climate regulation, carbon storage, biodiversity and water supplies, but until now there has not been a way to get detailed, accurate, satellite-based and readily available data on forest cover change from local to global scales,” Hansen says.
To build this first of its kind forest mapping resource, Hansen, UMD Research Associate Professor Peter Potapov and five other UMD geographical science researchers drew on the decades-long UMD experience in the use of satellite data to measure changes in forest and other types of land cover. Landsat 7 data from 1999 through 2012 were obtained from a freely available archive at the United States Geological Survey’s center for Earth Resources Observation and Science (EROS). More than 650,000 Landsat images were processed to derive the final characterization of forest extent and change.
Source: Hansen, Potapov, Moore, Hancher, et al, 2013
The analysis was made possible through collaboration with colleagues from Google Earth Engine, who implemented the models developed at UMD for characterizing the Landsat data sets. Google Earth Engine is a massively parallel technology for high-performance processing of geospatial data and houses a copy of the entire Landsat image catalog. What would have taken a single computer 15 years to perform was completed in a matter of days using Google Earth Engine computing.
Hansen and his coauthors say their mapping tool greatly improves upon existing knowledge of global forest cover by providing fine resolution (30 meter) maps that accurately and consistently quantify annual loss or gain of forest over more than a decade. This mapping database, which will be updated annually, quantifies all forest stand-replacement disturbances, whether due to logging, fire, disease or storms. And they say it is based on repeatable definitions and measurements while previous efforts at national and global assessments of forest cover have been largely dependent on countries’ self-reported estimates based on widely varying definitions and measures of forest loss and gain.
Dynamics from local to regional to global scale are quantified. For example, subtropical forests were found to have the highest rates of change, largely due to intensive forestry land uses. The disturbance rate of North American subtropical forests, located in the Southeast United States, was found to be four times that of South American rainforests during the study period; more than 31 percent of U.S. southeastern forest cover was either lost or regrown. At national scales, Paraguay, Malaysia and Cambodia were found to have the highest rates of forest loss. Paraguay was found to have the highest ratio of forest loss to gain, indicating an intensive deforestation dynamic.
The study confirms that well-documented efforts by Brazil – which has long been responsible for a majority of the world’s tropical deforestation – to reduce its rainforest clearing have had a significant effect. Brazil showed the largest decline in annual forest loss of any country, cutting annual forest loss in half, from a high of approximately 40,000 square kilometers (15,444 square miles) in 2003-2004 to 20,000 square kilometers (7,722 square miles) in 2010-2011. Indonesia had the largest increase in forest loss, more than doubling its annual loss during the study period to nearly 20,000 square kilometers (7,722 square miles) in 2011-2012.
Hansen and colleagues say the global data sets of forest change they have created contain information that can provide a “transparent, sound and consistent basis to quantify critical environmental issues,” including the causes of the mapped changes in the amount of forest; the status of world’s remaining intact natural forests; biodiversity threats from changes in forest cover; the carbon stored or emitted as a result of gains or losses in tree cover in both managed and unmanaged forests; and the effects of efforts to halt or reduce forest loss.
For example, Hansen says, that while their study shows the efforts of Brazil’s government to slow loss of rainforest have been effective, it also shows that a 2011 Indonesian government moratorium on new logging licenses was actually followed by significant increases in deforestation in 2011 and 2012.
“Brazil used Landsat data to document its deforestation trends, then used this information in its policy formulation and implementation. They also shared these data, allowing others to assess and confirm their success,” Hansen says. “Such data have not been generically available for other parts of the world. Now, with our global mapping of forest changes every nation has access to this kind of information, for their own country and the rest of the world.”
Support for Landsat data analysis and characterization was provided by the Gordon and Betty Moore Foundation, the United States Geological Survey and Google, Inc. GLAS data analysis was supported by the David and Lucile Packard Foundation. Development of all methods was supported by NASA through its Land Cover and Land Use Change, Terrestrial Ecology, Applied Sciences and Measures programs (grants NNH05ZDA001N, NNH07ZDA001N, NNX12AB43G, NNX12AC78G, NNX08AP33A and NNG06GD95G) and by the United States Agency for International Development through its CARPE program.
High-resolution global maps 21st-century forest cover change, Science, Nov. 15, 2013, Vol 342 #6160, authors M. C. Hansen, P. V. Potapov, S. A. Turubanova, A. Tyukavina, L. Chini, C. O. Justice and J. R. G. Townshend of the University of Maryland; R. Moore, M. Hancher and D. Thau of Google, Inc.; S. V. Stehman of the State University of New York; S. J. Goetz of Woods Hole Research Center; T. R. Loveland of the United States Geological Survey; and A. Kommareddy, and A. Egorov of South Dakota State University.
Esri’s releases new versions of Collector for ArcGIS and Operations Dashboard for ArcGIS include display, configuration, and workflow enhancements that improve field data collection and enterprise oversight. Both apps are available at no cost to Portal for ArcGIS customers and ArcGIS Online subscribers.
According to the announcement, Collector for ArcGIS is a configurable field data collection app for iOS and Android. The new version of Collector includes support for iPad and Android tablets. Templates, selection results, directions, and more, can now be viewed alongside the map on mobile devices with larger screen real estate. The updated Collector app also expands the types of data that can be collected. It now allows the input of GIS features of all primary shape types (e.g., points, lines, and polygons). The app also gives you the ability to view and control GPS accuracy when capturing features so you can stream positions from the GPS as you move.
Data capture often involves recording repetitive information at different locations and/or multiple features of different types at the same location. To reduce that manual repetition, Esri introduced a continuous collect mode that allows you to copy the location or attributes of the last collected feature.
Esri reports that they also updated Operations Dashboard for ArcGIS, that provides a common operational picture for monitoring, tracking, and reporting events to people within your organization. The new version of Operations Dashboard improves the way you work with data. Because you can potentially use Operations Dashboard to view extensive lists of information, Esri added the ability to search within lists to quickly find what you need. You can now see charts, graphs, custom text, and photo attachments within the pop-up windows. You can also filter the map and all widgets using relative time, such as within the last hour or month, or after a specific date. This helps you monitor and analyze data that changes rapidly over time.
Operations Dashboard for ArcGIS now fully supports Portal for ArcGIS as well as ArcGIS Online. A new configuration utility is available to Portal customers, making it easy to sign in and deploy the Operations Dashboard app on-premises.
Collector for ArcGIS can be downloaded from the Apple App Store and Google Play. Operations Dashboard is available through ArcGIS Online. Portal for ArcGIS users can access the Operations Dashboard app from the Customer Care portal.
The U.S. Department of Transportation’s Federal Aviation Administration (FAA) released its first annual Roadmap outlining efforts needed to safely integrate unmanned aircraft systems (UAS) into the nation’s airspace. The Roadmap addresses current and future policies, regulations, technologies and procedures that will be required as demand moves the country from today’s limited accommodation of UAS operations to the extensive integration of UAS into the NextGen aviation system in the future.
“Government and industry face significant challenges as unmanned aircraft move into the aviation mainstream,” said U.S. Transportation Secretary Anthony Foxx. “This Roadmap is an important step forward that will help stakeholders understand the operational goals and safety issues we need to consider when planning for the future of our airspace.”
According to the announcement, the Roadmap outlines the FAA’s approach to ensuring that widespread UAS use is safe, from the perspective of accommodation, integration, and evolution. The FAA’s main goal for integration is to establish requirements that UAS operators will have to meet in order to increase access to airspace over the next five to 10 years. The Roadmap discusses items such as new or revised regulations, policies, procedures, guidance material, training and understanding of systems and operations to support routine UAS operations.
“The FAA is committed to safe, efficient and timely integration of UAS into our airspace,” said FAA Administrator Michael Huerta. “We are dedicated to moving this exciting new technology along as quickly and safely as possible.”
The FAA reports that the Roadmap also addresses the evolution of UAS operations once all requirements and standards are in place and are routinely updated to support UAS operations as the National Airspace System evolves over time. The document stresses that the UAS community must understand the system is not static, and that many improvements are planned for the airspace system over the next 15 years.
The FAA plans to select six UAS test sites to begin work on safely integrating UAS into the airspace. These congressionally-mandated test sites will conduct critical research into how best to safely integrate UAS systems into the national airspace over the next several years and what certification and navigation requirements will need to be established.
The use of UAS, both at the designated test sites and in the national airspace generally, raises the issue of privacy and protection of civil liberties. In February, the FAA asked for public comments specifically on the draft privacy requirements for the six test sites. Today, the agency sent a final privacy policy to the FederalRegister that requires test site operators to comply with federal, state, and other laws on individual privacy protection, to have a publicly available privacy plan and a written plan for data use and retention, and to conduct an annual review of privacy practices that allows for public comment. Information about the test site selection process and final test site privacy policy is available at: http://www.faa.gov/about/initiatives/uas/
For the next several years, the FAA will continue to use special mitigations and procedures to safely accommodate limited UAS access to the nation’s airspace on a case-by-case basis. The Roadmap notes that this case-by-case accommodation will decline significantly as integration begins and expands, but will continue to be a practical way to allow flights by some UAS operators in certain circumstances.
In addition to the FAA’s Roadmap, as required in the 2012 FAA Reauthorization, the Joint Planning and Development Office (JPDO) has developed a comprehensive plan to safely accelerate the integration of civil UAS into the national airspace system.. That plan details a multi-agency approach to safe and timely UAS integration and coordination with the NextGen shift to satellite-based technologies and new procedures.
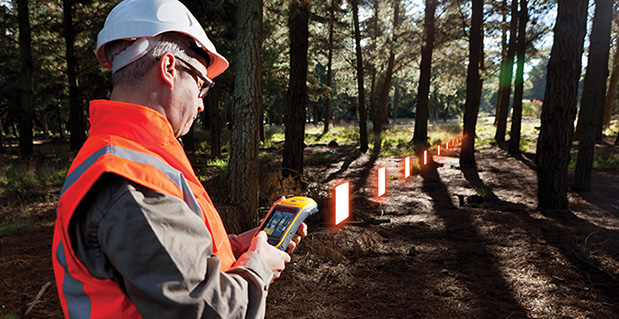
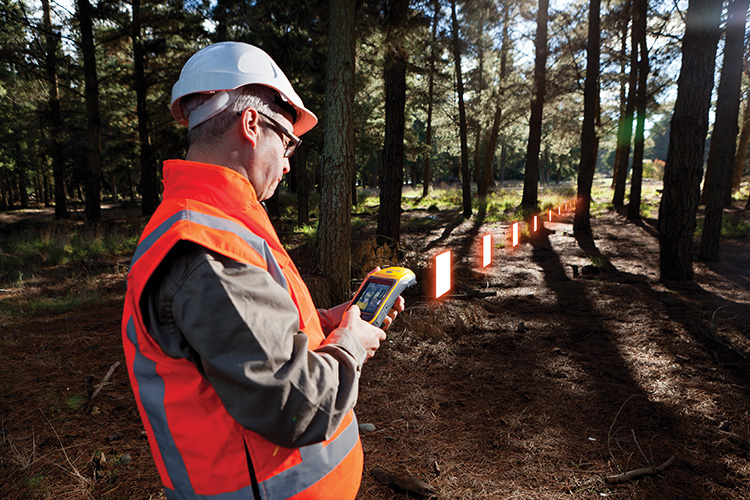
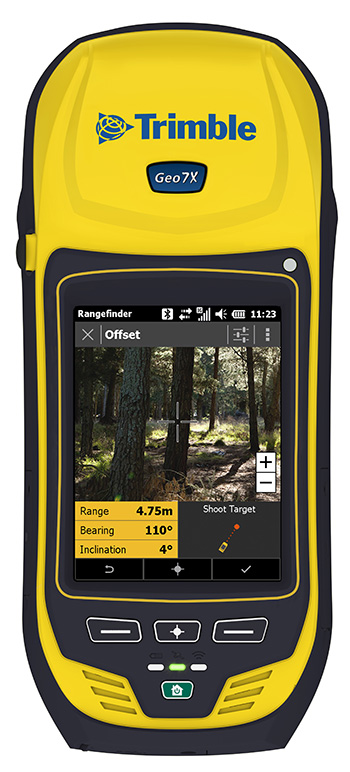
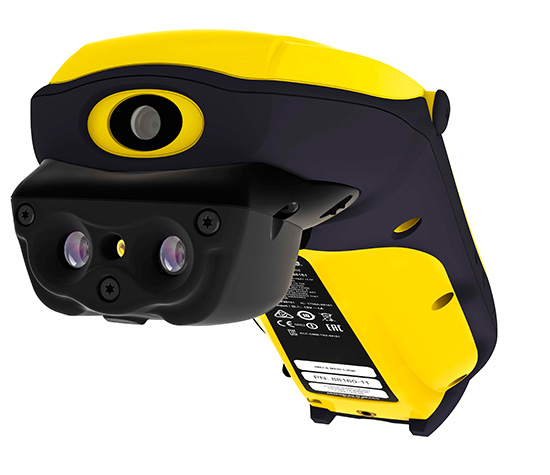
Trimble has introduced the next generation of its Trimble GeoExplorer data collection solution. The new Geo 7X includes an integrated laser rangefinder module, extended GNSS capabilities and improved hardware performance. Together with robust field and office software, the new Trimble Geo 7X handheld can enhance productivity in difficult physical conditions and challenging GNSS environments.
When faced with either obstructed satellites or inaccessible locations, GIS professionals now have the geospatial data collection tools they need in a single package, Trimble said. For times when occupying a position isn’t possible, users can take advantage of Trimble’s new Flightwave technology. With Flightwave technology, users can capture offset measurements from the Geo 7X’s rangefinder module for direct integration with Trimble data collection software. Users point and shoot to log the position, avoiding dangerous conditions or right-of-way challenges. In addition, Trimble’s field-proven Floodlight technology enhances field productivity when heavy overhead cover obstructs satellite signals.
The Geo 7X is compatible with existing and planned GNSS satellite systems — including GPS, GLONASS, Galileo, QZSS and BeiDou — to maximize productivity with additional satellites and ranging signals.
Featuring a new 1 GHz processor and 4 GB of memory running Microsoft Windows 6.5 Professional operating system, the Geo 7X offers enhanced computing performance. Other standard features include a 4.2 inch sunlight readable LED touch display and a 5 MP camera for geo-tagging assets. For wireless connectivity, the integrated modem allows users to send and receive data via GSM networks as well as Verizon’s CDMA network in the U.S. And with its IP65 rating, the rugged handheld GNSS receiver is sealed against water and dust.
With the introduction of the Geo 7X, Trimble also delivers updates to its field and office software portfolio to extend Trimble’s end-to-end data collection solutions with new software workflows and compatibility. In addition to the field-proven Trimble TerraSync and Positions software, the Geo 7X now supports the customizable data collection workflows of Trimble TerraFlex software. Consisting of mobile software and Cloud services, TerraFlex offers a fast and efficient way to collect, process and manage data. Field data is automatically synced with a central server to streamline office operations and drive higher productivity.
”We believe that true productivity is being able to map assets — the first time, every time and anywhere. We’ve built upon our productivity-enabling Floodlight technology and pushed it forward several steps,” said Alain Samaha, business area director of GIS and geospatial software solutions for Trimble’s Geospatial Division. “Users now can position themselves in the optimal location and accurately measure assets remotely with a single, integrated device together with simple software workflows. The Trimble Geo 7X allows mobile GIS users to be productive wherever they need to work.”
The Trimble Geo 7X and supporting software are expected to be available in fourth quarter of 2013 through Trimble’s authorized GIS Distribution Channel.
Esri published an interactive track map of Typhoon Haiyan, likely one of the strongest storms in recorded history.
According to Esri, users can see the real-time effects of the storm via social media posts. To change the search terms, go to the Social menu, click the settings icon, and update the keyword.
TomTom released the 6th edition of its Traffic Index which reveals that on average, commuters around the world are spending 8 working days a year stuck in traffic.
According to the announcement, the Traffic Index is the world’s most accurate barometer of traffic congestion in 169 cities across six continents. It compares travel times during non-congested hours (free flow) with travel times in peak hours. The Index takes into account local roads and highways. Based on these comparisons, the report has compiled the top ten most congested cities, ranked by overall Congestion Level, in Q2 2013, these were:
1. Moscow
2. Istanbul
3. Rio de Janeiro
4. Warsaw
5. Palermo
6. Marseille
7. São Paulo
8. Rome
9. Paris
10. Stockholm
“We are seeing a clear pattern which shows that congestion levels increase as economies emerge from recession. The traditional responses to tackling congestion, like building new roads or widening existing ones are no longer proving effective. The way traffic is managed needs significant change,” says TomTom’s Chief Executive Officer, Harold Goddijn.
TomTom reports that the Traffic Index is based on detailed knowledge of the global road network and aims to help drivers, businesses and governments manage traffic congestion effectively.
“The findings from the Traffic Index also show that real-time traffic information has the potential to ease congestion in urban areas by routing drivers away from gridlock, and help commuters to make smarter decisions.” added Goddijn.
Trimble introduced the next generation of its Trimble GeoExplorer data collection solution. The new Geo 7X includes an integrated laser rangefinder module, extended GNSS capabilities and improved hardware performance. Together with robust field and office software, the new Trimble Geo 7X handheld can enhance productivity in difficult physical conditions and challenging GNSS environments.
According to the announcement, when faced with either obstructed satellites or inaccessible locations, GIS professionals now have the geospatial data collection tools they need—in a single package. For times when occupying a position is simply not possible, users can take advantage of Trimble’s new Flightwave technology. With Flightwave technology, users can easily capture offset measurements from the Geo 7X’s rangefinder module for direct integration with Trimble data collection software. Users can simply point and shoot to log the position, avoiding dangerous conditions or right-of-way challenges. In addition, Trimble’s field-proven Floodlight technology enhances field productivity when heavy overhead cover obstructs satellite signals.
The Geo 7X is compatible with existing and planned GNSS satellite systems—including GPS, GLONASS, Galileo, QZSS and now BeiDou—to maximize productivity with additional satellites and ranging signals.
Featuring a new 1 GHz processor and 4 GB of memory running Microsoft Windows 6.5 Professional operating system, the Geo 7X offers enhanced computing performance. Other standard features include a 4.2 inch sunlight readable LED touch display and a 5 MP camera for geo-tagging assets. For wireless connectivity, the integrated modem allows users to send and receive data via GSM networks as well as Verizon’s CDMA network in the U.S. And with its IP65 rating, the rugged handheld GNSS receiver is sealed against water and dust.
With the introduction of the Geo 7X, Trimble also delivers updates to its field and office software portfolio to extend Trimble’s end-to-end data collection solutions with new software workflows and compatibility. In addition to the field-proven Trimble TerraSync and Positions software, the Geo 7X now supports the customizable data collection workflows of Trimble TerraFlex software. Consisting of mobile software and Cloud services, TerraFlex offers a fast and efficient way to collect, process and manage data. Field data is automatically synced with a central server to streamline office operations and drive higher productivity.
“We believe that true productivity is being able to map assets—the first time, every time and anywhere. We’ve built upon our productivity-enabling Floodlight technology and pushed it forward several steps,” said Alain Samaha, business area director of GIS and geospatial software solutions for Trimble’s Geospatial Division. “Users now can position themselves in the optimal location and accurately measure assets remotely with a single, integrated device together with simple software workflows. The Trimble Geo 7X allows mobile GIS users to be productive wherever they need to work.”
Cambridge Consultants introduces radar-based technology detection system to help agricultural vehicles avoid collisions. The new radar system helps prevent this by protecting the perimeters of the vehicle from potential hazards – giving audible and visual warnings to the driver.
“We have identified a huge demand for this type of agricultural technology as we see a continued increase in advanced farming techniques in the face of impending population growth and food shortages,” said Gary Kemp, programme director at Cambridge Consultants. “We’ve created practical technology that’s simple to operate and install but is also low cost and incredibly effective.”
According to the announcement, the radar units are designed to be installed on the front and rear of a vehicle as well as on the boom ends, and can detect multiple collision hazards in a wide field of view which maximises coverage. The technology can process many different moving and stationary obstacles – and instantly send an alert to the driver to warn of a potential collision. The low-frequency (5.8GHz) system is based on standard manufacturing principles, making it a cost-effective solution. The patented short-range radar technology provides unbeatable performance from a compact, low-cost sensor. The sensor simultaneously tracks multiple objects in 3D over a wide field of view and up to 30m range. Real-time collision prediction algorithm identifies hazards early, giving the driver ample time to take avoiding action
The company will be showcasing its latest farming technology at the Agritechnica International Exhibition, November 12-15, in Hanover, Germany, hall 17, stand C38.
Astrium has announced that the geo-information activities of Astrium Services have entered into a partnership agreement with IHS, a source of defense and security information, to deliver satellite imagery and services for intelligence analysis and reporting.
Leveraging this partnership will enable IHS to provide new insights and even more up-to-date and detailed information, meeting demand for fused intelligence sources to tap easily accessed information, Astrium said. Geospatial data plays a critical role in developing intelligence, formulating strategic policy and driving operational interventions.
Astrium Services brings to IHS the capability to deliver imagery and defense-oriented services based on unique access to the only multi-resolution imaging satellite. Astrium’s offering has been specifically developed to support high-currency requirements, including the varied challenges faced by military and intelligence agencies.
Under the agreement, Astrium Services will provide newly acquired imagery from its Pléiades, SPOT and TerraSAR-X satellites for use as primary sources and fusion with open source information, for actionable intelligence. It will also provide access to the GO Monitor service, which delivers reliable surveillance and change information anywhere on Earth.
By fusing IHS insight with Astrium Services imagery, IHS analysts will be able to deliver broader contextual analysis and more granular insight to meet the needs of business and national security professionals, Astrium said.
With more than 100 years of history as Jane’s, IHS has a reputation built on products such as IHS Jane’s Fighting Ships, IHS Jane’s All the World’s Aircraft and IHS Jane’s Defence Weekly.
The Spatial Plexus ’13 international conference takes a twist on the conference paradigm by bringing problems to the practitioner and educator, versus bringing practitioners to the problems.
The annual live environment (November 4-6, 2013, Atlanta, Georgia) and continuous online community created by Spatial Plexus fosters direct interaction between educators and practitioners, those who have worked with the U.S. Department of Labor to create a Geospatial Technology Competency Model (GTCM) — the National Geospatial Technology Center of Excellence, run through the Technical Colleges and Higher Education partners — and those who are writing job descriptions, assessing skills and setting salaries against it — private and public sector employers.
According to organizers, intricacies and interdependencies of “wicked problems” (those difficult to solve because of incomplete, contradictory, and changing requirements) can be exposed, better defined, dissected, better managed and reassembled through the geospatial approach.
Wicked problems highlighted this year through panel presentations and audience interaction are packaged as: “Geospatial Intelligence in Higher Education,” “GIS 4 Sustaining the Built Environment,” “GIS 4 Business Intelligence,” “GIS 4 Public Health,” and “GIS 4 Public Safety.” Open mic and topical roundtables will encourage discussions about the those issues and additional issues of interest, including “GIS in the Cloud,” “GIS and IT: integration/separation/recognition,” “Challenges for GIS,” “Speculation/forecasting future issues,” and “GIS 4 Social Media.”
Contributions by distinguished keynote speakers will build the story of geospatial literacy, articulation from education to work force and real-world implementation, respectively. These speakers include Daniel Edelson of the National Geographic Society, Rachel Kornak of University of Southern California, Frederic Grant of Emory University, and Major General Reddel of the Adjutants General Association of the United States of America.
Other noteworthy panelists and contributors include:
Josh Knauer, president and CEO of Rhiza, a Spatial Plexus sponsor, has served on President Obama’s Council of Advisors on Science & Technology
Carl Anderson was an original author of the “United States Thoroughfare, Landmark, and Postal Address Data Standard” and is the president-elect of URISA
Shan Arora, a non-geospatial practitioner/former attorney, will present information on the first clean energy industries census for the southeast.
Additional conference content and activities include:
an Academic Showcase of geospatial programs from across the country.
a social mixer highlighting Spatial Plexus sponsors, the United States Geospatial Intelligence Foundation (USGIF), MapLarge, Rhiza, Elmhurst College, and GPS World magazine (Geospatial Solutions’ partner site).
This year’s event will be held at the Georgia Tech Historic Academy of Medicine, with space exclusively for Spatial Plexus. A tour of this historic building and its assets, including Gone With the Wind chandelier, will be offered. Registration (a nominal $350 fee), hotel information and more conference information are available through the spatialplexus.com website. Continuous break foods and lunch will be provided.
CMTINC.COM announces the release of the Utility Data Collection app for the Apple iPad. This powerful GPS/GIS mapping and data collection app was mainly designed for utility asset management and meter reading. However, it could also be used by other professionals who need to map points, lines and areas and record pertinent information for the mapped Features, such as for fish & wildlife, natural resources, land management, oil and gas, archaeology, sales route management, and others.
According to the announcement, the Utility Data Collection app provides a dedicated data entry form for entering meter readings and other observations. The meter readers can opt to have the meter route displayed on a satellite map. They will be able to tell which meters have been read as the corresponding symbols will display in a different color on the map. They will also be able to sort and search the meter records. The import and export functions makes it easy to set up meter routes, upload meter database and export meter readings.
Between the monthly meter reads, the app can be used by the maintenance crew to map the locations and record the conditions of land plots, utility poles, utility meters and other equipment. The surveyed items can be easily tagged with pre-defined descriptions as well as photos taken on the spot.
The company reports that the Utility Data Collection app is the answer for small towns and utility cooperatives who are looking to transition to a newer and more effective utility management and meter reading system on a budget.