The National Geographic Society, working with partners at Google and World Resources Institute, is building a living map of the world.
National Geographic is calling on the community of land cover and photo interpretation experts by September to help annotate and curate Sentinel-2 satellite imagery needed by machine learning algorithms. Experts who can spend 20-40 hours on this task in the next 6-8 weeks should send their resumes to [email protected].
“Our vision is to produce the world’s first open global time series map of land cover and land use at 10-meter resolution with annual updates using public satellite imagery,” the society said in a statement.
A living map of the world is a foundational dataset for knowledge products driving understanding and forecasting of the world as a system and enabling data-driven conservation, resource management and policy making for sustainable development.
Simultaneous advances in global satellite imagery, super-computing on demand in commercial cloud, and powerful open source machine learning algorithms in high-performance software frameworks, combine to enable production of a global time series map of land cover and land use at a scale, speed and cost that is within reach for large NGOs and global governments.
The major roadblock to production of a global time series map is availability of a large quantity of high-quality annotated data (hundreds of millions of labeled pixels) required to train algorithms to automate production of the map time series.
National Geographic is aiming to create an initial training dataset of densely annotated tiles of Sentinel-2 imagery before September, following an expert-defined land cover taxonomy. This expert-labeled tile set will be used to train a large non-expert crowd to produce tens of thousands of additional labeled scenes, which will then be used to train the machine learning algorithms that produce maps.
The Open Geospatial Consortium (OGC) is inviting members and non-members to participate in its 3D IoT Platform for Smart Cities Pilot.
The goal of the pilot, which is sponsored by the Korea Land and Housing Corporation, is to advance the use of open standards for integrating environmental, building and internet of things (IoT) data in smart cities. It will focus on two scenarios: real-time monitoring of indoor occupancy and real-time monitoring of micro-dust air pollutants.
According to OGC, participants in this pilot will connect their technology and expertise with real city needs while collaborating with other participants to advance open standards for smart cities. OGC hopes the outcomes of the pilot will help facilitate and standardize the access to environmental, building and IoT data in smart cities.
This Initiative is being conducted under OGC’s Innovation Program, the research and development laboratory of OGC. Under OGC’s Innovation Program, sponsors and OGC members come together to address geospatial IT challenges.
Government agencies are increasingly turning to high-precision aerial imagery to solve city-planning conundrums. Three recent case studies show how emergency 9-1-1 services gather data to provide updated maps to emergency services to get to the right locations as soon as possible; reveal how a city’s public works department streamlines data collection for more efficient infrastructure management; and how to give GIS professionals instant access to the most current information available — all in the cloud.
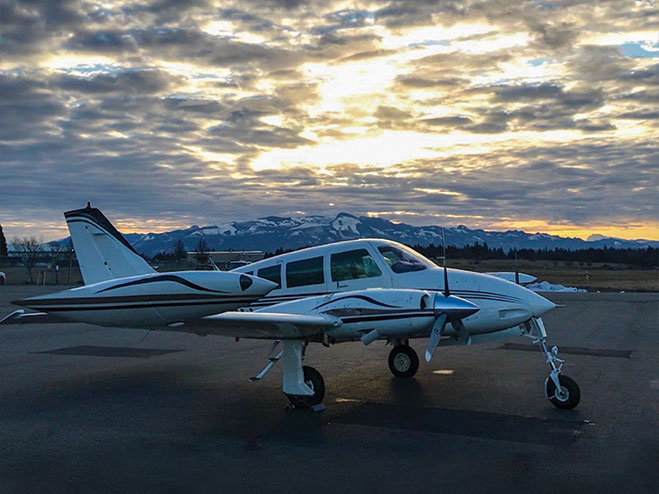
Photo: Nearmap
It’s said a picture is worth a thousand words. In the case of aerial imagery, where location data is packed into every pixel, a picture could save lives.
Emergency dispatch is just one type of government agency now relying on high-quality aerial imagery. With up-to-date georeferenced imagery of their own towns and counties, agencies are not only improving response to emergency calls, but also streamlining public works and enhancing city planning.
A company providing that imagery is Nearmap, which serves more than 8,200 organizations and businesses globally using small aircraft for image capture. The aerial mapping company provides high-quality imagery as a subscription service delivered through the cloud. Its photo maps are taken at least twice a year, with leaves both on and off the trees, to provide different views of locations in different seasons.
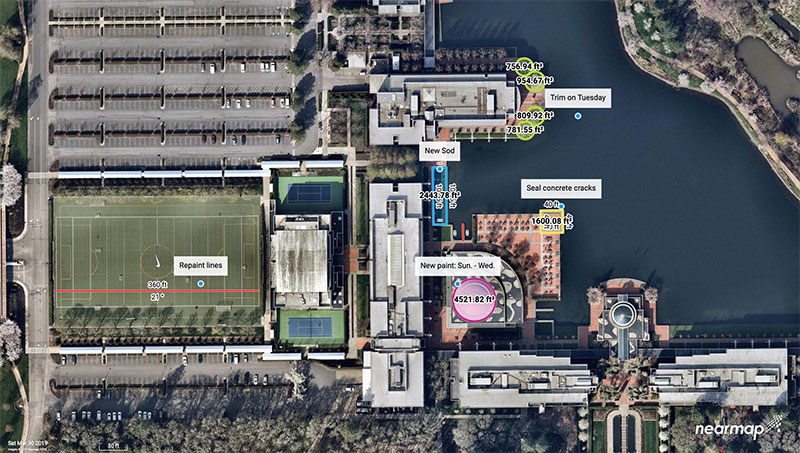
Nearmap’s patented camera system and software pipeline enables it to capture aerial photos, stitch them together into seamless digital maps, and publish the content online within days of capture. Above, Nike’s headquarters in Portland. (Photo: Nearmap)
Aircraft offers a huge advantage over unmanned aerial vehicle (UAV) or satellite imagery. Airplanes can cover much greater distances than UAVs, and pilots pay heed to the weather and fly below cloud layers to deliver the clearest visuals possible. Unlike space-based platforms, airplanes operate at lower altitudes, also increasing the resolution, and can fly on demand, unlike satellites that have set orbits dictating their periodicity for returning to a target area.
Nearmap’s powerful, patented technology allows it to deliver high-resolution aerial imagery as a service: orthographic (straight down) maps, multi-perspective panoramas and oblique aerial views — all at resolutions four times clearer than free satellite imagery.
Once photographed, the images are stitched together in the cloud in a matter of days, where they are available for viewing and analysis on desktop, tablet and mobile devices via a subscription service.
Nearmap’s proactive capture model is based on population — the larger the population, the more captures it takes per year. Nearmap images 88% of Australia’s population, 70% of the U.S. population, and 75% of the New Zealand population.
Nearmap captures many areas multiple times throughout the year; for many locations this gives customers a leaf-off and leaf-on view. Providing spring leaf-off captures allows customers a view of the ground that is typically obstructed by foliage the rest of the year.
The flight plans cover approximately 430 urban areas that are flown, captured and processed, and then served up via the MapBrowser in-browser tool, or supplied via application programming interface (API) for use in various design platforms. When a user subscribes to Nearmap, the capture is immediately available with any and all historical captures, without the need to pay for a dedicated flight.
“To capture imagery for a map, a plane has to crisscross over its own flightpath. Each sweep has to overlap the previous by approximately 70%,” explained William Tewelow, GPS World’s contributing editor for geointelligence. “Vertical (or nadir) is straight overhead. Oblique is everything else, but usually not exceeding 30% to either side because it distorts the structures and vertical features (parallax), makes mosaicking difficult, and shadows structures behind other structures.”
That said, oblique imagery is important for building 3D meshes for imagery point clouds, Tewelow said, as well as seeing various angles of a structure.
Following are examples of the creative — and surprising — ways government agencies are using Nearmap imagery to improve their services today, and prepare for future changes in their communities.
Better 9-1-1 address mapping
Shelby County is the largest county in Tennessee in both population (927,644) and geographic area (785 square miles). Memphis is the county seat, home to the county’s Emergency Communications District, for the operations of the local 9-1-1 emergency system.
The district provides Shelby County residents with an efficient emergency telephone number service using the latest technology, equipment and training for the various emergency service providers and dispatch centers.
For each dispatch center, the district provides county address location mapping. A secure database known as an ALI (Automatic Location Identification) contains the exact 9-1-1 address for any given associated phone numbers.
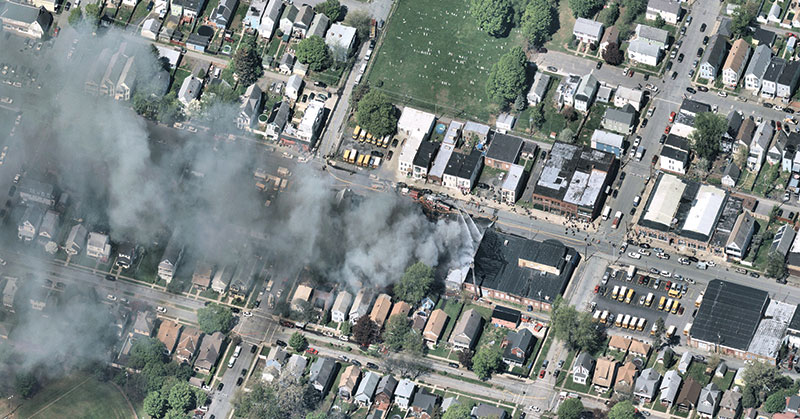
Albany, N.Y.: A house fire in progress. (Photo: Nearmap)
When a 9-1-1 call comes in, the database is queried by the Public Safety Answering Point to obtain the caller’s location. This data is then placed in the computer-aided dispatch software and 9-1-1 mapping software used by the district to help fire and rescue, emergency medical services and law enforcement gain instant access to updated maps containing GIS data needed to get to the right locations as soon as possible.
The 9-1-1 mapping system uses geodetic coordinates to plot wireless calls on the map. The system also reverse geocodes the coordinates to provide the 9-1-1 telecommunicator with a calculated civic address based on proximity of other features in the map, such as address points or streets.
Out-of-Date Imagery. For years, Shelby County’s aerial image process required a contracted flight to photograph the county areas. Because of the high cost of capturing those images, the county purchased images once every two years, after pooling resources from various county entities.
“We had gaps where we wouldn’t have updated imagery,” said Timothy Zimmer, the district’s GIS administrator. “While the images were high resolution, there were issues with mosaicking the separate images together, and since the imagery was taken every two years, many rural and unincorporated areas were out of date.”
With out-of-date images, the county had to develop alternate methods to locate addresses for the 9-1-1 systems.
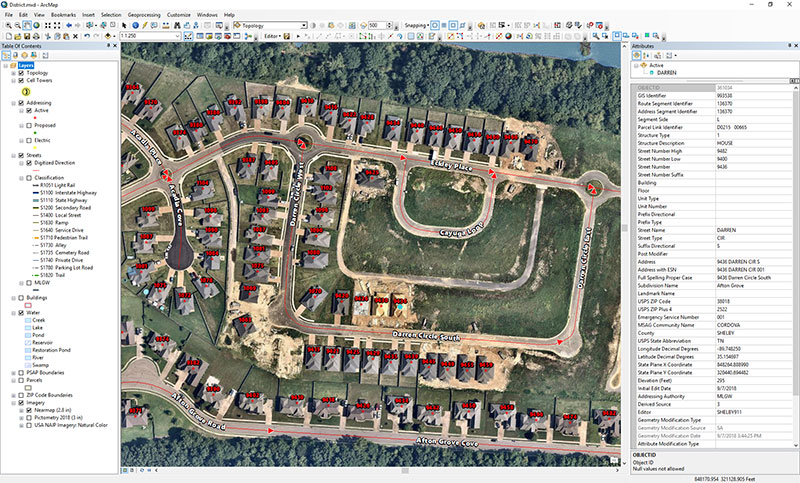
Moving into the Cloud. In the summer of 2018, Zimmer began to work with Nearmap. With Nearmap, Zimmer and his team can access current imagery to geocode new addresses and developments as well as plot new roads into the 9-1-1 mapping systems (Figure 1).
For Zimmer, the biggest advantage is that Nearmap’s imagery integrates directly into Esri’s ArcMap, ArcPro and ArcGIS Online applications, so he can overlay GIS information directly over the high-resolution imagery.
“I really like how Nearmap is integrated into the GIS stack,” Zimmer said. “We’re able to stay on top of new developments, roads, and addresses. Being able to have Nearmap imagery integrated into our GIS systems helps us be much more accurate.”
The combined impact of data services, base maps, Nearmap imagery and third-party data are improving all aspects of public safety, including law enforcement, fire and emergency medical services.
Other Shelby County agencies also are using the district’s imagery and GIS data. “The county clerk and the utility company are using our address mapping data because Nearmap has helped enable us to be much more current,” Zimmer said.
Public works in a fast-growing city
Durham is one of the points in North Carolina’s high-tech Research Triangle and home to Duke University.
An economic and cultural renaissance is happening in the city. With a revitalization of its downtown district, the redevelopment and repurposing of former tobacco districts into tech hubs, and chic loft-style apartment complexes, Durham is rapidly growing beyond its most recently reported 250,000 population numbers.
Impervious Challenge. In early 2018, the city’s growth explosion prompted Edward Cherry, GIS administrator for the City of Durham Public Works Department, and his staff of 14 GIS professionals to seek ways to streamline their data collection.
The department manages all infrastructure data for the city, including mapping the impervious area. As defined by the U.S. Geological Survey, impervious surfaces include highways, streets, pavement, driveways and even house roofs — any surface that won’t absorb rainwater. Rather, the rain runs off into storm sewers and then into local creeks; localized flooding is often the result.
Durham Public Works manages half a billion square feet of impervious area. The city’s $16 million-a-year Stormwater Utility Fee income was a driver for Cherry’s team to explore satellite imagery options. Imagery from satellites, however, were infrequent and too low-resolution to meet their needs. The satellites captured images only once-a-year, and that might be on a cloudy or rainy day. Clouds cast shadows, and rain makes pavement appear newer than it is.
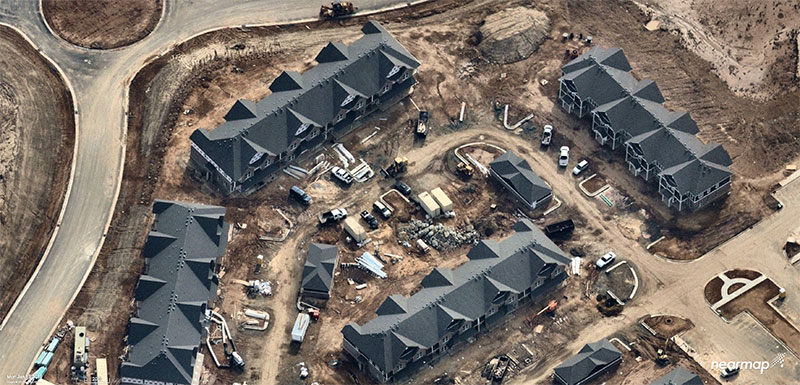
Nearmap’s aerial imagery, captured in Durham three times a year at a 2.8-inch ground sample distance (GSD), solved the problem (the GSD of each individual pixel in the imagery represents 2.8 inches on the ground. See Figure 2).
Figure 2: Rapid growth requires frequent imagery. Above is a new Durham neighborhood under construction. (Photo: Nearmap)
Dozens of projects in the Public Works Department — from road maintenance and pothole patching to water sampling and degradation — are using the improved imagery, which has saved the city money, reduced time spent in the field, and allowed crews to use real-time imagery when they are working in the field.
Monitoring Pavement Conditions. The City of Durham is responsible for maintaining most of its roads, and conducts a road-condition survey that samples different sites, evaluating the level of degradation.
Since 2014, Nearmap has regularly captured Durham streets at the same resolution and accuracy, and both the historical and current data are available to the department. With multiple high-quality image captures at high resolution, surveyors can see sections that have been recently paved. “We don’t need to send crews out to an area where a stretch has already been paved,” Cherry explained.
Road Repair Documentation. As in any city, the patching of potholes is an ongoing project for Durham’s public works department. With imagery, the city has been able to streamline the process.
Traditionally, the streets department sent out inspectors to spray paint and circle areas that required repairs. “Then we would produce maps and hard copies to direct [road repair contractors] ahead of time on a scheduled event,” Cherry said.
Now the city uses an application integrated with Nearmap imagery by which contractors can view the job on their smartphone or tablet while in the field. The surveyors can edit and draw the areas that need patching instead of physically going out and spray-painting them. “Then, in real time, the people doing the patching can see a very high-resolution image of where they need to do the work,” he said.
The pothole image captures are recorded, so the city knows where and how many potholes were patched. “We can see where work has been done when we are billed for it,” Cherry said. “We can visualize the work, which is an added bonus.”
Mapping Riparian Zones. With imagery previously taken only when the leaves had fallen (known as leaf-off), surveys of riparian zones in Durham proved limiting.
With imagery captured during both leaf-off and leaf-on seasons, riparian buffers around streams can be properly monitored for expansion. The buffers can be altered if there are issues with a stream’s path, such as sediment clogging the flow, repeated flooding or people intruding on a buffer.
Change Detection. High-resolution imagery has improved Durham’s billing process by producing web service maps that capture individual storylines. Stormwater billing customers, for instance, can visualize their properties with the impervious areas mapped out and tied to their billing records.
With up-to-date imagery providing data for change detection software, records also show when a customer has added a driveway or an extension to their house.
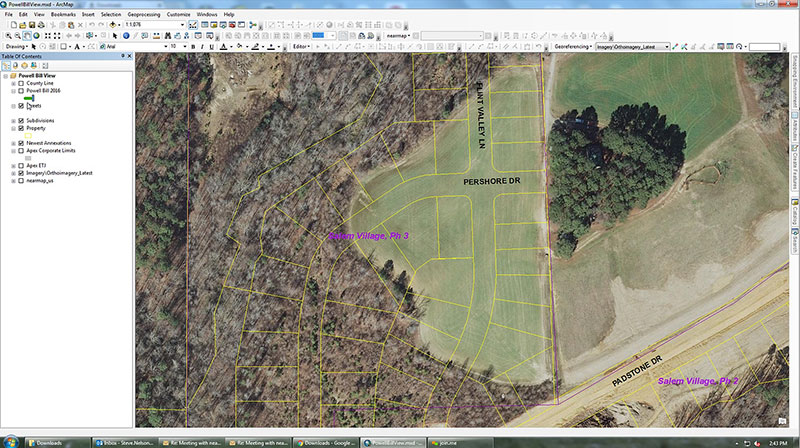
Figure 3: Aerial Imagery of an Apex neighborhood displayed in ArcGIS from Esri. (Image: Nearmap)
“Having access to imagery back to 2014, we’re able to go back in time during the thrust of development and monitor it forward,” Cherry said.
Nearmaps’ library of historical imagery allows for change detection algorithms to run in Esri’s ArcGIS imagery analysis software suite.
More efficient government
GIS data combined with aerial imagery is tailor-made for city planning and managing urban growth.
For instance, the population of Apex, N.C., has more than doubled since 2000. Situated near Raleigh and the state’s Research Triangle Park, Apex was rated number one in Money magazine’s 2015 “Best Places to Live,” which cited Apex’s charming downtown, highly rated schools and high-paying technology jobs.
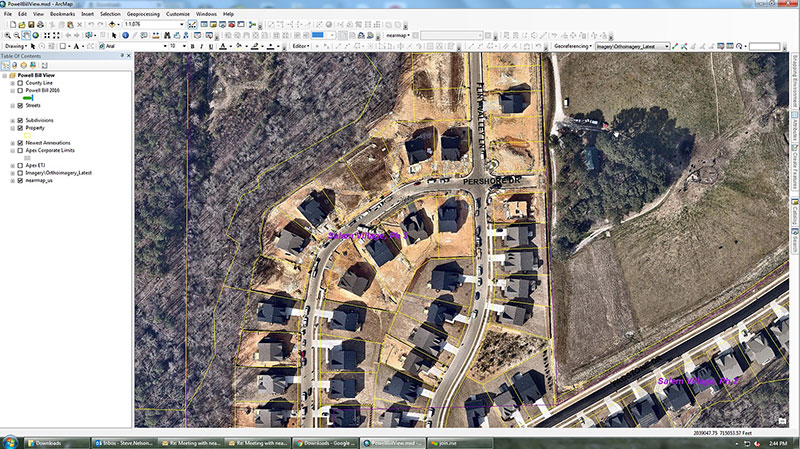
Figure 4: The post-construction image of the same neighborhood is much more accurate. (Image: Nearmap)
To manage the explosion in development, Apex’s GIS professionals needed instant access to current information. The old-school method required planners to drive the streets, inspect roadways, and roll out the measurement wheel. Now, the combination of Esri ArcGIS for mapping and Nearmap high-resolution aerial imagery allows them to visualize and measure within six inches of accuracy.
“Our ability to leverage our GIS operation improved dramatically with Nearmap. The flexibility of its cloud solution and ability to integrate with ArcGIS has redefined how we rapidly respond to staff and citizen requests,” said Steve Nelson, a GIS professional with Apex.
The use cases for these solutions are diverse. Law enforcement calls on GIS professionals from Apex to quickly provide current, clear, aerial photography for active or ongoing investigations. Planners focused on development are charged with meeting state regulatory reporting guidelines when it comes to building and maintaining roads. Environmentalists want to know if anyone is digging on protected land.
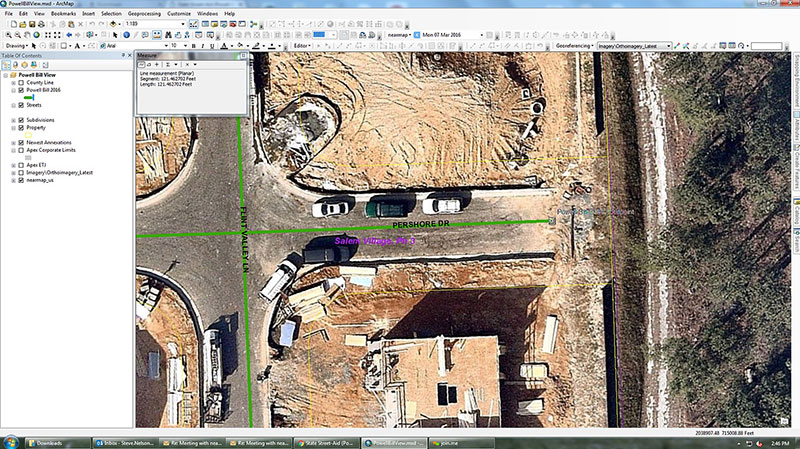
Figure 5: Measuring for reimbursement in Apex. (Image: Nearmap)
For the State Street-Aid Program, financial allocations are made to incorporated municipalities eligible under North Carolina law. State routes that pass through incorporated cities are maintained by the cities. Cities are responsible for paving new roads, but the state has the power and economic means to reimburse them.
To qualify for reimbursement for new roads developed and maintained, Apex needs to submit a report to state engineers for review. The report documents the distance for all newly paved roads.
Before the new system was in place, GIS professionals had access to imagery from 2013, but the actual development took place after this. In (Figure 3), the 2013 imagery simply outlines the parcels and rights of way. It has no detail with respect to where the roads start and end, so a lot of field work was needed to take measurements, drive roads scattered across the county, and collect data.
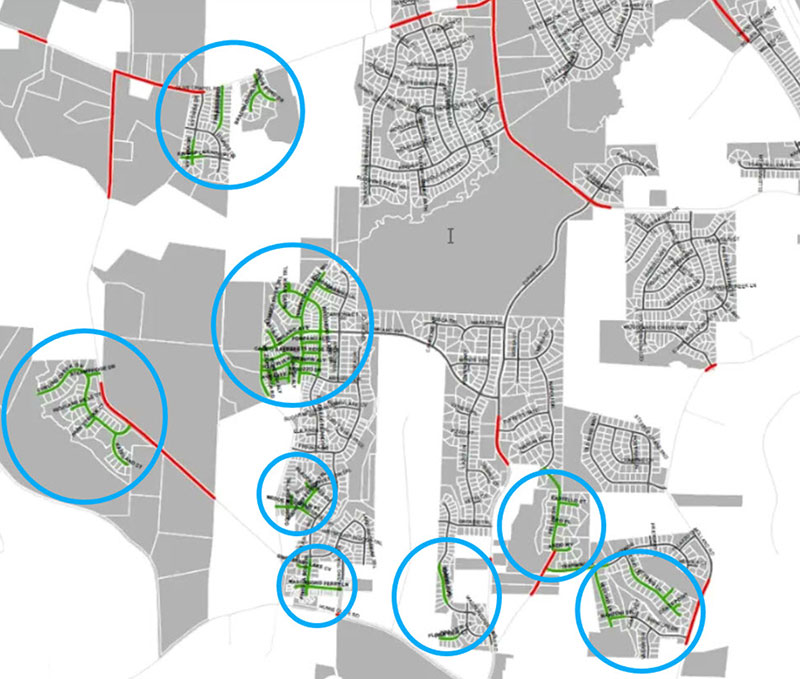
Figure 6: Green lines indicate new streets in Apex in a single year (2013). (Image: Nearmap)
With the new system, workers have instant access from their desktop to the same location as it currently is. They can see exactly where the edge of the road starts and stops (Figures 4 and 5), which is different from the yellow-lined “right of way” depicted in Figure 3. While in the office, GIS professionals can measure distances precisely, creating an accurate representation of ground truth.
Figure 6 highlights a small portion of new roads built in Apex in one year. The green lines highlighted are scattered across the city. As Apex continues to grow and annex adjacent territory, the dynamic nature of the growth will be captured and uploaded to the cloud.
Unlocking Potential
As cities grow in complexity, mapping becomes integral to planning. With the advances aerial imagery provides, cities are starting to unlock the full potential of location data and visualizing a better future.
An electric cooperative that serves more than 33,000 member customers in Lakeside, Arizona — including the White Mountain Apache Tribe — is using an unmanned aerial system (UAS) to enhance the utility’s GIS effort, working with UAS specialist Skynetwest. Noah Ruiz started Skynetwest in 2015 to provide aerial photographic and videographic services, but seeing the potential of UAS he began making the pivot to high-value data retrieval.
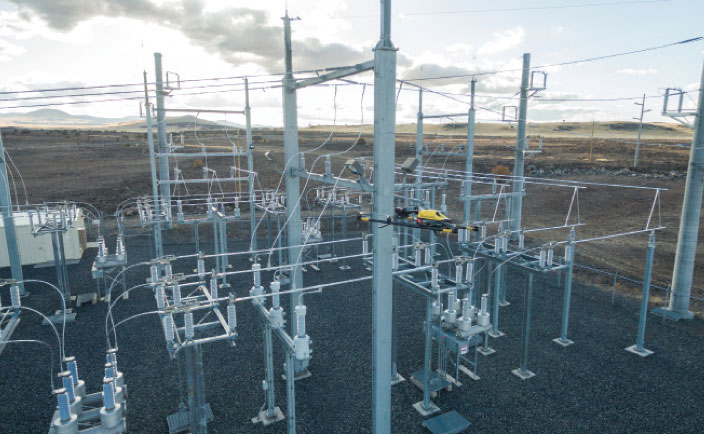
Initial work for the Navopache Electric Cooperative (NEC) included an inspection of an area’s substations. Conducted on a day in which the winds were blowing at 20+ mph, with most other aircraft, the flight would have been extremely risky if not scrapped.
Skynetwest used an Intel Falcon 8+ Drone, Topcon Edition. Windspeed limits for the Falcon 8+ in GPS mode are set at 26 mph; in height mode that threshold is extended to windspeeds as high as 35 mph.
The Falcon 8+ has triple-redundancy inertial measurement units (IMUs), double-redundant compasses, dual-constellation GPS, eight propellers and two batteries. Built into the aircraft’s software is an algorithm that detects the electromagnetic frequencies coming off of power lines and tells the IMUs which one it wants to switch from, which GPS it wants to use, and which compass it wants to use.
The aircraft’s stability is key not only for power line work but also for items like inspection of oil and gas components. For inspection applications — close-up inspections to detect millimeter-sized damage, fine hairline cracks, leaks or heat power losses, for example — the Falcon 8+ payload consists of a Panasonic Lumix DMC-ZS50 camera for true-color RGB images and the FLIRTau 2 640 thermal imaging camera for infrared imaging. The hybrid RGB + 14-Bit RAW data inspection payload combines a near-infrared camera with a high-resolution digital camera mounted in parallel.
The mapping package Skynetwest uses includes a 36-megapixel RGB camera (Sony Alpha 7R) and delivers both orthophotos and 3D models in Topcon ContextCapture software, powered by Bentley Systems.
Upon completion of the substation project, using ContextCapture and Agisoft PhotoScan software, Skynetwest stitched together all of the images it had gathered to create a georeferenced 3D model of that substation. NEC is looking into building more 3D representations of the entire grid and ultimately hoping to build a complete 3D spatial record down to nuts and bolts — all with survey grade data.
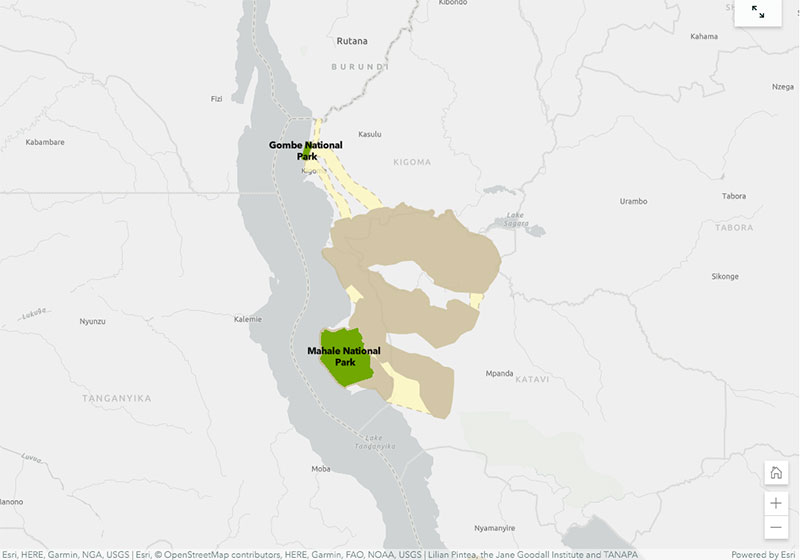
The StoryMap highlights how many remaining chimpanzee habitats are outside of protected areas, and how that habitat is in the care of local people and decision-makers. It also walks through JGI’s Tacare community-centered conservation approach which employs GIS and other tools to empower local communities in the pursuit of local conservation.
The StoryMap explains the start of Jane Goodall’s career and how she discovered that chimpanzees make and use tools, which led to the discovery that chimpanzees share 98.6% of human DNA. It also covers the importance of conserving chimpanzees and their habitats, specifically noting their habitats in Tanzania. Finally, it explains how Tanzanians are using mobile technology, paired with the Esri Survey-123 app, to turn land-use plans into reality.
The StorMap also offers an overview of JGI’s Tacare community-centered conservation approach, which emphasizes four steps: engage, listen, understand and act.
Viametris has launched the second-generation version of the vMS3D, its urban and road lidar scanner.
The second-generation version of the 3D mobile vehicle scanner has been redesigned to be more compact. The system has been simplified considerably in both electronic and ergonomic terms to make it more robust and stable in adverse conditions and challenging environments.
Despite being lighter, the second generation offers the same technological capacities as its predecessor, but is simpler to use and can be mounted on a vehicle in minutes.
The system component (including the sensors) and the element to affix the device to the vehicle (the frame) previously formed one unit, but are now separated.
The redesigned system is much lighter (9 kg) and more compact.
The mechanism to fix the scanner to the vehicle, which formed part of the system in the first-generation version, has been transformed. A rigid metal frame, fixed onto two roof bars, now holds the system, which fits into a dedicated compartment in seconds. As the frame is rigid, it limits vibrations between the system and the vehicle and prevents any strain on the mechanics during acquisition.
The second auxiliary antenna, which measures the heading by satellite, is discreet and non-removable, and fixed directly to the vehicle chassis.
The new design makes it easier to mount and use the system, a task that can be accomplished by a single person in under three minutes. Alignment takes place the first time the system is mounted and does not need to be repeated, saving valuable time each start.
Technological features
The vMS3D comprises a new set of components that are more robust and stable in difficult conditions.
The integrated connectors are next-generation and embedded-grade.
The control box for power supply and communication with the tablet has been moved inside the vehicle to offer increased comfort to the user.
A major use of remote sensing data is to compare images of an area taken at different times and identify the changes it underwent. With a wealth of long-term satellite imagery in open use, detecting such changes manually would be time-consuming and most likely inaccurate.
To address this, EOS Data Analytics has introduced an automated Change Detection tool to its flagship product LandViewer, a cloud tool for satellite imagery search and analysis in today’s market.
Unlike the methods involving neural networks that identify changes in the previously extracted features, the change detection algorithm implemented by EOS is using a pixel-based strategy, meaning that changes between two raster multi-band images are mathematically calculated by subtracting the pixel values for one date from the pixel values of the same coordinates for another date.
This new signature feature is designed to automate a change detection task and deliver accurate results in fewer steps and in a fraction of the time needed for change detection in most image-processing software.
Change detection interface: Images of Beirut city coastline selected for tracing the developments of the past years. (Image: LandViewer)Change detection interface: Images of Beirut city coastline selected for tracing the developments of the past years. (Image: LandViewer)
Applications from farming to environmental monitoring
One of the main goals set by EOS team was to make the complex process of change detection in remote sensing data equally accessible and easy for non-expert users coming from non-GIS industries.
With Land Viewer’s change detection tool, farmers can quickly identify the areas on their fields that were damaged by hail, storm or flooding. In forest management, satellite image detection of changes will come in handy for estimation of the burned areas following the wildfire and spotting the illegal logging or encroachment on forest lands.
Observing the rate and extent of climate changes occurring to the planet (such as polar ice melt, air and water pollution, natural habitat loss due to urban expansion) is an ongoing task of environmental scientists, who may now have it done online in a matter of minutes. By studying the differences between the past and present using the change detection tool and years of satellite data in Land Viewer, all these industries can also forecast future changes.
Top change detection use cases: Flood damage and deforestation
A picture is worth a thousand words, and the capabilities of satellite image change detection in Land Viewer can be best demonstrated on real-life examples.
Forests that still cover around a third of the world’s area are disappearing at an alarming rate, mostly due to human activities such as farming, mining, grazing of livestock, logging, and also the natural factors like wildfires. Instead of massive ground surveying of thousands of forest acres, a forestry technician can regularly monitor the forest safety with a pair of satellite images and the automated change detection based on NDVI (Normalized Difference Vegetation Index).
How does it work? NDVI is a known means of determining vegetation health. By comparing the satellite image of the intact forest with the recent one acquired after the trees were cut down, Land Viewer will detect the changes and generate a difference image highlighting the deforestation spots, which can further be downloaded by users in JPG, PNG or TIFF format. The surviving forest cover will have positive values, while the cleared areas will have negative ones and be shown in red hues indicating there’s no vegetation present.
A difference image showing the extent of deforestation in Madagascar between 2016 and 2018; generated from two Sentinel-2 satellite images. (Image: LandViewer)
Another widespread use case for change detection would be agricultural flood damage assessment, which is of most interest to crop growers and insurance companies. Whenever flooding has taken a heavy toll on your harvest, the damage can be quickly mapped and measured with the help of NDWI-based change detection algorithms.
Results of Sentinel-2 scene change detection: The red and orange areas represent the flooded part of the field,; the surrounding fields are green, meaning they avoided the damage. California flooding, February 2017. (Image: LandViewer)
How to run change detection in Land Viewer
There are two ways you can launch the tool and start finding differences on multi-temporal satellite images: by clicking the right menu icon “Analysis tools” or from the Comparison slider ‒ whichever is more convenient. Currently, change detection is performed on optical (passive) satellite data only; addition of the algorithms for active remote sensing data is scheduled for future updates.
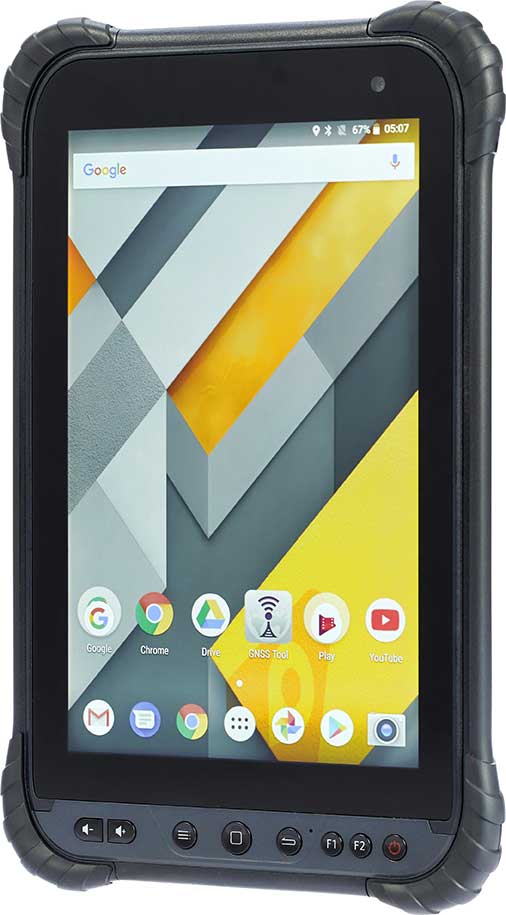
CHC Navigation has launched its LT700 rugged Android tablet. The LT700 is designed to increase the efficiency and productivity of the mobile workforce in different industries and applications.
An integrated GNSS module (GPS/GLONASS/BDS/SBAS) provides robust positioning performance. The LT700 dual-SIM 4G modem ensures fast and reliable connection with mobile teams.
The LT700 tablet features an 8-inch sunlight-viewable touchscreen. It displays geospatial information system (GIS) data tables, complex vector and raster maps, or high-resolution pictures in direct sunshine and high-bright areas, CHC Navigation said.
Unlike consumer-grade tablets, the L700 is intended for mobile field workers. Its industrial IP67 design withstands all-day use in harsh environments and conditions, and is protected from dust, rain, extreme temperatures and accidental drops from 1.2 meters. Rugged design, soft corner bumpers and long battery life provide the LT700 with the capability to perform uninterrupted for a complete working day.
The LT700’s octa-core 2.2-GHz CPU supports running large maps and datasets without any lag or slowdown. Driven by Android 8.1 and bearing the GMS (Google Mobile Service) certification, the LT700 runs seamlessly the most common professional data collection applications available from the Google Play store.
Maptitude for Redistricting is designed specifically for anyone involved in or preparing for the 2020 redistricting cycle, from novice to professional users.
Maptitude for Redistricting 2019 has new partisan competitiveness reports, adds access to imagery layers, and allows users to save and share their plans in a variety of formats.
New features include:
Speed improvements provide faster access to maps and geographic analysis.
Expanded file support for Excel worksheets, Google Earth Documents (KML/KMZ) attribute data fields, and MapPoint files.
New partisan competitiveness reports and measures of compactness for analyzing redistricting plans,
Integrated satellite imagery from a variety of sources for giving a better view of district composition.
The latest Census geography and data, including current ACS data.
Maptitude for Redistricting is a professional tool for political redistricting. It provides measures and reports that support the creation of fair and balanced districts.
Maptitude is constantly enhanced and provides tools such as the Efficiency Gap Measure for exploring redistricting problems.
Maptitude was used to democratize redistricting in California and is used by the majority of redistricters, from independent commissions, non-profits, and civil rights groups, to the courts and political parties.
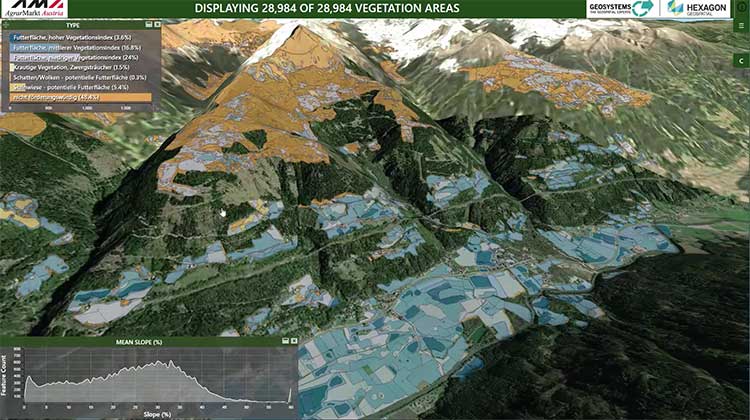
Hexagon’s Geospatial Division launched M.App Enterprise 2019 at its user conference, HxGN LIVE 2019. The latest version of M.App Enterprise integrates capabilities from Hexagon’s Luciad Portfolio to enhance data visualizations, analytics and management.
Designed to monitor assets, evaluate changes, and take action, M.App Enterprise is a privately-hosted platform that allows organizations to deploy Hexagon Smart M.Apps that dynamically address their location-based business problems.
The new features in M.App Enterprise 2019 lay the foundation for users to experience a 5D smart digital reality, where data is connected seamlessly through the convergence of the physical world with the digital and intelligence is built into all processes.
Screenshot: Hexagon Geospatial
“The enhanced M.App Enterprise is now powered by our Luciad technology, which allows users to have the best of both worlds when it comes to data visualization and advanced analytics to communicate information effortlessly, and in real-time,” said Georg Hammerer, chief technology officer – applications for Hexagon’s Geospatial Division. “This unified geospatial enterprise platform can now further enable users and partners to create vertical solutions for their markets and industry segments.”
The Luciad Portfolio integration will allow users to connect to, visualize and examine file-based vector and raster data from their Smart M.Apps in 3D. It also now renders terrain features realistically based on elevation data of the area.
For covering large geographical areas with a higher resolution, M.App Enterprise 2019 allows users to connect to tiled elevation coverages offered by LuciadFusion.
Furthermore, the addition of classification algorithms to the Spatial Workshop user interface enables M.App Enterprise to perform advanced remote sensing with machine learning.
Phase One Industrial has expanded its RS and RSM lens offering with three new high performance lenses for high-altitude aerial photography and long-range aerial and ground inspection applications.
The 300mm AF, 180mm, and 150mm MK II lenses are designed to enhance the performance and flexibility of Phase One Industrial’s iXM-RS and iXM aerial camera series. Each offers precision imagery, taking advantage of the cameras’ ultra-high resolution backside-illuminated (BSI) CMOS sensors, to maintain a smaller ground sample distance (GSD) while flying at higher altitudes, the company said.
Phase One RSM 300mmAF. With the longest focal length in the line-up, this lens offers a 5 cm GSD from 13,000 feet. It fits both iXM and iXM-RS camera models and produces superb image quality by enhancing the cameras’ ultra-high resolution BSI CMOS sensors (3.76 µm pixels).
The lens is designed for both high-altitude 2D and 3D mapping and long-range ground inspection. The motorized lens offers a focus range of 10 m to infinity within which a predefined distance can be set remotely. A self-locking mechanism is built in to secure the focus position against vibrations.
5 cm GSD from 13,000 feet
10 m to infinity focusing range
f/8 – f/32 aperture range
1/2000 sec exposure time
RS Shutter reliability – 500,000 actuations
Rodenstock RS 180mm. Specified by Phase One and built by Rodenstock Photo Optics, Germany, this lens reaches a 5 cm GSD from 8,000 feet when used with the iXM-RS150F camera. The lens supports the camera’s ultra-high resolution BSI sensor for greater image quality and is integrated with a Phase One RS reliance shutter for speed and reliability. The RS 180mm enhances high-altitude aerial 2D and 3D mapping and improves efficiency in oblique configurations.
5 cm GSD from 8,000 feet
f/6.3 – f/22 aperture range
1/2000 sec exposure time
RS Shutter reliability – 500,000 actuations
Phase One RS 150mm MK II. A 5 cm GSD from 6,500 feet is achievable with the RS 150mm MK II lens. It complements the iXM-RS150F camera’s ultra-high 150-megapixel resolution BSI CMOS sensor for acquiring quality images for high-altitude aerial 2D and 3D mapping.
5 cm GSD from 6,500 feet
f/5.6 – f/22 aperture range
1/2500 sec exposure time
RS Shutter reliability – 500,000 actuations
Every Phase One Industrial lens is rigidly built for robustness against vibrations and shocks to meet RTCA DO160G standards, and is individually tested for performance and high-modulation across the whole image area.
With more than 80 percent of the world’s oceans unmapped, the deep ocean is one of the last unknown areas on Earth. On May 31, teams with unique exploration solutions were honored with the Shell Ocean Discovery XPRIZE.
XPRIZE is a global competition to advance ocean technologies for rapid, unmanned and high-resolution ocean exploration and discovery. The teams invented new technologies for rapid, unmanned and high-resolution ocean exploration and discovery.
The results were revealed at an awards ceremony hosted at the Oceanographic Museum of Monaco, part of the Oceanographic Institute, Prince Albert I of Monaco Foundation.
The grand prize winner, receiving a total of $4 million, was GEBCO-NF Alumni, an international team based in the United States, while KUROSHIO, from Japan, claimed $1 million as the runner-up.
GEBCO-NF Alumni was led by Rochelle Wigley, Ph.D., and Yulia Zarayskaya, Ph.D. The 14-nation team integrated existing technologies and ocean-mapping experience with a robust and low-cost unmanned surface vessel, the SeaKIT, along with a novel cloud-based data processing system that allows for rapid seabed visualization, to contribute towards comprehensive mapping of the ocean floor by 2030.
Runner-up was KUROSHIO, from Yokosuka, Japan, led by Takeshi Nakatani, Ph.D. The team integrated technologies from their partners to create a surface vessel and software platform that can operate with different autonomous underwater vessels, which increases the versatility of their technology.
Field Testing. To determine winners, the panel of independent judges reviewed data from field testing conducted in Kalamata, Greece, and Ponce, Puerto Rico. In Kalamata, teams had up to 24 hours to map at least 250 square kilometers of the ocean seafloor at five meters horizontal resolution or higher.
The gold-standard high-resolution baseline maps, against which the team maps were judged, were provided by Ocean Infinity and Fugro, while Esri, the global leader in geographic information system (GIS) software and geodatabase management, donated its ArcGIS Online platform for the teams and judges to use.
NOAA Prize. The $1 million National Oceanic and Atmospheric Administration (NOAA) Bonus Prize went to teams for developing technology that could detect a chemical or biological signal underwater and autonomously track it to its source. The award was split between junior high school team Ocean Quest from San Jose, California, which claimed $800,000 as the winner, and Tampa Deep Sea Xplorers, from Florida, taking $200,000 as runner-up.
Additionally, the judges unanimously recommended a $200,000 Moonshot Award for Team Tao from the United Kingdom for its unique approach to seafloor mapping, even though they did not meet the criteria of the competition.
As part of the total $7 million prize purse, four teams opted to compete for the $1 million NOAA Bonus Prize. In a field test in Ponce, Puerto Rico, teams needed to demonstrate that their technology can “sniff out” a specified object in the ocean by first detecting and then tracing a biological or chemical signal to its source.
The judges determined that no single team was able to trace the signal to its source in the timeframe allowed, so the prize was divided among the two teams that came the closest. In 2018, nine finalist teams were awarded an equal share of the first $1 million of the $7 million prize purse, in recognition of their progress-to-date and to support the teams’ continued technological development.
Seabed 2030 and science fiction. As part of its post-prize impact work, XPRIZE announced a partnership with Seabed 2030, a collaborative project between The Nippon Foundation and The General Bathymetric Chart of the Oceans (GEBCO) to inspire the complete mapping of the world’s ocean by 2030 and to compile all bathymetric data into the freely-available GEBCO Ocean Map.
Additionally, and in anticipation of World Oceans Day on June 8th, XPRIZE will launch a science fiction ocean anthology featuring 19 original short stories and artwork set in a future when technology has helped unlock the secrets of the world’s oceans.