Airbus Defence and Space and The Climate Corporation, a subsidiary of Bayer, have announced a global agreement to deliver frequently updated satellite imagery from Airbus to farmers through Climate FieldView, a digital agriculture platform.
Farmers who use Climate FieldView can access high-resolution data of their fields from the Airbus SPOT 6, SPOT 7 and Pléiades satellites throughout the growing season. This gives FieldView customers the ability to more precisely monitor crop health and performance, helping them take action in the field before yield is impacted at the end of the season.
They will also be able to visualize this satellite imagery alongside other data layers in their FieldView account, including planting and yield data, to unlock new insights about crop health.
The large swath and coverage capabilities of the SPOT satellites enable mapping at a national level down to individual farmland parcels, while the Pléiades satellites can be used to pinpoint details in specific areas, thanks to its combination of sub-meter resolution and multispectral bands.
The complementarity between SPOT and Pléiades resolutions, swaths and revisits is crucial for effectively monitoring crops more precisely and helps enable more-informed decision-making.
“We are very pleased to be working with The Climate Corporation to enhance FieldView by providing them with access to updated, cloud-free images within the time frame required to efficiently monitor crops at each key growth stage,” said François Lombard, head of Intelligence Business at Airbus Defence and Space.
“High-quality satellite imagery integrated into a farmer’s Climate FieldView account can bring in more consistent and invaluable field-level insights,” said Steven Ward, Senior Director of Geospatial and Weather Sciences at The Climate Corporation. “This partnership with Airbus supports Climate’s commitment to deliver the most robust imagery ecosystem on the farm, helping farmers make important decisions tailored precisely to their individual fields.”
The Climate Corporation’s mission is to help the world’s farmers sustainably increase their productivity through the use of digital tools. First launched in the United States in 2015, the company’s Climate FieldView platform gives farmers a deeper understanding of their fields so they can make more informed operating decisions to optimize yields, maximize efficiency and reduce risk.
FieldView is currently on more than 60 million paid acres across the United States, Canada, Brazil and Europe.
The Copernicus Masters competition awards applications and solutions that use Copernicus data to tackle important challenges. Submissions for the 2019 awards opened on April 1.
The demand for Earth observation (EO) data is exploding in order to find innovative solutions for today’s challenges such as climate change, food security or water supply.
With more than 15 terabytes of free EO data generated by the Copernicus programme every day, the Copernicus services deliver near-real-time data on a global level — contributing towards the sustainable management of the environment.
Simultaneously, the Earth observation industry is constantly growing. New data platforms are being developed to receive and process the huge amount of satellite data collected from the Sentinels — and other contributing commissions.
These data platforms are established on the cloud and work with Artificial Intelligence (AI) and Machine Learning, enabling the development of new applications in the EO sector.
The Copernicus Masters 2019 — Europe’s leading innovation competition for Earth observation (EO) — is searching for such outstanding applications, solutions, and business concepts from future-oriented SMEs, startups, universities and individuals in the fields of business, research and higher education.
From April 1 to June 30, participants in the Copernicus Masters 2019 can submit their innovative EO solutions to eight challenges offered by the following world-class partners: European Space Agency (ESA), the German Aerospace Center (DLR), Astrosat, Planet, BayWa and Airbus together with sobloo and the German Federal Ministry of Transport and Digital Infrastructure (BMVI).
“The Copernicus Masters is the innovative driver for future-oriented applications and business concepts using Earth observation data. This creates socio-economic benefits through public services all over Europe. Besides, it supports business ventures and high-tech jobs in Europe’s digital economy,” states Josef Aschbacher, director of ESA’s Earth Observation Programmes. ESA is an initiating partner of the Copernicus Masters and has set a challenge for participants every year since 2011.
Participants can demonstrate their innovative use of Earth observation data across a wide variety of challenge topics, including the fields of future EO, Artificial Intelligence (AI), machine learning, energy, health, sustainable living, smart farming, and digital transportation, as well as maritime, defence & security.
“Since 2011, the Copernicus Masters competition has evolved into the leading innovation platform for promoting user uptake of Earth observation data in a commercial, societal and sustainable context. Each year, it showcases new solutions and trends, serving as an integral part of an international EO innovation network,” adds Thorsten Rudolph, managing director of AZO, the competition organizer.
Together with cash prizes, challenge winners will receive access to an international network of leading Earth observation organizations, substantial satellite data quotas, and business development support worth more than EUR 450,000 in total. The Overall Winner will receive an additional cash prize of EUR 10,000.
The WingtraOne vertical take-off and landing (VTOL) fixed-wing mapping drone now carries the RedEdge-MX multispectral sensor for vegetation mapping.
The WingtraOne is a VTOL drone that allows for flexible take-off and landing, with automated vertical take-off and landing even on gravel or in forest isles.
The WingtraOne provides wide coverage for comprehensive and high-quality multispectral image gathering, with coverage of up to 160 ha (395 ac) with 8.2 cm (3.2 in)/px GSD at 120 m/ 394 ft in one flight.
The Terrain Following feature provides for intuitive flight planning with fully automated functionality, the company said.
The RedEdge-MX features a patent-pending DLS 2 and a calibrated reflectance panel that enhances radiometric calibration and provides useful data for comparison of results over time, improving crop and stand monitoring.
The camera captures five narrow spectral bands: red, green, blue, near infrared and red edge. It generates plant health indexes and RGB (color) images from one flight, and is calibrated for precise, repeatable measurements.
Standard data outputs are compatible with almost all processing platforms.
The contract marks an important step in the long-term partnership between SSC and Airbus, and extends the capabilities of both companies.
The first two very high-resolution Pléiades Neo satellites will be launched in mid-2020, followed by a second pair in 2022. They will join the existing Airbus constellation of optical and radar satellites, and will offer enhanced performance, and the highest reactivity in the market.
SSC will provide comprehensive ground segment support for the Launch and Early Orbit Phase (LEOP), as well as routine on-orbit support for Telemetry, Tracking and Control (TT&C) and data reception.
Ground Network. The core SSC ground network for Pléiades Neo will consist of the unique dual polar ground station solution of Kiruna, Sweden, and Inuvik, Canada — often referred to as “Kinuvik” as it is operated as a virtual single polar station.
The partnership also includes an option to provide potentially higher data volumes at a later stage, using the southern hemisphere station of Punta Arenas, Chile.
The optimized and highly resilient SSC ground network provides effective tasking and downloading of large data volumes more than once every orbit, enabling rapid delivery of Pléiades Neo data from anywhere on Earth.
The ground network has been designed by SSC and Airbus to complement Airbus’ Direct Receiving Stations (DRS) as well as the Airbus SpaceDataHighway relay satellite system, while being flexible to adapt to changing seasonal needs and to give critical network diversity.
“The Pléiades Neo constellation will be adding two million km² per day at 30-cm resolution to Airbus’ imagery offering. As tasking and downloading will be possible in every orbit, up to 60 times a day for the constellation, we need to rely on very efficient commercial polar communication services,” said François Lombard, head of Intelligence Business at Airbus Defence and Space.
“Pléiades Neo is a cutting edge very high resolution Earth Observation constellation, and this represents a huge milestone in the close cooperation between Airbus and SSC. We are proud to be able to support Airbus in providing such critical optical imagery for the global marketplace”, said Stefan Gardefjord, CEO at SSC.
Golden Software, a developer of software for data visualization and analysis, has released Version 14 of the Grapher scientific graphing package with new plotting and customizing functionality. Available today, Grapher 14 is downloadable by all users with active maintenance agreements.
A preview version of Grapher 15 is now available, giving active users pre-release access to new fit curve and statistical plotting capabilities.
“Grapher users will find we have focused overall on making the software easier to use in version 14 and the version 15 Preview,” said Leslie McWhirter, Grapher product manager. “New plotting functions were created as a direct result of feedback from users.”
The Grapher software gives users deeper insights into their data by providing them with 80 flexible and easy-to-use 2D and 3D graphing tools for plotting, analyzing and displaying scientific data sets. The package is used extensively by scientists and engineers in oil & gas operations, hydrologic/geochemical studies, environmental consulting, mineral exploration and academic research.
The most notable new or upgraded features in Grapher 14 include the following:
Enhanced Plotting – Ability to plot data in rows and columns, perform one-button Durov class plots, and easily generate multi-plot reports.
Improved Bar Charts – Bar charts are more versatile, offering variable bar widths and differentiated fill colors for negative and positive.
With Grapher 14 now available, Golden Software developers have already begun creating the Preview version of Grapher 15. This allows customers to try new functions relatively early in the development process and provide feedback before the final version is released.
“In Grapher 15 Preview, we are developing new features related to fit curve, axes and statistical functionality,” said McWhirter. “These will improve the ability of Grapher users to model, analyze and interpret their data.”
Specifically, these Grapher 15 upgrades will include:
Fit Curve Improvements – At the request of geologists, geophysicists, mining and oil-and-gas professionals, it is now possible to add X=F(Y) fit curves to model borehole log data. Fit curves can now also be added to class plots to model all or individual classes.
Axes Upgrades – Break Axes are enhanced so users can customize the break mark and add a break distinguisher to the plot itself. Ternary plots have also been upgraded to enable users to rotate the axis direction, a useful option in geochemical analysis.
Statistical Enhancements – Grapher 15 Preview will give users greater control over how values in Box-Whisker plots are graphed. In addition, there will be new mathematical options to expand on the functionality of the summation plot.
Other upgrades in Grapher 15 Preview will include the following:
Vary color fills above and below the intersection of two plots
Specify custom colors via RGB values to color scatter plot symbols
Assign colors from a gradient to scatter plot symbols based on numeric worksheet values
Grapher exports integrate seamlessly with all Golden Software packages, including Surfer for data visualization and mapping, Voxler for 3D data rendering, and Strater for subsurface modeling.
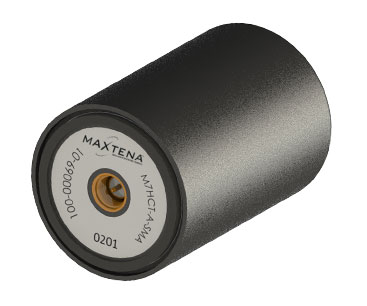
Maxtena Inc. has introduced a patented GNSS antenna designed for high-precision and autonomous multi-frequency applications. The M7HCT-A-SMA antenna is a high-accuracy, multi-frequency active quadrifilar helix GNSS antenna.
Photo: Maxtena
Maxtena is a U.S.-based antenna design and manufacturing company and inventor of the patented Dynamic Aperture Technology.
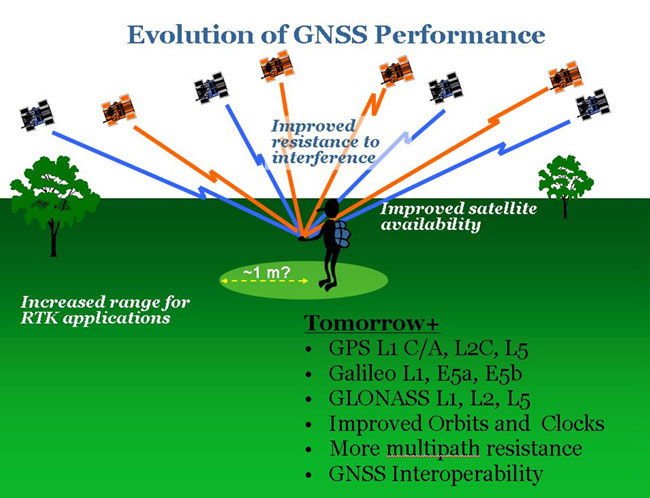
The new design will offer concurrent GNSS reception on L1: GPS, GLONASS, Galileo, Beidou and L2: GPS L2C, Galileo E5B and GLONASS L3OC in a rugged, compact and ultra lightweight form factor.
The antenna is designed for GIS, RTK and other high-accuracy GNSS applications such as the drone and automotive markets, where high performance and low weight are driving features in antenna selection.
The M7HCT-A-SMA active helix design features Maxtena’s patented compact and lightweight Helicore technology. This technology provides exceptional pattern control, polarization purity and high efficiency in a very compact form factor.
The antenna offers up to 30-dB gain for GNSS applications that utilize GPS, GLONASS, Galileo and Beidou, in one radome housing with a single SMA connector.
The M7HCT-A-SMA will join Maxtena’s line of rugged GNSS helix antennas that are ultra lightweight, small, and precise. The M7HCT-A-SMA weighs 25 grams and is housed in automotive grade PCB plastic with automotive grade electronics and is rated IP67 when mounted.
It is ground plane independent and offers extremely low power consumption and minimal phase-center variation over azimuth. The antenna offers superb axial ratio ensuring multipath error is mitigated.
“Maxtena is very excited to be launching a game-changing antenna for the UAV, drone, and automotive markets, and really for any application requiring a high performance, lightweight antenna that can cover so many frequencies. It is the most robust antenna solution on the market,” said Maxtena Vice President of Sales and Marketing Vanja Maric.
Everywhere we turn today, the term “smart” is attached to an item or to a process. Smartphones, smart cars, smart electricity grids, smart home appliances; you name it, someone is making it a “smart” item or process. Advancement in technology has increased computing power, expanded data storage capability, and has allowed for miniaturization of circuits and processors. This forward progress has led to the creation of these smart item/processes, and together creates the real possibility of making many of life’s tasks and normal operations more automated. This potential automation also brings new systems monitoring conditions of various entities and operations within our daily lives, such as increased efficiency of HVAC systems, utility metering that adjusts to our patterns of consumption and landscape watering that only provides water when needed.
In addition to the personal systems now being controlled with these machines, there is now revitalized interest in the creation of “smart cities.” The concept of this type of a civilized urban metropolis once existed only in science fiction, but technology has brought this concept to life in ways not imagined by the best of those writers. Surveyors have a big role in the development, installation and maintenance of these cities, so let us spend some time digging into the element that go into our future environments.
What is a smart city?
For those old enough to remember, the concept of a smart city only existed on “The Jetsons” cartoon from the early 1960’s, with cities in the sky, flying cars and some technological advancements that do exist today. While Orbit City may not come to fruition in the next several generations, many of the concepts of a smart city are taking shape today.
For the definition of a smart city, we go to the Google search engine and find the following entry from Internetofthingsagenda.techtarget.com: A smart city is a municipality that uses information and communication technologies to increase operational efficiency, share information with the public and improve both the quality of government services and citizen welfare.
Establishing a smart city requires forward thinking leadership and substantial funding to be created and maintained; however, the real function lies within the computing infrastructure and collection/manipulation of large quantities of data to create an environment of efficiency and conservation. A true comprehensive system combines available historical data, a collection of sensors and data collectors transmitting real-time information, and a powerful computing system containing analytical programming with extensive database functionality.
Is smart cities technology and adoption really that important?
Population trends worldwide continue to show that urban and suburban areas are expanding while rural areas are seeing a large reduction in residence. Several factors are at play, with technology being the central reason for the migration from the farm/small towns to the bigger cities.
Statistics show that in 1960, two billion people worldwide lived in rural areas while one billion lived in urban sections. As the population has increased drastically, the percentages for each category have reversed; in 2007, the two categories were equal and by 2017, the urban sector has jumped to 4.13 billion versus the rural population of 3.4 billion.
Chart: Our World in Data
Population experts estimate by 2050, upwards of 70 percent of the world’s population will be living in urban areas. Whether this population shift goes directly to the city centers or the less dense outskirts, municipal facilities and services will need to be upgraded and expanded with the continuing trend. Add to this surge the challenge to create a more sustainable environmental infrastructure and ecosystem, and it becomes a maintenance challenge and logistical nightmare. By using technology to create smarter infrastructure monitoring and management systems, the creation of smart cities with advancing technology will be key to successful and sustainable growth for municipalities and its citizens.
One of the biggest challenges faced by most municipalities is aging infrastructure. Utility systems, including water supplies and stormwater drainage, was installed several generations ago without a plan for replacement and/or expansion. Redevelopment in older urban areas are now taxing these aging systems well beyond their initial capacity, all while these facilities begin to fail simply because of continued use well beyond their original designed life span. Municipalities are forced to spend money on repairing and modernizing the existing infrastructure before entertaining the idea of upgrading new installations to “smart city” specifications. However, many municipalities are mandating that new developments and infrastructure improvements meet these specifications so any future upgrades can include computerized systems.
All these systems, new and future, will require extensive planning and mapping to be effective and efficient to justify their expense. Surveyors, utilizing a variety of tools based around high-accuracy mapping and data collection, can provide the necessary base information for these systems.
Where does surveying fit in?
Just as computers and electronic technology has allowed many industries to evolve, the surveying profession has also advanced with new methods and equipment. Our ability to perform advanced measurements and establish positional location information is critical in providing the base data necessary for smart city services. Previous surveying, mapping and record keeping systems were sufficient for the needs of the time period. However, these historical data points were nearly impossible to place into a single database simply because of one factor: georeferencing.
The surveyor has the unique responsibility of being recognized as expert measurer and locator of physical points on the ground in relation to property and boundary rights. It is because of this distinctive role within the community that the surveyor can provide a significant role in the development of the groundwork of a smart city. The introduction and implementation of newer technology and tools has allowed the surveyor to become a valuable member of the infrastructure mapping team. It always hasn’t been this way and the surveying profession shoulders most of that blame.
Past promises: digital vs. smart
Many surveyors will make the argument that our profession has been ahead of the game for years with our data collection processes having been transformed from notes in a field book to electronic devices. Digital data, however, isn’t necessarily smart data as many factors go into establishing the difference. The physical form of the survey information has no direct correlation to the basis of the data; in this case, the records need to be based upon a spatial reference frame rather than an assumed data system.
Also on the topic of spatial reference systems, we can also address the lack of respect given to geographical information systems (GIS) from surveyors during its initial introduction and implementation. GIS was discounted as a convoluted graphical database not sophisticated enough for the high-accuracy world of surveying. Little did the surveying profession know that GIS would become the spatial basis for many mapping systems and be utilized in millions of locations worldwide. Only now does the surveying community realize that we missed the bandwagon and can help to provide the crucial link between spatial data and actual points on the ground in relation to physical improvements and property ownership.
Another digital platform not initially embraced by the surveying community is building information modeling or BIM. This software is a three-dimensional modeling program used mostly by architects and mechanical engineers for depicting and designing buildings and plumbing systems. One of the advantages of BIM versus traditional CAD is a database information link containing data regarding the entities within the BIM. Among the attributes contained with BIM are documentation, spatial reference, time, cost, operational applications, and related applications (contracts, purchasing, suppliers, procurement solutions, etc.). The existing spatial data necessary for this system can be supplied by surveyors using a variety of methods but not many have implemented the software.
Technology, availability, cost of entry and overall usefulness
Surveying instruments and measuring techniques has turned a significant corner in the past two decades. While conventional measurement methods are still used (including steel tapes, laser-based total stations, and GNSS receivers), more types of sensors are being introduced to enhance the accuracy and expand the volume of data points being collected. Scanners, using phase-based and time-of-flight methodologies, are now more popular than ever as ease of use has increased while the cost of ownership has greatly decreased. Ground-based and mobile LiDAR used to be only available to large firms and the government, but new models are being introduced at price points affordable to many surveyors. Many articles have been written regarding the lightspeed adaptation of surveying, engineering and construction firms with UAV use of photogrammetry methods to quickly map areas that were previously inaccessible and meeting standards not thought possible. We are also seeing more implementation of new scanning methods, including SLAM (simultaneous localization and mapping) using handheld and backpack devices.
The common thread for all these technologies and methods is one thing: georeferencing. What was once nearly impossible is now a reality; data collection from various methods all being located within a common horizontal coordinate and vertical datum systems. The ability to obtain literally millions of data points with high-accuracy horizontal and vertical values is phenomenal with most of the credit going to the United States Department of Defense and their implementation of the GPS. Yes, the technology of scanners and data collection would have been invented without the overall coordinate tie-in but having the ability to reference that same data to a common system is the key.
Also key to the smart city data collection methodology is the surveyor as the expert measurer. A trained and experience surveyor can lead the data collection of significant projects, including location of existing improvements and establishment of future installations. From establishment of parcel/right-of-way lines to integration of point clouds from scanners and photogrammetry, the surveyor can assemble this data together to provide the groundwork for successful analyzation and planning. By combining data from various areas of a municipality, including utility atlases, existing improvements, and future expansion plans, a database can be created in which a smart city will rely upon for oversight and monitoring. The surveyor fills a vital role to determining the accuracy and effectiveness of data like no other profession and should not be overlooked when assembling a team for the creation of a smart city.
Future opportunities
Like all technological discoveries and enhancements before, the future is bright with many possibilities to increase the effectiveness and efficiency of a smart city. More types of sensors are being introduced on a regular basis and in every way imaginable, including wireless communication, RFID tags, and microelectromechanical systems (MEMS) devices.
One of the latest buzzwords is the “Internet of Things” (IoT), with many new devices being created to interconnect a network of web-enabled computerized devices using microprocessors, a variety of sensors and wireless communication hardware to gather, transmit and perform actions on information acquired from their environments. IoT presents advantages to users by enabling them to monitor their overall business processes and improve the customer experience. These actions can also precipitate changes to allow the company to save time and money, enhance employee productivity, integrate and adapt business models, make better business decisions, and generate more revenue.
As discussed in previous articles (GPS World March 2018 and GPS World November 2018), the next big technology to look forward to is the telecommunications upgrade to 5G. Once a full 5G network is running with extended coverage, we can look forward to new opportunities for indoor location services with similar accuracy to our existing GNSS capability.
What’s next?
The technology sector will continue to push the limits of computing speed, physical size and data capacity looking for the “next big thing.” The surveying profession has enjoyed many of the fruits of that success so one has to imagine that many more advances will be coming soon. Smart cities will continue to evolve as citizens of Earth keep migrating to the urban areas and forcing the existing infrastructure to expand or face failure. Surveyors will continue to help provide a variety of services to those citizens and municipalities, with an eye on the future for more advancing technology. I can’t wait to see what is next.
Global Mapper v.20.1 offers a new zoom tool in the path profile view. (Photo: Blue Marble Geographics)
Blue Marble Geographics has released Global Mapper v.20.1, the latest version of its GIS software. According to the company, version 20.1 offers a wealth of new and updated geospatial tools, as well as performance improvements throughout the application.
Enhancements to version 20.1 include a new zooming function in the path profile window, a digitizer tool for automatically closing gaps between features and, for lidar module users, a point proximity query function.
Global Mapper’s path profile tool, which is used to create a cutaway view of a terrain layer or point cloud, now offers a simple way to zoom in the view for a close-in perspective of a specific area, the company said. It also now includes a new legend display that differentiates each individual layer when multiple overlapping surfaces are displayed.
The software’s digitizer now includes a simple tool for eliminating slivers or overlapping areas from adjacent features, ensuring the topological integrity of the data. In addition, users can now use an added option that allows the establishment of a default projection, with every imported layer automatically reprojected to adhere to this system.
Finally, version 20.1 release offers new and upgraded functionality in the lidar module. The module now features a proximity search function that highlights points of a particular classification within a certain distance of other point types or line features.
“The release of version 20.1 of Global Mapper provides a perfect illustration of Blue Marble’s unique, user-focused development philosophy,” said Blue Marble’s President Patrick Cunningham. “Each of the major new features and functions, including the new Path Profile tools and lidar proximity querying, is directly attributable to specific requests from our customers. We encourage all Global Mapper users to continue this line of communication to ensure that the software is meeting everyone’s needs.”
Topographic surface with well sample data and water level. (Image: Golden Software)
Golden Software, a developer of scientific graphics software, has enhanced the visualization capabilities in version 16 of its Surfer gridding, contouring and 3D surface mapping package. Geologists, environmental consultants and geospatial professionals can use Surfer 16 to interpret complex scientific data.
“We have improved every aspect of core functionality in Surfer 16 so it’s faster and easier to make meaningful custom maps,” said Golden Software CEO Blakelee Mills. “Surfer users will find the new version generates more accurate representations of physical, chemical and structural properties, allowing them to make better decisions.”
Surfer is a robust 3D data visualization and mapping software that enables users to model their data sets, apply an array of advanced analytics tools, and graphically communicate the results. Known for its fast and powerful contouring algorithms, Surfer is used extensively by geologists in mining and oil & gas activities and by hydrologists in environmental monitoring projects.
The primary improvements in Surfer 16 have been made in the color mapping and Contour Map capabilities:
Equal Area Stretch. Similar to Histogram Equalization, this new feature lets the user stretch colors across the distribution of data, creating a proportionate representation of the data variation and enhancing the visualization’s contrast. This means that tightly distributed data can be displayed as quickly varying colors in the generated colormap, making it easier to spot anomalies in data values. Colors can be stretched automatically or manually across the histogram of data values.
Equal Area Contouring. Another new feature added to surface mapping functionality, Equal Area Contouring allows the user to calculate the geographic distribution of contours so they align more precisely with the geophysical data they represent. This results in a more accurate visualization of geophysical data sets, which are seldom linearly distributed.
“The combination of Equal Area Stretch and Contouring creates striking visual maps that vividly highlight data distribution,” said Mills. “This makes it easier to interpret and understand geophysical and geochemical concentrations in the subsurface.”
Surfer 16 includes three other enhancements:
True 3D Point Data. Surfer has always accurately displayed lidar point cloud data, and this 3D visualization capability has been expanded. Now any 3D vector data can be represented in three dimensions in 3D View. Clients who use Surfer to visualize subsurface wells can use this to display the well path. It can also be applied to quickly check the quality of 3D grids.
Enhanced Attribute Management. Surfer now has commands to calculate geometry — such as area or perimeter length — and add those values to object attributes. These calculations can be performed either to create new attributes or modify existing ones with updated information. One of the key advantages of this enhancement is that area data can be normalized and attributed to objects for generation of more accurate choropleth maps.
Kriging with External Drift. Surfer is known for its powerful kriging functions, and this capability is even better in v16 with the addition of Kriging with External Drift. This allows users to add a secondary data set for use as a proxy in interpolating the primary data set with the goal of yielding better estimated values. Surfer users asked for this new function because it typically lets them obtain and use less expensive data sets to supplement a more expensive one.
“Surfer has a reputation for high-quality graphic outputs, powerful gridding algorithms, and ease of use – and we have improved each of these capabilities in Surfer 16,” Mills said.
LandViewer, a cloud service developed by EOS Data Analytics, provides access to satellite data and fast-paced analytics. In recent months, it has undergone numerous updates, which have expanded the existing catalogue of satellite imagery, introduced more tools for analysis and added other new features.
By the end of 2018, free space and airborne data available for browsing, analysis and download via LandViewer included imagery from the European Space Agency’s (ESA’s) Sentinel-2 and Sentinel-1, NASA-USGS’s Landsat 8 and previous missions, MODIS, CBERS-4 and NAIP.
This broad selection of Earth observation data has grown even larger with the addition of high-resolution commercial imagery from Airbus, SpaceWill and SI Imaging Services.
LandViewer has evolved into a single platform. On top of open-source data, users can freely explore the potential of commercial data with global coverage, short revisit periods, and spatial resolution up to 40 centimeters.
The current catalogue includes imagery from Pléiades 1a/1b, SPOT 5, SPOT 6 and SPOT 7, along with KOMPSAT-2, 3, 3A and SuperView. The high-resolution imagery browser offers free preview, automatic price calculation by selected area, and fast image delivery within three business days via cloud EOS Storage.
Preview of KOMPSAT-3A image collected over Shanghai Hongqiao International Airport on Oct. 29, 2018. (Photo: EOS)
Long-term observations. An abundance of available data, such as weekly updated Sentinel-2 imagery and historical Landsat data, has made it much easier to monitor changes over long time spans. Rather than taking a long time to select and process years of satellite data to get a multitemporal perspective, the LandViewer’s new Time Series Analysis will crunch the remote sensing data and deliver the results in an easily interpretable graph.
Sentinel-2 time series graph generated for agricultural fields in Kansas state. (Screenshot: EOS)
Users can select an area of interest (AOI), and a satellite dataset and a time period between 1 month and 10 years. The algorithm can then pick all imagery with minimum cloudiness and calculate NDVI, NDWI or NDSI in just a few moments. By default, the generated Time Series graph contains lines (representing the min, max, mean and std values) that can be hidden or displayed for convenience; whenever an unusual spike or drop in values is noticed, a satellite scene that represents that part of the curve can be visualized to establish the cause. The results can be downloaded either as an image (.png), or a .csv file for working in Excel.
Enhanced vegetation analysis. Users searching for an in-depth look at vegetation cover can use LandViewer’s new spectral indexes: SAVI, EVI, ARVI, GCI, SIPI and NBR. These indexes complement generalized NDVI analysis by making corrections for atmospheric and topographic effects or soil brightness influences, depending on vegetation density, climate and elevation in the area of interest.
The NBR index is designed to highlight burned areas against healthy vegetation; the difference between pre-fire NBR and post-fire NBR values can be applied to estimate the severity of burn.
The use of several indexes simultaneously enables better insight into plant health and helps to identify stressed or infected vegetation at an early stage.
Sentinel-2-derived SAVI analysis of an arid agricultural region in Saudi Arabia. (Screenshot: EOS)
User-friendly legend and area calculation. Another new LandViewer feature, the index legend, is designed to solve the problem of interpreting the index results, a common issue for new users. Now when a spectral index is applied over the selected territory, the user can view a detailed legend, where each color-marked class contains a short description.
For example, calculation of NDVI will identify and highlight areas with “dense”, “moderate”, “sparse vegetation”, “open soil” or “no vegetation”.
Screenshot: EOS
Another new time-saving functionality is that the area of each class within the spectral index legend is calculated automatically, in both square meters and by percentage.
Also, the expanded Area of Interest (AOI) tool enables bulk uploading of AOIs and speeds up work by allowing simultaneous visualization and fast switching of all AOIs on a map for imagery searches or new scene subscription.
Advanced zone analytics. By introducing the clustering function, EOS’ remote sensing experts and software developers have taken LandViewer’s spatio-temporal analytics to the next level. With this function, users can run unsupervised satellite data-based classification of an area up to 200 square kilometers into as many as 19 clusters (or zones). This process involves setting custom parameters (size/number of zones) and waiting a few moments for LandViewer to build a raster image of the area with color-marked zones, and a vector layer outlining the boundaries. Both outputs can be downloaded.
This scalable analysis can provide various insights across agriculture, forestry, coastal monitoring and other industries. For example, a farmer can make use of convenient color mapping of zones within the field based on NDVI values for precise in-field navigation and crop management.
Engaging animations. With the informative spectral data contained in satellite image pixels, LandViewer has introduced a time-lapse animation feature allowing journalists and active social media users to create engaging animated stories and share them on the internet. Each GIF can contain up to 300 scenes, with indexes or band combinations applied. From calving of glaciers to construction of new stadiums, satellite imagery is full of information that’s worth watching and sharing with the world.
Hexagon AB has signed an agreement to acquire Thermopylae Sciences and Technology, a software provider primarily focused on the U.S. government and defense market that specializes in geospatial applications, mobile frameworks and cloud computing for enhanced location intelligence.
Thermopylae has developed advanced visualization solutions to support tactical edge mapping in support of mission critical operations. Built upon the Google technology stack, its defense and intelligence solutions are targeted at addressing the challenges involved in working with critical problem sets in secure or classified government environments.
In addition, its portfolio is applicable to a host of markets in the private sector, including real estate, finance, insurance, retail and media, with customers ranging from startups to Fortune 50 companies.
“Thermopylae’s software and domain expertise nicely augment our ability to deliver the visual location intelligence necessary for enabling autonomous connected ecosystems,” said Hexagon President and CEO Ola Rollén. “Ultimately, the addition of Thermopylae will enrich the 5D experience delivered through our Hexagon Smart M.App and Luciad portfolios — both of which enable smart digital realities with 3D, 4D (real-time sensor feed integration) and 5D (dynamic analytics) capabilities. Not only does the acquisition provide an avenue for international market adoption of Thermopylae’s technologies but also an additional avenue for Hexagon to accelerate adoption of our 5D visualization capabilities in U.S. government agencies.”
Headquartered in Arlington, Virginia, Thermopylae will operate as a part of Hexagon’s Geospatial division, which is reported under the Geospatial Enterprise Solutions segment. Sales in 2017 amounted to $20 million.
Completion of the transaction (closing) is subject to customary regulatory approvals, including a voluntary filing to the Committee on Foreign Investment in the United States (CFIUS).
Airbus Defence and Space has launched The OneAtlas Platform, a collaborative environment to access premium imagery, perform large-scale image processing, extract insights and benefit from Airbus assets for solution development.
OneAtlas is offering a 30-day free trial, giving customers streaming access to imagery, sample change detection reports, and global imagery and data layers, including the basemap and the WorldDEM.
Besides access to a comprehensive archive with premium imagery, users can try services such as:
Ocean Finder for the maritime industry
Verde for precision agriculture
Starling for forest management
Earth Monitor for tracking changes over an area of interest
The developer portal provides more information through API documentation and discusses how to benefit from the imagery either in streaming or download format.
The Ocean Finder provides a satellite-based maritime ship detection service. (Photo: OneAtlas)