Trimble has opened its Call for Speakers for the Trimble Dimensions+ 2022 User Conference to be held November 7-9 at the Venetian Resort in Las Vegas.
The Dimensions+ User Conference will promote a variety of sessions highlighting groundbreaking technology that can be used to transform work and push for a sustainable future. Speakers will have the opportunity to share their industry experiences and insights with peers from around the globe. The conference will also provide an Offsite Experience where attendees can learn how professionals are using the latest technologies to create a safer, greener and more productive work environment.
Session topics will include autonomy; building design, construction and operation; civil engineering and infrastructure; forensics; forestry; local, state and federal government; land administration; mapping and GIS; marine construction; mobile mapping; monitoring; photogrammetry and remote sensing; scanning; surveying; utilities; sustainability and more.
Proposals for speakers will be accepted through March 31, 2022 and notifications of acceptance will be made in the following months. Proposals can be submitted here.
To register for the conference or learn about sponsorship opportunities, visit Trimble’s website.
“The tasks of paleontologists and classical historians and archaeologists are remarkably similar — to excavate, decipher and bring to life the tantalizing remnants of a time we will never see.” — Adrienne Mayor
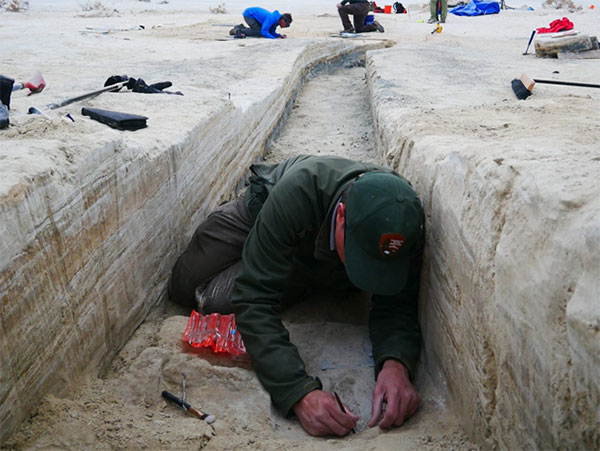
Heatwaves rose up from the dusty, dry, cracked ground. Tiny black flies buzzed around the team’s eyes and faces. The only shade was under a canopy erected across the shallow open trench where half a dozen people gently brushed away the layers. Dirt is time; the deeper one digs, the further back in time one goes.
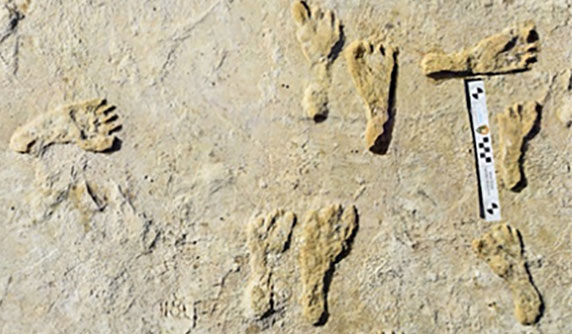
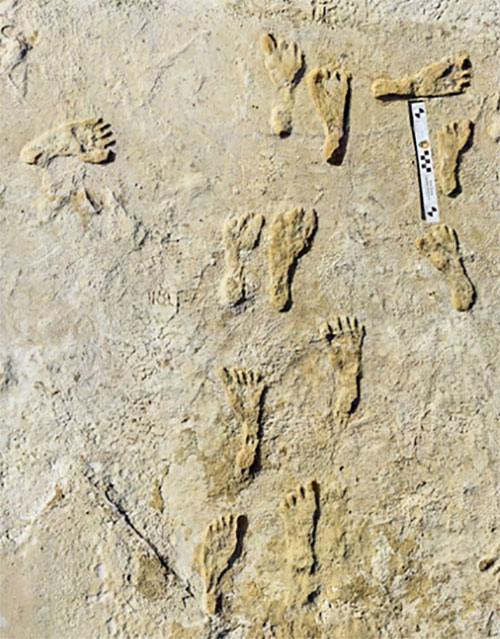
A layer 23,000 years old is exposed at nearly two feet down, revealing footprints of a female and a toddler. It tells a story of her mile-long journey through the soft clay mud. Roaming nearby was a giant sloth and a herd of mammoths. This discovery forces science to re-adjust the timeline of humans living on the North American continent, pushing it further back into the Pleistocene era at least 10,000 years.
Discoveries like this are the treasures archeologists seek. Archaeologists are scientists — part treasure hunters and part storytellers. They add context to history.
A trench dug into the brown gypsum soil on a lake playa in White Sands National Park reveals more human footprints below the surface. (Photo: National Park Service)
Ground-Penetrating Radar
Advanced technologies are aiding new discoveries of the past. Even though the footprints were buried beneath two feet of dirt, they were discovered without physically seeing them. Ground-penetrating radar (GPR) made the discovery possible. GPR has made significant advancements in recent years, along with improvements in other types of remote sensing applications.
The resolution of GPR has improved along with the depths that GPR can detect objects. Computers can process the GPR data into 3D images providing a depth profile of the scanned area. This is how the footprints were detected.
White Sands has the largest collection of fossilized human footprints. (Photo: National Park Service)
In addition to GPR, the researchers used magnetometers that verify disturbances in the sediment, which can also be imaged in 3D, albeit with a much lower resolution.
“The sediment itself has a memory that records the effects of the animal’s weight and momentum in a beautiful way. It gives us a way to understand the biomechanics of extinct fauna that we never had before,” said Thomas Urban, the Cornell University research scientist who led the team making the discovery.
Usually, archeological findings are of bones and artifacts. Fossilized “ghost” footprints of humans and other creatures brings them to life, providing glimpses of the living past.
Under ideal conditions, GPR can reach depths of 30 meters (98 feet). The accuracy and range of GPR depend on sediment type, moisture content and other geologic morphologies. Underlying GPR technology and magnetometry are robust geospatial information systems (GIS) that preserve a digital record of the discovery, allowing for further geospatial analyses. Advances in machine learning will improve future detection.
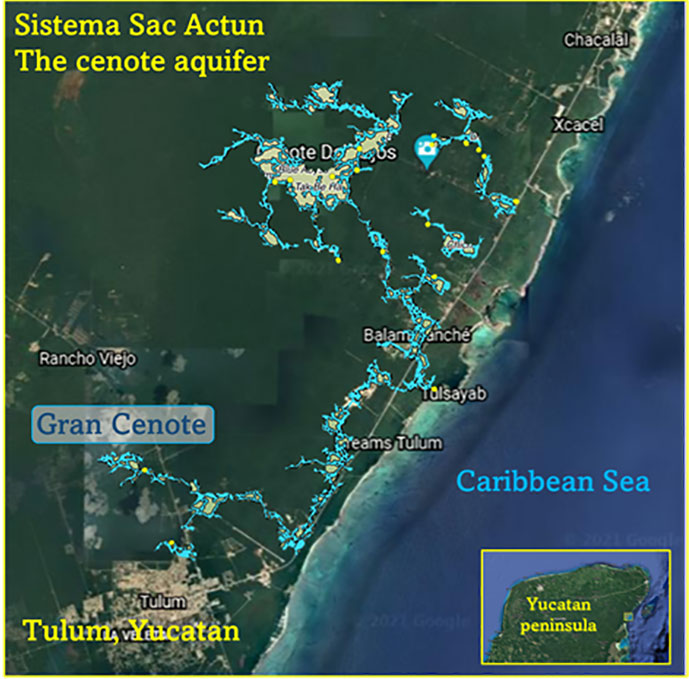
Elsewhere in the Americas, a project has been ongoing in Mexico since the 1990s using GPR to map the cenotes and underground aquifers used by the Mayans. A 215-mile-long underground water cave system — the longest in the world — has been mapped in the Yucatan peninsula. Divers exploring these cenotes found remains of Ice Age animals, including a sabertooth tigers and mammoths.
Map: William Tewelow
Lidar and ALS
Lidar (light detection and ranging) is making even more discoveries possible with the help of artificial intelligence and machine learning. For instance, in the jungles of Guatemala, lidar revealed the unknown ancient Mayan city of Tikal.
Lidar is an active sensor that measures ground height. Using an airborne laser scanning (ALS) system mounted to a plane, helicopter or UAV, the lidar device’s laser beams scan the landscape. The system calculates the time it takes for the beam to reach an object on the ground and bounce back.
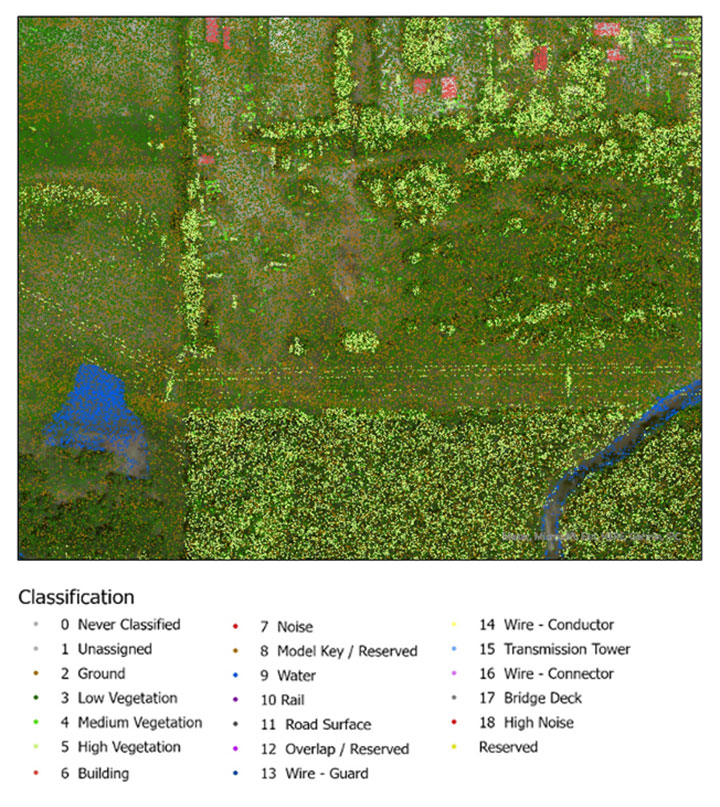
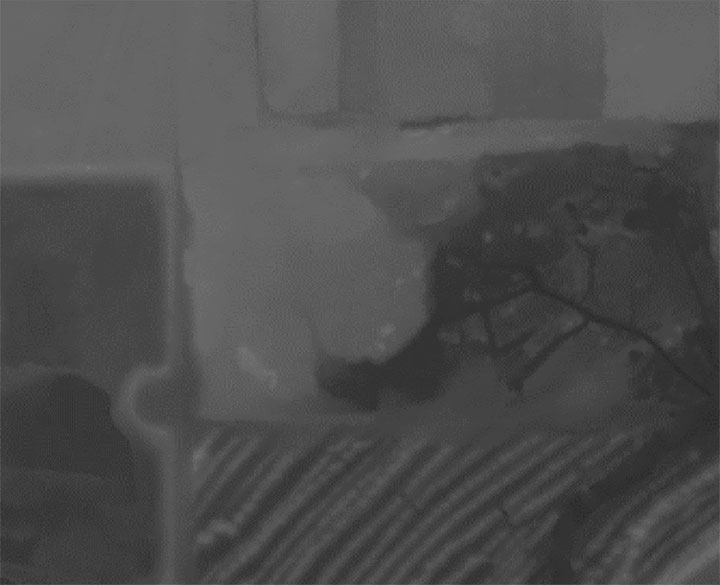
The result generates one point for each ground object the laser touches, calculating the distance the beam traveled. Billions of points are collected during a scan. Geospatial archeologists then process the collected points into a point cloud (Figure 1). Selecting only points classified as ground and water, the points are converted to a raster image, and archeologists are provided a perspective of the bare earth under tree canopy and vegetation (Figure 2).
In this way, lidar serves as a non-destructive way to identify earthwork formations, even in dense jungle.
Figure 2. Lidar points are converted to a raster providing a bare-earth representation of the landscape. (Image: Stephanie Clark)
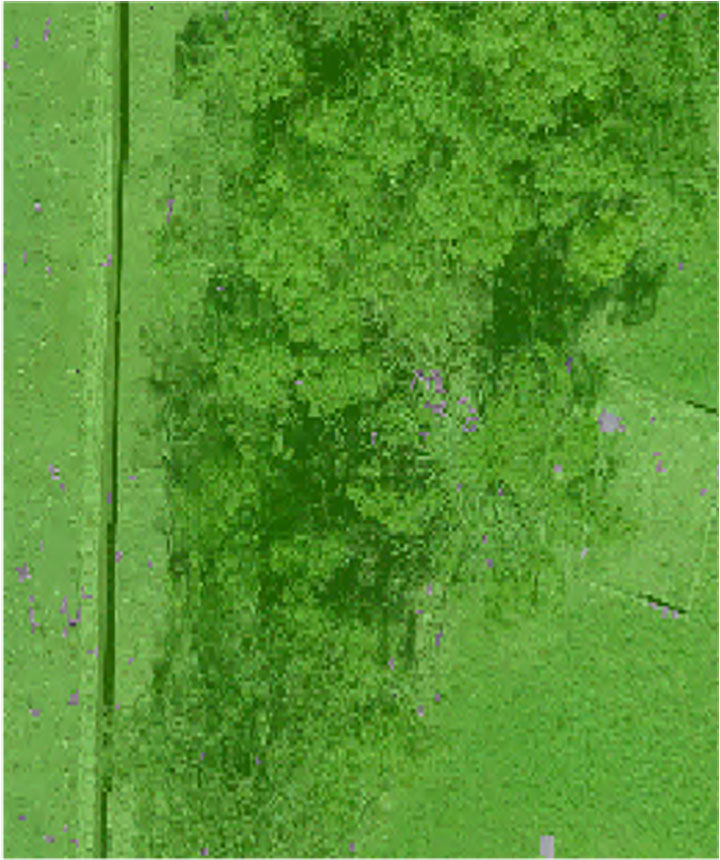
Figure 3. Pixel-derived object-based classification, developed using machine learning, identifies unmarked headstones from UAV-collected imagery. (Image: Stephanie Clark)
Object-Based Imagery Analysis
The challenge with lidar and imagery is the sheer volume of data, beyond the scope of what a human can manually review. Because of how faint archaeological features can be, the search often requires manipulating imagery datasets by combining multispectral bands, and then merging them with topographical data. To assist this huge endeavor, artificial intelligence is applied to pixel-based classification and object-based imagery analysis (OBIA) to highlight areas of interest for further study.
Dylan Davis, a Ph.D. candidate at Pennsylvania State University, spearheaded the use of OBIA for finding earthworks such as circular mounds, stone walls,and roadways in Beaufort, South Carolina. He took advantage of high-resolution NOAA imagery taken of the coast before the hurricane season of 2008. Using artificial intelligence for object-based imagery analysis, 160 previously undetected mound features were found.
Raster comparison: Sea Pines Shell Ring, Hilton Head Island, South Carolina. Credit: Dylan S. Davis, Matthew C. Sanger & Carl P. Lipo (2018): “Automated mound detection using lidar and object-based image analysis in Beaufort County, South Carolina,” Southeastern Archaeology [https://doi.org/10.1080/0734578X.2018.1482186]On the local level, archeologists apply the same approach to finding headstones in unmarked cemeteries. A pixel-defined object-based classification system helped one researcher automatically identify potential headstones in a densely vegetated cemetery.
The technology used for OBIA is also used for visual-inertial odometry (VIO). NASA is experimenting with VIO techniques to help astronauts navigate the lunar surface (see NASA’s Artemis program will need lunar spatial reference system). For Artemis, VIO will use the Moon’s craters as a reference system to derive an accurate position.
Virtual 3D Worlds
Perhaps one of the most significant uses of technology for archaeological research and exploration is the use of virtual 3D immersive worlds. Exploring ancient worlds as they might have looked gives archaeologists additional insights and the public a chance to experience their discoveries, connecting us with history.
The mile-long journey of a young female carrying a toddler across an Ice Age landscape 23,000 years ago seems so distant, yet so familiar to any parent. The image breathes life into our common ancestry. Through the power of GIS and modern technologies, she walked right into the 21st century.
“The man who knows and dwells in history adds a new dimension to his existence…He lives in all time; the ages are his, all live alike to him.” — William Flinders Petrie
Special thanks to Stephanie Clark, a geospatial archeologist with Integrated Environmental Solutions, LLC, of Phenix City, Alabama. Stephanie provided technical advice and collaboration, and the lidar studies for Figures 1, 2 and 3.
William Tewelow is a senior aeronautical information specialist for the Federal Aviation Administration. He is a 2016 graduate of the FAA’s management fellowship Program for Emerging Leaders and a mentor with the FAA’s National Mentor Program. He served on special assignment to the U.S. Department of Transportation and led a national strategic geospatial initiative under the authority of the White House Open Data Partnership.
Tewelow is a designated Geographic Information Systems Professionals (GISP), with degrees in geographic information technology and Intelligence Studies. he is currently earning his master’s degree in organizational leadership with a focus on performance management.
Tewelow retired from the U.S. Navy after serving 23 years as a geospatial and imagery intelligence specialist, a naval aviator, a meteorologist and a tactical oceanographer earning three achievement medals. He was among the first in the nation to earn a Geospatial Specialist Certification from the U.S. Department of Labor while working at NASA Stennis Space Center. He is married, enjoys traveling, connecting people, and solving problems, and is interested in new technology. His favorite quote is, “A man’s mind changed by a new idea can never go back to its original dimension.” ~ Oliver Wendell Holmes
Geospatial mapping company GeoSLAM has expanded its mining offerings.
The company also announced an automated processing platform, GeoSLAM Connect, which provides users with the flexibility to process data to their specifications through interactive, customizable script-based workflows.
The new innovations can be used alongside GeoSLAM solutions already available, including GeoSLAM Volumes for stockpile volumetric calculations.
GeoSLAM Production Progress Mapping allows operators to make short-term decisions on newly mined production areas when coupled with the ZEB scanner and its own internal coordinate system. Once the data from each scan has been automatically processed and georeferenced using GeoSLAM Connect, it can be uploaded to compatible third-party software. Operators can overlap collected data and precisely visualize changes over time to compare with project plans.
Convergence Analysis provides mine owners with a rapid and cost-effective way to understand the environment while keeping miners safe by measuring rock support at a safe distance.
A shaft inspection cradle is built for collecting data during inspections and analyzing change. It allows users to understand the erosion of a shaft wall, view blockages and identify hanging points for ore in hard-to-reach shafts.
The Maptitude 2021 ZIP Code Business Count data are available now. The update includes the total number of businesses by type (by six-digit North American Industry Classification System or NAIC” codes, formerly known as SIC codes).
For each business type (for instance, full-service restaurants), users can map the number that fall into each employment size category (for instance, full-service restaurants with 1-4 employees, full-service restaurants with 1000+ employees, etc.).
These data are useful for businesses and market research analysts because they allow analysis of market potential, measuring the effectiveness of sales and advertising programs, setting sales quotas, and developing budgets. Government agencies use the data for administration and planning.
The ZIP Code Business Count data are free for Maptitude 2021 users, and is also available as shapefile, KML, KMZ or GeoJSON for a fee.
A new map detailing the location, height and canopy for trees more than 3 meters in height is helping Sevenoaks District Council manage its iconic ancient trees and natural woodland.
Derived from Bluesky’s National Tree Map, which provides geospatial intelligence for more than 300 million trees across the United Kingdom, the data has already been used to create a district-wide map of tree cover, to create 3D visualizations to inform development decisions, and to support planning enforcement investigations.
Sevenoaks District Council originally purchased National Tree Map data from Bluesky in November 2019, and the data is widely used across the council with specific applications in planning.
Updated this year, the original and new tree-map layers are stored in the council’s GIS alongside multiple years of aerial photography, Ordnance Survey maps, data such as Ancient Woodland and Biodiversity Opportunities, and council data including Tree Preservation Orders and Planning Applications. The tree data is accessible to all staff via the council’s intranet mapping system GISMO (GIS Online).
The name Sevenoaks (the name given to the town and more recently to the district) dates to circa 800 A.D. and is thought to be derived from “Seouenaca,” the name given to a small chapel near seven oak trees. Records of these trees through the ages are sparse; it is not until the 19th century when a group of seven trees appears on an Ordnance Survey map.
The eponymous oak trees have been replaced many times over the years, including the planting of seven oaks to commemorate the coronation of Edward VII in 1902 and tree planting by personnel from the Canadian Air Force in 1947 in gratitude for being billeted in the town.
Bluesky’s National Tree Map is created using innovative algorithms and image processing techniques in combination with the most up-to-date and detailed aerial photography, terrain and surface height data, and color infrared imagery.
In addition to the three vector map layers — Crown Polygons, Idealised Crowns and Height Points — the Bluesky National Tree Map also includes an attribute table with unique identification for each crown feature, height attributes and area calculations.
In 2019, the City of Hobart Sanitary and Stormwater District (HSD) in Hobart, Indiana, recognized the benefits of geospatial technology and location intelligence to transform the city. HSD reached out to Geographic Technologies Group (GTG) to write and implement a geographic information system (GIS) strategic plan.
GTG is one of the world’s leading local government GIS companies, working to advance the science of location intelligence and geospatial technology. GTG built a GIS strategic plan for HSD using high-resolution aerial imagery from Nearmap to help build on the city’s need to deliver geospatial data to customers.
“Our content integrates easily with GTG’s applications and acts as a valuable component to their strategic planning services,” said Karl Terrey, director, Global Alliances at Nearmap. “Our imagery is refreshed multiple times per year and when combined with GTG’s technology allows governments to make decisions based on conditions in their communities in near-real-time.”
Image: Geographical Technologies Group
Before GTG, HSD was maintaining a GIS viewer web app that was not user friendly, and thus underutilized.
HSD leaders recognized the need for an interface that would serve the district as well as other city departments while being easy to navigate. Nearmap’s technology corrected this, by equipping users with controls that were customized to address all the needs of its users.
Image: Geographical Technologies Group
“Our goal has always been to solve problems, and introduce a new kind of decision support for our clients,” said James Kelt, VP of Corporate Software at GTG. “Our clients love the imagery and the more we worked with Nearmap, the more we’ve been able to provide this added value to our customers.”
With the help of the user-friendly ArcGIS Hub, where citizens could access GIS tools, and GTG’s new program, the city of Hobart gained greater citizen engagement that allowed them to find information for themselves.
NV5 Geospatial has launched Trim Optimization, a predictive modeling platform that enables electric utilities to enhance vegetation management programs with risk-based assessments.
Using information from existing lidar and historical data, utilities can leverage Trim Optimization to prioritize tree-trimming activities by taking into account the risk posed by individual trees and other operational constraints.
“Trees are to blame for a large percentage of outages, and vegetation management is the single biggest cost for electric utilities. Yet, utilities have only started to look at proactive, risk-based management programs, rather than the traditional cycle-based ones,” said Ian Berdie, vice president of innovation for NV5 Geospatial. “NV5 Geospatial’s Trim Optimization platform will help utilities improve grid reliability through better decision making, while also saving them money through greater efficiency and the ability to target areas that have the most potential for problems.”
Vegetation is one of the largest sources of outages, accounting for more than half, according to a recent survey, “Geospatial Analytics, Resilience and Extreme Weather Readiness.” The majority of respondents also noted that they use data to analyze risk, but budget constraints often prevent them from investing in the data they need.
The trim optimization platform takes a phased approach to identify relative risk to target vegetation management work where it will have the most impact. With extensive expertise, NV5 Geospatial first identifies several attributes associated with vegetation-caused outages that can be modeled from high-density lidar and provide a relative risk score.
Utility-specific data, such as historic tree failures information or other factors, can be analyzed to enhance results further.
The final risk scores will provide a quantitative assessment of combined risk, enabling utilities to develop work plans that prioritize vegetation management mitigation efforts and result in greater operational efficiency.
NV5 is holding a webinar on Trim Optimization on Aug. 25. Register here.
The research satellite will in collecting high-quality, high-resolution data for terrestrial, coastal and ocean ecosystems for a three-year period after launch, according to Matthew McCabe, director of the KAUST Climate and Livability Initiative. McCabe described the launch as a qualitative process for the Kingdom’s efforts in the field of protecting and restoring ecosystems on land and at sea.
A CubeSat is a small satellite consisting of one or several 10x10x10 cm units, no more than 1.33 kilograms per unit. CubeSats can range from 1 unit (1U) to 12 units (12U). The KAUST satellite is 6U.
“In the past, launching a satellite was the sole domain of governments, with costs well beyond the reach of a university,” McCabe said. “CubeSats are helping to democratize space, providing the opportunity to launch a customized platform at a fraction of the traditional cost.”
The data collected will provide high-resolution details about current conditions of ecosystems in the region, and monitor improvements from environmental management strategies, supporting the Saudi Green Initiative among others.
The CubeSat is equipped with Spire’s GNSS reflectometry reflectors, as well as a hyperspectral imaging sensor. It is supported by advanced capabilities in processing and artificial intelligence.
The satellite will allow KAUST University researchers collect and analyze high-resolution images of the Earth’s surface for detailed mapping of terrestrial environments, monitoring of vegetation cover status, exploration of coastal ecosystems and coral reefs, development of precision agricultural research, and a host of other Earth and environmental science applications.
The imaging sensor can image areas of interest anywhere in the world across more than 30 user-adjustable spectral bands. The sensor data can be combined with Spire’s GNSS receiver to monitor micro-environmental variables such as soil moisture, helping in many areas such as agriculture, forestry and land management.
“The capacity to observe the Earth in high-resolution hyperspectral detail will allow for the production of enhanced metrics to map and monitor change anywhere in the world,” McCabe said. “Closer to home, Saudi Arabia is focusing considerable effort towards the protection and restoration of its precious terrestrial and ocean systems. The data from this KAUST CubeSat will be invaluable in providing new information on both the state of existing ecosystems, and for monitoring changes resulting from improved management strategies – something that can be used to support aspects of the Saudi and Middle East Green Initiatives.”
SPH Engineering has updated its UgCS software with a lidar toolset for UAVs. The toolset is designed to unlock the full potential of lidar sensors, making remote sensing more effective without human errors. Key features include precision calibration, flight patterns for route planning, anti-shake turns, and constant line spacing and buffer.
The UgCS lidar toolset allows users to optimize time and cost-effectiveness at all stages of data collection and processing. Time is saved on mission planning with flight patterns and turns designed for lidar surveys. During flight, users can acquire high-quality laser data with preset inertial measurement unit (IMU) initialization patterns and anti-shake lidar turns. During post-flight data analysis, the high accuracy of acquired data ensures users can get the desired results with one trip to the field and quality data analysis.
“We have received various requests from lidar producers and end-users to improve the accuracy of laser data collected with a UAV,” said Alexei Yankelevich, head of software development at SPH Engineering. “We have invested in UgCS R&D to focus mainly on automated IMU calibration commands, automatic calculation of required line spacing and overlap, and prevention of sensor shaking. Trial flights over SPH Engineering’s in-house test range have confirmed UgCS lidar toolset capacity to support main lidar market players.”
Common application areas include power-line inspections, road inspections, construction, mining, archaeology and forestry.
Spire Global, a global provider of space-based data and analytics, has announced the continuation of its participation in NASA’s Commercial Smallsat Data Acquisition (CSDA) Program with a $6 million contract extension.
The contract continuation, Task Order 6 (TO6), is a subscription data solution that includes radio occultation (RO) data, grazing angle GNSS-RO, total electron content (TEC) data, precise orbit determination (POD) data, soil moisture and ocean surface wind speed GNSS-Reflectometry data and magnetometer data.
This data will be available to all federal agencies, NASA-funded researchers and, more broadly, to all U.S. government-funded researchers for scientific purposes.
Under CSDA Program TO6, Spire will deliver a comprehensive catalog of data, associated metadata and ancillary information from its Earth-orbiting small-satellite constellation. The company operates its constellation in low Earth and collects upwards of 10,000 radio occultations per day with consistent global coverage.
For TO6, Spire will provide rolling access to 12 months of radio occultation data with a 30-day latency. This data will be archived and maintained by NASA under the CSDA Program’s SmallSat Data Explorer (SDX) database.
“Programs like CSDA highlight the incredible potential of private-public partnerships in the federal government to drastically accelerate our ability to confront some of the greatest challenges of our time, such as climate change,” said Peter Platzer, CEO of Spire. “With the end-user license agreements, our data is now available to all federal agencies and the larger NASA scientific community to help support Earth observation research across fields.”
The program includes end-user license agreements (EULAs) to enable broad levels of dissemination and shareability. All federal agencies and U.S. government-funded researchers will have access to Spire’s data for scientific purposes under TO6 and will be able to request access to the data via the CSDA Program’s Commercial Datasets webpage.
“At NASA, the CSDA Program has continued to blossom as a valuable resource to our team for our Earth observation research and analysis. We are committed to growing the program as well as continuing the work we have started,” said Will McCarty, project scientist at the CSDA Program and research meteorologist at NASA Global Modeling and Assimilation Office. “Spire has been a valued partner through CSDA’s development since its inception, and with this additional task order, we are excited about the new insights and results that will come not only from within NASA, but also through broader collaboration through the domestic government scientific community.”
NASA has used Spire data in its research on water and sea-ice levels in the polar regions, the height of the planetary boundary layer (PBL), and the day-to-day variability of thermospheric density at flight level.
NASA also noted that Spire data has shown positive benefit to its GEOS Atmospheric Data Assimilation System, which uses space-based data to analyze the Earth’s atmosphere and assimilate the data into its Earth observation systems.
As one of the original vendors for the CSDA Program, Spire provides NASA yearly updates to the scope of work under this agreement to ensure alignment of data to the agency’s needs.
Deal makes data from 40 Chinese satellites available through UP42 now, another 40 by late 2021
UP42 has signed an agreement with HEAD Aerospace of Beijing to make image data from more than 40 Chinese Earth Observation satellites available on the UP42 marketplace.
The broad selection of imaging capabilities from the constellations dramatically expands the range of applications in multiple sectors, with the most significant benefits expected in infrastructure, transportation, utilities, agriculture and government.
The UP42 marketplace contains more than 50 geospatial data sets, including satellite imagery from six international organizations. The newly added satellites’ diverse and often unique imaging capabilities include wide-swath imaging at very high resolution, nighttime acquisitions, frequent intraday revisits, tri-stereo collection and hyperspectral imaging.
“This partnership is an important milestone for us as a company but, more importantly, for our customers. By diversifying our data sets, we are unlocking a broader spectrum of use cases for our users in multiple sectors. This is the true meaning of ‘democratizing access to Earth insights’,” said UP42 CEO Sean Wiid.
HEAD Aerospace is an international distributor of satellite imagery collected by commercial Earth Observation missions. The UP42-HEAD agreement includes imagery from multiple constellations, including SuperView, Earthscanner, Gaofen-7, DailyVision, NightVision, Hyperscan, and Tri-Stereo ZY3. These seven constellations will total more than 80 satellites by the end of 2021.
“Sharing a similar approach facilitating users’ easy access to an agnostic data source by a centralized portal with a wide choice of satellite attributes, we are glad to have partnered with UP42. This partnership represents another new milestone for us in expanding our global network.” said Kammy Brun, managing director of HEAD Aerospace.
While each satellite constellation was designed with one or more imaging specialties, a remarkable variety of operational capabilities are shared across the constellations to support numerous applications and industries. Examples include:
Large-Area Very High-Resolution Mapping – Planning and monitoring critical infrastructure, including utility transmission grids and transportation networks, can be performed for entire states, countries and regions. Up to 40,000 square kilometers can be covered with wide-swath (136 km) imagery captured at a half-meter spatial resolution on a single pass.
Intraday and Early Morning Monitoring – The EarlyEye tasking product leverages multiple HEAD Aerospace constellations to deliver early-morning frequent images, an hour earlier than usual commercial offer at 10:30 a.m. Designed for frequent monitoring of critical assets and rapidly changing situations related to energy security, defense/intelligence and infrastructure management, a high-resolution revisit schedule of four times per day is possible, with 15-minute revisit between 09:00 and 13:30 anywhere on Earth to be possible by the end of 2021.
High Vertical Accuracy Mapping – Multiple satellites perform stereo imaging at high resolution for high-quality land use and cadastral mapping. One constellation captures single-pass tri-stereo imagery validated with onboard laser altimetry data, generating digital elevation models (DEMs), digital terrain models (DTMs), and other large-scale 3D mapping products with vertical accuracy of 5 meters. Additionally, the SuperView constellation captures daily stereo imagery with vertical accuracy of better than 2 m.
Hyperspectral Imaging – Imaging in 25 spectral bands spanning the visible, near-infrared, and mid-infrared portions of the spectrum is designed for regional natural resource management: detecting crop stress and planning pesticide/fertilizer applications, species mapping of forests and vegetative land cover, and protecting environmentally sensitive areas. These data sets can also be used in agriculture monitoring, mineral exploration and water-quality monitoring.
Nighttime Imaging – Monitoring and surveillance activities by government entities, energy utilities and security organizations can be carried out around the clock with true-color, high-resolution at 1 m optical and video imaging during daylight and dark of night. Nighttime collection is suitable for surveillance such as illegal camping, border surveillance, change detection (especially in rapidly evolving events), powerline incidents and designing streetlight placement in urban settings. Day and night video can detect vehicle and ship movement.
UP42 users have a growing selection of satellite imagery to choose from on the geospatial marketplace. UP42 technical experts are available to assist customers in selecting the best data set to meet the needs of specific end-use applications in all industries and sectors. These experts can also help in tasking a satellite for new image acquisition or querying the archive to obtain existing imagery.
“Crime is common. Logic is rare. Therefore, it is upon the logic rather than upon the crime that you should dwell.”
“Data! Data! Data!” He cried impatiently. “I can’t make bricks without clay.”
— Sherlock Holmes, “The Adventure of the Copper Beeches,” Sir Arthur Conan Doyle
Watson is to Holmes what information is to intelligence. Watson could listen to the client story, observe the situation, and recite to Holmes all the relevant facts, but he lacked the ability to string together the seemingly random pieces of information into a coherent chain of events leading to the correct hypothesis. A computer can become a Watson, but it takes a human to be Sherlock; however, a human misguided by cognitive biases will end up as Inspector Lestrade, always coming to the wrong conclusion.
When it comes to data, the analogy of drinking from a fire hose is an understatement. Consider that a digital image can be terabytes in size and every day millions of images are taken. Facebook generates 4 petabytes of data daily, and each day there are 500 million tweets and 306 billion emails. Additionally, there are 20 billion connected devices. Combined, the world creates 2.5 quintillion bytes of data every day. If a grain of sand represents a byte of data, then every three days more data is created than there are grains of sand on the Earth, and it is only increasing.
Somewhere in all that data are signals. Real-time threat intelligence systems are looking for those signals before the next huge event occurs. It is a high-stakes hunt for Leviathan, except that Leviathan is only a packet of sand traveling at lightspeed through a cloud obscured by dust.
Nellis Air Force Base takes part in Red Flag 15-2 at its Combined Operations Center in 2015. (Photo: Senior Airman Thomas Spangler/U.S. Air Force.)
Interpreting a Signal
The massive volume, variety and velocity of continuously flowing data far surpasses the ability of humans to process. It exceeds the bandwidth most systems can handle. And it quickly overwhelms the capacity to store, manage and act on the information in a timely and cost-effective manner. Resources are not infinite. The best model to handle an overwhelming amount of data is the human brain. Humans are biological sensors. Every moment of every second of our lives, our bodies are receiving an endless stream of stimuli from internal and external sources. Most of this stimuli registers at an unconscious level, and as long as the stimuli is normal and expected, it goes unnoticed by the conscious mind. If, however, any discomfort is experienced, the conscious mind is notified. Then that becomes the focus until normalized. Externally, the same applies to computer data systems. Normal conditions are ignored, but if there is something unusual, such as a loud constant noise, or a colder than normal temperature, it draws all the processing attention.
In the realm of intelligence that is basically how things function. Algorithms are written to learn the normal patterns of life and to identify specific events, words, names, etc. As long as data is within normal parameters, it gets little attention, but as soon as an anomaly exceeds a threshold or something triggers the algorithm, it will immediately be brought to the attention of the intel center. An example can be viewed on the Global Incident Map dashboard. I encourage you to sign up for a free 72-hour membership. If you want to see what real news looks like, this would be a sampling. The number of real incidents that happen across the country and around the world that you never hear about, many of them hair-raising and all of them open source, add to the few stories the media has been able to tell about cyber attacks. Scroll down the page. There are many filters, but I recommend turning them all off to see the full extent of information. Clicking on an incident will drill down into the actual source so you can read about it more thoroughly.
Below is the U.S. Army’s real-time critical incident dashboard called the Joint Analytic Real-Time Virtual Information Sharing System (JARVISS). It tracks and monitors activity near U.S. Army installations and standalone assets of interest around the world.
Another dashboard for cyberattacks is Check Point, which shows just how aggressive cyberthreats are throughout world. Here, you can see the patterns of coordinated attacks. A war is underway. The soldiers are cyberwarriors. No country is safe. View the Live Cyber Threat Map.
JARVISS is designed to target criminal activity and provide natural disaster information in and around Army installations and stand-alone facilities, as well as COVID-19 threats. (Image: Steve Gardner/U.S. Army}
Fast Analysis in Real Time
Monitoring this information, analysts look for connections. If a plane veers off its flight path, the local operations center is notified. An automatic query shows if any critical-infrastructure assets or other important structures and facilities are in the area. The analyst can immediately find out the type of aircraft, the call sign, who the plane is registered to and who filed the flight plan. Weather radar can be overlaid to see if that is a possible reason for the deviation. Incident reports can be displayed in real time within the area of interest, along with social media feeds and other sources of communication. Traffic patterns can be displayed.
The important question that needs to be answered is whether this is a potential threat. Is there a connection to anything going on anywhere else? A dossier is developed on the person who filed the flight plan, the one who is assumed to be the pilot and the person or organization to which the plane is registered. All of this is being done in a matter of minutes, while the airplane either returns to its flight path or continues its diversion. The air traffic control tower is contacted to share information on the aircraft and its deviation. If the tower does not have an answer, it will radio the pilot for an answer. The passenger and crew manifest also are analyzed. All the data that can be pulled together — including the remaining fuel burn and the aircraft performance limitations — are analyzed.
Patterns emerge from the data. These patterns lead backwards to a cause and forward toward the end result. Finding those clues in the data requires a team of specialists from six primary intelligence disciplines.
An imagery intelligence analyst brings in the live-streams and remote sensing.
A human intelligence analyst seeks motivating factors and ways to deescalate the situation.
A measurements and signatures intelligence specialist defines the operating limitations and the mechanics and science particular to the scenario.
An open-source intelligence analyst accesses and queries open-source data sets to provide clues.
A signals intelligence specialist focuses on the communications and electronic signatures.
A geospatial intelligence analyst brings it all together and provides spatial context through the map the team uses that shows the events unfold in real time.
These analysts and sometimes many others will collect all these pieces of information and turn them into intelligence that decision-makers can use to take action. That is the purpose of intelligence; as CIA veteran Richard Heuer stated, “Intelligence seeks to illuminate the unknown.”
Fortunately, most alerts turn out to be false positives, but every one of them is treated as if it were “the one.” These false positives turn out to be excellent, real-world exercises that hone the skills of the team and wire the brain for speed. These events can last mere minutes or several hours. It’s an adrenaline rush.
To explore live streaming data feeds, Esri has a growing volume of data in its ArcGIS Living Atlas.
“My mind rebels at stagnation. Give me problems, give me work, give me the most abstruse cryptogram, or the most intricate analysis, and I am in my own proper atmosphere…”
— Sherlock Holmes, “The Sign of the Four,” Sir Arthur Conan Doyle
William Tewelow works for the Federal Aviation Administration. He is a graduate of a management fellowship program. While on special assignment to the U.S. Department of Transportation William led the project to crowdsource the National Address Database for the White House Open Data Partnership. He is a Geographic Information Systems Professional (GISP) and a Maryland Scholar STEMnet Speaker. He has a degree in Geographic Information Technology and Intelligence Studies from American Military University and is currently earning a degree in Organizational Leadership. William retired from the U.S. Navy after serving 23 years as a Geospatial and Imagery Intelligence Specialist, a Naval Aviator, a Meteorologist, and a Tactical Oceanographer. He was among the first in the nation to earn a Geospatial Specialist Certification from the U.S. Department of Labor while working at NASA Stennis Space Center in Mississippi. He is married, enjoys traveling, solving problems, playing with data, and fascinated by new technology and historical context. His favorite quote is, “A man’s mind changed by a new idea can never go back to its original dimension.” ~ Oliver Wendell Holmes

![<b>Raster comparison: Sea Pines Shell Ring, Hilton Head Island, South Carolina. </b>Credit: Dylan S. Davis, Matthew C. Sanger & Carl P. Lipo (2018): Automated mound detection using lidar and object-based image analysis in Beaufort County, South Carolina, Southeastern Archaeology [https://doi.org/10.1080/0734578X.2018.1482186]](https://stage.globalpositioningnews.com/wp-content/uploads/2021/11/Davis-SC-mounds-HiltonHead.jpg)