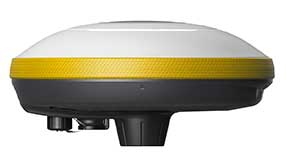
Application empowers users with expert visualization and analysis of lidar
Enview, a pioneer in the scalable processing of 3D geospatial data, has launched Enview Explore, a powerful web application that leverages artificial intelligence (AI) and cloud computing to automatically process 3D data at a high speed and scale.
Also, Robert Cardillo, former director of the National Geospatial-Intelligence Agency (NGA), has joined the company’s board of directors. Following an oversubscribed round of funding in May, the company continues to experience growth and momentum in the market.
Enview’s technology has been deployed on thousands of square miles worldwide to protect vital infrastructure and support mission-critical operations. Its unique method for classifying 3D data using neural networks and deep learning techniques reduces time to action by focusing on finding meaningful insights in 3D data.
Previously offered as custom services for organizations such as Pacific Gas & Electric and the United States Air Force, this groundbreaking technology is now available for the first time as an easy-to-use, self-service web application.
Screenshot: Enview
“Enview has built the world’s most scalable AI platform for transforming 3D point clouds into insight and action,” said San Gunawardana, Ph.D., co-founder and CEO of Enview. “We are solving one of the hardest problems in machine perception, and applying it to some of the most grounded and impactful challenges facing society. It is our goal to empower people with the confidence to perceive and navigate a rapidly changing world; Enview Explore is the natural next step in this journey and our team is excited to place this groundbreaking capability directly into the hands of operational end-users.”
Key benefits of Enview Explore include:
The power of 3D data. Three-dimensional unstructured data, such as lidar, contains incredible detail but is painfully slow to analyze manually. Enview solves this problem by combining its novel AI with the power of cloud computing to automate 3D classification and segmentation, giving users scalability that can support even nation-sized datasets.
High speed. While current methods can take weeks or more to process data, Enview provides actionable insights in minutes. Enview Explore utilizes a new and innovative approach that applies AI to 3D data, yielding significantly faster results than traditional lidar software.
Total data control. Enview Explore removes the need for outsourcing lidar to a third party by giving users the ability to perform classification, segmentation, terrain modeling, change detection, feature extraction, and intuitive visualization directly inside the application.
Screenshot: Enview
“With this release, we wanted to show the world that you don’t need to be a professional to get expert analysis from lidar,” said Anthony Calamito, VP of Products for Enview. “Lidar and other 3D data hold tremendous value and provide unparalleled insight over 2D data sources. While unlocking that value traditionally has required an in-depth understanding of specialty software, Enview Explore lets anyone create meaningful insight from 3D data with just a few clicks.“
The company also announced that Robert Cardillo has joined its Board of Directors. Cardillo served as the sixth director of the NGA from 2014 through 2019. In that position, he led the NGA under the authorities of the secretary of defense and director of National Intelligence to transform the agency’s future value proposition through innovative partnerships with the growing commercial geospatial industry.
“Mapping the world in 3D opens new possibilities for national security and mission-critical infrastructure, including some of the most important challenges facing our nation today,” said Cardillo. “Enview has completely changed the game when it comes to what’s possible with lidar visualization and analysis, making unstructured data accessible and easy to use: in other words, creating coherence out of chaos. With a shared purpose and commitment, I look forward to working with the Enview team toward the future the world demands and our customers deserve.”
Innovate UK, the United Kingdom’s innovation agency, has selected Hexagon’s Geospatial division to conduct a research project that will result in faster and higher-precision mapping of railway infrastructure through the use of artificial intelligence.
The project is funded by Network Rail, the owner and operator of Great Britain’s railway infrastructure, under its R&D portfolio and delivered by Innovate UK through the SBRI competition, Innovation in Automated Survey Processing for Railway Structure Gauging, Phase One. A small group of teams was selected for this effort.
Image: Hexagon
The project will enable Network Rail to automatically identify and measure railway structures from lidar data, saving valuable time and resources, while also improving planning and operations across the rail network. The current, manual process takes analysts months or even years due to the size of the data and the labor-intensive tasks involved.
“The combination of cross-sectional area, shape, length and speed all place a space requirement on today’s railway,” said James Sweeney, senior engineer at Network Rail. “We anticipate this project will offer us a more efficient way to capture, analyse and measure railway features along 20,000 miles of track, which is important to railway safety and the growth and capacity of our network.”
Network Rail collects detailed information about its track and the surrounding features, such as bridges and tunnels. The data is then analyzed to assess clearances between trains and the infrastructure around them, which is key to safety.
Image: Hexagon
The new project aims to automate the extraction and calculation of railway features from sensor data, leveraging AI to automatically analyze point-cloud data, identify different structure types, and perform measurements on the structures. The data will be collected from reality capture solutions from Hexagon’s Geosystems division.
“Network Rail, supported by Innovate UK, is leading the way in the use of AI to automate rail structure identification and measurement,” said Mladen Stojic, president of Hexagon’s Geospatial division. “We are excited to be part of a project that can help transform the gauging process for UK railways.”
A point cloud is fundamentally a simple construct. It is a collection of points in 3D space, each point being given a coordinate in Cartesian convention. The points can also be given other properties, often these will be indicative of how they were obtained.
Examples might include the time at which they were “seen” by the surveying device that collected the data. The intensity or error in position that the point has might also be included.
Often point clouds will have around 100 million points after conducting a survey. Photography can also be overlaid on point clouds using photogrammetry techniques to essentially build 3D photography.
Image: OxTS
INS survey: point clouds
The principal method of collecting point-cloud data is by using lidar. Lidar technology is akin to radar: light is sent out from the device and bounces back off of objects. The difference is that radio uses large wavelength radio waves and lidar uses small wavelength lasers for high precision.
The time for light to return to the device is used with the speed of light to calculate the distance away. Typically, a lidar device will contain lasers with a fixed vertical angle, but which spin around in the horizontal plane. Internally, the device knows at what angle the laser is pointing vertically and its azimuth angle. This gives the device the position of the point on the object in 3D spherical coordinates.
The lasers inside produce thousands of points per second. Intensity, mentioned above, refers to the intensity of the reflected beam and indicates the reflectivity of the object.
What is a georeferenced point cloud?
Lidar requires navigation data to conduct a survey. We combine the navigation data with the lidar data to create georeferenced point clouds. Lidar devices know where points are in relation to each other, but they need to be told where they are in the world to be able to build a point cloud while moving the lidar.
The navigation data often comes from an inertial navigation system (INS). An INS is a sophisticated combiner of inertial measurement unit (IMU) and GNSS data to get the best navigation data — so a device knows where it is in the world and how it is moving.
The coordinates from the INS are added vectorially to the point coordinates of the lidar to get the final coordinates that would be used in the point cloud. This allows a user to put their lidar device on a vehicle like a van or an unmanned aerial vehicle (UAV) with an INS, to survey large areas efficiently instead of doing multiple static surveys and stitching them together.
Photo: OxTS
What are point clouds used for?
There are a wide range of applications for which point clouds can be used. They are increasingly used in real time for robots and autonomous driving computers to understand their environment and navigate through it. The data in a point clouds is convenient for recognizing and identifying surfaces and objects; for example, other cars, road signs and lane markings.
OxTS has been a global leader in inertial and GNSS technologies since 1998. OxTS is fundamentally involved in helping car manufacturers get the navigation data they require to go with lidar data in autonomous vehicle development, and in point clouds creation for use in surveying.
Distances and volumes are easy to calculate using point-cloud analysis software, and intensity can help identify different materials.
Another feature that lidar offers is multi-returns. This allows a laser pulse (which has a finite cross-section) to bounce back off of multiple surfaces to give multiple points from the same pulse. This is particularly useful for seeing windows and also seeing through them, and also for a myriad of other uses such as seeing the top of a treeline and the ground when flying over with a UAV.
It can also be used to see snow depth. The lidar can see the top layer of snow and also gets another strong return from the ground beneath.
At OxTS, we see lidar point clouds being used for driverless-car and work-vehicle development, coastal and forest management, infrastructure monitoring (signs, drains, bridges, road surfaces, railroads, etc.), creating 3D models of cities, pipeline exploration and more.
The final product is a simple file format, for which the possibilities are almost endless — and we see new applications using point clouds all the time.
Hexagon AB has acquired Tacticaware, which provides lidar-based 3D surveillance software to monitor and protect critical infrastructure and buildings.
Tacticaware’s flagship solution, Accur8vision, is a volumetric detection security system offering 3D surveillance. Unlike conventional systems that typically only monitor perimeters, Accur8vision delivers situational awareness of an intruder’s exact location, size, speed and movement trajectory — all of which can be visualized within a 3D digital reality of the area under surveillance, Tacticaware said.
“Hexagon has long been a leader in sensor and 3D visualization technology,” said Hexagon President and CEO Ola Rollén. “Our award-winning 3D surveillance solution, Leica BLK247, fuses lidar, video and thermal imaging with edge computing and intelligent algorithms to instantly detect and report physical changes within an environment. Together with the BLK247 and HxGN OnCall, our comprehensive portfolio of next-generation public safety solutions, Hexagon can now offer those working to make our world a safer place a fully integrated end-to-end security surveillance solution for 24-hour, full visibility of critical infrastructure and spaces to call-taking, dispatch, incident planning and response and more.”
Everywhere we look, data is being collected, reviewed, analyzed and stored. It used to be that data was a static piece of information, like a piece of paper in a filing cabinet. Millions of pieces of data being created yet almost all of it never to be used again. The computer and electronic storage began a revolution of how we warehouse this information but that was only the beginning. Technology has turned data into a living, breathing beast few understand yet it controls most of our lives in various ways.
Mapping of the earth has not always been about establishing boundaries and parcels; many of the early maps and plats were created to depict the topography of our world. While there are some indications that Middle East maps depicted parcels, the first examples of topographic maps were created during the Roman Empire era of 300 A.D. It is common knowledge that the Romans utilized primitive yet cunning engineering for roads, buildings, and waterways but it was the initial topography that was mapped that allowed them to design those forward-thinking infrastructure components. Because of the lack of sophistication in the measuring methods and data collection, these topographic maps covered small areas and often crude because of the materials available. Considering what they were working with, it is still incredible what they were able to map, design and build.
Measuring devices and methods of data collection expanded over the centuries like most occupations and professions. By the 16th and 17th century, mathematics has been introduced at a wider scale through many educational facilities. Another profession, geographers, also advanced with the evolution of measuring devices and mapping techniques. It was during this period that we began to see a crossover with surveyors with geographers to create topographic maps with greater accuracy and precision through triangulation.
In the 18th and 19th century, instruments became more sophisticated to assist in the determination of elevations and more accurate angle measurements. The concept of triangulation flourished during this period and significant mapping was made for most of the civilized world. The early 1800s saw the westward push of expansion in the United States and Thomas Jefferson, U.S. president and former surveyor, led the charge to map the existing states and divide the west into sectional land for sale to settlers.
Besides the establishment of the Public Land Survey System, surveyors also provided topographic information for map of all sizes for future development planning. The late 1800s brought a large amount of topographic mapping information to paper through efforts by the U.S. Geological Society to map the entire United States. This information has been called the first land database; although crude in overall nature compared to today’s standards, it contained an enormous amount of topographic information.
These surveys continued well into the early 20th century until a revolutionary invention coupled with a current technology merged: the use of a mounted camera taking aerial photographs from an airplane. Geographers and photogrammetrists were able to use surveying data to assist with scaling orthometric photographs to create aerial images of thousands of acres of land. These aerial photos became the base layer for determining topographic features and contouring, covering much more land than ever before. Additional innovations included advancements in stereo plotting and photogrammetric techniques to further create high sophisticated topographic maps for the era. This type of mapping was the gold standard for decades depicting existing condition and topographic features for most of the world until the early 1970s and the computerized data revolution.
Computers take over the world (literally)
1960s mainframe computer (Photo: NASA)
While mainframe computers became more universally used in the 1960s, their use was contained to governmental agencies and large corporations. As the physical size of the computer reduced, the computing capacity increased, programming became easier to complete, and more applications were created to perform a variety of tasks. One of the biggest advancements for the era was electronic storage and analyzation of data through programming. Relational databases became a hot ticket for large datasets; geographic data was the perfect fit for this type of application. Modern mapping was on its way forward at warp speed.
Topographic mapping was not lost in this shuffle. The survey itself is based upon data points located on the face of the earth so each point is just another chunk of information within the database. Programming continued to advance and soon methods previous completed by manual methods over long periods of time were completed in a fraction of previous efforts without fail.
This effort was also joined with advancements in graphical technology to display this data on a computer video screen instead of lines of green text and numbers. Vector-based graphics, together with enormous point databases, helped create large topographical and geographical maps for many uses. During the same time the US put a man on the moon, mapping and platting of topographic information was also out of this world.
The turn of the century brings big changes
For the next decade, there were small advances in technology for topographic surveys and data points, but most were in presentation of data and increases in computing power. Pen plotters and smaller yet more powerful computers were becoming affordable to smaller companies, but it was still a large investment to get into the computerized data game for a surveyor. By the mid-1980s, electronic data collection with a total station was becoming the norm, but only meant collecting more points in a more efficient timeframe. The computing component did get faster but is still producing the same information of static data points.
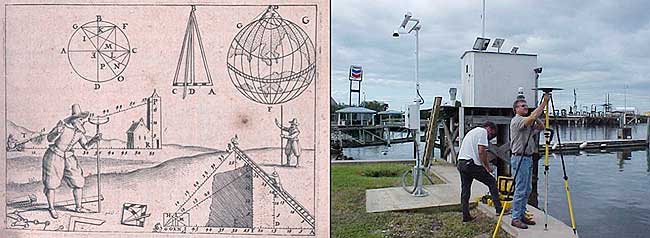
Ancient techniques and new technologies (Image: ngs.noaa.gov)
The mid-1980s also brought us a shiny new object: GPS technology. By the end of the 1990s, we were able to get out of our vehicle, start the receiver and collect geolocated points in minutes rather than hours. The big takeaway from this advancement is the geolocation component of the data point. Now everything can be related to one big dataset of topographical points. By creating a database with all our project data collected in the same georeferenced datums (horizontal & vertical), we can create digital models that replicate existing conditions.
We can also add another big advancement in data collection: remote sensing technology. From laser and lidar scanners, photogrammetry, SLAM technology and ground penetrating radar, the innovations to collect data at locations we can “see” through sensing are now a reality. Another significant improvement with this technology is the amount of data points remote sensing can collect, both in timing and spacing. We are now talking small scanning projects that consist of billions of points within the site point cloud. We are fortunate that our computing power and storage capabilities has increased exponentially along with the remote sensing. (Remember doing a “regen” on your CAD file and having time to get a cup of coffee?)
Lots of data — now what?
Data is powerful, especially when it is harnessed in a robust system that can analyze and model for future use. Yes, this condition also applies to the surveying world, even though you may not be thinking about it now. We can use this data to create a virtual world that mimics the one we live in; the difference is that we exist in ours yet model and manipulate the digital version in our computer system. The technology is now available, and we can make a replica of our current world; however, why would we want to do that? There are lots of reasons to use technology and data to make sophisticated topographic maps (because that is what they are) for recording the world around us.
One of the big differences now is that we have much more information about the data points we collect within our topographic maps. Sure, many surveyors will say that their data has not changed or evolved during their careers, but they would be wrong. Unless they are still manually writing it all down for hand plotting… (Hello! The 1960s called, and they want their field book back!) Every electronically collected point has attributes associated with the data.
These attributes, while they may be simple, contain important information about the datapoint it represents. Horizontal location? Check. Vertical elevation? Check. Assigned point number? Probably. Field code? Most likely. But it also has one other important component: time. We now know exactly when that point was collected. Why is that important?
Because, like a lot of instances, things change. Something collected today might not be there tomorrow. Time is just as important as the physical location and the type of point it represents.
Gather these points together, throw them in one big model and you have yourself a graphical database that can be analyzed, reviewed, and used for planning and design. It may be hard to visualize with just simple survey data using GNSS and/or a total station, but couple it with a scanner or photogrammetry, you have a powerful hunk of data for which to work.
Why is this workflow and modeling procedure important enough to dedicate an entire column about surveying and GNSS to? Because it used to be far in the future, but the need and availability to use it is now here in front of us. Surveying and GNSS are an important part of this effort to create three dimensional models. By using survey-grade data in conjunction with point clouds collected from remote sensing equipment, we can replicate the world around us in real time.
Yes, Virginia, there is a name for the modeling process…
Photo: iStock.com/alexsl
The name for the proposed modeling of this dataset is a digital twin. It represents a digital representation of a physical object or system. NASA famously used the concept for their space program to simulate situations and procedures of many different types of events. The concept has grown with the technology to graphically create almost anything through digitalization and computer modeling. Once the model is created, both actual and proposed data points can be included to represent the existing and future opportunities.
The idea of a digital twin is not new; technology, however, has pumped more life into its existence by leaps and bounds with computing power and data storage capability. I remember, early in my career, going into an architect’s office and seeing the scale model mockup of a new development or building. The streets in the model were perfect, there were no drainage issues, and it was a neat as a pin. Fast forward to the construction of the development and field changes were at every turn. A digital twin will allow for better planning, more thorough design and creating more cost-effective development. Many large cities have started compiling data and building their digital twin, including New York, Singapore, Boston, and Rotterdam. Engineering and planning for new and replacement facilities is very expensive yet analysts predict that having a digital twin to work will save a significant amount of money and time.
As a surveyor, what’s in it for me?
Software capability for the surveyor is already here. Companies, such as Hexagon, Trimble, Topcon and Esri to name a few, have been developing their software to accommodate this concept for many years. Still, lots of surveyors do not know about it. And we should. Many of us live in places where the infrastructure is well past its useful life period and should have been replaced long ago. By starting now with survey-grade data to be put into a real-time model, we can help our governmental agencies and their consultants to move towards a digital twin that will ultimately save money and possibly lives.
What this means for the surveyor is to further embrace technology and include remote sensing into your operation. If you have not started at least looking into UAVs and photogrammetry, you are already behind. Many aerial operations are making the next leap into mounting a LiDAR unit on their UAV to gain even more capability. Early adopters of laser scanners were probably second guessing their decision during the 2008 Depression but if they stayed with it, it will be a big payoff in the long run. The next leap will be into handheld scanning devices, including ones using SLAM (simultaneous localization and mapping) technology for locating interior and close-up improvements. These technologies will cost a significant amount of time and money to implement but municipalities, engineers and architects are going to be clamoring for the data any day now.
When it comes to surveying and mapping of existing facilities, the surveyor and technology makes a great team. Do not let point clouds, remote sensing, or terabytes of data scare you away from providing badly needed information to help assemble your local digital twin. In the long run, it will pay off for all who take on the challenge of building it.
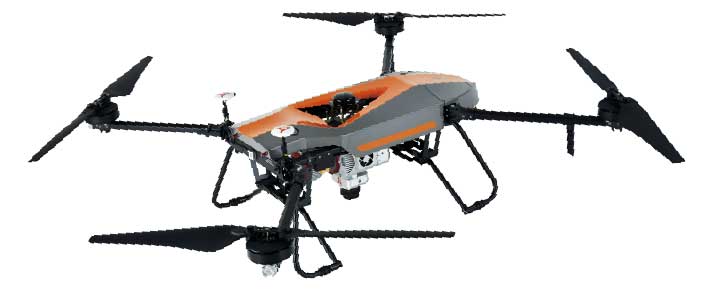
Lidar series paired with professional drone provides multi-platform, high-accuracy 3D laser scanning for geospatial and mapping professionals
CHC Navigation (CHCNAV) has launched the multi-rotor BB4 drone and AlphaUni 300/900/1300 lidar.
Photo: CHCNAV
The combination of the AlphaUni 300/900/1300 lidar and BB4 UAV solutions creates a comprehensive and versatile range for 3D mapping and geospatial data acquisition in land, air and marine applications.
“The purchase of a 3D mobile mapping system is too often constrained to a specific purpose, such as airborne or ground survey,” said George Zhao, CEO of CHCNAV. “A lot of our customers expressed the need to have a professional lidar solution that can be used in different scenarios, offering optimal adaptability to their current and future needs.
“With our AlphaUni series, we are now introducing an innovative response with a multi-platform lidar system that can be used with an aerial or marine drone, on a vehicle or carried as a backpack,” Zhao said. “In addition, the long flight autonomy of our new BB4 UAV allows missions over large areas in a single flight for exceptional productivity.”
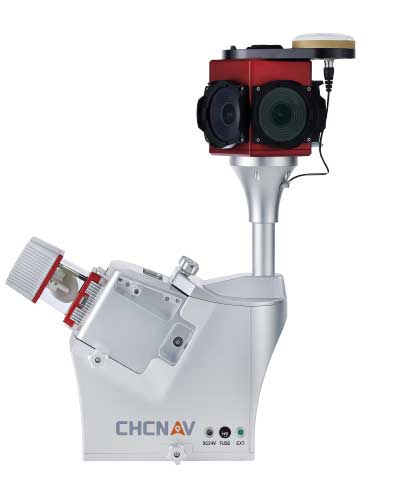
AlphaUni lidar series
Photo: CHCNAV
The new AlphaUni series enhances CHCNAV’s Alpha Mobile Mapping family with a light, versatile long-range laser scanner systems available on the high-end market.
The series provides optimized data sets powered by advanced GNSS/inertial navigation system (INS) sensors and long-range Riegl scanners.
AlphaUni’s design adapts to a variety of applications and can be installed on a variety of platforms, including multi-rotor UAV, fixed-wing vertical-takeoff-and-landing (VTOL) UAV, vehicles, rail trolleys, backpacks, boats and more.
BB4 UAV
The BB4 UAV is a high-end multi-rotor drone optimized for the CHCNAV AlphaUni 300/900/1300 lidar series. Its modular design simplifies deployment in just a few minutes.
Its 7-kg payload breaks the capacity barrier, and more than 45 minutes of flight time increases the airborne lidar survey ability.
The redundant CHCNAV and DJI inertial measurement unit (IMU) and GNSS units provide reliable centimeter real-time kinematic (RTK) positioning, meeting the demand for high accuracy in the geospatial and mapping industry.
GeoCue Group has released the True View 615 and True View 620 UAS lidar 3D imaging systems. The True View systems are compact, survey-grade 3D imaging sensors designed for small unmanned aerial systems.
True View 615 and 620 are equipped with Riegl’s miniVUX-2UAV laser scanner integrated with dual photogrammetric cameras. Position and orientation is provided by an Applanix APX-15 (True View 615) or extreme accuracy APX-20 (True View 620).
All True View 3D imaging systems are bundled with Applanix POSPac, True View EVO post-processing software and True View Reckon data management solution.
The Riegl laser scanner and dual photogrammetric cameras have been carefully configured to provide a fused lidar/imagery field of view of up to 120°. The system includes full post-processing software that generates a stunning ray-traced 3D colorized point cloud and geocoded images.
An upgrade path will be available to promote a True View 615 to a True View 620 by adding the Applanix APX-20 external inertial measurement unit.
The True View product line gives mappers and surveyors the ability to deliver high-quality analytic data with exact accuracies. These deliverables are generated using workflows and tools within GeoCue’s post-processing software, True View EVO. Examples of derived products include bare Earth models, profiles, cross sections, topographic contours, volumetric analysis and more.
“Our Quanergy-based True View 410 has rapidly become the standard for general purpose drone 3D Imaging, where moderate vegetation penetration and accuracies of 5 cm RMSE are adequate,” said GeoCue’s President, Lewis Graham. “The True View 615/620 provides a solution for situations where deeper vegetation penetration, wire extraction and extreme accuracy are required. These are great new additions to the True View product line.”
The True View 615/620 will be available for shipment late June.
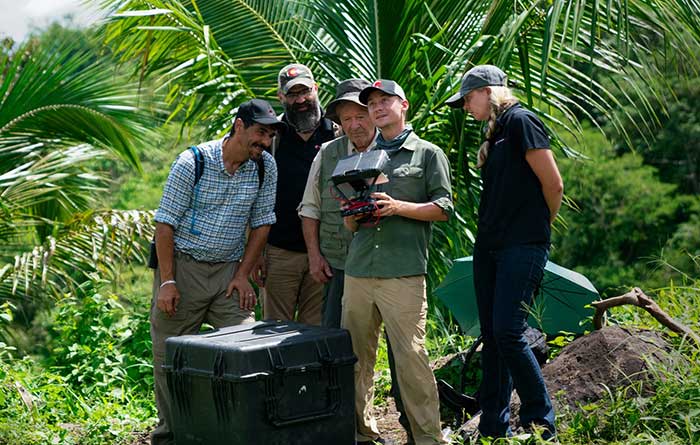
PrecisionHawk’s Jaymie Young and Matt Tompkins fly a UAV with the hosts of History Channel’s “Lost Gold of World II” in the Philippines in late 2018. (Photo: PrecisionHawk)
The collection of about 300 giant geoglyphs known as Nasca Lines were etched into the ground in the Peruvian coastal plain 2,000 years ago by the Nasca culture in South America. They depict various plants, animals, and shapes and are so large that they can only be fully appreciated when viewed from the air. Unlike the Nasca Lines, most archaeological sites are hard to see from the air, especially those deep under thick jungle vegetation, as in the lowlands of northern Guatemala. Here, lidar’s ability to penetrate foliage makes it the ideal tool for archeological exploration. At the same time, the lack of infrastructure, including airports, makes UAVs the platform of choice for many such projects.
Challenges for lidar in archaeology
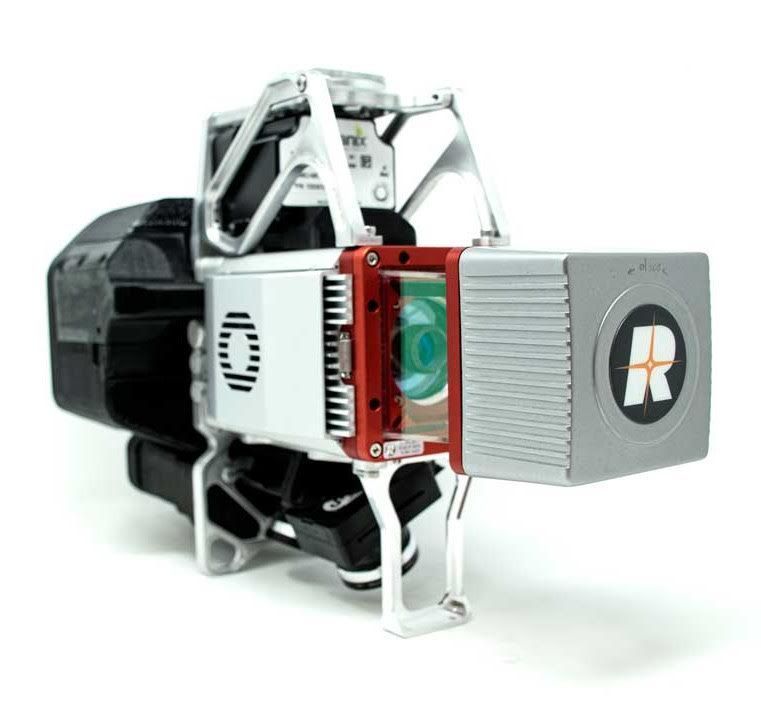
Operating aerial lidar for archaeology in a jungle environment presents four challenges. The biggest one is penetrating the canopy. “Typically, the sites that they have been exploring lately have been quite overgrown, and disguising what has been there for a long time, to the extent that even someone walking on the ground has not been able to see the scope of the site,” said Paul LaRocque, senior scientist at Teledyne Optech. Penetrating multiple layers of vegetation requires a minimum of two lidar returns. For heavily vegetated environments, Matt Tompkins, director of Flight Services at PrecisionHawk, recommends a five-return system.
The second challenge is ground-truthing the data collected, explained Thomas Garrison, assistant professor in Ithaca College’s Department of Anthropology. “Even though we digitally removed the forest, it is still there, of course.” For example, it is hard to confirm long roads between sites, because they run beyond a ground observer’s field of vision.
The third challenge is acquiring a GPS signal. “In the tropical environment, a UAV needs to return to its take-off site very precisely,” Garrison explained. Finally, jungles put a twist on the familiar trade-offs between fixed-wing and rotary-wing UAVs: “A fixed-wing UAV will cover a greater area, but you may not have enough space for it to take off where you want to fly your lidar and may not be able to recover it,” Garrison said.
Making lidar an effective tool for archaeology required the development of sensors with very high pulse repetition frequencies (PRF) and with multi-look angles, which better penetrate the canopy to reach the ground and any structures, LaRocque explained.
Manned aircraft vs. UAVs
Archaeology missions need aerial lidar sensors with sufficient peak power from each pulse to reach the ground after much of it is absorbed or reflected by the canopy. In this respect, manned fixed- and rotary-wing aircraft have an advantage over UAVs because they can carry larger sensors with a higher peak power. Plus, they can cover much larger areas per flight. “This is important because archaeologists have been finding that [areas of interest] are much bigger than they ever imagined,” LaRocque said.
Finally, forests and jungles make it challenging to find open areas for launching and landing UAVs and flying them by line of sight. “Where do you stand to see the UAV above the canopy?” For these applications, LaRocque said, manned aircraft probably fly just 500 to 1,000 meters above ground level, “because they are not out for high survey efficiency but for penetration to the ground.”
Tompkins, whose company has conducted many missions in jungle environments and other remote places, takes the opposite view. Archaeology constantly presents new challenge and “takes you to some pretty crazy places,” he said and UAV lidar “allows archaeologists to access information that would otherwise be too difficult or dangerous to access.” In the projects on which PrecisionHawk has worked in heavy jungle, it has seen “excellent penetration through heavy jungle canopy, which gave us access to ground-level data,” he said.
Logistically, Tompkins pointed out, UAVs are “significantly easier and safer than manned aircraft” in remote areas with little access to airport infrastructure, air traffic control, and any sort of emergency services. A team with a UAV can mobilize and travel quickly. Where there is no electricity to recharge the UAV’s battery, the team will bring a generator.
Positional accuracy
Archaeological applications do not require survey-level positional accuracy. Archaeologists only need to be able to locate on the ground features that they identify in the 3D lidar point cloud. “We use Trimble Juno 5s, so that we can load the lidar data directly onto their screens,” Garrison said. “If we get near a structure, we only need to take a point. We don’t even need to find base stations and do corrections afterward. We can manually correct the points based on where they were on the structures.”
Ancient structures are rarely in the areas with the thickest, nastiest vegetation, which are usually low-lying areas, Garrison said. However, those areas might reveal other items of cultural interest, such as agricultural fields. “In the lidar data we have, we are seeing that ancient societies were terraforming their entire landscape, so everywhere you go there is something to check or confirm.”
Missions
In 2018, PrecisionHawk conducted an archaeological project in a remote jungle in the Philippines for a History Channel show called “Lost Gold of WWII.” Show producers were trying to find where Japanese troops might have stored gold stolen from the Philippine government.The team flew lidar on a UAV to identify roads or other manmade structures that could help them identify possible hiding spots in areas pinpointed through historical documents, Tompkins recalled.The PrecisionHawk team produced a colorized lidar data file in the jungle that the producers used on the program.
The largest lidar acquisition for archaeological investigations in the world is the Pacunam Lidar Initiative (PLI), a consortium of scholars funded by the Guatemalan foundation Pacunam (short for Fundación Patrimonio Cultural Y Natural Maya). So far, the PLI has scanned about 7,000 square kilometers in the lowlands of northern Guatemala.
Garrison is one of three principal consultants for the foundation. “Lidar has a huge impact in archaeology under tropical forests because you get more bang for the buck in terms of peeling back the forest and revealing the preserved ancient landscapes underneath,” he said. “We’ve been working on these data since we first flew in 2016 with the National Center for Airborne Laser Mapping in Houston. We published preliminary results in Science in 2018.” In the massive PLI project, “Instead of just single sites, we can see broad trends across huge areas.”
The first phase of the Pacunam lidar initiative covered 2,100 square kilometers in northern Guatemala in 10 different polygons of data acquisition. “We found that there were 60,000 more structures in these areas than we knew about before,” Garrison said. This raised the question of how so many people could feed themselves. The lidar data revealed that they had used huge swampy areas as agricultural fields. It also revealed many road systems between and within these sites and many defensive earthwork features of military engineering for warfare distributed along the valleys.
“All of that changed our view of what this ancient landscape looked like,” Garrison said. In the summer of 2019, the project flew another 5,000 square kilometers and is now analyzing the data, which shows “a complete picture of an ancient culture’s impact on the landscape,” Garrison said. “When you think of ancient Rome and everything that they had, you can’t really see everything because modern Europe is there. But here we have all this stuff preserved under the jungle in a way that is letting us see the totality of an ancient culture.”
Discoveries made with UAVs
• Using UAV lidar, the Crow Canyon Archaeology Center and the Canyons of the Ancient National Monument were able to map an 800-year-old Pueblo site at Sand Canyon, Colorado, and discover previously undocumented structures. UAV experts from Caddis Aerial and Routescene conducted the survey using a Velodyne HDL32 lidar scanner on a DJI M600 Pro UAV flying at 40-meter altitude relative to the take-off point. They then processed the point cloud, consisting of 3.2 billion points, using Routescene’s LidarViewer Pro software and created a digital terrain module at 400 points per square meter.
• A hexacopter built with DJI technology, flying 20–60 meters above the ground, enabled Isabelle Heitz of AirD’éco to map several ancient sites, including the microtopography of an ancient theater covered by woods in the center of Soissons, a town in eastern France, and a fortified town of the Gallic age, now covered by thick woods.
• Using Google Earth, satellite imagery and low-flying UAVs, archaeologists Sarah Parcak and Christopher A. Tuttle discovered a previously unknown monumental structure that had been hidden in plain sight only half a mile from the World Heritage site of Petra, Jordan.
The UAV market has been growing rapidly for the past several years, especially in the U.S. with the Federal Aviation Administration (FAA) Part 107 regulations becoming active in August 2016. Before then, it was impossible to tell what systems were real and would weather the marketplace, and which were just a dream. Multicopters dominate the marketplace. (DJI’s M600 — out since 2016 — offers a 1–6-kilogram payload option). In late 2019, InnoFlight introduced the Galaxy 950 unmanned helicopter, a single-rotor platform capable of carrying more than 6 kilograms. It is available with battery power only, providing flights under an hour, but soon will support a gas-driven option for flights exceeding 2 hours. The system can be ready to deploy in less than 10 minutes.
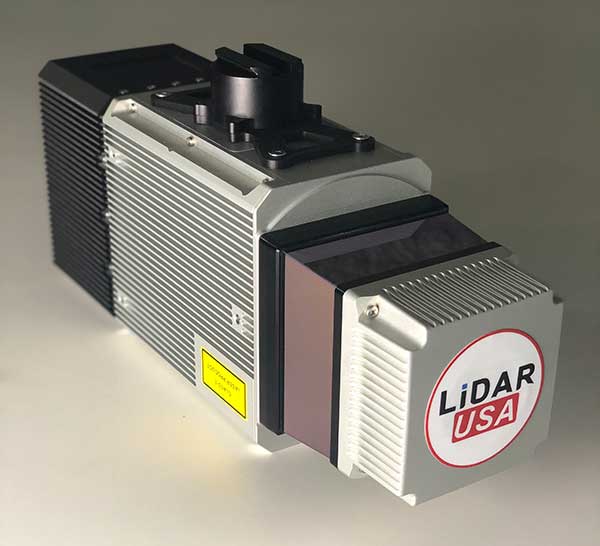
Lidar USA provides a range of available lidar systems weighing about 5 kilograms, which work well with heavy-lift systems such as the Galaxy 950. In 2019, the Optech CL-90 was released; later the same year, the CL-360 hit the market. Lidar USA integrated each scanner into its product family and immediately saw the possibilities with the Galaxy 950.
The Lidar USA CL-series, together with the Galaxy 950, easily falls in the under-55-pound category set by the FAA. This means users can tackle small (5-acre) and large (500- to 5,000-acre) mapping jobs with confidence in their drone platform, the quality of the scan data, and the resulting lidar point cloud. The Galaxy 950 can easily support the CL-series with supporting cameras. The Optech CL-series provides survey-grade lidar accurate data: +/– 0.01 foot from a car on a paved surface. The system can operate from 400 feet with scan lines every inch at speeds of 14 mph (6.3 m/s). Of course, not all pulses make it to the ground due to vegetation, but the Optech CL-series provides up to four echos per pulse with a small beam size of 0.3 milliradians. Depending on the clipping angle, the scan width can range upwards of 1,200 feet, equating to about 34 acres per minute along a corridor. This system provides the surveyor with high-quality, accurate and dense lidar data.
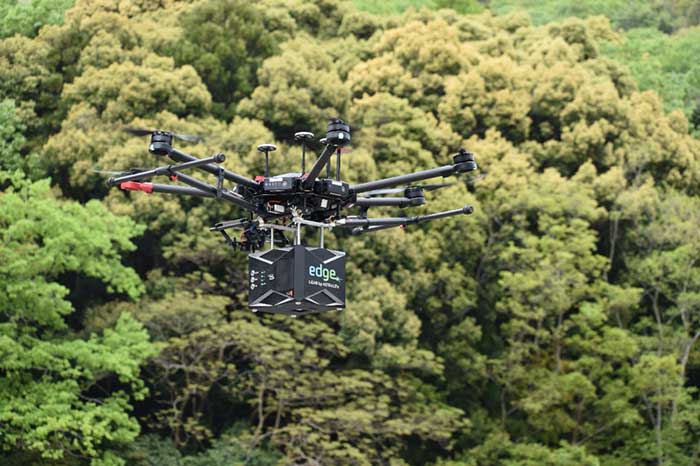
The ASTRALiTe Edge is a small-scale topographic and bathymetric scanning lidar that can detect underwater objects, measure shallow water depth and survey critical underwater infrastructure from a small UAV platform.
The patented 2-in-1 topo-bathy Edge can see beneath the water surface at depths of 0–10 meters. It is self-contained with its own INS/GNSS, battery and onboard computer. It weighs under 5 kilograms and is designed for deployment on UAV systems for faster, safer and more accurate bathymetric surveys. From coastal mapping and surveying to infrastructure inspection and military logistics, the applications of this innovative lidar are numerous and widespread.
Geo-Referencing Solution. ASTRALiTe needed a motion and navigation solution for its cutting-edge lidar. “Our requirements included high accuracy along with low size, weight and power,” explained Andy Gisler, director of Lidar Systems. Also, the system needed to be able to apply a PPK correction to the lidar data to provide higher accuracy results to ASTRALiTe’s customers.
Photo: SBG Systems
The company chose the new Quanta georeferencing solution from SBG Systems, an INS designed to be integrated into mobile mapping systems. “The weight of the INS solution was especially important to us,” Gisler said. The Edge scanner will be flown on UAVs, where light payload capacities are required. “The ability to use two GPS antennas was key in our choice as we required good heading knowledge at slow flight speeds,” Gisler said.
Quanta directly and precisely geotags the point cloud in real time and provides even higher performance in post-processing. One year of post-processing with Qinertia, SBG’s in-house PPK software, is offered for UAV applications.
“Accurate and lightweight IMU performance leads to high accuracy lidar point clouds,” Gisler said. “Combined with the ASTRALiTe scanner and lidar performance, point clouds with typical densities of 100-300 pts/m2 and centimeter-level resolution can be achieved.”
A roundup of recent products in the GNSS and inertial positioning industry from the April 2020 issue of GPS World magazine.
OEM
LPWA module
Collaborative IoT solution
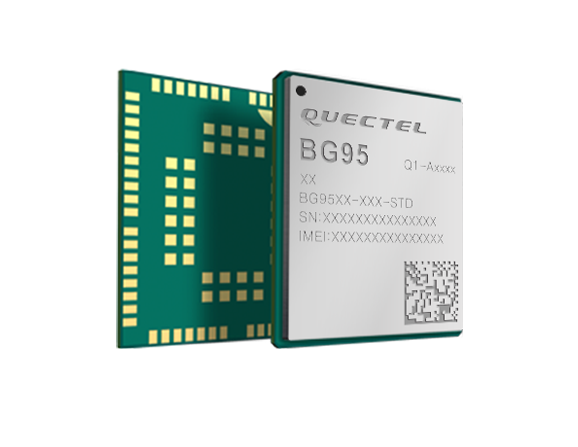
Photo: Quectel
Quectel Wireless Solutions’ LPWA module BG95 is being integrated with Microsoft’s Azure Device software development kit (SDK). The BG95 cellular module is based on the Qualcomm 9205 LTE modem. The integration will provide direct and secure connections to the Azure IoT Hub and provide full support for Azure device management. Customers can connect their BG95 devices to the Microsoft Azure cloud where they can build, manage and deploy internet of things (IoT) solutions at scale, significantly accelerating time to market. The BG95 module is a highly integrated variant supporting integrated GNSS, Cat M1, Cat NB2 and EGPRS (also called edge). The module complies with 3GPP Release 14 and delivers improved capabilities in power consumption, data rates and hardware-based security.
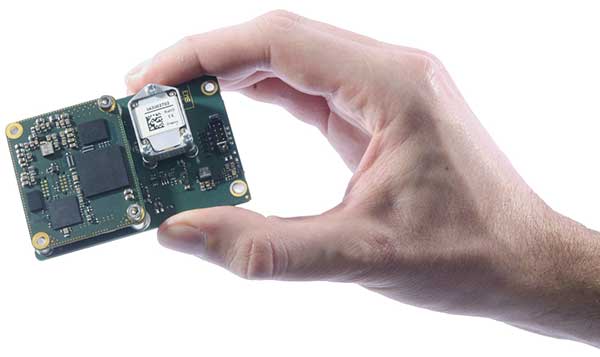
The SARA-R422 product series of LTE-M/NB-IoT and EGPRS cellular modules now include GNSS variants for internet of things (IoT) data, devices and ecosystems. The SARA-R422M8S module is pre-integrated with the u-blox M8 GNSS receiver and a separate GNSS antenna interface. This provides highly reliable, accurate positioning data simultaneously with LTE communications. The module also supports hybrid positioning strategies, in which positioning data provided by satellite constellations is enhanced with data from the u-blox CellLocate service, ensuring that location data is always available everywhere. The SARA-R4 series is designed for a wide range of mission-critical IoT solutions such as connected healthcare, industrial monitoring, point of sale and vending terminals, tracking and telematics devices, as well as smart lighting solutions and building automation.
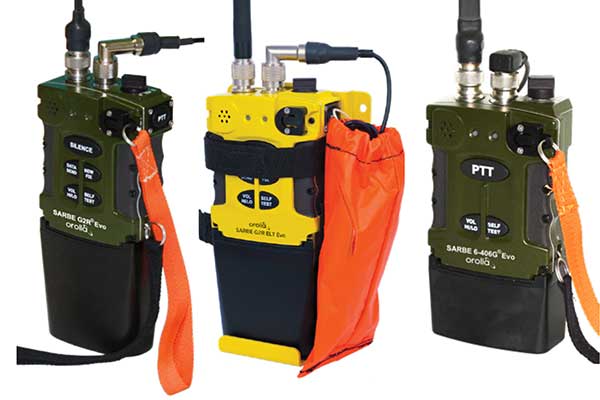
The new line of Sarbe search and rescue beacons. (Photo: Orolia)
Orolia has improved its Sarbe Evo search-and-rescue (SAR) beacon range line to deliver upgraded operational capabilities. The line offers new operational improvements to meet revised Cospas-Sarsat requirements in operating lifetime, location accuracy, voice signal management, integrated protocols, testability and maintenance. Also a focus of the upgrade was more robust and frequent GPS/GNSS position acquisition with the GPS, Galileo and GLONASS satellite constellations.
ADVA’s GNSS assurance solution could help companies dependent on satellite-based timing. (Photo: Business Wire)
ADVA’s GNSS assurance solution helps companies dependent on satellite-based timing. The centralized GNSS monitoring and assurance tool uses artificial intelligence and machine learning for comprehensive predictive maintenance. The customer-owned tool enables users to collect and analyze huge amounts of information from across the network to remotely identify issues and protect networks from GNSS vulnerabilities, including jamming and spoofing attacks. It also helps to identify GNSS obstruction issues, detect blind/poor spots that appear over time, and enable optimal antenna positioning. Built into ADVA’s Ensemble Controller network management suite with Sync Director, the solution enables customers to detect potential problems in advance and maintain the highest quality of network synchronization. It complements the limited distributed approach to GNSS assurance with a centralized global system, providing a boost to critical infrastructure now dependent on satellite-based timing.
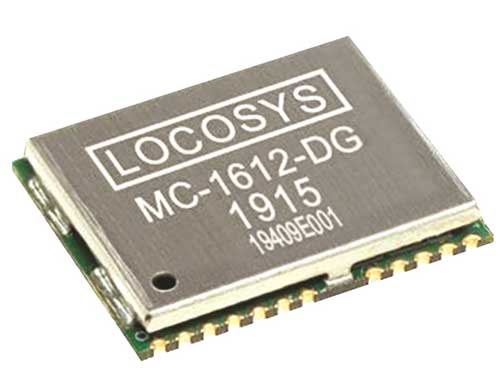
The Locosys MC-1612-DG is a single-band multi-system with an ARM-based processor that supports GPS, GLONASS, Galileo, QZSS and SBAS. The embedded micro-electro-mechanical systems (MEMS) sensor is equipped with dead-reckoning software and provides six-axis accelerometer and gyroscope data. The extended Kalman filter algorithm combines GNSS and MEMS sensor data with a weighting function that relies on GNSS signal quality. In adverse GNSS conditions such as urban canyons, tunnels or parking garages, the dead-reckoning features boost accuracy with the software filling the gaps. It supports three-dimensional dead-reckoning and standard NMEA output, and has Flash memory, TCXO, RTC crystal, LNA and SAW filter.
The automotive-grade solid-state RS-LiDAR-M1 family has the performance advantages of traditional mechanical lidar, while meeting requirements for mass-produced vehicles. The RS-LiDAR-M1Smart is embedded with an artificial intelligence perception algorithm that transforms conventional 3D lidar sensors into a full data analysis and comprehension system, outputting semantic-level structured environment information in real time for autonomous vehicle decision making. The RS-LiDAR-M1Smart outputs two redundant channels of data: the original point cloud and the object list. The redundacy provides vehicles with a range of sensing results — dynamic, static, inside and outside the road. Also available is the RS-LiDAR-M1Simple.
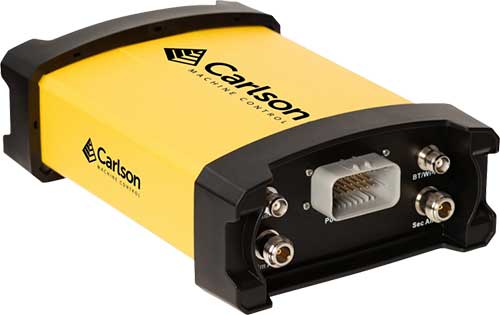
The Vsx7 multi-frequency position and heading receiver is designed specifically for machine control and can be mounted by bolts or with magnets on heavy equipment. Paired with the Carlson A45 antennas, the Vsx7 features high-precision positioning in Athena RTK, Atlas L-band and SBAS and heading accuracy of up to .01 degrees. The whole Vsx7 system is designed to operate in harsh conditions from –40° F to +158° F. The Vsx7 is primarily used in the mining and construction industries, but can be used in similar industries with companion software, Carlson Grade. Field data can be collected and viewed in real time both at the machine with either the MC8 or MC10 control box as well as in the office with Carlson Command.
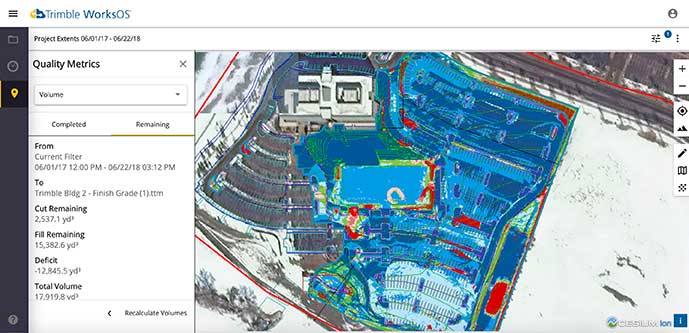
Trimble WorksOS is a new Software-as-a-Service (SaaS) operating system. The cloud-based system will integrate data from Trimble and third-party providers across the entire civil construction project lifecycle, including estimating, scheduling, designs and the field. Currently, site supervisors and project managers jump between multiple systems to keep track of daily production quantities, labor/equipment hours and equipment maintenance schedules. Works OS is designed to bring real-time visibility into jobsite progress, schedule and cost. Users will be able to log into a single application to view real-time visibility of cut, fill, volume and compaction data to maximize jobsite productivity. Site supervisors will see daily volume calculations and compaction quality metrics, and be able to monitor progress and schedules.
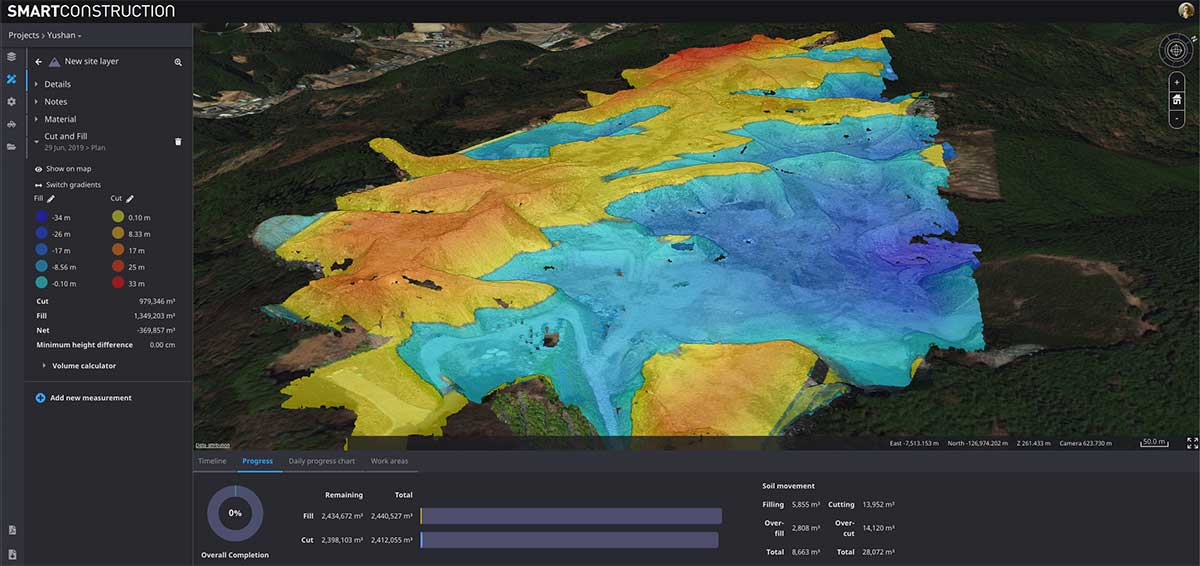
Komatsu’s Smart Construction dashboard includes the 3D visualization power and geospatial accuracy of Cesium, a platform to visualize, analyze and share 3D data. The dashboard enables users to monitor a construction site from anywhere in the world, see how it changes over time, and compare architectural plans with real-world data. It is compatible with data from sensors on construction machines, drone surveys, or computer-generated files like BIM/CAD models . It allows users to visualize projects in a single scene within a web browser, as well as calculate precise measurements for cut and fill, slope, contours and more.
Cesium, cesium.com
The TopoGrafi app has been updated to allow for display of 3D data in real-world models. With enhanced 3D data-processing capabilities, TopoGrafi is an end-to-end platform for capturing buried asset data and processing it for augmented reality visualizations. Designed to be used alongside apps such as Esri Collector for ArcGIS, the TopoGrafi platform uses GNSS data. It applies near-real-time conversions, transforming the recorded positions to local reference systems and aligning it with high-accuracy mapping including Ordnance Survey MasterMap. The TopoGrafi toolkit also includes functionality to snap 3D features to each other and to other spatially referenced data to create a 3D model that can then be used to create augmented reality visualizations accessible from the desktop or in the field.
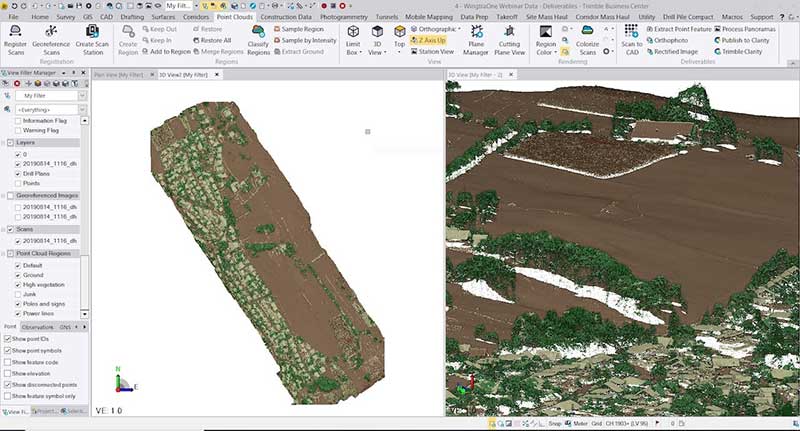
WingtraOne drone data can now be directly imported into the Trimble Business Center (TBC). The new integration combines WingtraOne high-accuracy drone data within TBC, optimizing drone mapping workflows for survey and construction projects within a single software platform. After dragging and dropping the JobXML data file, automated point cloud tools, such as classification and feature extraction, can quickly generate surface models, topographic plans and as-built deliverables. Also new: high-altitude flight capabilities, longer flight times and more intuitive battery-level readings in-flight.
The Snoopy CL-360 lidar scanner. (Photo: Lidar USA)
The Snoopy CL-360 has been meticulously designed for integration on backpack, vehicle and UAV applications. Weighing 5 kilograms fully assembled, the Snoopy CL-360 is capable of delivering highly accurate results, up to +/-0.01 feet on paved surfaces from a vehicle. The system has a scan line rate of 250 Hz with a 500-kHz data rate, giving a uniform result along and across track. The system is easily configurable with multiple scanners (similar to internet of things applications) to avoid occlusions. A UAV deployment achieves scans with usable data as much as 60 degrees off nadir (widths of more than 1,100 feet while scanning at the 400-foot ceiling). The small beam size of 0.3 mrad allows the CL-series to reliably collect ground points (such as on or near the dirt through vegetation) while also providing better detection of fine linear features such as power lines and railroad tracks.
The E300 Pro receiver tracks GNSS with 700 channels and fully supports BDS-3 signals. It supports 31 frequency points, using all GNSS constellations and frequency bands. The E300 interface has a concealed design for better protection. USB type-C charging and transmitting is a two-in-one function. The magnesium-alloy body is rugged, and the battery level can be checked with a unique LED power indicator. The weight of the whole receiver is 940 grams. The E300 Pro supports satellite station differential and satellite chain life, quick connection, intelligent voice and tilt compensation. It integrates multiple sensors including GNSS, an inertial measurement unit (IMU), a magnetometer and a thermometer. With the help of a Kalman filter algorithm, the device can dynamically output position, speed and attitude information. It can measure and make real-time dynamic sampling without the need for leveling. For better radio signal quality, the E300 Pro integrates GNSS, Bluetooth, Wi-Fi, 4G main and auxiliary antennas on the top of the receiver to ensure the best reception in all directions. An RF connector improves connection reliability while reducing loss of gain.
The Nova MS60 MultiStation combines upgraded, fast 3D laser-scanning capabilities, GNSS connectivity and digital imaging with a high-end total station. It features a fast laser-scanning speed of up to 30,000 points per second, optimized scan area definitions, adapted scan managements, and an improved scanning path for zenith scans. Professionals can perform point-cloud analysis in the field. Scan data is combined with traditionally measured points from GNSS receivers to graphically show locations the same day it is collected.
CP Aeronautics, a new division of CP Technologies, has launched integrated turn-key solutions based on unmanned aerial systems (UAS) platforms, payloads, data links, ground control stations (GCS) and communications for defense and civil applications. The systems offer operationally proven solutions for intelligence, surveillance and reconnaissance (ISR) systems requirements. Its broad product portfolio has demonstrated excellent performance and operability in demanding environments, the company stated in a press release. Backed by continuous research and development, the systems are built on three decades of technological and operational experience. Systems include Orbiter 2 Small UAS, Orbiter 3 Small Tactical UAS, Orbiter 4 Small Tactical UAS (pictured), Aerostar Tactical UAS, Dominator XP (medium-altitude long-endurance) and Pegasus 120 (vertical takeoff and landing).
A new flight control system (FCS) fits and leverages multi-mission, multi-domain UAV platforms. Using the FCS, the new Saker-1B Medium Altitude Long Endurance (MALE) UAV performs with fully autonomous online and offline operation, from takeoff to landing. Testing included more than 500 hours of day and night test missions under various weather conditions, including extremes of dust and heat. A total of 1,000 hours of take-off and landing test missions were successfully performed, with long-endurance flights lasting up to 19 hours. The Saker-1B is equipped with a satellite communication data link for beyond-visual-line-of-sight (BVLOS) operation. The FCS provides sustainability to jamming attacks and advanced data security.
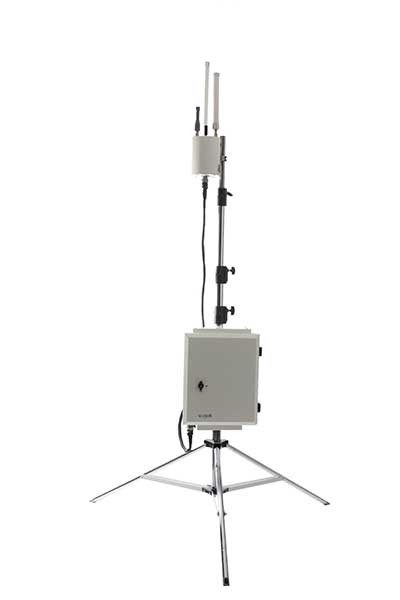
VigilAir is an RF-based system of deployed sensors able to accurately detect, geolocate and track commercial drones and their operators in different environments, including dense urban environments. VigilAir provides extremely sensitive detection and highly accurate geolocation and tracking over very large areas, with virtually zero false-alarms. Being a passive, receive-only system, VigilAir can easily be installed and operated without regulatory or legal limitations. The VigilAir version 2.0 C-UAS (counter unmanned aerial system) is certified by the United Kingdom Center for the Protection of National Infrastructure (CPNI) under the CPNI’s Counter Unmanned Aerial Systems Detect, Track and Identify (DTI) testing and evaluation standard. VigilAir generates a comprehensive drone situational awareness which enables users to proactively and intelligently match correct mitigation actions with actual drone threats, on time and with minimal collateral effects.
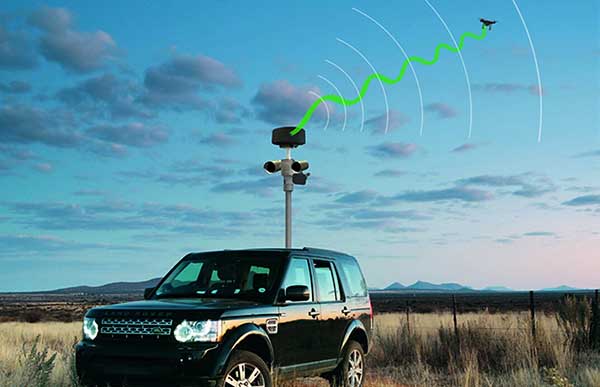
Xpeller Rapid — the mobile version of the counter UAV solution Xpeller — uses a combination of radar, electro-optical sensors, rangefinders and jammers to protect against threats posed by over-the-counter drones. Xpeller Rapid is either integrated into a vehicle (mast solution) or comes in transport boxes and can be easily set up on tripods. Based on the Xpeller toolkit, the components follow the detect, identify, control and act workflow, defeating hostile drones at ranges up to several kilometers. The system can locate and classify even small hobby drones at a range of several kilometers. High-resolution cameras make it possible to decide whether there is a serious threat so that it can be countered with appropriate countermeasures.
RoboSense is offering the solid-state lidar RS-LiDAR-M1Simple (Simple Sensor Version), which is less than half the size of the previous version at 4.3 x 1.9 x 4.7 inches (110 x 50 x 120 millimeters).
It is equipped with enhanced hardware performance virtually equal to the serial production version provided to OEMs. The main body design of this automotive-grade solid-state lidar is finalized and ready for shipment.
The RS-LiDAR-M1Smart main body is embedded with an artificial intelligence (AI) perception algorithm that takes advantage of lidar’s potential to transform conventional 3D lidar sensors to a full data analysis and comprehension system, outputting semantic-level structured environment information in real time to be used directly for autonomous vehicle decision making.
The RS-LiDAR-M1 family has the performance advantages of traditional mechanical lidar, simultaneously taking into consideration requirements for the mass production of vehicles.
The RS-LiDAR-M1Smart Features
Adapts to complex traffic conditions.
Supports multiple driving scenarios.
Supports dense traffic flow, such as mixing pedestrians and vehicles in intersections during peak hours.
Comprehensive perception of a wide range of dynamic, static and background objects.
Achieves semantic-level prediction for 3D point clouds.
Handles the challenges caused by two-wheel vehicles (motorcycles, bicycles, etc.) and pedestrians who do not follow traffic rules.
Over-segmentation and under-segmentation are fixed based on the clustering algorithm. The robustness against sparse point clouds ensures the integrity of object detection.
Outputs two redundant channels of data: the original point cloud and the object list. The two channels of data are redundant to provide vehicles with a wide range of sensing results, including dynamic and static and inside and outside the road.