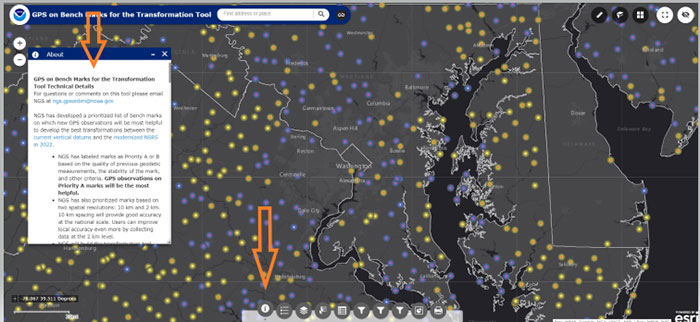
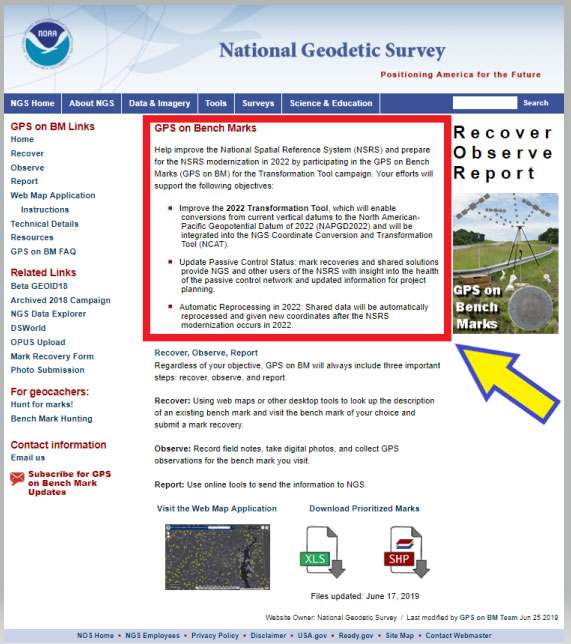
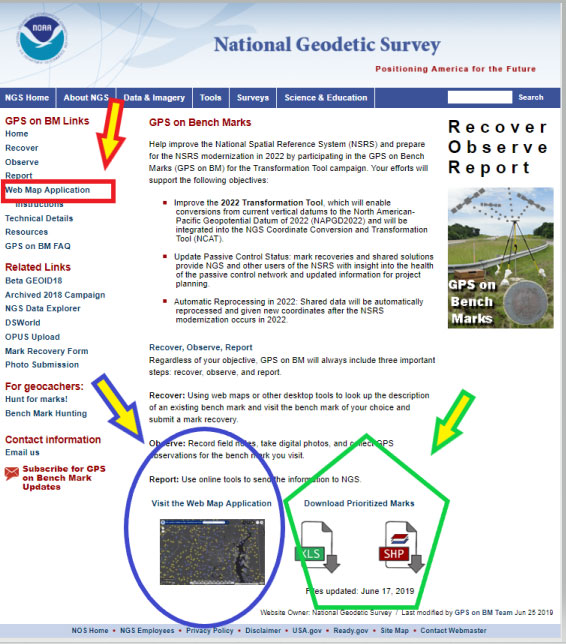
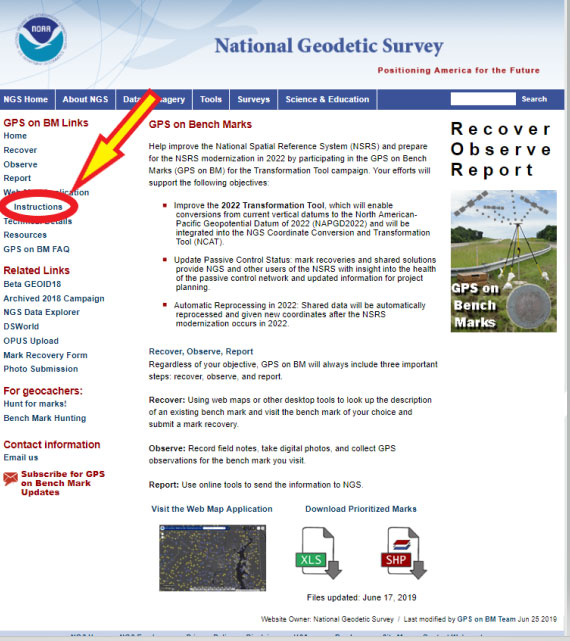
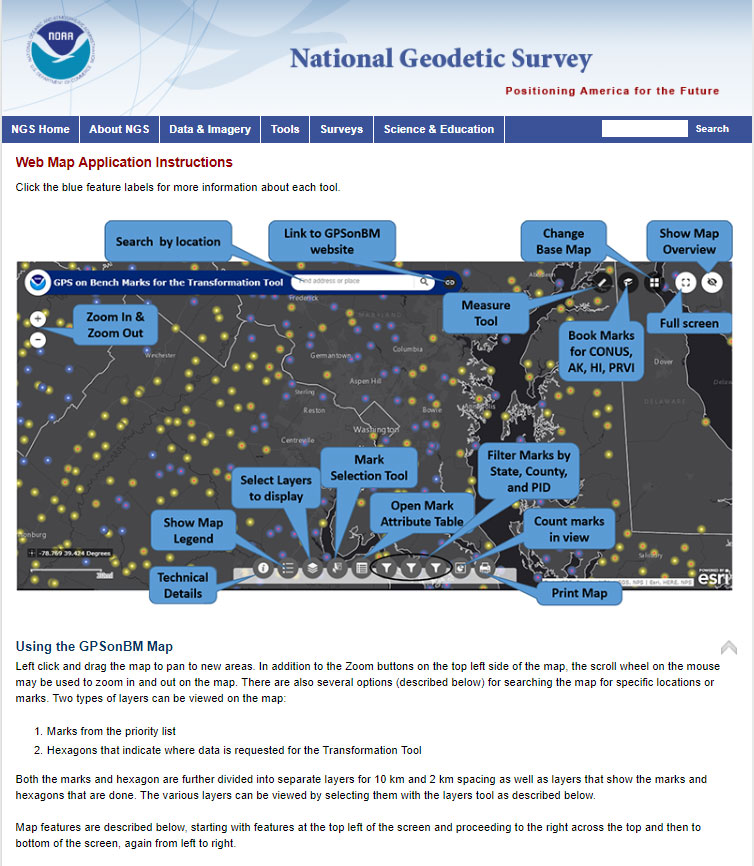
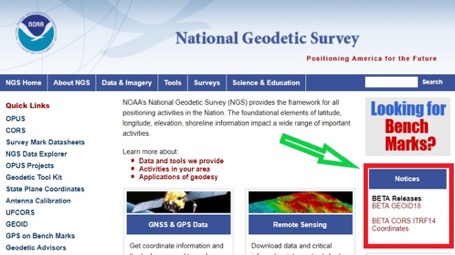
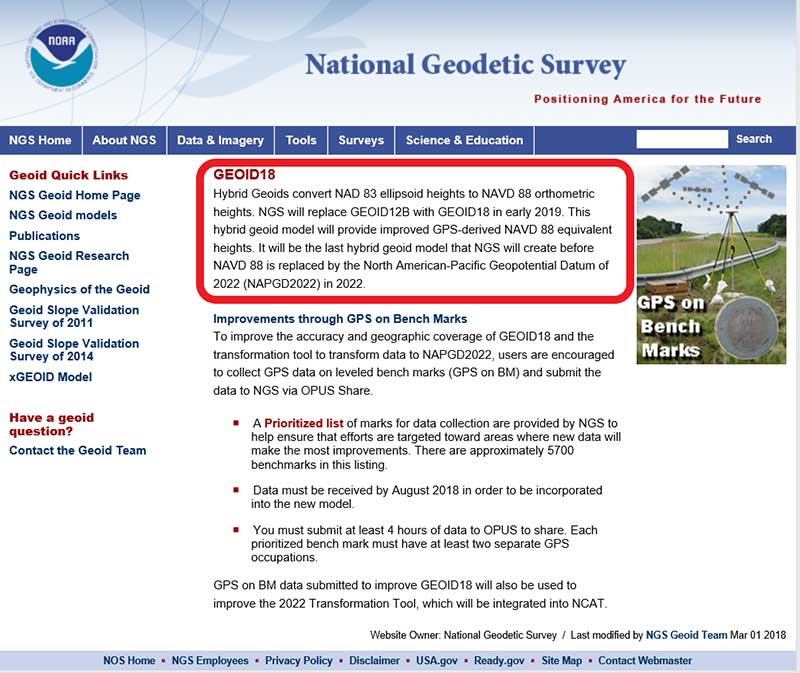
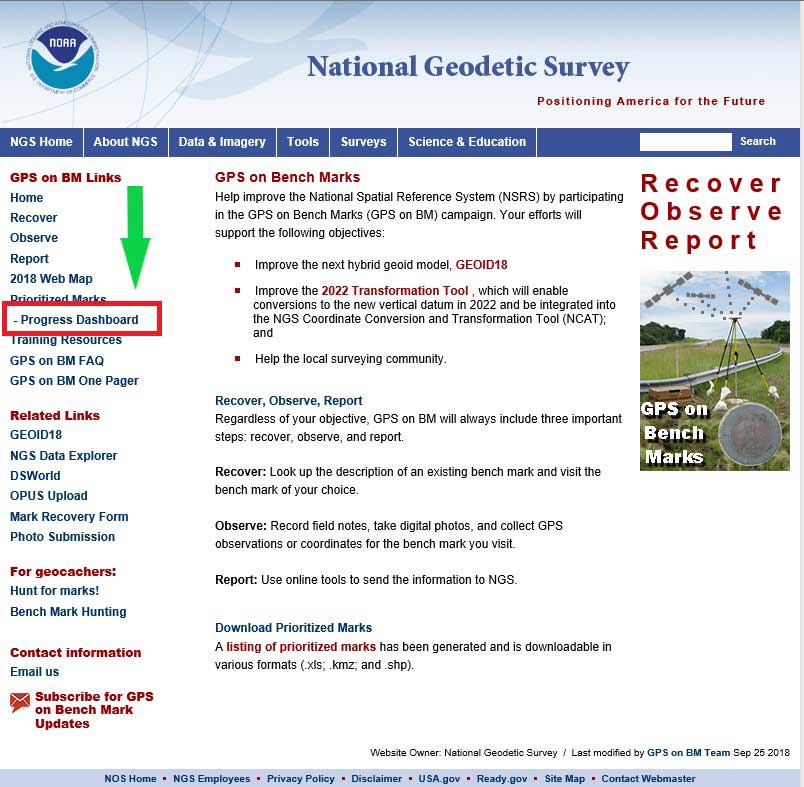
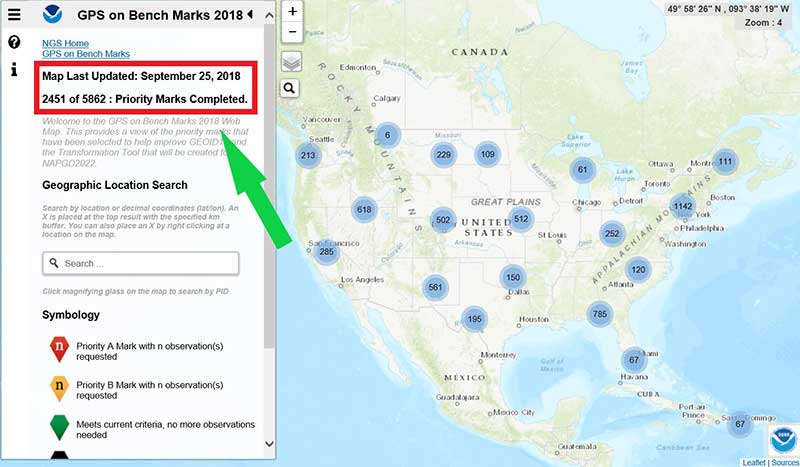
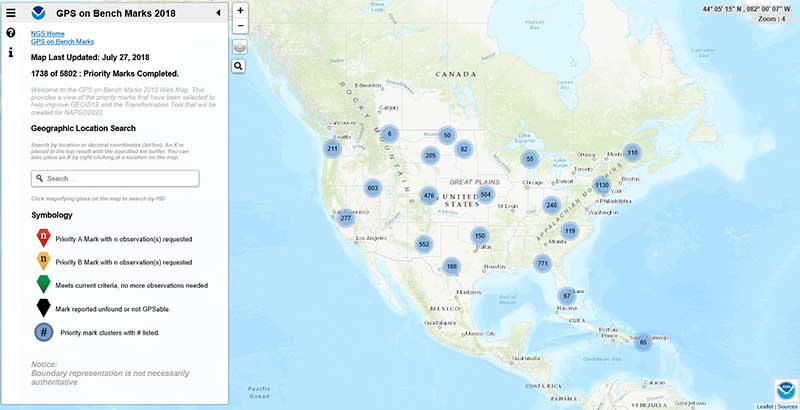
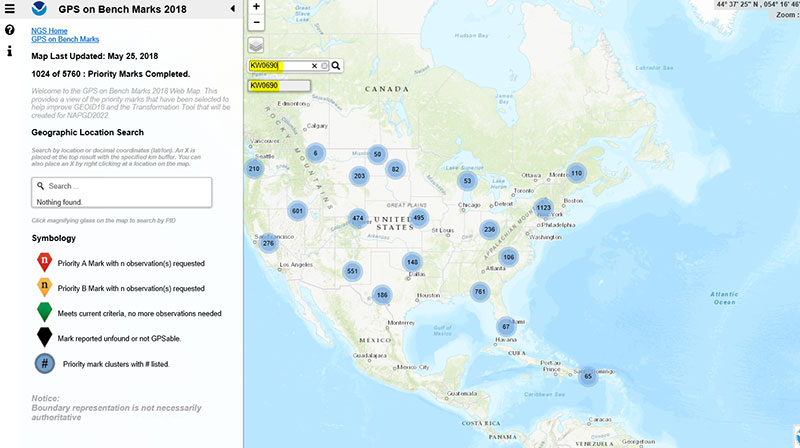
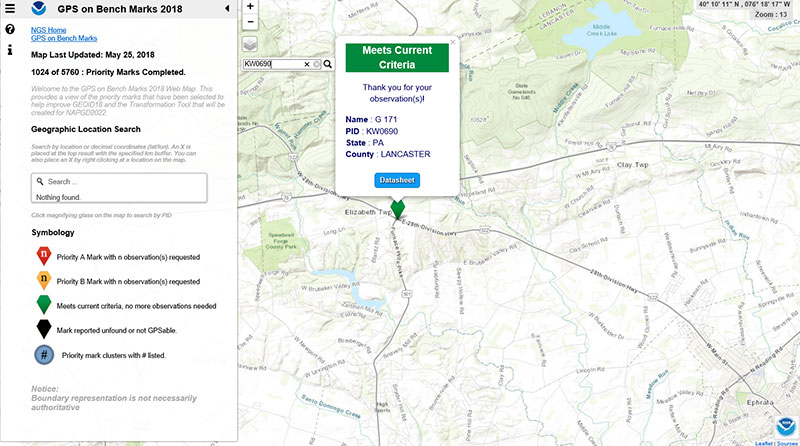
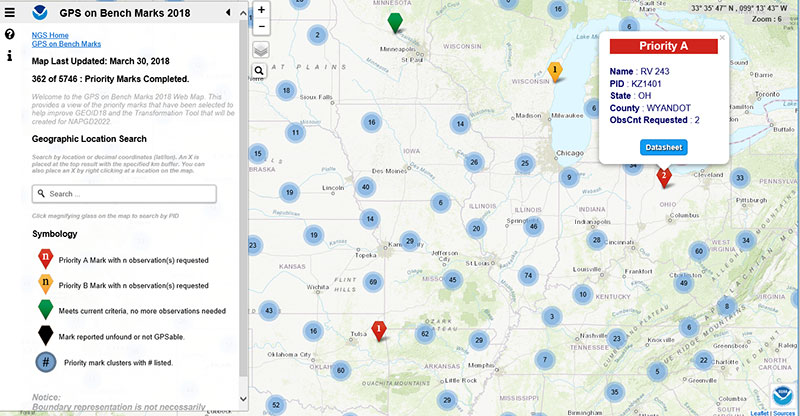
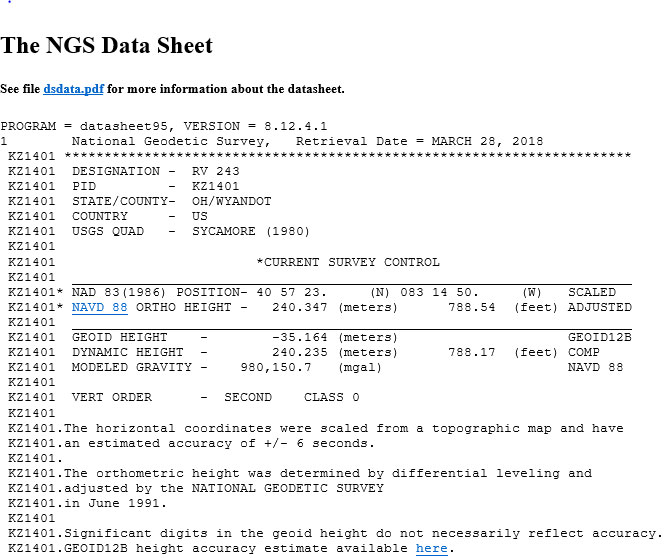
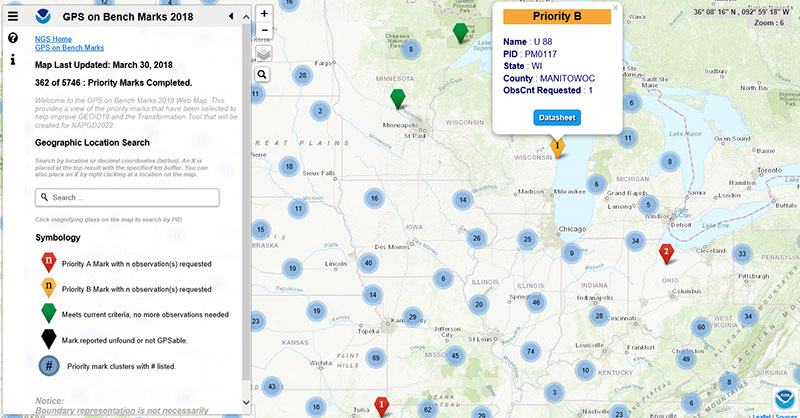
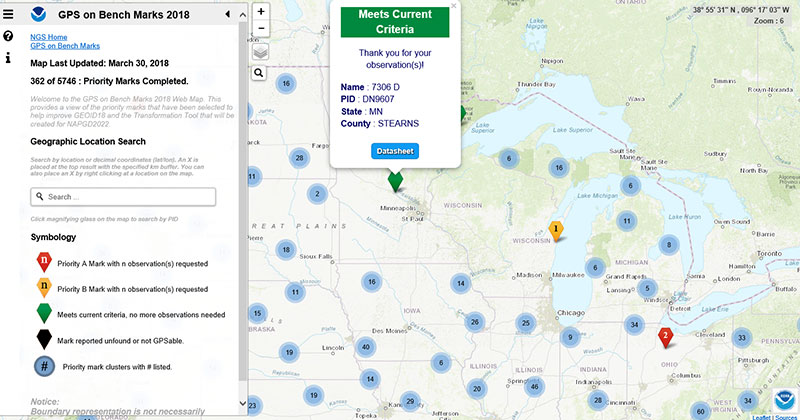
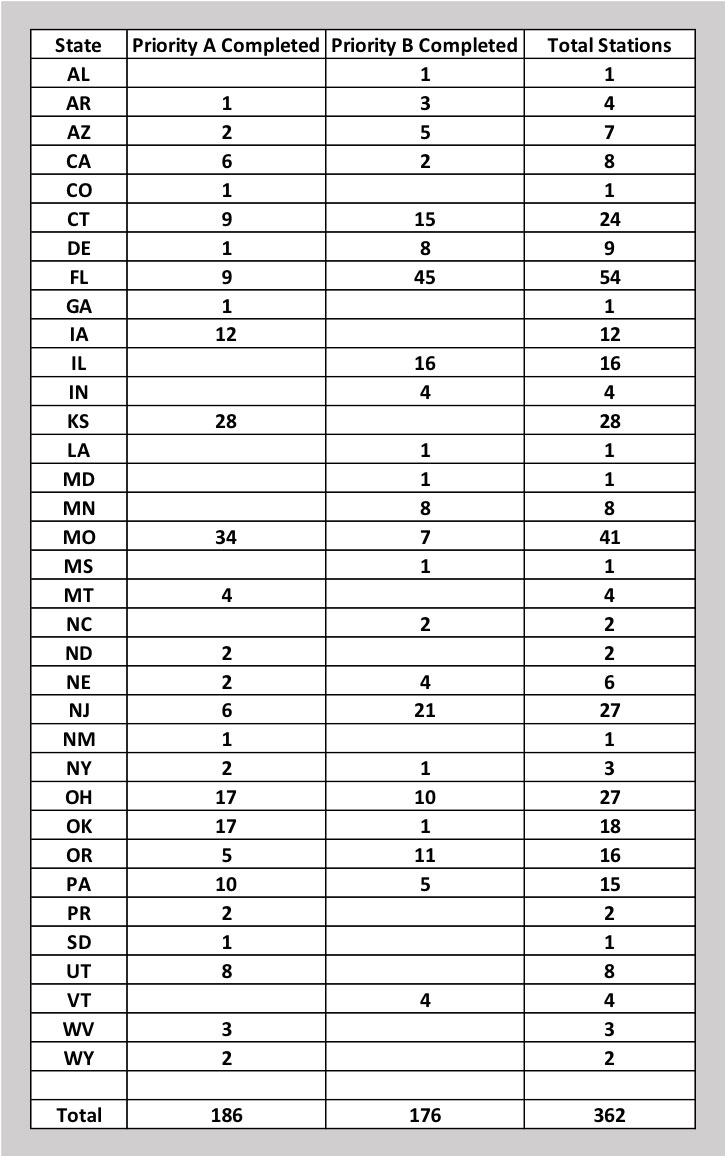
My last column highlighted the next phase of the National Geodetic Survey’s (NGS) GPS on Bench Marks program; that is, the development of the 2022 transformation model. It provided web links to material explaining the new GPS on Bench Marks program. NGS continues to update this site so I would encourage users to periodically check the site for updates. At the time of this column, the site was updated on Sept. 13. See the box titled “GPS on Bench Mark Web Page.”
GPS on Bench Mark Web Page
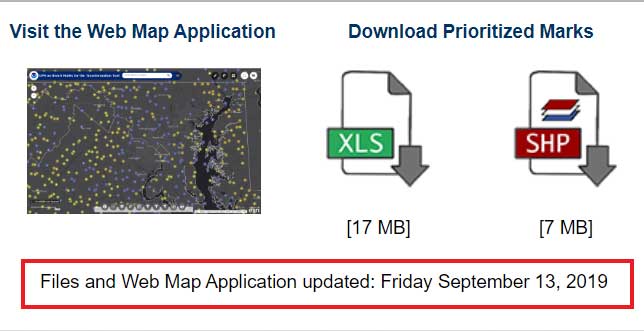
This column is going to focus on the newly released beta version of NCAT 2.0, which includes the new beta version of VERTCON 3.0. See the box titled “NGS Product Updates.”
NGS Product Updates
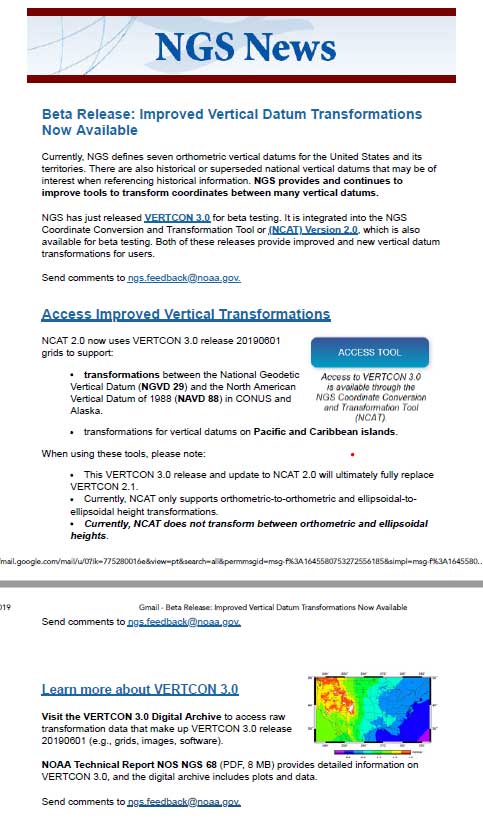
On Sept. 24, NGS sent an NGS News Update through its data delivery system. See the box titled “NGS News Announcement of VERTCON 3.0.”
NGS News Announcement of VERTCON 3.0
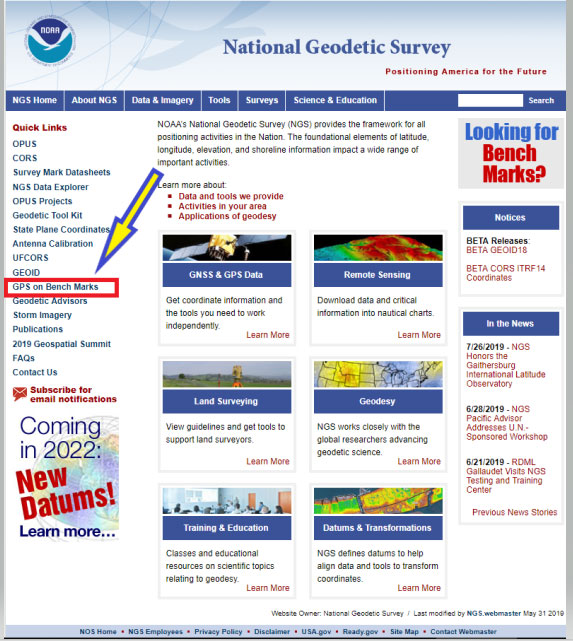
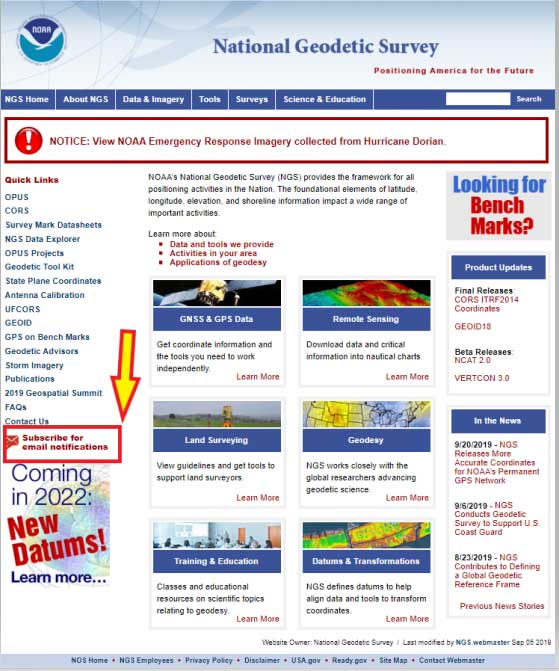
As a side note, anyone can sign up for NGS News announcements by clicking on the button titled “Subscribe for email notifications” on the left side of NGS Home Page. See the box titled “Subscribe for NGS Email Notifications “
Subscribe for NGS Email Notifications
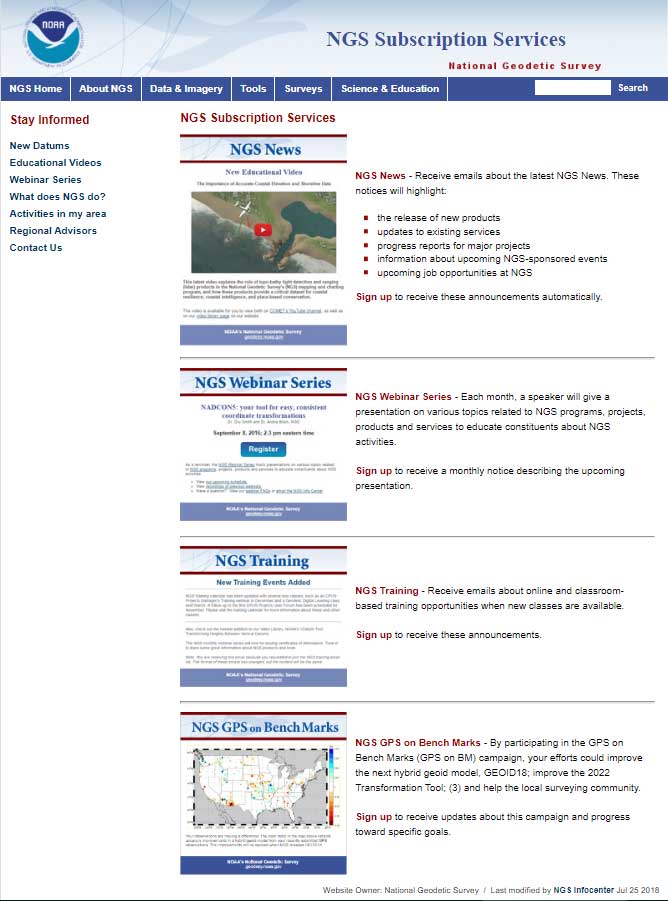
At this time, there are four NGS subscription services available:
- NGS News
- NGS Webinar Series
- NGS Training
- NGS GPS on Bench Marks.
For more information on how to sign up for each of the subscription series click here. (See the box titled “NGS Subscription Web Page.”)
NGS Subscription Web Page
Why is NGS Updating VERTCON now?
First, NGS published a technical document that provides a brief history of previous versions of the VERTCON model and the technical details of the new beta VERTCON 3.0 model. The report is titled “NOAA Technical Report NOS NGS 68,The VERTCON 3.0 Project” and can be downloaded here.
NGS decided to update the existing VERTCON tool with two primary purposes in mind:
- to support as many of the vertical datums of the NSRS as possible, and
- to prepare users for the new North American-Pacific Geopotential Datum of 2022 (NAPGD2022).
NGS plans include incorporating the new VERTCON 3.0 model into its integrated products and services. See the box titled “Excerpt from NOAA Technical Report NOS NGS 68, The VERTCON 3.0 Project: Motivation for VERTCON 3.0.”
As a matter of fact, the beta version of VERTCON 3.0 is included in an updated beta version of the NGS Coordinate Conversion and Datum Transformation Tool (NCAT). This column will provide examples converting NGVD 29 heights to NAVD 88 heights using the new beta versions of NCAT and VERTCON.
Excerpt from NOAA Technical Report NOS NGS 68, The VERTCON 3.0 Project: Motivation for VERTCON 3.0The greatest driver for VERTCON 3.0 was the pending release of NAPGD2022, expected in late 2022. As part of that release, NGS intends to release grids to transform between existing vertical datums and NAPGD2022. As the build software used to create all previous versions of VERTCON was no longer available, it was decided (like NADCON; see Smith and Bilich, 2017) to completely recreate the entire suite of VERTCON build software. However, unlike horizontal datums, the history of vertical datums at NGS is, as mentioned earlier, quite limited. As a transformation can only exist if two datums are released in a region, this limits what expansion to VERTCON 2.1 might be possible. Nonetheless, most regions at least had “Local Tidal” heights published by NGS as well as some other official vertical datum of the NSRS, so a decision to support transformation in these regions was made. Knowing that such a re-build would replace VERTCON 2.1, the new project and its build software were designated from the beginning as “VERTCON 3.0”. Other expected advantages with this project were the chance to update documentation and the delivery of the transformations, through incorporation into newly integrated products and services like the NGS Coordinate Conversion and Datum Transformation Tool (NCAT, available at https://www.ngs.noaa.gov/NCAT/) and VDatum (available at https://vdatum.noaa.gov/). |
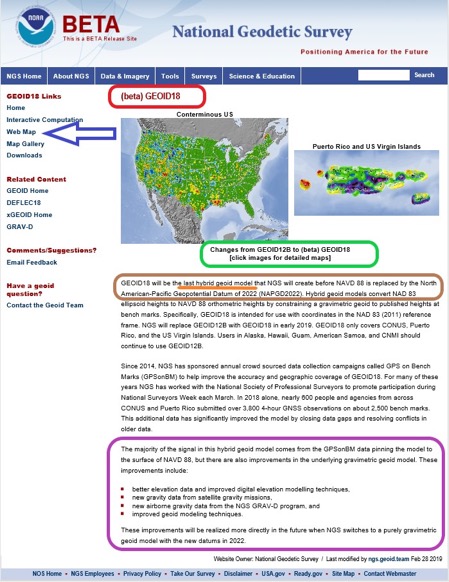
Users can access the VERTCON 3.0 model by clicking on the VERTCON 3.0 link on NGS Home Page. It will direct the user to this website.
See box titled “VERTCON 3.0 Web Site.” The user can also download the Technical Report from this site.
VERTCON 3.0 Web Site
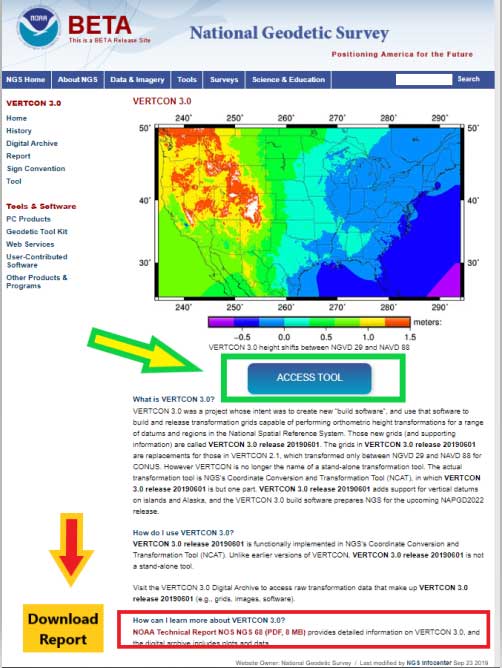
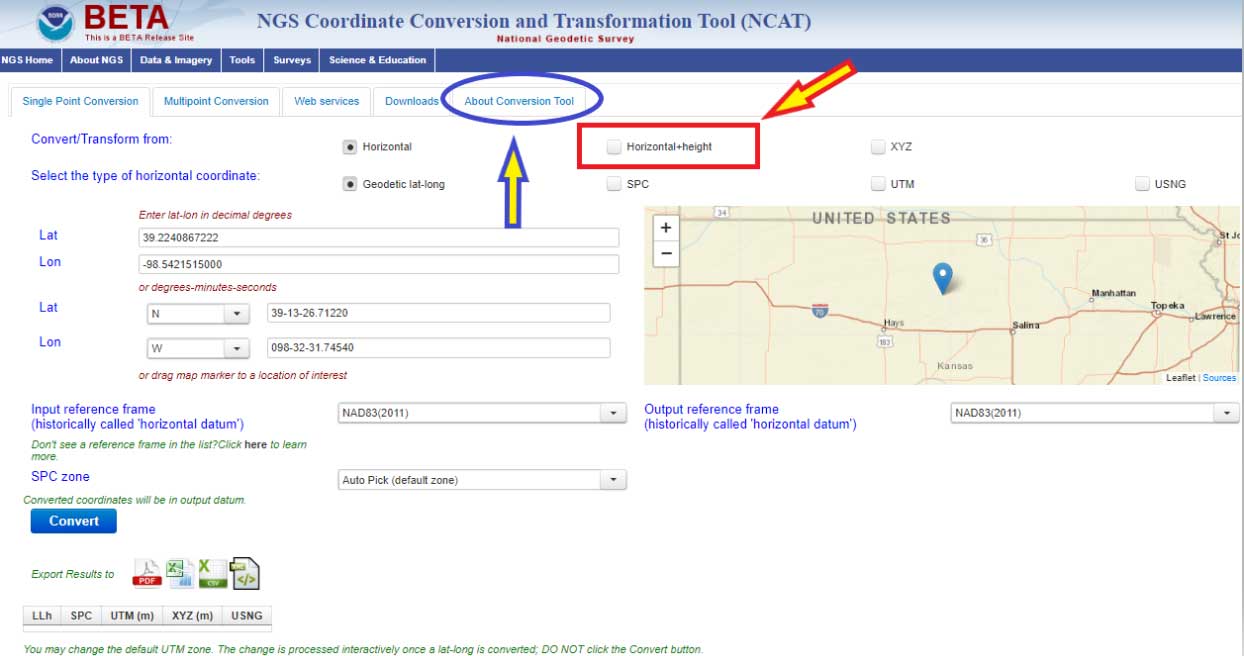
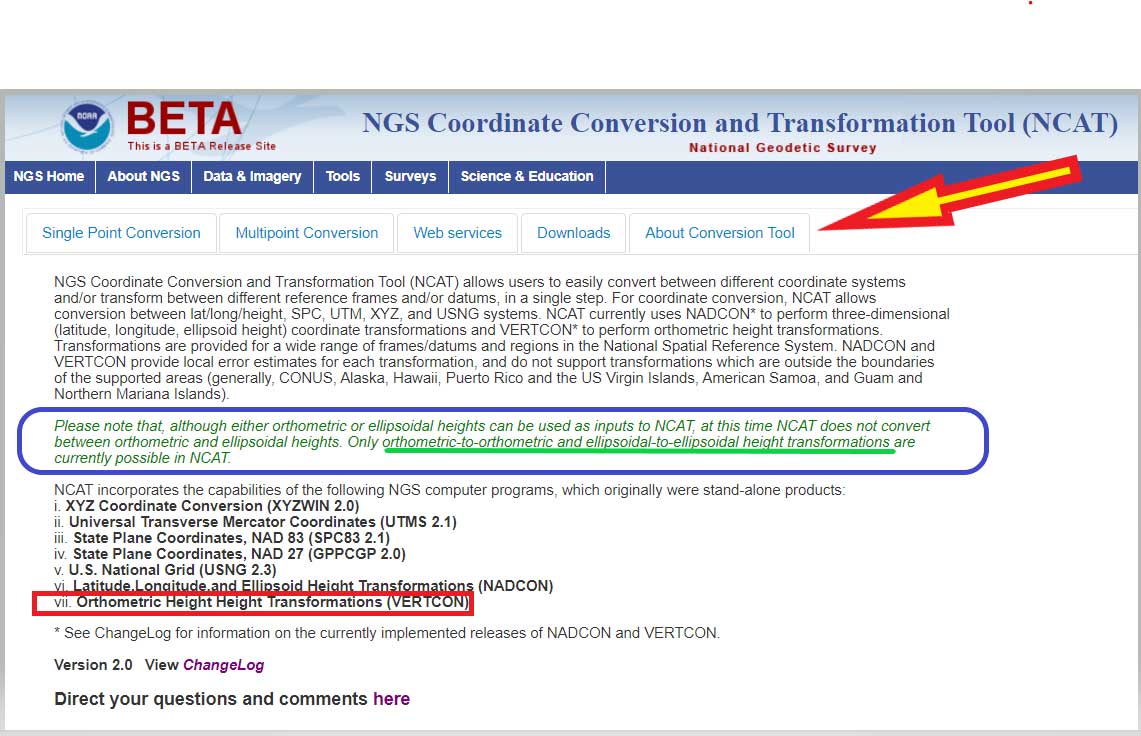
Clicking on the “Access Tool” button” connects the user to the Beta NCAT website. See box titled “Beta NCAT Website.” Two links have been highlighted in the box: “About Conversion Tool” and “Horizontal+height.”
The default values for the beta NCAT are “Horizontal” and “Geodetic lat-lon.” If the user wants to use the VERTCON 3.0 option, he or she must click on the button “Horizontal+height.”
Beta NCAT Website
Clicking on the “About Conversion Tool” provides a brief description of the tool. I’ve highlighted a section in the description that should be pointed out to users. See the box titled “NCAT Brief Description” and the statement below.
“Please note that, although either orthometric or ellipsoidal heights can be used as inputs to NCAT, at this time NCAT does not convert between orthometric and ellipsoidal heights. Only orthometric-to-orthometric and ellipsoidal-to-ellipsoidal height transformations are currently possible in NCAT.”
NCAT Brief Description
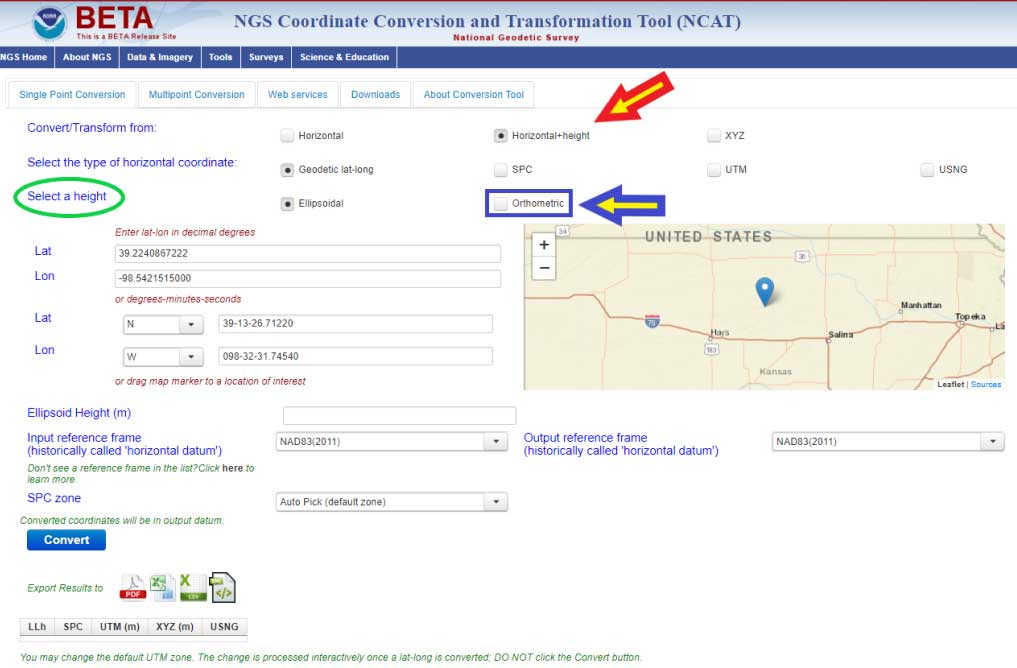
What this means is that you can convert, at this time, stations located in the Conterminous United States and Alaska from NGVD 29 to NAVD 88, and from NAVD 88 to NGVD 29. In order to convert from one orthometric height system to another, you have to click on another button. I’ve highlighted the button in the box titled “Single Point Conversion – Horizontal+height.” Clicking on the button “Horizontal+height” initiates another set of buttons under the section titled “select a height.” There are two options ellipsoid or orthometric. The ellipsoid button is the default option. If you want to convert a height from the NGVD 29 datum to the NAVD 88 datum the user needs to select the button titled “orthometric.”
Single Point Conversion – Horizontal+height
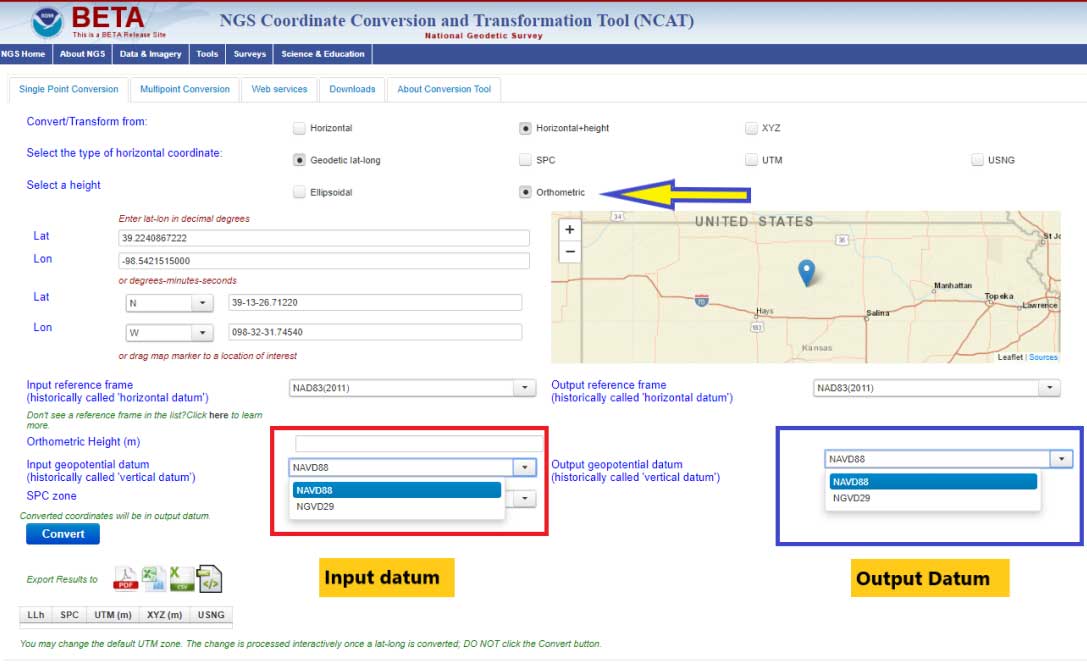
The box titled “Select a Height Option” is a screenshot of the site after the user clicks the “Orthometric height option. The user can now select the input and output vertical datums. The input and output datum options are highlighted in the box.
Select a Height Option
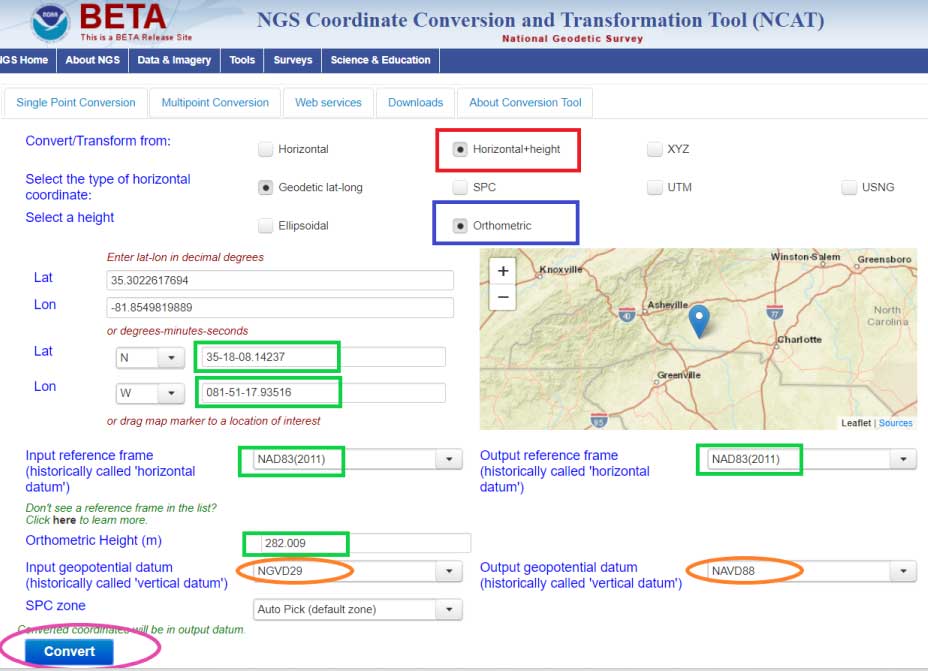
Once you select the input and output vertical datums, you need to input the latitude and longitude of the station, select the reference frame, and input an orthometric height value to be converted. You must enter an orthometric height that you want to be converted. The box titled “Converting from NGVD 29 to NAVD 88 – Input Parameters” provides an example for station RU 36 (PID FA1337) located in Rutherford County, North Carolina.
Converting from NGVD 29 to NAVD 88 – Input Parameters
After you enter your input parameters, click on the button titled “Convert.” The box titled “Converting from NGVD 29 to NAVD 88 – Output Solution” provides the output from Beta NCAT tool. The input height and output heights are highlighted in the box. The solution also provides an estimate of the accuracy of the value (SigOrthoht).
Converting from NGVD 29 to NAVD 88 – Output Solution
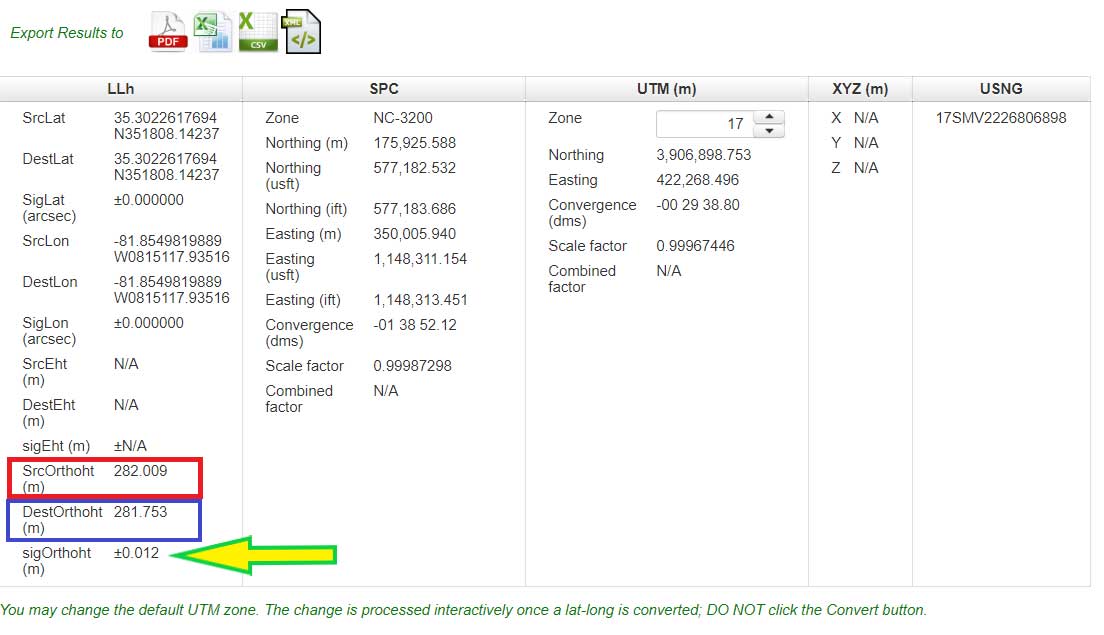
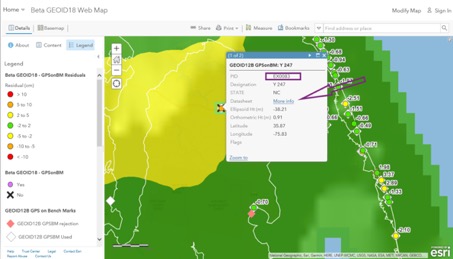
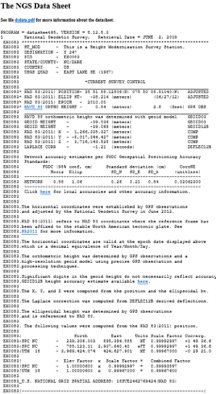
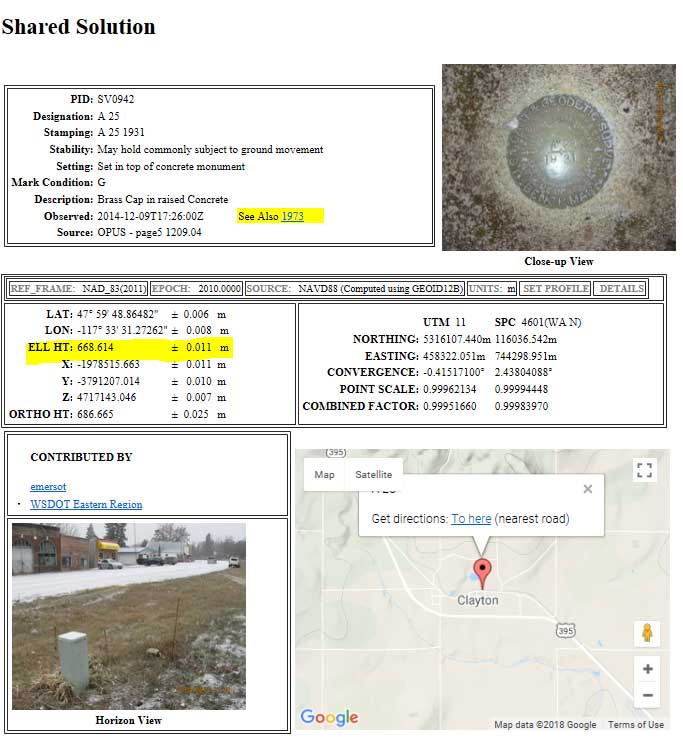
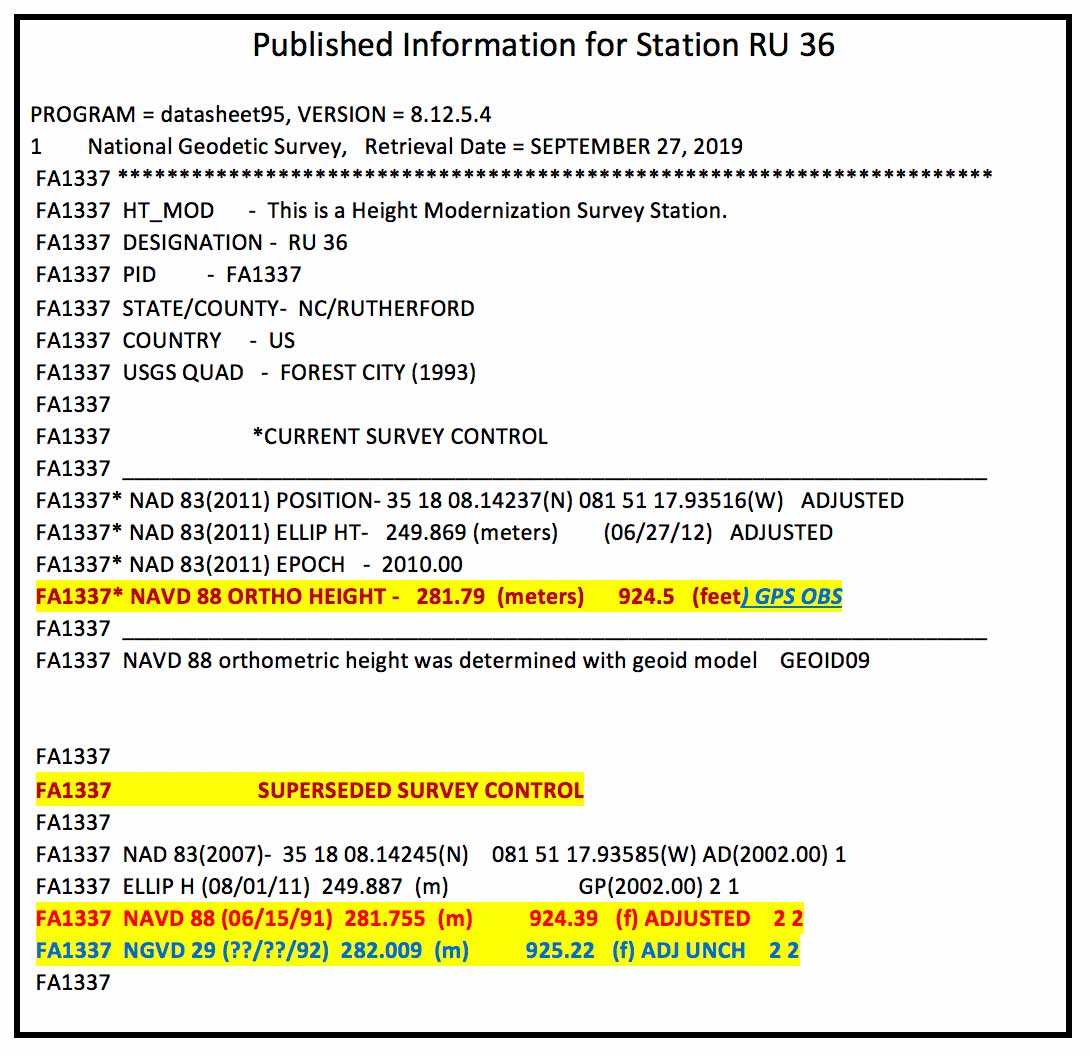
The published information for RU 36 (PID FA1337) is listed in the box titled “Published Information for Station RU 36.” The NGVD 29 height converted to a NAVD 88 orthometric height from the Beta NCAT tool agrees with the superceded NAVD 88 height to within a couple of millimeters (281.753 m minus 281.755 m = -0.002 m). Saying that, the station was superseded with a GNSS-derived orthometric height and the difference is a little larger, 281.79 m minus 281.753 m = 0.037 meters. I’m not saying that there’s anything wrong with the conversion model, I’m only highlighting that, in this case, it agrees with the NAVD 88 leveling-derived heights even though that station has been superceded by a GNSS-derived orthometric height. Users should be aware of this.
Published Information for Station RU 36
Also, it should be noted that the current version of VERTCON is based on published NAVD 88 heights as of a certain date. If a station has been readjusted since VERTCON 3.0 was generated, then the difference between the modeled value and the published value may be different. The actual difference will depend on how much the newly published orthometric height differs from the previously published orthometric height. If a single station’s height changed due to being disturbed by a local phenomenon such as road construction equipment, then the VERTCON value should still be valid.
However, if the heights of several stations in a region changed due to a regional phenomenon such as crustal movement and/or a large adjustment distribution correction due to a regional vertical control network adjustment, then the VERTCON values may not provide the best estimate of the difference between the two datums.
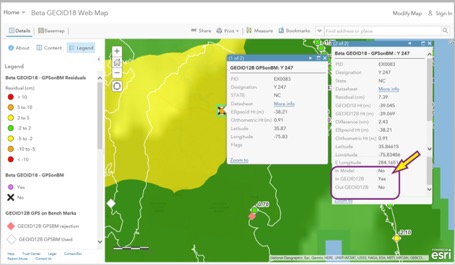
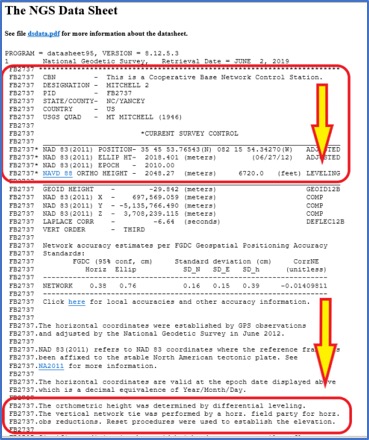
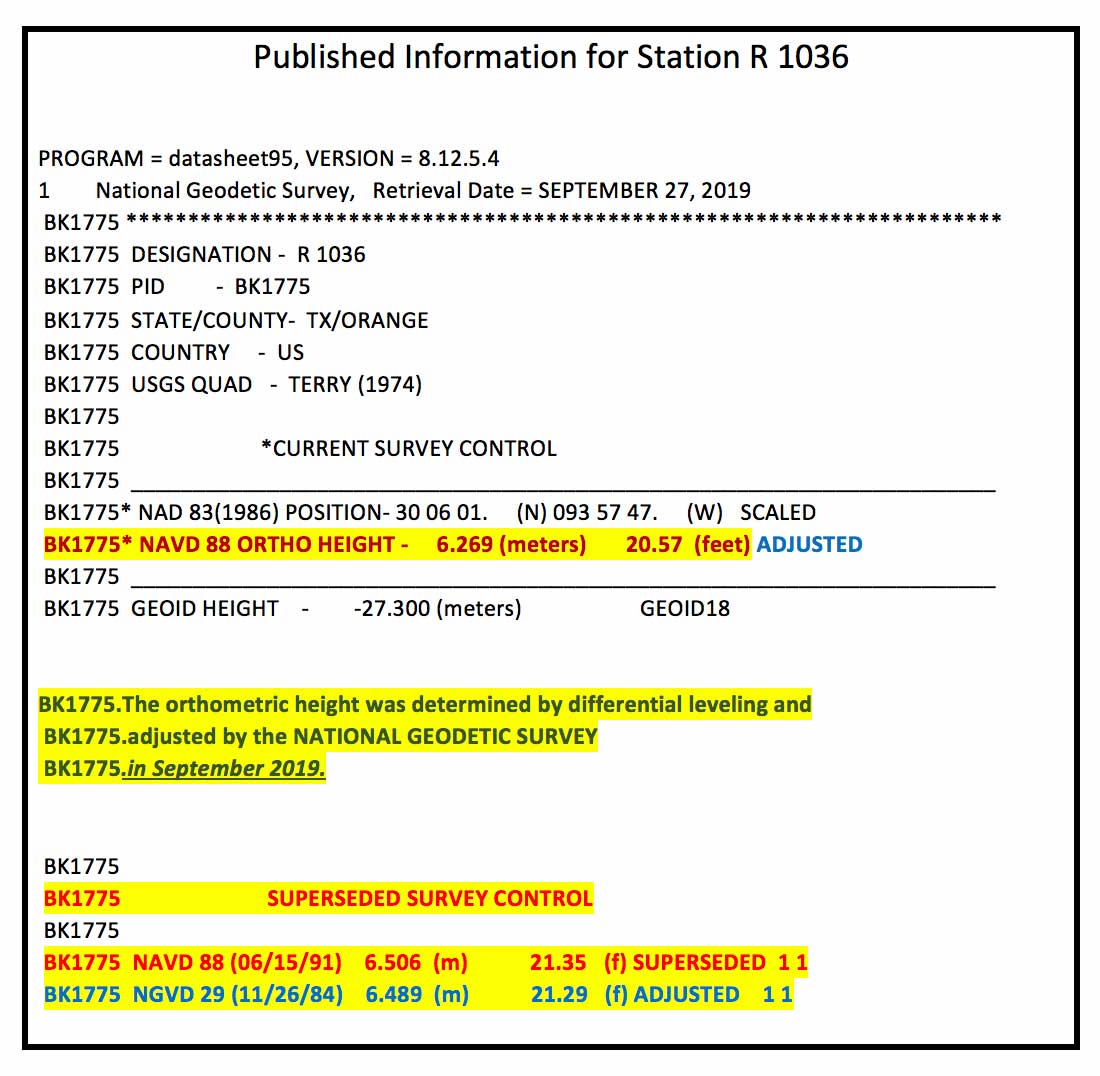
An example of this is provided in the boxes titled “Published Information for Station R 1036” and “Converting from NGVD 29 to NAVD 88 – Output Solution for Station R 1036.” Station R 1036’s NAVD 88 height was updated in September 2019 ,which was after the creation of the VERTCON model. This means that the latest published NAVD 88 height (6.269 m) would not have been used in the model. The newly adjusted NAVD 88 height and the superseded height differ by –23.7 cm (6.269 m – 6.506 m). In this case, this is not an isolated change of a single station’s published height. The adjusted heights of the stations in the region have all changed due to apparent crustal movement and/or a large distribution correction due to a vertical network adjustment.
Published Information for Station R 1036
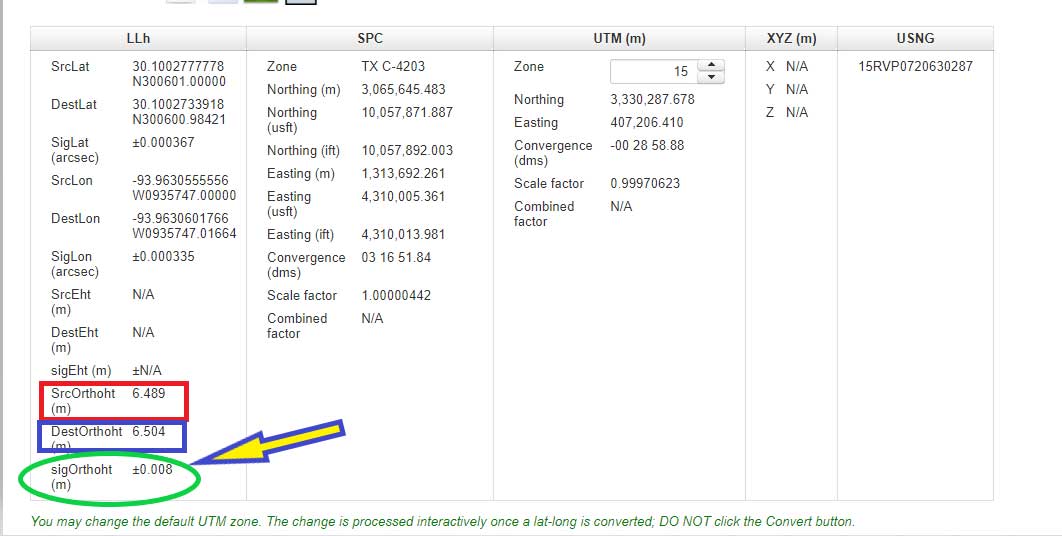
The box titled “Converting from NGVD 29 to NAVD 88 – Output Solution for Station R 1036” provides the converted NAVD 88 height using the NCAT tool. The converted NGVD 29 to NAVD 88 value differs by 23.5 cm (6.504 m minus 6.269 m). Which is expected because the newly published height and superseded height differ by 23.7 cm. It agrees to within 2 mm of the previously published NAVD 88 height (6.506 m minus 6.504 m = 0.002 m). Once again, this is not implying that there is something wrong with the VERTCON model. It’s only to note the limitations of the model. Users need to remember that it is a model and it does not produce geodetic quality coordinate values.
Converting from NGVD 29 to NAVD 88 – Output Solution for Station R 1036
Users can also convert from other vertical datums published by NGS. These datums include:
- Puerto Rico Vertical Datum of 2002 (PRVD 02)
- American Samoa Vertical Datum of 2002 (ASVD 02)
- Northern Mariana Vertical Datum of 2003 (NMVD 03)
- Guam Vertical Datum of 2004 (GUVD 04)
An example of converting a station with a PRVD 02 orthometric height to a Local Tide (LT) value is provided is the boxes titled “Converting from PRVD 02 to Local Tide (LT) – Input Parameters“ and “Converting from PRVD 02 to LT – Output Solution for Station 11 R RESET.”
Converting from PRVD 02 to Local Tide (LT) – Input Parameters
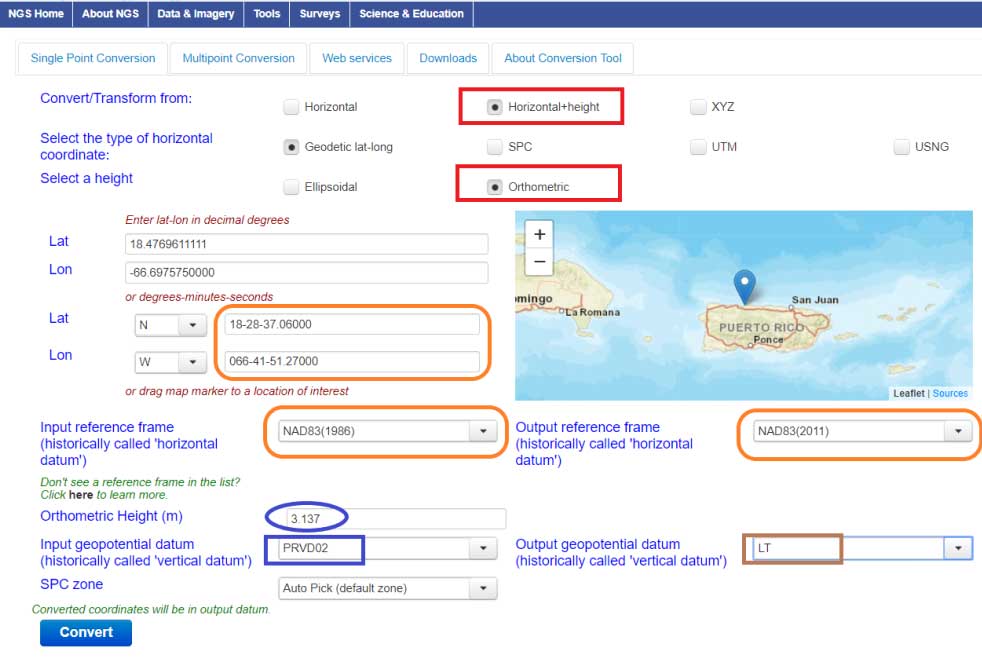
Converting from PRVD 02 to LT – Output Solution for Station 11 R RESET
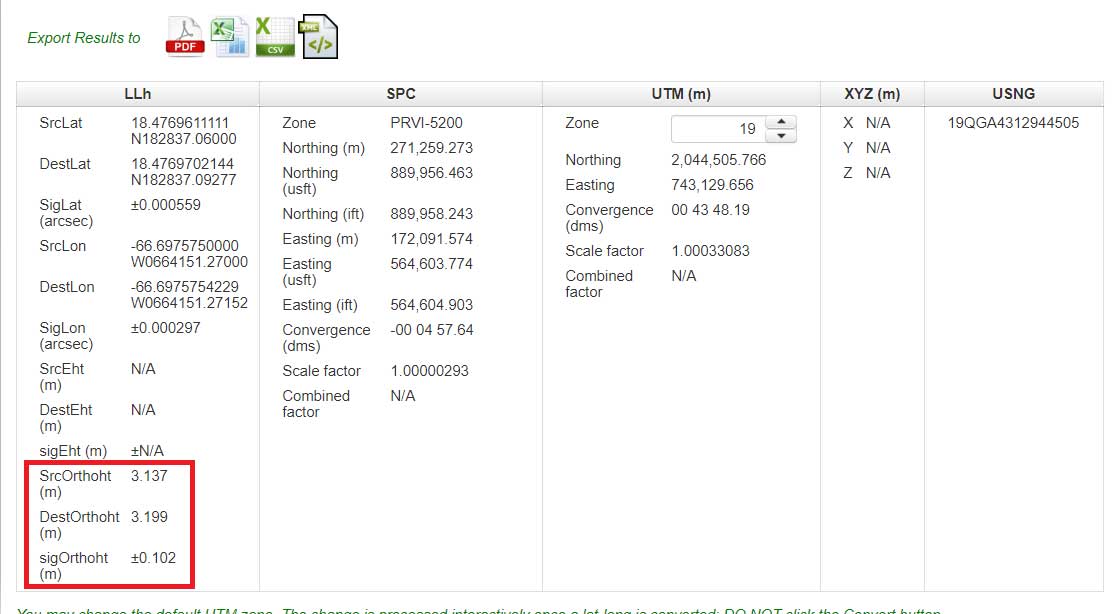
Notice that the difference between the PRVD 02 and converted LT value differ by 0.062 m but the accuracy estimate is +/- 0.102 m.
In my opinion, the VERTCON model and the NCAT tool are extremely helpful tools to the surveying and mapping community. NGS is developing these models and tools to support the implementation of the North American-Pacific Geopotential Datum of 2022 (NAPGD2022). I would encourage all users to download the technical report and perform a couple of conversions in your area of interest.
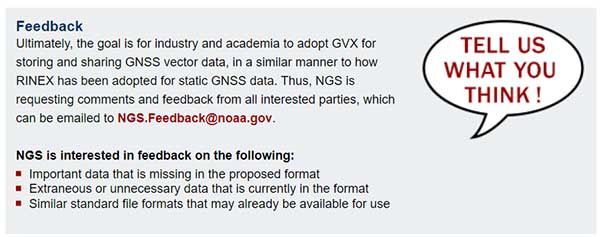
NGS would like individuals to use the beta products and services and provide feedback. What do you like about the tool and its features? What would you like changed or added to the service? I hope everyone will try the beta version and contact NGS with their comments.
NGS is in a listening mode and wants to develop models and tools to assist users in their transition to the new reference frames in 2022. This is your opportunity to let NGS know what you need (desire) to implement the new reference frames.