Tag: satellite imagery

  • Analysis of satellite imagery shows reduced NO2 in China, Italy

    Analysis of satellite imagery shows reduced NO2 in China, Italy

    Screenshot: ESA video
    Screenshot: ESA video

    Descartes Labs, a geospatial data analytics company, is using satellite imagery analysis to examine how the coronavirus reduced nitrogen dioxide (NO2) emissions in China.

    NO2 is produced by vehicles, power plants and heavy industries such as cement manufacturing, which were shut down during the coronavirus epidemic.

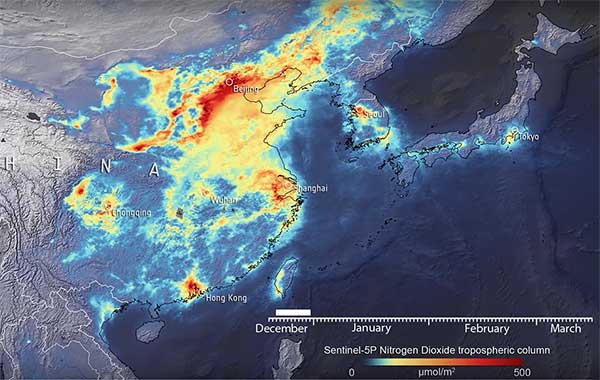
    Descartes Labs shared its visualization in a Facebook post. The visualization maps a time series of NO2 levels across Eastern China, Japan and the Korean Peninsula using data from the European Space Agency (ESA)  Sentinel-5P satellite.

    Plots of NO2 emissions from 2019 compared to 2020 show declines of nearly 60%. Read more on Descartes Lab’s blog.

    Copernicus data shared

    In a video provided by ESA, a drop in concentrations in late January is visible in China, coinciding with the nationwide quarantine; from the beginning of March, the nitrogen dioxide levels have begun to increase.

    Italy reduction

    Copernicus data also reveals the decline of air pollution, specifically nitrogen dioxide emissions, over Italy. This reduction is particularly visible in northern Italy, coinciding with its nationwide lockdown to prevent the spread of the coronavirus.

    “Satellites offer a unique vantage point to monitor the health of our planet,” said Josef Aschbacher, ESA’s director of Earth Observation Programmes. “Sentinel-5P is one of seven Copernicus satellites in orbit today. It currently provides the most accurate measurements of nitrogen dioxide and other trace gases from space.

    “As nitrogen dioxide is primarily produced by traffic and factories, it is a first-level indicator of industrial activity worldwide,” Aschbacher said. “What is clearly visible is a significant reduction of nitrogen dioxide levels over China, caused by reduced activity due to COVID-19 restrictions, but also the Chinese New Year in January. The Copernicus programme is a perfect example of how space serves all European citizens by combining the political strength of the EU with the technical excellence of ESA.”

    “We can certainly attribute a part of the nitrogen dioxide concentration reduction to the impact of the coronavirus,” said Claus Zehner, ESA’s Copernicus Sentinel-5P mission manager. “We currently see around a 40% reduction over Chinese cities, however these are just rough estimates, as weather also has an impact on emissions. We are conducting a detailed scientific analysis which will soon provide more insights and quantified results in the following weeks and months.”

    The Copernicus Sentinel-5 Precursor mission, also known as Sentinel-5P, is dedicated to monitoring air pollution by measuring a multitude of trace gases as well as aerosols — all of which affect the air we breathe.

  • AI helps create street maps from satellite imagery

    AI helps create street maps from satellite imagery

    Creating detailed street maps and keeping them updated is an expensive and time-consuming task performed mostly by large companies. They ignore the many parts of the world where this task is not profitable, even though the need is high due to rapid growth and change in the street network, such as in Thailand.

    To automate the process and make accurate digital maps available in any country, researchers at the Massachusetts Institute of Technology (MIT) and the Qatar Computing Research Institute have developed an artificial intelligence (AI) model called RoadTagger. It uses satellite imagery to tag road features in digital maps, such as lane counts, which are essential for reliable navigation.

    Satellite imagery companies are constantly expanding their coverage and increasing their refresh rate, so this source of mapping data is more readily available and up to date than the data collected on the ground, such as by Google’s fleet of mapping cars. However, satellite imagery often suffers from occlusion from trees, buildings, overpasses and other obstacles.

    RoadTagger gets around this problem by using a combination of neural network architectures to predict hidden features. Testing of the model with digital maps of 20 U.S. cities showed that it predicted the number of lanes with 77% accuracy and the road type with 93% accuracy.

    An AI model developed at MIT and Qatar Computing Research Institute that uses only satellite imagery to automatically tag road features in digital maps could improve GPS navigation, especially in countries with limited map data. (Image: Google Maps/MIT News)
    An AI model developed at MIT and Qatar Computing Research Institute that uses only satellite imagery to automatically tag road features in digital maps could improve GPS navigation, especially in countries with limited map data. (Map data: Google/MIT News)

    RoadTagger, which combines a convolutional neural network (CNN) and a graph neural network (GNN) is fed only raw data and automatically produces output, without human intervention. The CNN, commonly used for image-processing tasks, takes as input raw satellite images of target roads. The GNN — widely used to model relationships between connected nodes in a graph — breaks the road into roughly 20-meter “tiles,” each of which is a separate graph node.

    For each node, the CNN extracts road features and shares that information with its immediate neighbors, thereby propagating road information along the whole graph. For example, if only two lanes of a four-lane road are visible in an image, the model uses information from nearby tiles, such as road width, to conclude that the road has four lanes.

    The researchers trained and tested RoadTagger using the OpenStreetMap data set. First, they collected confirmed road attributes from 688 square kilometers of maps of 20 U.S. cities, then they gathered the corresponding satellite images from a Google Maps dataset. The training taught the model what weight to assign to various features and node connections, and it now automatically learns which image features are useful and how to propagate those features along the graph.

    The researchers hope that RoadTagger will help humans validate the constant stream of changes in OpenStreetMap and similar datasets as well as enrich them with details that they do not already contain, such as whether a road is paved.

    Citation. He, S., Bastani, F., Jagwani, S., Park, E., Abbar, S., Alizadeh, M., Balakrishnan, H., Chawla, S., Madden, S., & Sadeghi, M. A. (Dec. 28, 2019). “RoadTagger: Robust Road Attribute Inference with Graph Neural Networks.” arXiv:1912.12408v1.

  • Pléiades Neo imaging satellites on track for mid-2020 launch

    The first two Airbus-built Pléiades Neo imaging satellites have started comprehensive environmental testing to ensure they are ready for in-orbit operation, according to Airbus.

    During the tests, the satellites are subjected to extreme temperatures and vacuum, vibration and acoustic noise, as well as electromagnetic interference. This will ensure they can withstand the harsh conditions they will experience during launch and their mission in orbit.

    These first two new generation very high-resolution satellites are on schedule for launch in mid-2020. They will join the Airbus constellation of optical and radar satellites, improving both the revisit and resolution capacities.

    Entirely funded, manufactured, owned and operated by Airbus, Pléiades Neo will provide institutional and commercial customers with high-level insights for the next 12 years. Each satellite will be adding half a million km² per day at 30-cm resolution to Airbus’ offering.

    The images will be streamed into the OneAtlas online platform, thanks to an innovative cloud-based ground segment architecture, allowing customers to have immediate access to freshly acquired and archived data as well as analytics.

  • Visualizing the Australian bushfires through satellites and maps

    Visualizing the Australian bushfires through satellites and maps

    The months-long wildfires raging in Australia have killed at least 25 people. Millions — possibly 1 billion — animals have died. More than 2,000 houses have been destroyed. Around 150 fires are still burning in New South Wales and Queensland, with hot and dry conditions accompanied by strong winds fueling to the fires’ spread.

    With this conflagration rocking the continent down under, satellite imagery has become important to understanding the scope of the disaster. Here are some of the recent captures.

    As seen from the ISS

    “Talking to my crew mates, we realized that none of us had ever seen fires at such terrifying scale,” European Space Agency astronaut Luca Parmitano tweeted on Monday, sharing photos taken from the International Space Station.

    The astronaut posted images showing what he described as “an immense ash cloud” captured at the time the ISS was flying toward sunset.

    Artist’s visualization misinterpreted

    Another social media image, shared widely, was interpreted as a map showing the live extent of fire spread, with large sections of the populous eastern coastline molten red. Because of widespread misinterpretation, the original poster then explained that the image was a 3D visualization and not a photograph of Australia, and showed some areas where fires have been extinguished.


    View this post on Instagram


    * Didn’t realise this would go viral ? PLEASE READ BELOW* Regarding False Information. This has occurred NOT because of this post, or my information being inaccurate. It has been Zucc’d because other people have shared this image with the caption “This is a NASA photograph”. This image has been flagged as a result. Update – this is now being corrected, finally. Should be clear in a day or so… This is a 3D visualisation of the hotspots in Australia. NOT A PHOTO. Think of this as a graph. Also note this was created as an art piece This is made from data from NASA’s FIRMS (Satellite data regarding fires) between 05/12/19 – 05/01/20. These are all the areas which have been affected by bushfires. https://firms.modaps.eosdis.nasa.gov/map/#z:5;c:137.4,-27.9;t:adv-points;d:2019-12-05..2020-01-05;l:dark_gray,firms_viirs,firms_modis_a,firms_modis_t Scale is a little exaggerated due to the render’s glow, but generally true to the info from the NASA website. Also note that NOT all the areas are still burning, and this is a compilation. This image is copyrighted by Anthony Hearsey. Please contact for usage. DONATE HERE – https://linktr.ee/lukebakhuizen?fbclid=IwAR1hxUc97BXMPIxjiJqcVW7uG8wlgkPLfyO2wVFLVRDSw5X6cXAGeBuikeM _ #bushfires #render #visualisation #data #3d #australia #climatechange #disaster #fire #infographic #cinema4d #graphic #nasa

    A post shared by Anthony Hearsey (@anthony_hearsey) on


    NASA and USGS Landsat images

    NASA and the U.S. Geological Survey’s Landsat 8 satellite imagery from Jan. 9 shows Kangaroo Island, home to nature reserves. The images were taken using the Operational Land Imager (OLI) on Landsat 8. Using natural-color observations, the images show burned land and thick smoke covering the island, of which at least 156,000 hectares have burned.

    Photo: NASA/USGS
    Photo: NASA/USGS

    The U.S. National Oceanic and Atmospheric Administration (NOAA) satellites are also capturing images, including the resulting plumes of smoke.

    Worldview-3 captures Australia’s wildfires

    Maxar collected satellite imagery Jan. 12 of the wildfires in New South Wales (NSW). The imagery shown below focuses on the area near the town of Eden, and demonstrates the value of the shortwave infrared (SWIR) sensor.

    SWR satellite imagery of the town of Eden shows the wildfires through the smoke. (Satellite images ©2020 Maxar Technologies)
    SWR satellite imagery of the town of Eden shows the wildfires through the smoke. (Satellite images ©2020 Maxar Technologies)

    In an image taken with Maxar’s normal RGB color imagery, the smoky air prevents a clear view of the fires and the hot spots. With Maxar’s WorldView-3 satellite, however, the team is able to penetrate through the smoke using its SWIR sensor for a detailed look at the fire lines and burned vegetation.

    With SWIR imagery, burning areas are apparent and show up in a glowing orange-red. Healthy vegetation shows up in shades of blue, and burned vegetation appears in shades of brown.

    Satellite Photo: :ESA
    Satellite Photo: :ESA

    Copernicus Sentinel-3 imagery

    Europe’s Copernicus Sentinel-3 mission has captured the multiple bushfires burning across Australia’s east coast.

    In the above image, captured on Nov. 12, 2019, at 23:15 UTC (Nov. 13, 09:15 local time), the fires burning near the coast are visible. Plumes of smoke can be seen drifting east over the Tasman Sea. Hazardous air quality owing to the smoke haze has reached the cities of Sydney and Brisbane.

    Flame retardant was dropped in some of Sydney’s suburbs as bushfires approached the city center, and many residents were evacuated. Firefighters continue to keep the blazes under control.

    The Copernicus Emergency Management Service – Mapping was activated to help respond to the fires. The service uses satellite observations to help civil protection authorities and, in cases of disaster, the international humanitarian community, respond to emergencies.

    Quantifying and monitoring fires is fundamental for the ongoing study of climate, as they have a significant impact on global atmospheric emissions. Data from the Copernicus Sentinel-3 World Fire Atlas shows that there were almost five times as many wildfires in August 2019 compared to August 2018.

    Additional images from Worldview-3

    Fireline south of Eden. (Satellite image ©2020 Maxar Technologies)
    Fireline south of Eden. (Satellite image ©2020 Maxar Technologies)
    Fires new Eden. ( Satellite image ©2020 Maxar Technologies)
    Fires new Eden. (Satellite image ©2020 Maxar Technologies)
    Closeup of fires at Honeysuckle Point south of Eden. (9atellite image ©2020 Maxar Technologies)
    Closeup of fires at Honeysuckle Point south of Eden. (9atellite image ©2020 Maxar Technologies)
  • New Soar platform gives public real-time views of world events

    New Soar platform gives public real-time views of world events

    Chicago freeze. (Photo: Soar)
    Chicago freeze. (Photo: Soar)

    Satellite imagery company Soar is now allowing public access to its satellites that provide near-real time imagery all across Earth at 10-meter resolution per pixel.

    Both the public and the media will now be able to see high-definition aerial views of anywhere on Earth to observe events as they happen. This includes but is not limited to environmental disasters such as wildfires, tsunamis, hurricanes and drought.

    Governments will also be able to monitor activities such as the protests in Hong Kong, or illegal mining or deforestation.

    Developed by geospatial experts, the map sources satellite images from the European Space Agency’s Sentinel, NASA’s Landsat feeds and the SuperView and Gaofen satellites.

    As well as satellite content, the super-map will integrate imagery sourced from drone owners (drone pilots) around the world, who can earn passive income as the value of their imagery becomes realized. They can thus become a one-stop-shop for the collection, distribution, and monetization of mapping imagery from different sensors.

    “The problem Soar is solving is that almost 80 percent of all mapping imagery is currently accessed through just one channel, which is, for the most part, reserved mostly for niche commercial use,” said Soar founder and CEO Amir Farhand. “In many cases, the general public only has access to resources that are not updated as frequently. Soar addresses these limitations by generating dynamic, ever-changing data on our platform.”

    “Imagery taken by a drone user can be uploaded to social media, and may attract a few likes, or will sit idle on a hard drive,” Farhand said. “The same image uploaded to Soar contributes content to the seeding of the super-map, providing value to a global community, as well as generating income for the drone pilot.”

    Soar’s Head of Growth, Tim Glover added, “Imagine if we could re-use that imagery in a way that was totally authentic, collaborative and most importantly, accessible to all. Soar allows anyone to view the Earth from above, meaning it’s easy to observe things like environmental changes, including drought, melting ice caps, industrial growth, natural disasters like volcano eruptions, just to name a few uses. The aim of Soar is to enable anyone to explore and discover our ever-changing world.”

    With almost 10 petabytes of data already acquired, Soar is planning additional imagery as part of their growth strategy. Soar has already received several partnership requests from multinational organizations with excess satellite, aerial and drone content from across the globe.

    In the near future, the platform will also feature additional data streams from higher resolution satellites, aerial imagery providers and both commercial and recreational drone operators globally.

    The use of Soar is suitable for a wide range of industries and applications including agriculture, environmental, logistics, mining and insurance. However, since its beta launch in late 2018, the largest area of growth has been news and social media as users share imagery of landscape events from around the world.

    Soar was founded in 2017 by Amir Farhand, an entrepreneur with more than 15 years of geospatial expertise. The Soar leadership team is headed by Chairman Guy Perkins, former co-founder of aerial imaging companies NearMap and Spookfish. Other key managers come from a wide range of industry sectors with varying backgrounds, including the Australian Special Forces, United States Air Force, Lockheed Martin, Rio Tinto, NBCUniversal and Amblin Entertainment.

    To view Soar’s platform, visit soar.earth

  • EOS platform offers worldwide satellite imagery

    EOS has partnered with four high-resolution imagery providers — Airbus Defense and Space, SI Imaging Services, SpaceWill and 21AT — so users can purchase the latest images directly from LandViewer, the official high-resolution data reseller, or view the images of an area of interest in high resolution on the map.

    LandViewer collects the latest up-to-date satellite imagery from commercial satellite providers and incorporates it into an easy-to-use platform. The collection is constantly being improved with new sensors.

    LandViewer offers two data sources of commercial imagery:

    • High-resolution imagery (for analytics), to find and purchase high-resolution images for further in-depth analysis. In this case, the price is based on the size of the area of intersection between the selected image and your area of interest (AOI).
    Image from Landviewer for analytics. (Image: EOS)
    Image from Landviewer for analytics. (Image: EOS)
    • High-resolution imagery (view only) to view high-resolution images for your area of interest (AOI). In this case, the price is based on the number of tiles within your AOI. The view only  option is designed as a stand-alone data source for the everyday business user.
    Image from Landviewer (view only). (Image: EOS)
    Image from Landviewer (view only). (Image: EOS)

    The EOS platform uses commercial imagery from LandViewer with a resolution between 0.3 meter and 1.5 meters, enabling a close look at  assets of interest, anywhere in the world.

  • Amazon fires in Brazil can be seen from space

    Amazon fires in Brazil can be seen from space

    Wildfires in the Amazon rainforest in Brazil have hit record numbers, and satellites have been able to capture imagery of them.

    According to NASA, the Moderate Resolution Imaging Spectroradiometer on its Aqua satellite captured images of several fires burning in the states of Rondônia, Amazonas, Pará and Mato Grosso on Aug. 11 and Aug. 13.

    A satellite view of the Amazon wildfire on Aug. 13. (NASA Earth Observatory images by Lauren Dauphin, using MODIS data from NASA EOSDIS/LANCE and GIBS/Worldview and VIIRS data from NASA EOSDIS/LANCE and GIBS/Worldview, and the Suomi National Polar-orbiting Partnership.)
    A satellite view of the Amazon wildfire on Aug. 13. (NASA Earth Observatory images by Lauren Dauphin, using MODIS data from NASA EOSDIS/LANCE and GIBS/Worldview and VIIRS data from NASA EOSDIS/LANCE and GIBS/Worldview, and the Suomi National Polar-orbiting Partnership.)

    There have been 72,843 fires in Brazil this year, with more than half in the Amazon region, Brazil’s space research center, the National Institute for Space Research (INPE), said. This marks an 84% increase over the same period of 2018 and is the highest since records began in 2013, INPE added.

    Amazonas, the largest state in Brazil, recently declared a state of emergency over the forest fires, said Euro News.

    This map shows the "Biomass burning aerosol optical depth." (Image: Copernicus' Atmosphere Monitoring Service)
    This map shows the “Biomass burning aerosol optical depth.” (Image: Copernicus’ Atmosphere Monitoring Service)

    In the Amazon region, fires are rare for much of the year because wet weather prevents them from starting and spreading. However, in July and August, activity typically increases due to the arrival of the dry season, NASA said.

  • Airbus strengthens imagery capabilities with Vision-1

    Airbus has enlarged its high-resolution imagery portfolio following an agreement to leverage capacity from the S1-4 satellite built by Surrey Satellite Technology Limited (SSTL). The new imagery offer — called Vision-1 — delivers end-to-end imaging operations to Airbus’ customers.

    Vision-1 provides 0.9-meter resolution imagery in the panchromatic band and 3.5-meter in the multispectral bands (NIR, RGB), with a 20.8-kilometer swath width. These specifications are ideal for defence, security and agriculture applications, while this extra revisit opportunity further strengthens Airbus’ satellite fleet.

    “This new asset will reinforce our monitoring capabilities for sub-metre imaging, and feed our OneAtlas digital platform to provide increased freshness,” said François Lombard, director of Intelligence Business at Airbus Defence and Space.

    Vision-1 operations will be coordinated by Airbus in the UK, following integration into the UK Mission Operation Centre, which operates the commercial imaging of the DMC Constellation. This is an important step for UK sovereign imaging capability, Airbus said, adding sub-meter data to the existing UK imaging capabilities.

    As Vision-1 was launched in September 2018 together with NovaSAR, this opens significant opportunities for applications combining optical and radar satellite imagery.

    Along with Vision-1, Airbus offers commercial access to the largest fleet of Earth Observation satellites: Pléiades, SPOT 6/7, DMC Constellation and the weather-independent radar satellites TerraSAR-X, TanDEM-X and PAZ.

  • Esri explains how mapping technology is used for marine safety

    Esri’s Jesse Smith discusses how the U.S. Coast Guard’s International Ice Patrol is using Esri’s ArcGIS Enterprise platform to improve marine safety at the 2019 Esri User Conference in San Diego. Currently, the organization is using the platform to map, observe and track icebergs.

  • How NASA captured high-resolution Moon imagery in 1960s

    How NASA captured high-resolution Moon imagery in 1960s

    Photo: NASA
    Photo: NASA

    I was inspired by the 50th anniversary of the Moon landing on July 16 and our focus on mapping this month to look into imagery of the Moon.

    Only recently have we learned that the lunar orbiters that photographed the Moon in the 1960s sent back images that were stunningly high resolution (HR), even by today’s standards. The actual resolution was presumably kept secret because the imaging technology was also used in our Cold War spy satellites.

    Under the Lunar Orbiter Program, satellites took photographs of the Moon’s surface to identify suitable landing sites for the Apollo Program. Managed by the Langley Research Center, five Lunar Orbiters were successfully flown in 1966 and 1967, mapping 99% of the Moon’s surface with a resolution of 60 meters or better.

    The first three missions were dedicated to imaging 20 potential landing sites, and were flown at low-inclination orbits.

    The fourth and fifth missions were devoted to broader scientific objectives and were flown in high-altitude polar orbits. Lunar Orbiter 4 photographed the entire nearside and 95% of the farside, and Lunar Orbiter 5 completed the farside coverage and acquired medium (20-meter) and high (2-meter) resolution images of 36 pre-selected areas.

    In that pre-digital era, the Lunar Orbiters had an ingenious imaging system, which consisted of a dual-lens camera, a film processing unit, a readout scanner and film-handling apparatus. Both lenses, a 610-mm narrow angle HR lens and an 80-mm wide-angle medium resolution (MR) lens, placed their frame exposures on a single roll of 70-mm film.

    The axes of the two cameras were coincident so the area imaged in the HR frames were centered within the MR frame areas.

    The film was moved during exposure to compensate for spacecraft velocity, which was estimated by an electric-optical sensor. The film was then processed, scanned, and the images transmitted back to Earth. Based on these images, the NASA Apollo Site Selection Board would name five candidate landing sites in February 1968.

    Through the dedication of volunteers, the images have all been digitized. The entire Lunar Orbiter atlas is online.

  • Monitoring the Earth for geopolitical and economic insights

    Data from Earth Monitor reveals the number of cars and trucks in an area of Amsterdam. (Image: Airbus)
    Data from Earth Monitor reveals the number of cars and trucks in an area of Amsterdam. (Image: Airbus)

    The new Earth Monitor tool draws from the Airbus imagery archive and satellite tasking capabilities to provide advanced geospatial analysis, trends and detection maps.

    Available as part of Airbus’s OneAtlas suite of geospatial tools, Earth Monitor enables customers to draw precise, timely and meaningful conclusions. It uses Orbital Insight’s machine learning and computer vision expertise through algorithms that detect changes in infrastructure and land use in near-real time. It can identify and count objects such as cars, trucks, roads, homes, buildings and construction sites and, soon, aircraft.

    Earth Monitor can identify trends, spot patterns and track economic activity, delivering advanced geospatial analysis and change-detection maps on customized areas of interest to users in defense, intelligence and law enforcement.

    Earth Monitor comes from a collaboration between Airbus Defense and Space, a French aerospace company, and Orbital Insight, a Silicon Valley startup. The OneAtlas platform combines Airbus’ constellation and tasking services with Orbital Insights’ analytic capabilities.

    Orbital Insight’s algorithms draw on petabytes of data from multiple sources, such as satellite and synthetic aperture radar imagery, geolocation intelligence and vessel traffic data.

    The tool’s interface enables users to create and manage projects, customize analyses and define period and measurement frequencies.

  • NASA program aids with disaster relief efforts

    NASA program aids with disaster relief efforts

    Satellite imagery and mapping have proven to be critical technologies when it comes to disaster relief efforts.

    The NASA Earth Science Disasters Program has harnessed these technologies to help communities and governments recover from natural disasters like earthquakes, hurricanes and more.

    “[The goal of the program is to] try to prevent natural disasters or limit their impact and also help people recover from them more quickly,” Jeremy Kirkendall, senior GIS administrator for the NASA Disasters Program, told GPS World in an exclusive interview at the 2019 Esri User Conference in San Diego. “We provide the products free to anyone to use, and data is only available if there is a good satellite pass.”

    When a natural disaster strikes, researchers at the NASA Disasters Program will take satellite imagery of the affected location and create a map to show what the area looks like from an aerial perspective. Authorities who request this information can then compare the disaster map with maps of what the area looked like before the disaster took place.

    “We do take requests from agencies or governments for disasters if they need help if data is available,” Kirkendall said. “We’ll create the products that show where the earthquake damage happened, where the fire burned or where the flooding is, and then users take that — combined with their local information — to determine what needs to be checked.”


    For example, the NASA Disasters Program was able to map out the magnitude 6.4 July 4 Southern California earthquake.

    “The earthquake that happened on July 4 caused a lot of deformation to the ground, so we mapped out that surface deformation and shared that information with other emergency managers, the Federal Emergency Management Agency, National Guard and U.S. Navy,” Kirkendall said. “You can look at things like roads, utilities, underground pipes for natural gas or geothermal wells, or fiberoptic cables. Then when you provide the product to these end users, they can overlay it with utility and infrastructure information to identify what’s the most at risk and what needs to be investigated.”

    Sometimes, when a natural disaster occurs over a longer period of time, data is mapped throughout the duration of the occurrence, as well. This can help with search-and-rescue missions, infrastructure repairs and post-disaster analysis.

    “We will create products during responses that can last a long time, like for Hurricane Florence or the flooding that recently happened in the Midwest,” Kirkendall said. “We’ll keep turning out flood products day after day when there’s good satellite passes that show that information.”

    Kirkendall added that the National Guard has used the live data, along with 911 calls, to find individuals trapped in flooded houses. The data also serves as a tool for post-disaster analysis to understand where damage occurred, ways to fix it and how to prevent it from happening again.

    “The program itself is gearing toward a resiliency effort, where we can provide these products when communities says, ‘We get flooded here all the time, over and over,’” Kirkendall said. “That’s where we need to be prepared to fix something. We need to do something to prevent that.”