Jeremy Kirkendall, senior GIS administrator for the NASA Disasters Program, gives GPS World an overview of the program at the 2019 Esri User Conference in San Diego. Watch this video to find out how satellite imagery produced by the program helps with disaster response efforts.
Tag: satellite imagery
-

Landviewer’s new change detection tool runs in a browser
A major use of remote sensing data is to compare images of an area taken at different times and identify the changes it underwent. With a wealth of long-term satellite imagery in open use, detecting such changes manually would be time-consuming and most likely inaccurate.
To address this, EOS Data Analytics has introduced an automated Change Detection tool to its flagship product LandViewer, a cloud tool for satellite imagery search and analysis in today’s market.
Unlike the methods involving neural networks that identify changes in the previously extracted features, the change detection algorithm implemented by EOS is using a pixel-based strategy, meaning that changes between two raster multi-band images are mathematically calculated by subtracting the pixel values for one date from the pixel values of the same coordinates for another date.
This new signature feature is designed to automate a change detection task and deliver accurate results in fewer steps and in a fraction of the time needed for change detection in most image-processing software.

Change detection interface: Images of Beirut city coastline selected for tracing the developments of the past years. (Image: LandViewer) 
Change detection interface: Images of Beirut city coastline selected for tracing the developments of the past years. (Image: LandViewer) Applications from farming to environmental monitoring
One of the main goals set by EOS team was to make the complex process of change detection in remote sensing data equally accessible and easy for non-expert users coming from non-GIS industries.
With LandViewer’s change detection tool, farmers can quickly identify the areas on their fields that were damaged by hail, storm or flooding. In forest management, satellite image detection of changes will come in handy for estimation of the burned areas following the wildfire and spotting the illegal logging or encroachment on forest lands.
Observing the rate and extent of climate changes occurring to the planet (such as polar ice melt, air and water pollution, natural habitat loss due to urban expansion) is an ongoing task of environmental scientists, who may now have it done online in a matter of minutes. By studying the differences between the past and present using the change detection tool and years of satellite data in LandViewer, all these industries can also forecast future changes.
Top change detection use cases: Flood damage and deforestation
A picture is worth a thousand words, and the capabilities of satellite image change detection in LandViewer can be best demonstrated on real-life examples.
Forests that still cover around a third of the world’s area are disappearing at an alarming rate, mostly due to human activities such as farming, mining, grazing of livestock, logging, and also the natural factors like wildfires. Instead of massive ground surveying of thousands of forest acres, a forestry technician can regularly monitor the forest safety with a pair of satellite images and the automated change detection based on NDVI (Normalized Difference Vegetation Index).
How does it work? NDVI is a known means of determining vegetation health. By comparing the satellite image of the intact forest with the recent one acquired after the trees were cut down, LandViewer will detect the changes and generate a difference image highlighting the deforestation spots, which can further be downloaded by users in JPG, PNG or TIFF format. The surviving forest cover will have positive values, while the cleared areas will have negative ones and be shown in red hues indicating there’s no vegetation present.

A difference image showing the extent of deforestation in Madagascar between 2016 and 2018; generated from two Sentinel-2 satellite images. (Image: LandViewer) Another widespread use case for change detection would be agricultural flood damage assessment, which is of most interest to crop growers and insurance companies. Whenever flooding has taken a heavy toll on your harvest, the damage can be quickly mapped and measured with the help of NDWI-based change detection algorithms.
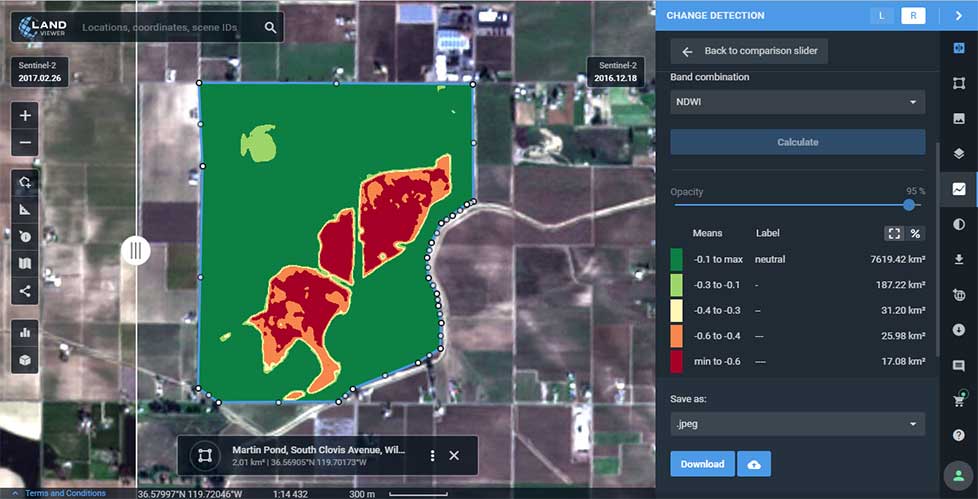
Results of Sentinel-2 scene change detection: The red and orange areas represent the flooded part of the field,; the surrounding fields are green, meaning they avoided the damage. California flooding, February 2017. (Image: LandViewer) How to run change detection in LandViewer
There are two ways you can launch the tool and start finding differences on multi-temporal satellite images: by clicking the right menu icon “Analysis tools” or from the Comparison slider ‒ whichever is more convenient. Currently, change detection is performed on optical (passive) satellite data only; addition of the algorithms for active remote sensing data is scheduled for future updates.
A guide to LandViewer is available here.
-
LandViewer’s change-detection tool runs in a browser
A major use of remote sensing data is to compare images of an area taken at different times and identify the changes it underwent. With a wealth of long-term satellite imagery in open use, detecting such changes manually would be time-consuming and most likely inaccurate.
To address this, EOS Data Analytics has introduced an automated Change Detection tool to its flagship product LandViewer, a cloud tool for satellite imagery search and analysis in today’s market.
Unlike the methods involving neural networks that identify changes in the previously extracted features, the change detection algorithm implemented by EOS is using a pixel-based strategy, meaning that changes between two raster multi-band images are mathematically calculated by subtracting the pixel values for one date from the pixel values of the same coordinates for another date.
This new signature feature is designed to automate a change detection task and deliver accurate results in fewer steps and in a fraction of the time needed for change detection in most image-processing software.

Change detection interface: Images of Beirut city coastline selected for tracing the developments of the past years. (Image: LandViewer) 
Change detection interface: Images of Beirut city coastline selected for tracing the developments of the past years. (Image: LandViewer) Applications from farming to environmental monitoring
One of the main goals set by EOS team was to make the complex process of change detection in remote sensing data equally accessible and easy for non-expert users coming from non-GIS industries.
With Land Viewer’s change detection tool, farmers can quickly identify the areas on their fields that were damaged by hail, storm or flooding. In forest management, satellite image detection of changes will come in handy for estimation of the burned areas following the wildfire and spotting the illegal logging or encroachment on forest lands.
Observing the rate and extent of climate changes occurring to the planet (such as polar ice melt, air and water pollution, natural habitat loss due to urban expansion) is an ongoing task of environmental scientists, who may now have it done online in a matter of minutes. By studying the differences between the past and present using the change detection tool and years of satellite data in Land Viewer, all these industries can also forecast future changes.
Top change detection use cases: Flood damage and deforestation
A picture is worth a thousand words, and the capabilities of satellite image change detection in Land Viewer can be best demonstrated on real-life examples.
Forests that still cover around a third of the world’s area are disappearing at an alarming rate, mostly due to human activities such as farming, mining, grazing of livestock, logging, and also the natural factors like wildfires. Instead of massive ground surveying of thousands of forest acres, a forestry technician can regularly monitor the forest safety with a pair of satellite images and the automated change detection based on NDVI (Normalized Difference Vegetation Index).
How does it work? NDVI is a known means of determining vegetation health. By comparing the satellite image of the intact forest with the recent one acquired after the trees were cut down, Land Viewer will detect the changes and generate a difference image highlighting the deforestation spots, which can further be downloaded by users in JPG, PNG or TIFF format. The surviving forest cover will have positive values, while the cleared areas will have negative ones and be shown in red hues indicating there’s no vegetation present.

A difference image showing the extent of deforestation in Madagascar between 2016 and 2018; generated from two Sentinel-2 satellite images. (Image: LandViewer) Another widespread use case for change detection would be agricultural flood damage assessment, which is of most interest to crop growers and insurance companies. Whenever flooding has taken a heavy toll on your harvest, the damage can be quickly mapped and measured with the help of NDWI-based change detection algorithms.

Results of Sentinel-2 scene change detection: The red and orange areas represent the flooded part of the field,; the surrounding fields are green, meaning they avoided the damage. California flooding, February 2017. (Image: LandViewer) How to run change detection in Land Viewer
There are two ways you can launch the tool and start finding differences on multi-temporal satellite images: by clicking the right menu icon “Analysis tools” or from the Comparison slider ‒ whichever is more convenient. Currently, change detection is performed on optical (passive) satellite data only; addition of the algorithms for active remote sensing data is scheduled for future updates.
A guide to Land Viewer is available here.
-
Farmers on Climate FieldView can access satellite imagery
Airbus Defence and Space and The Climate Corporation, a subsidiary of Bayer, have announced a global agreement to deliver frequently updated satellite imagery from Airbus to farmers through Climate FieldView, a digital agriculture platform.
Farmers who use Climate FieldView can access high-resolution data of their fields from the Airbus SPOT 6, SPOT 7 and Pléiades satellites throughout the growing season. This gives FieldView customers the ability to more precisely monitor crop health and performance, helping them take action in the field before yield is impacted at the end of the season.
They will also be able to visualize this satellite imagery alongside other data layers in their FieldView account, including planting and yield data, to unlock new insights about crop health.
The large swath and coverage capabilities of the SPOT satellites enable mapping at a national level down to individual farmland parcels, while the Pléiades satellites can be used to pinpoint details in specific areas, thanks to its combination of sub-meter resolution and multispectral bands.
The complementarity between SPOT and Pléiades resolutions, swaths and revisits is crucial for effectively monitoring crops more precisely and helps enable more-informed decision-making.
“We are very pleased to be working with The Climate Corporation to enhance FieldView by providing them with access to updated, cloud-free images within the time frame required to efficiently monitor crops at each key growth stage,” said François Lombard, head of Intelligence Business at Airbus Defence and Space.
“High-quality satellite imagery integrated into a farmer’s Climate FieldView account can bring in more consistent and invaluable field-level insights,” said Steven Ward, Senior Director of Geospatial and Weather Sciences at The Climate Corporation. “This partnership with Airbus supports Climate’s commitment to deliver the most robust imagery ecosystem on the farm, helping farmers make important decisions tailored precisely to their individual fields.”
The Climate Corporation’s mission is to help the world’s farmers sustainably increase their productivity through the use of digital tools. First launched in the United States in 2015, the company’s Climate FieldView platform gives farmers a deeper understanding of their fields so they can make more informed operating decisions to optimize yields, maximize efficiency and reduce risk.
FieldView is currently on more than 60 million paid acres across the United States, Canada, Brazil and Europe.
-
Airbus and SSC join on Pléiades Neo for Earth observation
Swedish Space Corporation (SSC) and Airbus have signed a contract for SSC ground segment support services to the new Pléiades Neo constellation of high resolution Earth Observation satellites.
The contract marks an important step in the long-term partnership between SSC and Airbus, and extends the capabilities of both companies.
The first two very high-resolution Pléiades Neo satellites will be launched in mid-2020, followed by a second pair in 2022. They will join the existing Airbus constellation of optical and radar satellites, and will offer enhanced performance, and the highest reactivity in the market.
SSC will provide comprehensive ground segment support for the Launch and Early Orbit Phase (LEOP), as well as routine on-orbit support for Telemetry, Tracking and Control (TT&C) and data reception.
Ground Network. The core SSC ground network for Pléiades Neo will consist of the unique dual polar ground station solution of Kiruna, Sweden, and Inuvik, Canada — often referred to as “Kinuvik” as it is operated as a virtual single polar station.
The partnership also includes an option to provide potentially higher data volumes at a later stage, using the southern hemisphere station of Punta Arenas, Chile.
The optimized and highly resilient SSC ground network provides effective tasking and downloading of large data volumes more than once every orbit, enabling rapid delivery of Pléiades Neo data from anywhere on Earth.
The ground network has been designed by SSC and Airbus to complement Airbus’ Direct Receiving Stations (DRS) as well as the Airbus SpaceDataHighway relay satellite system, while being flexible to adapt to changing seasonal needs and to give critical network diversity.
“The Pléiades Neo constellation will be adding two million km² per day at 30-cm resolution to Airbus’ imagery offering. As tasking and downloading will be possible in every orbit, up to 60 times a day for the constellation, we need to rely on very efficient commercial polar communication services,” said François Lombard, head of Intelligence Business at Airbus Defence and Space.
“Pléiades Neo is a cutting edge very high resolution Earth Observation constellation, and this represents a huge milestone in the close cooperation between Airbus and SSC. We are proud to be able to support Airbus in providing such critical optical imagery for the global marketplace”, said Stefan Gardefjord, CEO at SSC.
-
TCarta to map seafloor around remote Pacific island nation
TCarta Marine, a global provider of geospatial products and services, has been contracted by the United Kingdom Hydrographic Office (UKHO) to provide a baseline dataset of water depths and seafloor classification around the Republic of Kiribati.
Located in the Pacific Ocean, the island nation is threatened by rising sea levels.
“Most of Kiribati’s islands average less than two meters above sea level at present and the country’s 110,000 inhabitants are among the most vulnerable to the effects of sea level rise and the world’s first potential climate change refugees,” said Kyle Goodrich, TCarta president.
“We expect to map 5,000 square kilometers in total. Our seafloor maps will be used with other geospatial information by the UKHO to recommend policies that will assist the Kiribati in planning for and responding to this situation,” Goodrich said.
TCarta won the open bid for supply of Satellite Derived Bathymetry (SDB) to the UKHO to extract water depth measurements and seafloor classifications, including habitat types, from multispectral satellite imagery.
In this project, TCarta is processing eight-band DigitalGlobe WorldView-2 and -3 data predominantly, as well as four-band WorldView-4 and GeoEye-1 data to measure depths down to 30 meters at a resolution of two meters.
“The Kiribati project highlights the efficiency and cost effectiveness of SDB technology in a geographic area too remote and enormous for traditional marine or airborne survey methods,” Goodrich said.
The Kiribati nation is comprised of 33 atoll islands and multiple reefs spread over an area of the Pacific Ocean nearly the size of the Continental U.S. Multiple new reefs have been discovered by TCarta using this satellite derived approach at the start of this project.
The islands and surrounding environs have not been mapped in their entirety since the late 1800s. Acquiring bathymetric data and habitat classifications using traditional ship-borne sonar or airborne lidar are prohibitively expensive, logistically challenging and come at far higher cost and timeframe than a satellite-based solution.
“We began tasking the DigitalGlobe satellites to capture images in December and will deliver the final products to the UKHO in early March,” said Goodrich, “DigitalGlobe has been a tremendous partner in helping TCarta meet the project deadlines and challenging open ocean conditions with repeat tasking of imagery, collecting more than 300 images in support of the project, despite the loss of WorldView 4.”
TCarta has developed advanced bathymetric measurement technologies using satellite data. Funded by the National Science Foundation SBIR Phase I grant and known as Project Trident, this new technology is being deployed in the Kiribati project to remotely validate the bathymetry results.
-
LandViewer offers long-term observations, enhanced vegetation analysis
LandViewer, a cloud service developed by EOS Data Analytics, provides access to satellite data and fast-paced analytics. In recent months, it has undergone numerous updates, which have expanded the existing catalogue of satellite imagery, introduced more tools for analysis and added other new features.
By the end of 2018, free space and airborne data available for browsing, analysis and download via LandViewer included imagery from the European Space Agency’s (ESA’s) Sentinel-2 and Sentinel-1, NASA-USGS’s Landsat 8 and previous missions, MODIS, CBERS-4 and NAIP.
This broad selection of Earth observation data has grown even larger with the addition of high-resolution commercial imagery from Airbus, SpaceWill and SI Imaging Services.
LandViewer has evolved into a single platform. On top of open-source data, users can freely explore the potential of commercial data with global coverage, short revisit periods, and spatial resolution up to 40 centimeters.
The current catalogue includes imagery from Pléiades 1a/1b, SPOT 5, SPOT 6 and SPOT 7, along with KOMPSAT-2, 3, 3A and SuperView. The high-resolution imagery browser offers free preview, automatic price calculation by selected area, and fast image delivery within three business days via cloud EOS Storage.

Preview of KOMPSAT-3A image collected over Shanghai Hongqiao International Airport on Oct. 29, 2018. (Photo: EOS) Long-term observations. An abundance of available data, such as weekly updated Sentinel-2 imagery and historical Landsat data, has made it much easier to monitor changes over long time spans. Rather than taking a long time to select and process years of satellite data to get a multitemporal perspective, the LandViewer’s new Time Series Analysis will crunch the remote sensing data and deliver the results in an easily interpretable graph.

Sentinel-2 time series graph generated for agricultural fields in Kansas state. (Screenshot: EOS) Users can select an area of interest (AOI), and a satellite dataset and a time period between 1 month and 10 years. The algorithm can then pick all imagery with minimum cloudiness and calculate NDVI, NDWI or NDSI in just a few moments. By default, the generated Time Series graph contains lines (representing the min, max, mean and std values) that can be hidden or displayed for convenience; whenever an unusual spike or drop in values is noticed, a satellite scene that represents that part of the curve can be visualized to establish the cause. The results can be downloaded either as an image (.png), or a .csv file for working in Excel.
Enhanced vegetation analysis. Users searching for an in-depth look at vegetation cover can use LandViewer’s new spectral indexes: SAVI, EVI, ARVI, GCI, SIPI and NBR. These indexes complement generalized NDVI analysis by making corrections for atmospheric and topographic effects or soil brightness influences, depending on vegetation density, climate and elevation in the area of interest.
The NBR index is designed to highlight burned areas against healthy vegetation; the difference between pre-fire NBR and post-fire NBR values can be applied to estimate the severity of burn.
The use of several indexes simultaneously enables better insight into plant health and helps to identify stressed or infected vegetation at an early stage.

Sentinel-2-derived SAVI analysis of an arid agricultural region in Saudi Arabia. (Screenshot: EOS) User-friendly legend and area calculation. Another new LandViewer feature, the index legend, is designed to solve the problem of interpreting the index results, a common issue for new users. Now when a spectral index is applied over the selected territory, the user can view a detailed legend, where each color-marked class contains a short description.
For example, calculation of NDVI will identify and highlight areas with “dense”, “moderate”, “sparse vegetation”, “open soil” or “no vegetation”.

Screenshot: EOS Another new time-saving functionality is that the area of each class within the spectral index legend is calculated automatically, in both square meters and by percentage.
Also, the expanded Area of Interest (AOI) tool enables bulk uploading of AOIs and speeds up work by allowing simultaneous visualization and fast switching of all AOIs on a map for imagery searches or new scene subscription.
Advanced zone analytics. By introducing the clustering function, EOS’ remote sensing experts and software developers have taken LandViewer’s spatio-temporal analytics to the next level. With this function, users can run unsupervised satellite data-based classification of an area up to 200 square kilometers into as many as 19 clusters (or zones). This process involves setting custom parameters (size/number of zones) and waiting a few moments for LandViewer to build a raster image of the area with color-marked zones, and a vector layer outlining the boundaries. Both outputs can be downloaded.
This scalable analysis can provide various insights across agriculture, forestry, coastal monitoring and other industries. For example, a farmer can make use of convenient color mapping of zones within the field based on NDVI values for precise in-field navigation and crop management.
Engaging animations. With the informative spectral data contained in satellite image pixels, LandViewer has introduced a time-lapse animation feature allowing journalists and active social media users to create engaging animated stories and share them on the internet. Each GIF can contain up to 300 scenes, with indexes or band combinations applied. From calving of glaciers to construction of new stadiums, satellite imagery is full of information that’s worth watching and sharing with the world.
-
Planet’s breadloaf-sized satellites capture Earth surface
Planet (formerly Planet Labs) has put about 300 satellites into space, in charge of photographing the entire land mass of the Earth every day.
The satellites weigh 5 kg (12 pounds) and measure 20 x 20 x 44 centimeters, about the size of a loaf of bread. They are packed with commercial-off-the-shelf electronics and are built in downtown San Francisco. Mission control consists of a single engineer for dozens of satellites.
Aptly named “doves,” the satellites circle the Earth in 90 minutes, their cameras continuously rolling. “It gives you a perspective of the planet as a dynamic and evolving thing that we need to take care of,” said company co-founder Will Marshall.
Each day, the satellites transmit 1.2 million images at a spatial resolution of 3–5 meters, far more than enough to fully occupy all the analysts at the National Geospatial Intelligence Agency (NGA), one of Planet’s more than 200 customers.
Historically, the NGA has relied on three or four very large, very expensive — and to global adversaries, very predictable — spy satellites. The agency has found Planet’s approach intriguing and challenging.
Planet has devised computer algorithms to look for new features day to day, such as roads or buildings th
at may signal activity of a significant or nefarious sort. Other customer uses are more mundane, such as agricultural companies monitoring crop health.
Boundless. In December 2018, Planet entered into an agreement to acquire Boundless Spatial Inc., a St. Louis-based geospatial software solutions company, to further support its commercial business with the U.S. government and agricultural clients.
-
NASA releases satellite damage map of Camp Fire
The Advanced Rapid Imaging and Analysis (ARIA) team at NASA’s Jet Propulsion Laboratory in Pasadena has produced a map showing the damage caused by the Camp Fire in Northern California.
After two and a half weeks of historic destruction, the fire is now 100 percent contained. Teams continue to search the destruction — including the destroyed town of Paradise — for remains. As of Sunday, the death toll is 85, making it California’s deadliest fire.
The map shows the damage as of Nov. 16.

Credits: NASA/JPL-Caltech The map was developed using synthetic aperture radar images from the Copernicus Sentinel-1 satellites operated by the European Space Agency.
The map covers an area of 48 miles by 48 miles (78 by 77 kilometers), outlined in red on left. A closeup view of damage to the town of Paradise is inset on right, outlined in white. The color variation from yellow to red indicates increasingly more significant changes in the ground surface.
The ARIA team creates its maps by comparing before-and-after satellite images of the fire region to see the extent of change between the two images. For this map, they compared the data for the image to a Cal Fire map for preliminary validation.
Although the maps may be less reliable over vegetated terrain, such as forests, they can help officials and first responders identify heavily damaged areas and allocate resources as needed.
Sentinel-1 data were accessed through the Copernicus Open Access Hub. The image contains modified Copernicus Sentinel data (2018), processed by ESA and analyzed by the NASA-JPL/Caltech ARIA team.
-
TCarta delivers satellite-derived mangrove health assessment to Abu Dhabi
TCarta, a global provider of geospatial products and services, was commissioned by the Environment Agency — Abu Dhabi (EAD) to carry out a landmark mangrove health assessment covering the entire Emirate of Abu Dhabi. The assessment contained mangrove condition information derived from high-resolution multispectral satellite imagery.
According to TCarta, the report showed 80 percent of the Emirate’s mangrove forests were healthy. The project also enabled EAD to designate conservation areas for immediate protection.
For the assessment, TCarta obtained high-resolution multispectral imagery acquired by the DigitalGlobe WorldView-2 and -3 satellites during from December through March. Computer algorithms were applied to the Coastal Blue, Visible Green, Visible Red and Near Infrared bands to differentiate mangroves from other vegetation across the Emirate.
The company then derived several vegetation indices from the spectral bands to rate the health of the mangrove forests, divided into small grids. From there, TCarta analysts obtained coarse-resolution Landsat imagery from 1987, 2001 and 2017 to chart mangrove coverage over three decades. According to TCarta, the combination of WorldView and Landsat data analysis clearly showed where mangrove loss had occurred over time. This data allowed the company to generate its disturbance index, which correlated health to external factors, such as urban development.
“The satellite-derived vegetation analysis process we developed for this project can be applied to large-area crop and forestry health mapping anywhere in the world,” said Chris Burnett, project manager at TCarta. “As part of the assessment, we created a disturbance index showing precisely where the most mangrove stress is occurring. EAD will use this to determine — and potentially mitigate — the external factors causing the mangrove conditions to decline.”
The company’s research proved that urban development near Abu Dhabi City was one of the primary threats to the Emirate’s mangrove forests. According to TCarta, EAD will use the report for remediation efforts, including the selection of more favorable areas to plant new mangroves to balance those that have already been lost.
-
New Garmin GPS handheld logs raw measurements in RINEX
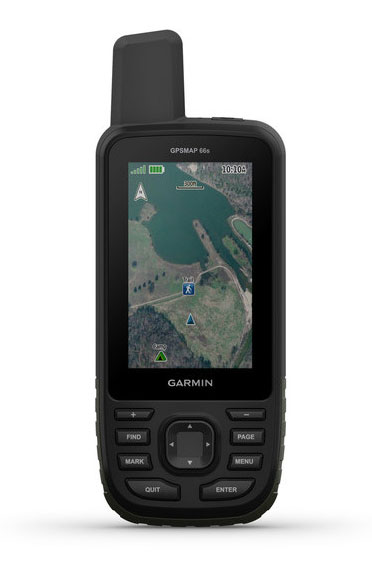
Photo: Garmin Garmin International is offering a new outdoor GPS handheld that can log raw measurements in RINEX form, the GPSMAP 66.
“We’ve had good success achieving carrier-phase ambiguity resolution with the unit, and I suspect many readers will be interested in this feature from a purpose-built device,” said Jared Bancroft, GNSS sensors & algorithms, Garmin, in an email to GPS World. “We’ve observed accuracies down better than 30 centimeters.”
The GPSMAP 66 is a premium outdoor handheld with expanded wireless connectivity, direct-to-device access to BirdsEye satellite imagery and a 3-inch sunlight-readable color display. The handheld comes in two models, the GPSMAP 66s and GPSMAP 66st. The latter offers preloaded topographic maps for U.S. and Canada.
Professionals and serious GPS enthusiasts will appreciate the inclusion of RINEX data logging, which allows for sub-meter accuracy of GPS position after post processing, Garmin stated in a press release.
“The GPSMAP 66st builds on the GPSMAP series heritage by adding new and requested features like a bigger screen, weather forecasting and easy direct-to-device access to satellite imagery,” said Dan Bartel, Garmin vice president of global consumer sales. “Between multi-GNSS network support and connectivity to the new Garmin Explore app, the new GPSMAP 66s and the GPSMAP 66st are reliable companions for any adventure.”
The handheld can receive weather updates for real-time forecast information by being paired via Bluetooth to a compatible mobile device. It will also provide predictive maps for temperature and wind speed/direction, as well as live weather radar.
Other new GPSMAP 66s/st connected features include Geocaching Live and compatibility to the Connect IQ platform, giving users access to 9 million trails through the preloaded Wikiloc app. The devices all pair with the inReach Mini, allowing the user to send and receive messages directly on their 66s/st device via the Mini.
Between the multi-GNSS satellite support and altimeter, barometer and compass sensor capabilities, the GPSMAP 66s/st will track an entire journey. The handheld devices have 16 hours of battery life in full GPS mode and can track the user’s position for up to one week using Expedition mode on a single set of AA batteries, the company said.
The devices include an LED flashlight and SOS beacon that can be used to signal for help. It is built to military standards for thermal, shock and water performance (MIL-STD-810G).
-
DigitalGlobe makes available MDA RADARSAT-2 data in SecureWatch

Logo: DigitalGlobe Synthetic aperture radar (SAR) imagery from Maxar’s MDA RADARSAT-2 satellite will become available to SecureWatch subscribers on Oct. 1, according to DigitalGlobe.
SecureWatch, DigitalGlobe’s cloud-based geospatial intelligence (GEOINT) platform, will now combine the company’s high-resolution optical imagery and MDA’s SAR imagery in one platform, enabling defense and intelligence analysts to deliver actionable insights to decision makers regardless of weather and light conditions, the company said.
Maxar’s MDA will refresh hundreds of global sites on a weekly basis using RADARSAT-2’s Wide Ultra Fine format (3 meter resolution, 50 kilometer scene width).
RADARSAT-2 imagery allows users to observe features and changes that go undetected using other imaging techniques, and provides day and night coverage regardless of weather.
SecureWatch users can access timely RADARSAT-2 imagery using current subscription plans. When combined with 30 cm optical imagery, analysts will have an even more uniquely powerful and reliable toolset to perform analysis to make decisions with confidence, the company said.
“Adding RADARSAT-2 imagery to SecureWatch is a perfect demonstration of Maxar Technologies’ unique promise: create valuable, integrated and innovative solutions that address customers’ critical challenges,” said Mike Greenley, group president of MDA. “MDA’s RADARSAT-2 information has played a key role in supporting security missions for over two decades, and partnering with our sister company, DigitalGlobe, immediately enhances our offerings and expands our global reach.”
“SecureWatch subscribers now have an exciting new tool to enrich GEOINT gathering and decision-making,” said Dan Jablonsky, DigitalGlobe president. “Combining SAR and optical imagery takes analysts’ abilities to the next level to deliver powerful insights into what’s happening in their areas of interest and allows them to save lives, resources and time.”
