Honeywell has signed an agreement with the Greek Ministry of Maritime Affairs and Insular Policy to upgrade Greece’s search-and-rescue operations using next-generation, satellite-based tracking technology.
Under the agreement, Honeywell will provide the Hellenic Center of Mission Control with eight satellite antennas, three rescue control systems and computer equipment, as well as installation, customization, training and technical support services for seven years.
Using satellite signals, Honeywell’s technology can precisely locate emergency distress beacons and coordinate the deployment of rapid response teams, the company said.
The technology incorporates the COSPAS-SARSAT system, an international satellite-based program for distress alert detection and information distribution.
“By leveraging a network of ground-based antennas and medium earth orbit satellites, we can more precisely locate distress signals from emergency beacons,” said Mehrez Hached, director of business development for Honeywell’s Global Tracking and Search and Rescue business. “This Honeywell solution will help the Greek National Search and Rescue Coordination Center and the Hellenic Coast Guard save lives by quickly identifying aircraft, ships and people in distress regardless of how remote their location.”
Honeywell will install the satellite antennas on sites operated by the Hellenic Air Force and deploy management and surveillance equipment to the Hellenic Coast Guard Headquarters in Piraeus, Greece.
Honeywell’s search and rescue solutions are part of the company’s Safety and Productivity Solutions business. Honeywell provides fixed antennas, terminals, consoles and software applications to quickly locate missing assets on land or at sea and minimize emergency response times.
The company’s software offerings include SARMaster Search, a full-featured incident management application used by frontline operators to coordinate rescue operations, which has helped save tens of thousands of lives.
Honeywell’s tracking technology was incorporated into the European Space Agency’s Galileo search-and-rescue program, a pan-European program designed to dramatically reduce emergency response times using geo-positioning satellites.
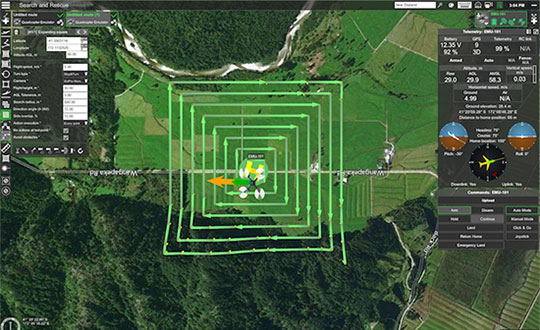
UgCS, a provider of mission planning software for unmanned aircraft systems (UAS), and public safety and disaster response UAS expert Airborne Response have developed a comprehensive search capability for drones that will allow remote pilots to more effectively conduct search-and-rescue operations using the UgCS platform.
The software enhancements will provide users with customizable search patterns such as the “expanding square” and “creeping line” that can be easily deployed in emergency and non-emergency situations.
Based on the flight altitude input by the operator, the UgCS software will automatically calculate key variables such as the course heading and track spacing necessary to provide the prescribed coverage area for a search target.
Tom “Oaty” Oatmeyer is an air rescue expert with 28 years of experience piloting helicopters for both the U.S. Air Force and the Miami-Dade Fire Rescue department. As an aircraft commander, Oatmeyer is credited with saving more than 150 lives during emergency and disaster response operations.
Oatmeyer worked directly with the UgCS development team to bring the new features to fruition.
“As first responders, we are trained to develop an emergency search plan using time-tested and proven tactics,” said Oatmeyer, chief pilot, Airborne Response. “The new enhancements to the UgCS mission planning software will allow remote pilots at every skill level to quickly plan and implement a professional search mission with a UAS.”
Airborne Response and UgCS will be hosting a joint web conference on Thursday, Aug. 16, at 2 p.m. ET to officially unveil the new search features of the UgCS mission planning software. Register here.
Also, Airborne Response and UgCS have reached an agreement for Airborne Response to offer the UgCS mission planning software and associated training to public safety and emergency response professionals throughout the U.S.
“When lives are on the line, every second counts,” Oatmeyer said. “UgCS now represents another valuable link in the UAS technology chain to enhance the public safety mission.”
“The new UgCS search feature is designed to make searching for a target with a drone as simple and reliable as possible,” said Janis Kuze, sales director at SPH Engineering. “We look forward to continue working with the Airborne Response team to further enhance the software capabilities and implement additional search pattern features.”
At least 65 people have been rescued by drones in the last year, according to a new report issued by DJI, a civilian drones and aerial imaging company.
The report gathers accounts from news outlets and public safety agencies around the world, and includes 27 separate incidents on five continents.
The report, “More Lives Saved: A Year Of Drone Rescues Around The World,” is available for download. It highlights how improved drone technology, rapid adoption by first responders, and smart aviation regulations have combined to increase the pace of drone use in critical public safety missions.
dropped buoys to struggling swimmers in Australia and Brazil,
spotted unconscious victims in sub-freezing weather in England and America, and
found stranded people in fields, rivers and mountains.
“Drones allow rescuers a way to find missing people, deliver supplies like food and life vests, and cut search and response times from hours to minutes,” said Brendan Schulman, DJI vice president for policy and legal affairs. “When laws and regulations allow public safety agencies to deploy drones easily, rescuers are able to save time and money, protect their personnel, and most importantly, rescue people from peril.”
More than one person a week was rescued by a drone over the last year on average, the report found, including at least 18 found by thermal imaging cameras that can sense a person’s body heat even in darkness or when hidden by thick brush.
In one case, police in Lincolnshire, England responded to a car crash on a dark rural road on a cold night but were unable to find the driver. A drone with a thermal imaging camera spotted the driver in a ditch away from the crash scene, and captured the dramatic moments when it guided officers to find him. See video below.
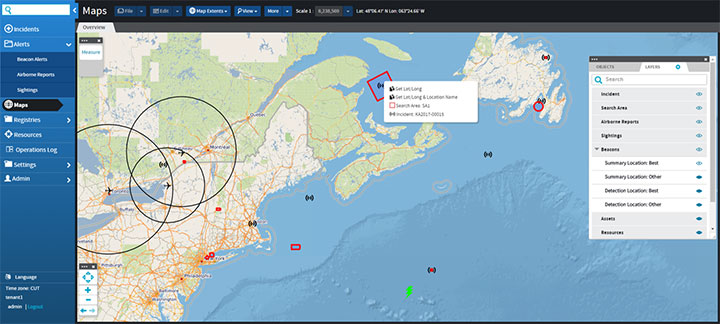
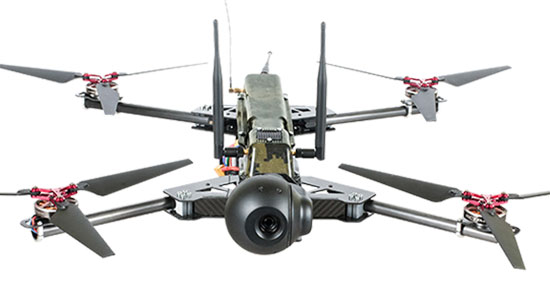
UASTrakker LLC is offering a new guidance system to enable first responders and maritime rescue units to use fully autonomous drones to help locate people lost at sea or in the wilderness.
The company will showcase the system at AUVSI Xponential, scheduled for April 30-May 4 in Denver, Colorado.
UASTrakker emergency response UAV.
The emergency RF beacon tracking system for drones is based on the company’s core patent-pending technology, which uses an internet of things (IoT) edge computer, running the company’s proprietary software and algorithms to deliver an autonomous search-and-rescue (SAR) solution to the professional end user.
UASTrakker integrated systems using an autonomous drone for locating emergency distress beacons, such as a personal locator beacon (PLB) or man overboard beacon.
The UASTrakker system is capable of locating individuals stranded in floods, lost at sea or on land and is expected to be a key component of rescue efforts in maritime rescue, as well as SAR in the wilderness.
How the system works
Trained users operate the UASTrakker-enabled drone by initiating a flight plan to locate the last known position of the target. Once in the air, the drone will scan the emergency radio frequencies used by PLB beacons in distress, and provide situational awareness to first responders using its thermal, infrared and daytime cameras.
When the target is located, the drone stores the GPS coordinates trail, and has the ability to drop lifesaving rescue supplies, or even lower a winch to a person, and rescue them to safety using a heavy lift drone.Ac
During the entire rescue, UASTrakker streams live video into the company’s cloud computing solution of the entire flight, recording the physical location of the incident in day or nighttime conditions. This enables multi-agency collaboration on SAR missions to help locate the victim.
According to the company, the UASTrakker system is compatible with many off-the-shelf drones, so it can be installed on medium-sized multi-rotors for short missions, a hybrid- electric plane for longer missions, or a heavy lifter for difficult to reach areas and rough weather.
At any time, the user can take over control of the flying of the drone, and activate features like the winch. Cellular/satellite technology offers an almost unlimited range of control.
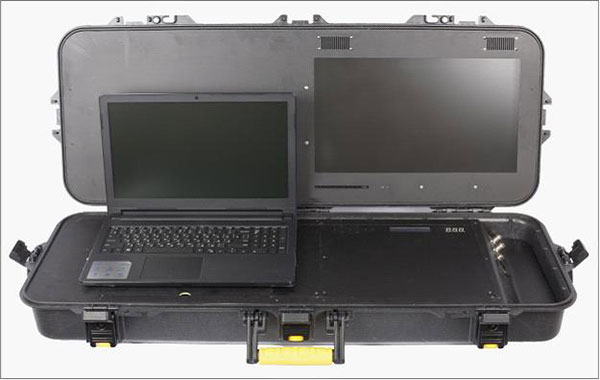
UASTrakker ground control station.
The UASTrakker company is also developing technology for moving ground control stations, so that drones will land more easily on a ship or moving platform like a SWAT vehicle.
The company’s proprietary artificial intelligence (AI)-capable internet console is expected to provide the pilot in command a first-of-its-kind online search grid, with online tools to initiate the autonomous flight search-and-rescue procedure.
When other first responders have downloaded the UASTrakker app, they will have a collaborative map of the rescue operation, showing the drone position and the location of any emergency PLBs within range, while the drone autonomously locates and surveils them until rescuers can arrive.
“A UASTrakker customized rescue drone can be deployed in many different emergency and disaster situations to locate survivors from maritime accidents, avalanches, hikers in distress or to locate stranded people after a natural disaster like a hurricane or flood, by tracking the PLB that is activated by the person in distress,” said Shawn Holmgren, CTO of UASTrakker.
UASTrakker anticipates interest from government agencies including police, fire and rescue, and military, along with private individuals and commercial businesses.
Holmgren will introduce the system at the Association for Unmanned Vehicle Systems International (AUVSI) Xponential show, booth 3233B. The company expects to launch the UASTrakker system by the hurricane season and summer of 2018.
By Simon Batzdorfer, Markus Bobbe, Martin Becker and Ulf Bestmann, Technische Universitaet Braunschweig
All images courtesy of the authors.
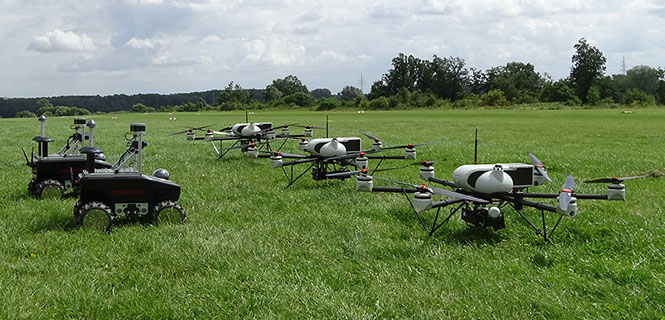
Autonomous vehicles equipped with different environmental sensors, such as optical or thermal camera or a lidar, performed a team survey controlled by a central ground station. The ground station serves as a user interface to define missions and tasks and also to visualize exploration task results online. 2D stitched orthophoto or lidar point clouds are transmitted for display and processing into 3D photogrammetry. Georeferencing data is gathered by an integrated GNSS/IMU positioning system.
In disaster scenarios such as fires, floods or search-and-rescue tasks, good situational awareness is indispensable for responders coping with a complex and often chaotic environment. In most cases, a prior known map data are outdated, and an efficient situational proceeding such as path planning or creation of a search pattern cannot be performed. This information can often only be gathered by manned exploration using ground or airborne systems, with limits on availability.
The research project Automated Navigation and Communication for Exploration (ANKommEn) seeks to create an automated unmanned system to close this gap by providing up-to-date scenario information while increasing the safety of human resources, using unmanned aerial (UAV) and ground-based (UGV) vehicles.
To provide up-to-date information of the desired destination area, all vehicles are equipped with identical positioning and communication hardware complemented by diverse sensors (RGB camera, infrared [IR] camera, lidar) for visual exploration. The visual sensor information is transmitted to a central ground station for visualization and/or analysis. To increase the advantages of the system, the unmanned systems should have a high grade of automation to reduce the workload of the operator so that only basic inputs have to be done by the operator. For example, just by marking a destination area and choosing a predefined task, the mission will be planned automatically, and after the corresponding waypoint-list has been transmitted to the vehicles, the mission will start.
Automated procedures of a UAV in particular require valid position information related to accuracy, availability and continuity. In exploration areas where the UAV operates in low altitude or using a UGV, the reception of the GNSS signal can be degraded by the topology (buildings and such). Using more than one GNSS can increase the availability of position information. Vehicle control, georeferencing environmental sensor data and exploration results all require high-frequency absolute position and attitude and heading information. This data is gathered by fusing GNSS and inertial measurment unit (IMU) data.
OVERALL SYSTEM DESIGN
The overall system consists of three UAVs, two UGVs (Opening photo) and a central ground control station. The latter serves as a central human-machine interface to monitor and manage cooperative operation of the UAVs/UGVs by an operator. Based on a priori known map data, exploration areas and tasks are defined and assigned to the UAVs/UGVs and will be updated with actual information of the visual sensors while performing a mission.
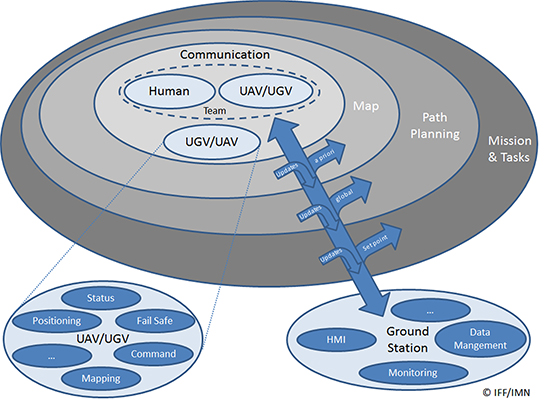
Figure 1 shows the interaction and information exchange between the different vehicles and sensors.
Figure 1. Diagram of interaction and information exchange.
All UAVs/UGVs are equipped with a navigation and communication unit (NAV/COM) and an environmental sensor payload (ENV) unit, including an RGB camera, thermal camera or a lidar respectively.
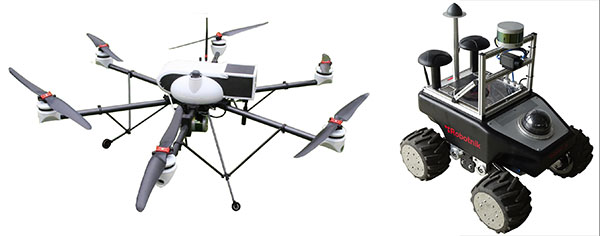
UAV/UGV and Sensor Hardware. The UAVs carry a payload of 2.7 kg (NAV/COM unit, mounted in the upper compartment, and ENV unit mounted under the UAV) and a flight time of up to 30 minutes (Figure 2, left). The payload sensors are carried and stabilized by a two-axis-gimbal. The environmental sensor payload unit is based on three different types of sensors, which are interchangeable between the different UAVs: RGB camera, lidar and IR camera.
For ground-based exploration, two four-wheel-drive UGVs carry a pan-tilt-zoom (PTZ) camera at the top of front chassis (Figure 2, right), and are equipped with a lidar and a thermal camera, or a stereo RGB camera, respectively.
Figure 2. UAV carrying a lidar (left) and UGV carrying lidar and IR camera (right).
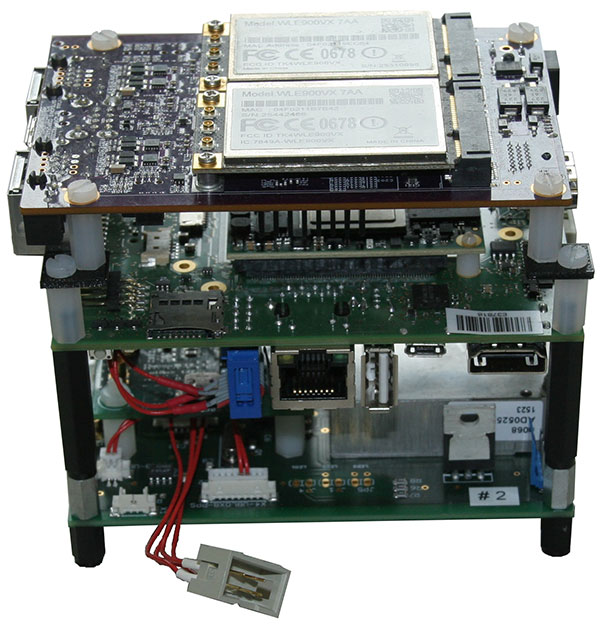
The navigation and communication unit mounted as a stack includes a network processor board for communication and data exchange between the UAV/UGV and the central ground and control station. An embedded processing board provides position calculation and GNSS-NTP-based time server. Data for the position calculation is provided by a custom-designed break-out-board (Figure 3).
Figure 3. Navigation and communication unit.
Data traced by these sensors cannot be sent directly to the ground station because of the huge data amount and the limited bandwidth of the communication link. Therefore, data from the sensors are preprocessed or compressed on a small form-factor personal computer and then transmitted to the ground station.
Ground Station. The ground station is the central device for command, control and visualization of the total system. It provides several options to display the data from the sensors and vehicles and a combination of them, and also provides automated path planning and calculation of the 3D reconstruction (photogrammetry) and online 2D stitched orthophoto.
Software Frameworks. The basic software for determining the vehicle’s state in 3D position, velocity, attitude and heading is established within a modular navigation software framework, with the option to process data of different sensors in real time as well as post-processing for data evaluation and development purposes. Several algorithms for sensor data fusion are implemented. The algorithm for IMU/GNSS fusion is based on an extended Kalman filter and also provides an IMU data-based state vector, stabilized by GNSS information, for the visual sensors. This state vector is published by using the robot operating system (ROS), a framework for inter-process communication based on a TCP or UDP publisher/subscriber concept. The visual sensors and embedded PCs subscribe to different ROS messages, for example, the state-vector-message or information of other sensors.
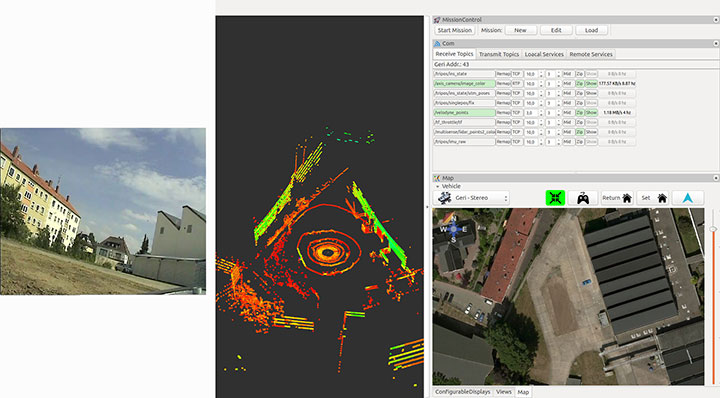
Figure 4 shows examples of the actual camera view from the UGV, and point cloulds and map generated by the UAV. The software layout can be customized by the user.
Figure 4. From left to right: the actual view by the PTZ camera onboard the UGV, the point cloud gathered by the UAV’s lidar, and the mission parameters and map of an aerial view.
POSITIONING OF UAV AND UGV
Automated operation of UGVs and UAVs requires valid position as well as attitude and heading information. In the case of using only one GNSS, signal quality and availability can be degraded by the environment (buildings) and can result in less precise or even a lack of position information.
GNSS Multi-Constellation. To overcome the risk of poor availability of GNSS-based position information, parallel usage of different GNSS can raise the number of received satellite signals: GPS, GLONASS, the evolving Galileo and BeiDou. When using a multi-constellation approach for positioning, one has to take care of several differing aspects between the GNSS. Each system uses a different geodetic reference frame and time basis. Measurements gathered from another GNSS system must be transformed into the reference frame of the desired system. The geometric distribution of the satellites is improved by using more than one GNSS constellation, indicated by a lower dilution-of-precision value.
The navigation software framework is designed for real-time computation and also for post-processing. In post-processing, the recorded sensor data is streamed to the software framework with the option of changing several parameters and settings for calculation. One option is to exclude satellites at low elevation from position calculation by changing the cut-off elevation for these satellites. This parameter will be changed to simulate environmental conditions that block receiving GNSS signals, like buildings within urban scenarios, to compare the availability of received GNSS signals for single- and multi-constellation-based position calculation.
Recorded data of a real-world test serves as the database for the post-processing with different cut-off elevation parameters. At the beginning of the field test, there was a short initialization period to boot the OS and to start basic processes for positioning. After that, a predefined mission was flown and the GNSS measurements have been saved for the described post-processing.
Post-processing has been performed with different cut-off elevation parameters of 5° up to 35°. In the case of 35°, the number of GPS satellites is reduced to the minimum for position calculation of four, in contrast to 5–7 available satellites for a multi-constellation based solution.
GNSS/IMU Fusion. Using the GNSS multi-constellation approach can increase availability of position information. For attitude and heading determination, an IMU is nevertheless indispensable. Additionally, the frequency of the pure GNSS-based positioning information is usually between 1 Hz to 5 Hz within the described hardware setup. Meaningful georeferencing of the environmental sensors requires much higher frequency position and attitude information.
The IMU provides high-frequency 3D measurements of accelerations and angular rates. Using common strapdown algorithm processing, high-frequency position, velocity, attitude and heading information is provided in real time. Due to the short time stability of pure inertial navigation, the GNSS positioning results are used for aiding purposes within the Kalman filter’s update step. To overcome the absence of GNSS aiding information even when using multi-constellations, there are mainly two options. First, a short coasting period is possible after the data fusion has reached a steady state.
Second, due to the highly modularly design of the navigation software framework, it is possible to use position or attitude increments from environmental sensor data processing for aiding the IMU.
The vehicle’s state vector is then distributed with high frequency within the system for georeferencing measurements of the environmental sensors, especially the RGB camera and the lidar for photogrammetry and simultaneous location and mapping (SLAM) applications.
PHOTOGRAMMETRY AND SLAM
In major fire scenarios, maps can be out of date. Therefore, techniques have been developed to gather a 2D overview based on several single RGB pictures taken and processed on board a UAV and transmitted to the ground station via data links. Additional processing of a 3D reconstruction of the scenario is an integrated feature within the ground station. Both approaches were implemented to get an automated rapid aerial mapping solution.
In the case of the 2D overview, SLAM algorithms, often used in robotic research, are adapted for this specific use case. These algorithms provide good results for a rapid aerial mapping solution to get an overview of the scenario, because the map is updated incrementally with every new image, but they are less precise, which can be compensated for by using the photogrammetric 3D reconstruction. The live mapping (SLAM) approach is based on the ORB-SLAM algorithm, and the photogrammetry-based approach uses commercially available photogrammetry software.
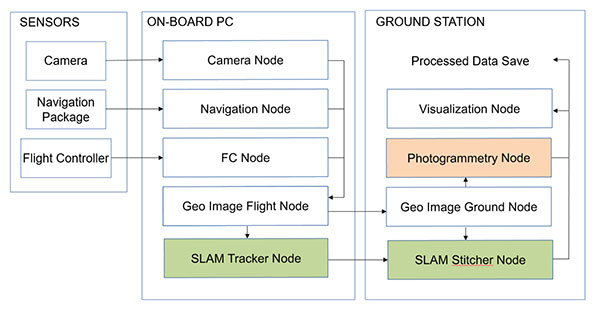
The systems, on the UAV for 2D and for 3D on the ground station, use the ROS framework for processing the visual sensor data and the described techniques for positioning, georeferencing and attitude determination. For data exchange between these frameworks, several software interfaces have been implemented. Figure 5 displays a flowchart of the implemented workflow.
The sensor/input data is received by corresponding nodes on the aerial vehicle. After adding the camera pose information to the image in the geo-image flight node, the image is sent to the geo-image ground node on the ground station. The SLAM process is separated into two parts. The SLAM tracker node calculates the transformation between images, and the SLAM stitcher node applies the transformations. The transformed images are displayed by the visualization node. The photogrammetry node receives the georeferenced images, stores the data, and initiates the photogrammetric processing once the survey is finished. The results can also be displayed by the visualization node and exported in a desired format.
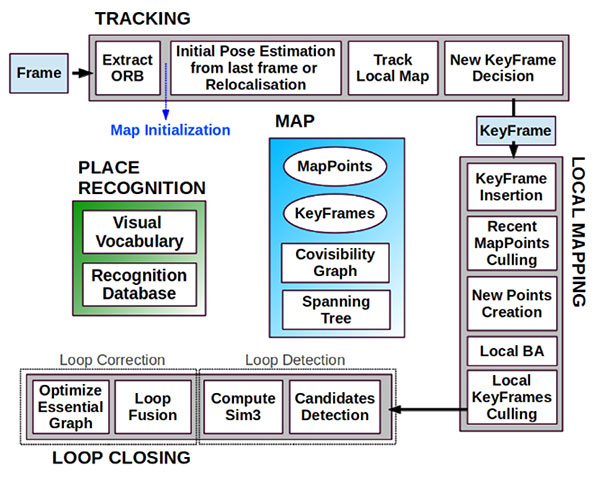
Visual SLAM. Computer vision-based algorithms have developed rapidly over the last few years. One method estimates a pose by using monocular image processing, known as parallel tracking and mapping (PTAM). This integrates a bundle adjustment and separates the tracking and the mapping procedure into different threads, leading to a real-time capable framework. These basic PTAM principles have been integrated into a robust loop-closing and another method of relocalization, known as Oriented FAST and Rotated BRIEF (ORB SLAM), shown in Figure 6. Here, tracking, local mapping and loop closing are separated into different threads (gray boxes), with the main map and place recognition in the middle.
Figure 6. ORB SLAM system overview [Mur-Artal, 2015].The tracking thread predicts the current pose from the last known position and movement by using a constant velocity model and performs a guided search of map points. If these points are found near the estimated position, the velocity model is valid and the tracking procedure continues. Otherwise, the tracking is lost and a relocalization in the global map starts by using a subset of features, which are increased after detection of corresponding features in other keyframes to optimize the camera pose and, finally, the tracking procedure continues. The last step of this procedure is to decide whether the current frame contains enough information to be inserted as a new keyframe for further calculations.
To mark a frame as a new keyframe, the frame must fulfill all of the following conditions:
More than minimum number of frames has passed.
Local mapping is on idle or condition 1 fulfilled.
A minimum number of 50 points is observed.
A maximum of 90% of the features is already observed by the other frames.
When a new keyframe is passed to the local mapping procedure and inserted as a node into a co-visibility graph structure, new correspondences are searched in the connected keyframes to triangulate new points. Based on the information accumulated during the tracking, a point culling keeps only high-quality points in the map as well as a culling of redundant keyframes.
Then a loop closing is performed. This is one of the main improvements compared to PTAM. If a loop is detected, the drift accumulated in the loop is computed, and both sides of the loop are aligned and visible points are fused. In a final step, a pose graph optimization is done to achieve global consistency.
This information of the 3D camera pose is used to generate a 2D orthophoto in real time while the vehicle is flying. To create a 2D orthophoto, a common reference frame is approximated, which is orthogonal to all camera measurements. The projection is performed by using a projection model based on a pinhole camera.
After the compensation and distortion, the whole image can be stitched to the current global map.
Photogrammetry. This approach uses off-the-shelf photogrammetric processing software. The processing is triggered automatically when the survey is completed and all images are transferred to the ground station via data link. For georeferencing of the images, the camera location and the inner camera geometry were written to the EXIF file of each image by the geo-image ground node (Figure 5). To ensure an acceptable compromise between orthophoto quality and the required processing time, an analysis regarding the impact of the most relevant processing parameters has been performed.
Figure 5. ROS node layout with SLAM (green) and photogrammetry workflow (red).
The photogrammetry process consists of four steps:
camera alignment (optimizing the homographic equation)
mesh creation by generated tie points
orthophoto creation (dense cloud or digital elevation model)
export.
Analyses and Evaluation. To evaluate the correct workflow of both approaches of 2D live-stitching and the 3D photogrammetry, a real-world flight test above agricultural cropland has been performed. The results of both approaches are shown in Figure 7 and Figure 8. Generally, agricultural cropland and its mean textured surface pose a challenge for mapping processes because of the limited number of trackable features.
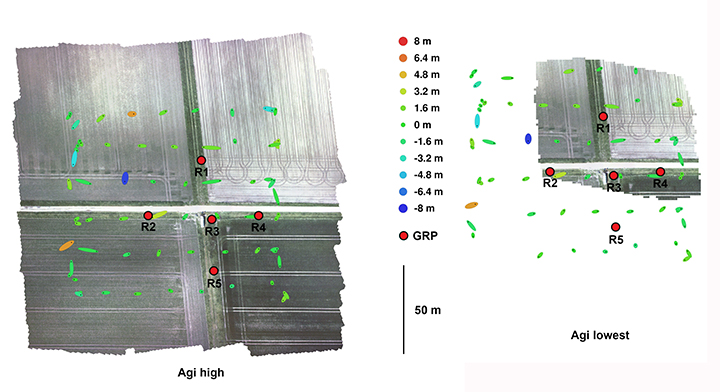
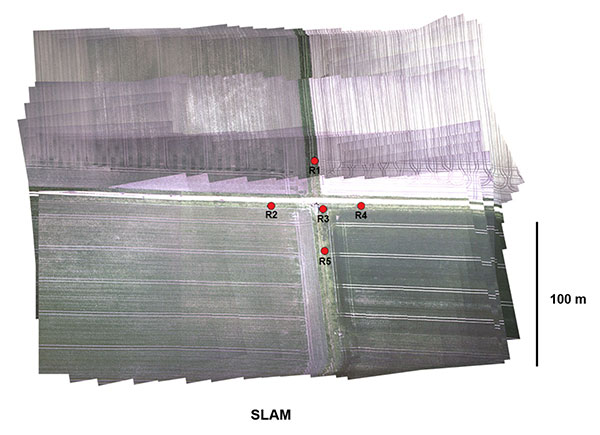
Figure 7. Orthophotos created with the profiles high and lowest (including ground reference points).Figure 8. Orthophotos created with 2D live stitching approach of cropland.
Four predefined profiles were used to cover the requirement of compromise between processing duration and quality of the generated orthophoto. Each profile level generates a corresponding level of alignment accuracy and mesh face count: lowest, low, medium and high.
To estimate the accuracy of the created maps by the different profiles, five ground reference points (GRPs) were distributed over the mission area. The location of the GRPs was determined using a RTK-GNSS system leading to a horizontal RMSE below 2 cm. To enable robust processing for this scenario, the overlap and the sidelap was chosen to be 70%. A ground-sampling distance (GSD) of 2 cm was needed to identify the GRPs. This resulted in a mission consisting of six times 100-meter (m) lines with a distance of 25 m in an altitude of 60 m over ground. During the flight time of 4.5 minutes, 271 images were taken.
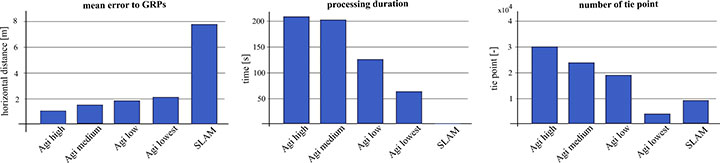
To compare the profiles, they were triggered one after another with the same set of images. The created results are shown in Figure 7. All profiles resulted in consistent solutions and were successfully georeferenced. The map based on the lowest profile could not recreate the complete area (Figure 7, right). The remaining profiles led to similar results without notable differences to visual inspection. The processing time varied between 1.2 and 3.6 minutes. A comparison of this and other criteria is given in Figure 9.
Figure 9. Evaluation and comparison of defined software profiles and visual SLAM.
The created final image of the SLAM pipeline is shown in Figure 8. The image was updated with every new image and was therefore finished before the UAV landed. The mean location error measured using the reference points was about 8 m, significantly larger than the errors observed in the photogrammetry results. In Figure 9 the results are contrasted to the results of the photogrammetry approach.
While the mean error in the low profile is half as high as in the lowest profile, the calculated errors using the medium and high profiles are not enhanced significantly. The number of tie points created by the lowest profile is an order a magnitude lower compared to the other three profiles.
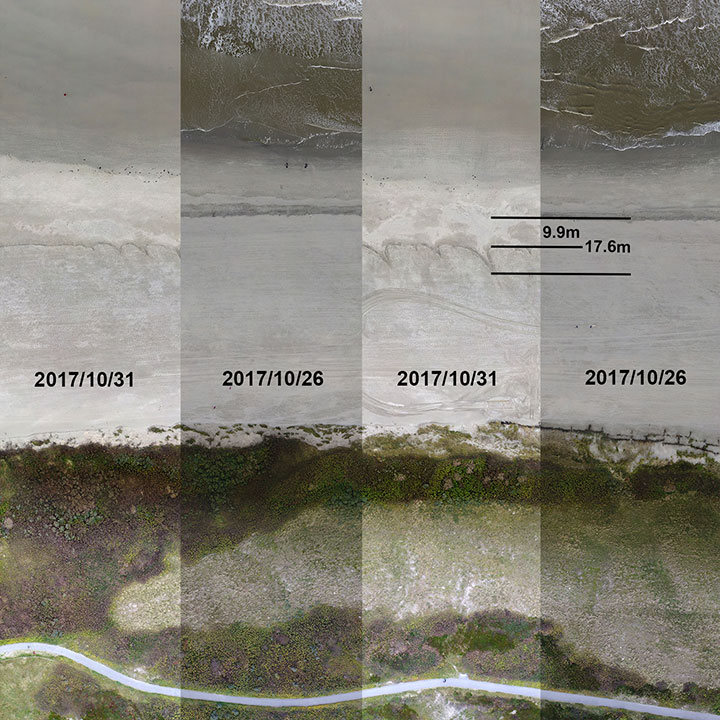
We conducted flight tests on Langeoog island in the North Sea, to gather information on efforts to protect the island’s coastline from water erosion. For this reason, sand was selectively washed up to the coastline by dredgers at the beginning of October 2017. Between Oct. 26 and 31, due to severe weather with a storm flood, a huge erosion of the washed up sand occurred, and the result is shown in Figure 10. The level of erosion was determined by comparison of the orthophoto of the same area. The dislocation averaged out to 9.9 m with some peaks up to 17.6 m.
Figure 10. Evaluation of erosion.
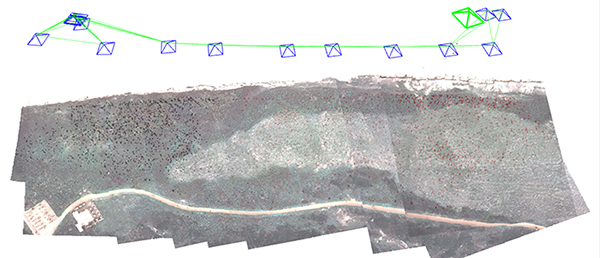
The 3D photogrammetry provides a more detailed image compared to the image of the 2D-live-stitching approach (Figure 11), but both approaches can provide the desired information of the area.
Figure 11. Result of the SLAM approach with camera poses and tracked features.
Both implemented approaches were successfully integrated to get the desired fully automated rapid aerial mapping solution. This also includes the basic tasks of the automated mission planning, camera control, image transport to ground station, automated processing and the visualization of the results.
CONCLUSION
The benefits of multi-constellation GNSS positioning have been demonstrated with a focus on UAVs and UGVs operating in catastrophic scenarios, especially where GNSS signal reception might be blocked. This position information is also used for georeferencing of images and visual reconstruction of the area. The overall system has demonstrated the capability of an automated orthophoto generation. Both implemented mapping methods — a 2D live stitching and a 3D photogrammetry — provided results that fulfill the requirements to get an instantaneous 2D overview and a contemporary 3D reconstruction of the area.
ACKNOWLEDGMENTS
This work was done within the joint research project ANKommEn, funded by the German Federal Ministry of Economic Affairs and Energy, administered by the Space Administration of the DLR (funding code: 50NA1518). Project partners are the Institute of Flight Guidance (IFF), the Institute of Mobile Machines and Commercial Vehicles (IMN) — both part of Technische Universität Braunschweig — and AirRobot GmbH & Co. KG, a German manufacturer of multirotor UAVs. The professional fire brigade of Braunschweig and the Lower Saxony Water Management, Coastal Defense and Nature Conservation Agency also participate as associated project partners.
SIMON BATZDORFER holds a Dipl.-Ing. in mechanical engineering and is a research engineer at the Technische Universitaet Braunschweig, Institute of Flight Guidance (IFF).
MARKUS BOBBE holds a M.Sc. in aerospace engineering and is a research engineer at the Braunschweig IFF.
MARTIN BECKER holds a Dipl.-Ing. in aerospace engineering and is a research engineer at the Braunschweig IFF.
ULF BESTMANN received his Dr.-Ing. in mechanical engineering from TU Braunschweig. He is head of the navigation department of the IFF. He co-founded the company messWERK GmbH, a service provider in flight testing and certification.
Remote GeoSystem, North Shore Rescue and Talon Helicopters have successfully deployed a geoDVR Gen2 with a FLIR daylight EO/IR gyro-stabilized video camera on an Airbus TwinStar (AS355) for search-and-rescue (SAR) missions.
NSR and Talon team operate the geoDVR and FLIR during ground training in October 2017.
The geoDVR Gen2 is an advanced mil-spec DVR for recording multiple channels of HD & Standard-Definition geospatial full motion video in airborne and rugged vehicle environments.
The geoDVR’s ability to reliably record HD color and infrared, along with continuous GPS data and Live Moving Maps, make it suited for professional airborne search and rescue, law enforcement and infrastructure inspection applications that utilize multi-sensor gimbal video cameras.
“Remote Geo has a reputation for building one of the industry’s most dependable and user-friendly airborne geospatial video recorders, complete with flexible post-flight mapping tools. So the geoDVR Gen2 was an obvious choice when we were asked to fly the FLIR on the TwinStar for mountain search and rescue,” says Peter Murray, Founder/Operations Manager at Talon Helicopters.
“Adding the FLIR camera to North Shore Rescue’s toolbox has been a great enhancement to NSR’s capabilities,” said Jim Loree, North Shore Rescue SAR manager and air operations coordinator. “Having the ability to record and geo-track the location of the video seemed essential to maximizing the full potential of the FLIR camera. The geoDVR allows searchers to review recorded video for clues that may or may not have been observed during the flight.”
“This feature could also be highly valuable in a large-scale disaster such as an earthquake where widespread areas are surveyed for damage,” Loree said. “Emergency Operation Centers would be able to use the data to help them make decisions on where and how to deploy resources based on the exact location and extent of damages provided by the video recording.”
North Shore Rescue and Talon Helicopters will use the geoDVR with a FLIR generously donated by Port of Vancouver to perform helicopter-based SAR operations with color and infrared. Then, using LineVision™ software post-flight, North Shore Rescue will review the geoDVR videos and flight tracks overlaid on Google Earth and Esri maps for training mission planning and recovery operations.
Because North Shore Rescue is an all volunteer organization, Remote GeoSystems donated 18 LineVision Esri Maps and LineVision Google Earth licenses as part of the implementation.
By Carmela Ruta, Francesco Paggi and Monica Gotta, Thales Alenia Space-Italia; D. Oskam, Airbus Defence and Space; and Rafael Lucas Rodriguez and Igor Stojkovic; European Space Agency / Presented at the European Navigation Conference, Switzerland, May 2017
The European Space Agency, Thales Alenia Space-Italy and Airbus Defence and Space contributed to the Search and Rescue/Galileo Forward Link system deployment and performance evaluation with a full-scale System Performance Validation test campaign, aimed at evaluating the performances of the SAR/Galileo system, in terms of distress detection rate, localization probability and localization accuracy.
Forward Link Message Detection probability in 10 minutes.
The paper describes SAR/Galileo principles and the COSPAS-SARSAT MEOSAR concept (detection and localisation of distress events based on MEO satellites). It presents the space and ground segments of the Galileo infrastructure that enables the SAR/Galileo Forward Link Service provision and the main inherent performances of the system. The SPV test campaign is described in terms of objectives and organization; the main results are presented, and the foreseen milestones for SAR/Galileo deployment are summarized.
Global availability of 5 km beacon localisation accuracy (95%) in 10 minutes.
A GPS-lidar fusion technique implements a novel method for efficiently modeling lidar-based position error covariance based on features in the point cloud. The fusion uses a three-dimensional (3D) city model to detect and eliminate non-line-of-sight (NLOS) GPS satellites to improve global positioning.
The technique has potential application in UAV missions such as 3D modeling, filming, surveying, search and rescue, and package delivery.
By Akshay Shetty and Grace Xingxin Gao, University of Illinois
Unmanned aerial vehicles (UAVs) commonly rely on GPS for continuous and accurate outdoor position estimates. However, in certain urban scenarios, additional onboard sensors such as light detection and ranging (lidar) are desirable due to errors in GPS measurements. To fuse these measurements it is important, yet challenging, to accurately characterize their error covariance. We propose a GPS-lidar fusion technique with a novel method for efficiently modeling the position error covariance based on surface and edge features in point clouds. We use the lidar point clouds in two ways: to estimate incremental motion by matching consecutive point clouds; and, to estimate global pose (position and orientation) by matching with a 3D city model. For GPS measurements, we use the 3D city model to eliminate NLOS satellites and model the measurement covariance based on the received signal-to-noise-ratio (SNR) values. Finally, all the above measurements and error covariance matrices are input to an unscented Kalman Filter (UKF), which estimates the globally referenced pose of the UAV. To validate our algorithm, we conducted UAV experiments in GPS-challenged urban environments on the University of Illinois at Urbana-Champaign campus.These experiments demonstrate a clear improvement in the UAV’s global pose estimates using the proposed sensor fusion technique.
SITUATION
Emerging applications in UAVs such as 3D modeling, filming, surveying, search and rescue, and package delivery all involve flying in urban environments. In these scenarios, autonomously navigating a UAV has certain advantages such as optimizing flight paths and sensing and avoiding collisions. However, to enable such autonomous control, we need a continuous and reliable source for UAV positioning. In most cases, GPS is primarily relied on for outdoor positioning. However, in an urban environment, GPS signals from the satellites are often blocked or reflected by surrounding structures, causing large errors in the position output.
In cases when GPS is unreliable, additional onboard sensors such as lidar can provide the navigation solution. An onboard lidar provides a real-time point cloud of the surroundings of the UAV. In a dense urban environment, lidar can detect a large number of features from surrounding structures such as buildings.
Positioning based on lidar point clouds has been demonstrated primarily by applying different simultaneous localization and mapping (SLAM) algorithms. In many cases, algorithms implement variants of iterative closest point (ICP) to register new point clouds.
APPROACH
The main contribution of this article is a GPS-lidar fusion technique with a novel method for efficiently modeling the error covariance in position measurements derived from lidar point clouds. Figure 1 shows the different components involved in the sensor fusion.
Figure 1. Overview of sensor fusion architecture.
We use the lidar point clouds in two ways: to estimate incremental motion by matching consecutive point clouds; and, to estimate global pose by matching with a 3D city model. We use ICP for matching the point clouds in both cases.
For the lidar-based position estimates, we proceed to build the error covariance model depending on the surrounding point cloud. First, we extract surface and edge feature points from the point cloud. We then model the position error covariance based on these individual feature points. Finally, we combine all the individual covariance matrices to model the overall position error covariance ellipsoid.
For the GPS measurement model, we use the pseudorange measurements from a stationary reference receiver and an onboard GPS receiver to obtain a vector of double-difference measurements. Using the double-difference measurements eliminates clock bias and atmospheric error terms, hence reducing the number of unknown variables. We use the global position estimate from the lidar-3D city matching to construct LOS vectors to all the detected satellites. We then use the 3D city model to detect NLOS satellites, and consequently refine the double-difference measurement vector. We create a covariance matrix for the GPS double-difference measurement vector based on SNR of the individual pseudorange measurements.
We implement a UKF to integrate all lidar and GPS measurements. Additionally, we incorporate orientation, orientation rate and acceleration measurements from an onboard inertial measurement unit (IMU). Finally, we test the filter on an urban dataset to show an improvement in the navigation solution.
LIDAR-BASED ODOMETRY
ICP is commonly used for registering three-dimensional point clouds. It takes a reference point cloud q, an input point cloud p, and estimates the rotation matrix R and the translation vector T between the two point clouds. Different variants of the algorithm generally consist of three primary steps.
Matching. This involves matching each point pi in the input point cloud, to a point qi in the reference point cloud. The most common method is to find the nearest neighbors of each point in the input point cloud. For our application, a kDtree performs best since the two point clouds are relatively close to each other.
Defining Error Metric. This defines the error metric for the point pairs. We choose the point-to-point metric, which is generally more robust to difficult geometry than other metrics such as point-to-plane. The total error between the two point clouds is defined as follows:
(1)
where N is the number of points in the input point cloud p.
Minimization. The last step of the algorithm is the minimization of the error metric with regard to the rotation matrix R and the translation vector T between the two point clouds.
We use ICP to estimate the incremental motion of the lidar between consecutive point clouds. Figure 2 shows our implementation of ICP to estimate the lidar odometry.
Figure 2. The input to ICP is a reference point cloud q and an input point cloud p as shown in (a). The algorithm calculates the rotation matrix R and the translation vector T such that the error metric E is minimized. (b) shows the reference point cloud q and the transformed input point cloud R • p + T.
MATCHING LIDAR, 3D MODEL
We generate our 3D city model using data from two sources: Illinois Geospatial Data Clearinghouse and OSM. The Illinois Geospatial Data were collected by a fixed-wing aircraft flying at an altitude of 1700 meters, equipped with a lidar system including a differential GPS unit and an inertial measurement system to provide superior global accuracy. Since the data were collected from a relatively high altitude, it primarily contains adequate details for the ground surface and the building rooftops. In order to complete the 3D city model, we need additional information for the sides of buildings. We use OSM to obtain this information. OSM is a freely available, crowd-sourced map of the world, which allows users to obtain information such as building footprints and heights. Figure 3 shows a section of the 3D city model for Champaign County.
Figure 3. Section of the point cloud for Champaign County dataset. (Left) shows the 3D city model using only the Illinois Geospatial Data. (Right) fhows the model after incorporating building information from OpenStreetMap.
To estimate the global pose of the lidar, we match the onboard lidar point cloud with the 3D city model using ICP, in these steps:
Use the position output from onboard GPS receiver as an initial guess. If position output is unavailable, use the position estimate from the previous iteration as an initial guess. For orientation, use the estimate from the previous iteration. Thus, we obtain an initial pose guess .
Project the onboard lidar point cloud pL to the same space as the 3D city model qcity using .
Implement ICP, to obtain the rotation RL and translation TL between the two point clouds. Use this output to obtain an estimate for the global pose .
Figure 4 shows the results of implementation of the above method. While navigating in urban areas, the GPS receiver position output used for the initial pose guess might contain large errors in certain directions. This might cause ICP to converge to a local minimum, depending on features in the point cloud pL generated by the onboard lidar.
Figure 4. Global pose estimation with the aid of 3D city model. (Left) shows the intial position guess (red dot, with term in red outlined box) and the onboard lidar point cloud pL projected on the same space as the 3D city model qcity. (b) shows the updated global position (green dot, with term in green outlined box) after the ICP step. We see an improvement in the global position, as the point cloud matches with the 3D city model.
To evaluate how our lidar-3D city model matching algorithm performs in such challenging cases, we test it in two different urban areas as shown in Figure 5. We begin by selecting a grid of initial position guesses up to 20 meters away from the true position. With an adequate distribution of features, ICP is able to correctly match the two point clouds and provide an accurate position estimate after matching. In contrast, when there’s an urban scenario with a relatively poor distribution of features, ICP is unable to estimate the position accurately.
Figure 5. Lidar-3D city model matching in two different urban areas. We begin with a grid on initial position guesses (red) around the true position (black). In (a) and (b), there are adequate features. The position estimates after matching (blue) converge to the true position. In (c) and (d) the feature distribution is relatively poor. The position estimates after matching (blue) are parallel to the building surface.
MODELING ERROR COVARIANCE
We model the lidar position error covariance as a function of the surrounding features. In urban environments, we typically observe structured objects such as buildings, hence we focus primarily on surface and edge features in the point cloud. We extract these feature points based on the curvature at each point. Points with curvature values above a threshold are marked as edge points, whereas points with curvature values below a threshold are marked as surface points. (For detailed discussion of the algorithms involved, see GPS-LiDAR_AkshayShetty-algorithms.
For each surface feature point, we first compute the normal by using 9 of the neighboring points to fit a plane. We model the error covariance ellipsoid with the hypothesis that each surface feature point contributes in reducing position error in the direction of the corresponding surface normal. Additionally, we assume that surface points closer to the lidar are more reliable than those further away, because of the density of points.
For each edge feature point, we first find the direction of the edge using the closest edge points in the scans above and below. We model the error covariance ellipsoid with the hypothesis that each edge feature point helps in reducing position error in the directions perpendicular to the edge vector. A vertical edge, for example, would help in reducing horizontal position error. Additionally, we assume that edge points closer to the lidar are more reliable than those further away, again because of the density of points. Figure 6 shows sample error covariance ellipsoids for a surface point and an edge point.
Figure 6. Position error covariance ellipsoid for surface and edge feature points. The exact sizes of the ellipsoids are tuned during implementation.
To obtain the overall position error covariance, we combine the error covariance matrices for all the individual surface and edge feature points. Figure 7 shows the combined covariance ellipsoid for two different scenarios. We observe that while passing through a corridor, the covariance ellipsoid is larger in the direction parallel to the building sides due to a poor distribution of features.
Figure 7. Overall position error covariance ellipsoids (black) for two point clouds (green). We combine the error ellipsoids from individual surface (red) and edge (blue) feature points.
GPS MEASUREMENT MODEL
We use pseudorange measurements from the GPS receiver to create the measurement model. To eliminate certain error terms, we use double-difference pseudorange measurements, which are calculated by differencing the pseudorange measurements between two satellites and between two receivers. Before proceeding to use the pseudorange measurements, we check if any of the satellites detected by the receiver are NLOS signals. We use the 3D city model mentioned earlier to detect the NLOS satellites. We use the position output generated by the lidar-3D city model matching to locate the receiver on the 3D city model.
Next, we draw LOS vectors from the receiver to every satellite detected by the receiver and eliminate satellites whose corresponding LOS vectors intersect the 3D city model. Figure 8 shows the above implementation in an urban scenario.
Figure 8. Elimination of NLOS satellite signals. LOS vectors are drawn to all detected satellites: SV3, SV14, SV16, SV22, SV23, SV26, SV31. The LOS vectors to satellites SV23 and SV31 intersect (red) the 3D city model and are eliminated from further calculations.
After eliminating the NLOS satellites, we select satellites that are visible to both the user and the reference receivers to create the GPS double-difference measurement vector and its covariance. We assume that the individual pseudorange measurements are independent, and that the variance for each measurement is a function of the corresponding SNR. We propagate the covariance matrix for the individual pseudorange measurements, to obtain the covariance matrix for the double-difference measurements.
GPS-Lidar Integration
In addition to using a lidar and a GPS receiver, we use an IMU on board the UAV. Figure 9 shows the experimental setup: the UAV designed and built by our research group. For the double-difference GPS measurements, we use a reference receiver within a kilometer of our data collection sites. We implement a UKF to fuse measurements from the sensors and estimate the global pose of the UAV.
Figure 9. Experimental setup for data collection. Our custom-made iBQR UAV mounted with a lidar, a GPS receiver and antennas, an IMU, and an onboard computer.
Position and orientation estimates from lidar and GPS are incorporated via the correction step of the filter, whereas the IMU measurements are included in the prediction step. For position corrections from lidar, we use our point cloud feature based model for the error covariance. For GPS double-difference measurements, we use the covariance based on the individual pseudorange measurement SNR.
We implement our algorithm on an urban dataset collected on our campus of University of Illinois at Urbana-Champaign. As shown in Figure 10, the GPS measurements and the GPS position output contain large errors, due to the presence of nearby urban structures. Here we stack all the double-difference measurements and compute the unweighted least square estimate of the baseline between the UAV and the reference receiver.
Figure 10. Position estimates from GPS measurements. The position output from the GPS receiver (blue) and the unweighted least-squares position estimate (red) contain large errors.
For the lidar measurements, we check the output from our incremental ICP odometry method and the lidar-3D city model matching algorithm. Furthermore, we implement an ICP mapping algorithm to check the performance of existing ICP-based methods on the dataset. In Figure 11, the ICP odometry method and the ICP mapping algorithm accumulate drift over the course of the trajectory. The lidar-3D city model matching algorithm does not drift over time; however, the position still contains errors in situations where the lidar does not detect enough number of points or the matching algorithm converges to a local minimum.
Figure 11. Position estimates from lidar point clouds. The incremental ICP odometry (green) and the ICP mapping (blue) estimates accumulate drift over time. The lidar-3D city model matching (yellow) does not drift over time, but contains errors where the ICP algorithm might converge to a local minimum.
Figure 12 shows the output of the filter for the same trajectory. The filter output estimates the actual path much more accurately than the individual measurement sources by themselves.
Figure 12. Position estimates from UKF, integrating GPS and lidar measurements. The filter position output (blue) resembles the actual trajectory, more accurately than any individual source of GPS or lidar measurements.
CONCLUSION
In summary, we proposed a GPS-lidar integration approach for estimating the navigation solution of UAVs in urban environments. We used the onboard lidar point clouds in two ways: to estimate the odometry by matching consecutive point clouds, and to estimate the global pose by matching with an external 3D city model. We built a model for the error covariance of the lidar-based position estimates as a function of surface and edge feature points in the point cloud. For GPS measurements, we eliminated NLOS satellites using the 3D city model and used the remaining double-difference measurements between an onboard receiver and a reference receiver. To construct the covariance matrix for the double-difference measurements, we used the SNR values for individual pseudorange measurements.
Finally, we applied an UKF to integrate the measurements from lidar, GPS and an IMU. We experimentally demonstrated the improved positioning accuracy of our filter.
ACKNOWLEDGMENTS
The authors would like to sincerely thank Kalmanje Krishnakumar and his group at NASA Ames Research Center for supporting this work under the grant NNX17AC13G.
The material in this article was first presented at the ION GNSS+ 2017 conference in Portland, September 2017.
MANUFACTURERS
The lidar used aboard the UAV in these tests is a Velodyne VLP-16 Puck Lite. The GPS receiver is a u-blox LEA-6T with a Maxtena M1227HCT-A2-SMA antenna. The IMU is an Xsens Mti-30, and the onboard computer an AscTec Mastermind 3a.
The iBQR UAV was designed and assembled by the authors.
AKSHAY SHETTY received an M.S. degree in aerospace engineering from University of Illinois at Urbana-Champaign. He is also pursuing a Ph.D. at the same university.
GRACE XINGXIN GAO received a Ph.D. degree in electrical engineering from Stanford University. She is an assistant professor in the Aerospace Engineering Department at the University of Illinois at Urbana-Champaign.
To assist with Hurricane Harvey and Irma emergency response and damage assessments efforts, Remote GeoSystems is donating LineVision software licenses to official agency, volunteer and non-profit drone operators.
In addition to supporting a Texas A&M team responding to Harvey, LineVision is being pre-deployed to volunteers organized by Florida State University’s Emergency Management and Homeland Security Program to help with the Hurricane Irma search and rescue and damage assessment.
Any other volunteer teams, first responders and non-profit organizations providing essential response and recovery services are encouraged to complete the contact form to request free copies of LineVision software for disaster relief efforts.
LineVision lets emergency response teams easily map drone video of Hurricane Harvey damage assessments. (Image: Remote Geosystems)
The LineVision solution is a commercial software suite for UAV, airborne and terrestrial mobile inspection and survey projects requiring geo-referenced video playback, analysis, collaboration and reporting using standard Esri maps and data, Esri ArcMap and Google Earth GIS applications.
Using the software, anyone with a GPS-enabled video camera, drone or geospatial DVR that can geotag video in the proper format can immediately load their videos and photos to Esri ArcGIS and Google Earth along with compatible geospatial data.
As the video plays, a position marker moves along an aerial or terrestrial GPS track positioned on a map, continuously indicating where the current frames were recorded. Users may also geospatially “navigate” a video recording by simply clicking a single point along an aerial or terrestrial GPS track.
The video then automatically advances to that point in the recording so that users can visually interpret what was recorded at that specific place and time. If something of interest is detected in the video, users may also “snap” an image from the video, which is geotagged and saved for future analysis.
In addition to video, users can import photos and documents from disaster survey and assessment projects. All these imported data types can be saved in a Remote GeoSystems “geoProject” file for data portability, reporting and future analysis in other versions of LineVision desktop, cloud and server applications.
Help with Harvey
Remote GeoSystems was contacted by the Texas A&M Engineering Experiment Station Center for Robot-Assisted Search and Rescue (CRASAR), who was deployed with the Fort Bend County Office of Emergency Management.
All parties involved moved quickly, and within a few hours after being contacted, drone video data collection teams were using various versions of the company’s donated LineVision video and photo mapping software to map and view interactive UAV flight tracks with corresponding videos in Esri ArcGIS and Google Earth GIS software.
The software is being used to help visualize, distribute and share the data available from a record 119 UAS flights that CRASAR conducted over 11 days, including 61 flights on a single day.
“We first learned about Remote GeoSystems’ LineVision software for mapping geotagged video from drones about a year ago, and at that time even did a proof of concept demo for the USCG and first responders,” said Justin Adams, Air Operations Branch Director for Fort Bend County Manned/Unmanned Ops and CRASAR director of operations for Harvey. “Now with the Texas Gulf Coast facing a long and difficult assessment and recovery process and Hurricane Irma bearing down on Florida, it became clear now was the time to deploy this valuable UAV solution to operators and volunteers working the affected areas.
“I have been involved in manned and unmanned aviation for the better part of two decades and Remote Geo offers not only the simplest, but most complete solution for rapid geospatial aerial and ground-based disaster assessment and reporting in the industry.”
Key Features of LineVision
Play videos from single and multi-camera data collection platforms
“Click-on-Map” video navigation
Set a custom geo-fence around the moving position marker
Load Esri ArcGIS or Google Earth-compatible geospatial data files
Save video and photo work as geoProjects for simple project reporting, archive and search
L3 Technologies’ WESCAM division has received an order from Airbus Helicopters to provide 37 MX-15 electro-optical and infrared (EO/IR) imaging systems for installation on multiple fleets of H225M Caracal helicopters.
The systems will be installed in France before being delivered to two foreign governments for military deployment.
“This order expands L3’s international business base while creating a new market opportunity for our leading WESCAM products,” said Michael T. Strianese, L3 chairman and chief executive officer.
“L3 WESCAM is proud to have been chosen to supply its MX-15 systems, as it highlights our role as a trusted global supplier of advanced imaging technologies to the OEM marketplace,” added Mike Greenley, president of L3 WESCAM. “Additionally, it confirms that the highly specialized optics and leading technologies in L3’s systems continue to meet the needs of emerging mission portfolios, ranging from combative military to time-sensitive response and recovery operations.”
The first delivery of 19 units will support a variety of missions, including search and rescue, aeromedical evacuation and assistance and disaster relief.
The second delivery will provide a highly detailed, multispectral view of combat search and rescue, naval operations, medical evacuation and military transportation efforts to mission operators.
L3’s MX-15 can be configured with up to six imaging and laser payloads, each of which shares the highest level of stabilization. It incorporates a GPS receiver and antenna, with options available for a GPS time sync interface and GPS data interface.
Sensor options include a high-definition (HD) thermal imager, color low-light continuous zoom, daylight step zoom spotter, day/night spotter, laser rangefinder and a laser illuminator. L3’s MX-15 can be found on additional models of Airbus helicopters, including the H125 and UH-72A.
L3 WESCAM serves all segments of the airborne, land and maritime markets with advanced EO/IR imaging and targeting systems (MX-Series) and modular system solution kits (MatriX).
MX-Series turrets are operational across 74 countries and on more than 137 different types of platforms, and are supported by more than 14 globally deployed authorized service centers and a team of field service technicians who are available for dispatch 24/7 to anywhere in the world. L3 WESCAM is a unit of L3’s Sensor Systems business segment.
Galileo SAR is Europe’s contribution to the COSPAS-SARSAT network, a distress alert detection and information distribution system best known for detecting and locating emergency beacons activated by aircraft, ships and hikers.
By providing COSPAS-SARSAT with the coverage capacity of the Galileo constellation equipped with SAR transponders, Europe is helping to reduce the detection delay of a distress signal from up to several hours to 10 minutes.
A return link, a signal informing the person in distress that the signal has been received and localized, will be added to the system by the end of 2018.
Beacon Awareness Day
The Galileo SAR launch day, April 6, is Beacon Awareness Day in the United States. It’s also named 406 day. 406 stands for 4/06 — the date in U.S. format — and the 406-MHz frequency of the SARSAT beacons.
For Twitter and social media, special hashtags #406day, #406day17 and #savedbythebeacon already exist. The program has added the hashtag #getabeacon to complement it.
The following video about the program focuses on maritime operations, which account for 75 percent of the alerts.
Coming to the Rescue
With Galileo, the time to identify the location of a beacon signal is reduced from several hours to a few minutes. At sea, this makes SAR rescue operations easier thanks to a narrowed “search box,” since the vessel in distress has less time to drift.
On land, the quick acquisition of a precise position enables rescue teams to more quickly reach the operation zone and assist the victims.
In the air, Galileo contributes to fulfilling International Civil Aviation Organization (ICAO) requirements for implementing the next-generation emergency management system Global Aeronautical Distress and Safety System (GADSS). In particular, it enhances location of an airplane in distress, which will be mandatory on Jan. 1, 2021.
The Search And Rescue transponders on Galileo satellites can pick up signals emitted from any 406-MHz distress beacon anywhere in the service coverage area and transmit this information to the dedicated ground stations (MEOLUTs). The SAR/Galileo infrastructure is interoperable with GPS and GLONASS SAR transponders.
Once the beacon is located by the MEOLUTs, the location data is sent to the COSPAS-SARSAT mission control centre (MCC), which distributes it to the relevant rescue centres. The rescue centres, under the responsibility of national competent authorities and administrations, then coordinate the required rescue efforts.
Improving COSPAS-SARSAT
Galileo plays an important role in the Medium Earth Orbit Search And Rescue system of COSPAS-SARSAT (MEOSAR), and provides a ground segment coverage of 40 million square kilometers over Europe as a contribution to MEOSAR global coverage.
Thanks to the advanced European technology used, integration of Galileo into COSPAS-SARSAT improves the system by:
enabling faster detection and localization of distress signals anywhere in the service coverage area, reducing the delay between beacon activation and distress localization
making it easier to find the source of a signal by significantly boosting precision in comparison to the current situation
increasing availability and improving detection of signals in difficult terrain or weather conditions.
The Galileo Search And Rescue service is one of the three services launched in December 2016 with the Initial Services. The SAR service represented just 1 percent of total Galileo program costs, but should result in thousands of lives being saved, according to the head.
Microdrones collaborated last summer with the DLRG Horneburg/Altes Land e.V. (German Lifeguard Association) to simulate a mission to rescue a drowning swimmer, demonstrating the life-saving potential of UAVs.
Crowds watched from the banks of the Elbe River as a UAV flew to the person in distress and dropped a compact rescue device called RESTUBE, which automatically inflated. The swimmer was able to grab onto the RESTUBE and float until he could be reached by a lifeguard and brought to safety.
The UAV used in the rescue was the microdrones md4-1000. The quadcopter drone features specially developed motors, carbon fiber housing, efficient batteries, and an integrated GPS system that allow the UAV to fly and stay in position in strong winds over the water.
For the simulation, the md4-1000 was equipped with an imaging camera that streamed live to the specially trained lifeguard operating the drone, allowing him to easily see the precise location to drop the RESTUBE flotation device.
“An adult drowns in approximately 60 seconds and a child in only 30,” said Christopher Fuhrhop, founder and CEO of RESTUBE. “By combining UAVs and RESTUBE flotation devices, we arE able to buy the drowning person valuable time that could very well mean the difference between life and death.”
Other safety possibilities for quadcopters include locating people using thermal imaging cameras and collecting data on the condition of leaking and burst banks on hard-to-reach embankments.