This graphic represents the planned US Topo map production schedule for the next three- year revision cycle. The US Topo project repackages data from national GIS (geographic Information system) databases as traditional maps, primarily for the benefit of non-GIS users. Unlike traditional topographic maps, US Topo maps are mass-produced from secondary sources, on a programmed refresh cycle, using the best available data at the time of production.
With the release of new US Topo maps for Illinois and South Dakota, the USGS has completed the second, three-year cycle of revising and updating electronic US Topo quadrangles. Since the project’s inception in late 2009, the USGS has updated nearly every map in the conterminous U.S. twice.
“The USGS and NGP are proud of our history and legacy of topographic mapping in the U.S.,” said Mike Tischler, director of the USGS National Geospatial Program. “This latest cycle of US Topo production is a testament to the professionalism and capability of our staff and keeps that legacy alive. We’ve revised more than 110,000 maps in the last six years to include higher quality data across the country, and have been able to deliver those maps in an easy to use format to suit the diverse needs of our users. While reaching the end of the second cycle is an important achievement, we look forward to the next cycle of US Topo production, and investigating emerging technologies to better serve the needs of the country.”
In the past year the production staff of the NGP has updated, revised and uploaded 18,767 US Topo quads covering 18 states, most recently for Illinois and South Dakota. Its staff created more than 635 new 1:24,000-scale maps for Alaska as part of the Alaska Mapping Initiative. All of the new US Topo maps are digital and offered for free download, as the USGS no longer prints topographic maps using traditional printing technologies.
Other improvements to the state maps in the second cycle include the inclusion of National Scenic Trails, “crowdsourced” trail data from the International Mountain Bike Association, increased parcel land data (PLSS) and trail data from the U.S. Forest Service.
The complete new map sets for Illinois and South Dakota join Maine, Alabama, Arizona, Nebraska, Nevada, Missouri, California, Louisiana, Mississippi, New Hampshire, Vermont, Connecticut, Massachusetts, Rhode Island, Wyoming and Florida as revised states for fiscal year 2015.
The U.S. Geological Survey has made part of a huge national repository of geographically referenced USGS field photographs publicly available. USGS geographers developed a mapping portal called the Land Cover Trends Field Photo Map.
The entire collection contains more than 33,000 geo-referenced field photos with associated keywords describing the land-use and land-cover change processes taking place. Initially, nearly 13,000 photos from across the continental U.S. will be available to the public, yet the online collection will grow as more processed photos become available.
“This is a treasure trove of royalty and copyright-free photography collected using consistent procedures,” said Chris Soulard, project leader and USGS research geographer. “We envision that these photos will captivate general audiences and fulfill a myriad of scientific needs.”
Sharing these field photos provides a resource for the scientific community with potential to develop future research, such as future repeat photography projects or applications where photos may validate remote sensing classifications.
“The benefit of these photos being hosted by the USGS is equal access to all without copyright concerns and quality control,” said Jason Sherba, USGS geographer and project web developer.
The photography was collected as part the USGS National Land Cover Trends Project, a research effort that spanned over ten years and represented one of USGS’ largest cross-center research efforts. The project employed Landsat imagery between 1973-2000 to derive rates, causes and consequences of contemporary land-use and land-cover change. Photos were collected between 1999 and 2007.
The map viewer was developed to present photographs within a land use/land cover change mapping context, yet photos may also be found on the USGS Earth Explorer website.
The National Map Corps has updated the recognition badges that it awards for participation in its crowdsourcing mapping project. Volunteer “citizen scientists” who collect manmade structure data such as police stations, schools, hospitals and cemeteries, to provide more precise spatial data for the USGS web-based mapping products can earn points and virtual badges.
Due to continuous project growth and popularity, TNMCorps has added more badge levels and revised the current awards. More than 160,000 points have been edited or verified to date.
The project started in 2012, and since that time, the increasing number of volunteers have verified, edited, deleted and created more than 160,000 structures points. In appreciation for the efforts of these “free” mappers, those who reach certain milestones are celebrated in the form of virtual badges.
The newly designed badges showcase the same classic surveying tools and aerial data collection methods, but have been colorfully updated and highlight a variety of amazing landscapes across the United States.
A second set of badges based on aerial data collection was introduced a year ago as some extra-energetic volunteers quickly surpassed the first set of badge levels. Currently, 11 possible badges can be earned beginning with the Order of the Surveyor’s Chain (25 points) and ending with the Squadron of Biplane Spectators (6000 + points).
As volunteer map editors attain each level, a congratulatory email is sent to the awardee with a description of the badge and encouragement to achieve the next level. With permission, volunteer accomplishments are highlighted on TNMCorps Recognition page, and The National Map Twitter (#TNMCorps).
The U.S. Geological Survey (USGS) has contracted with Woolpert to evaluate new lidar (light detection and ranging) technologies to assess the suitability to support the 3D Elevation Program (3DEP).
This use of the single photon and Geiger mode lidar for this evaluation is new to the commercial market, according to Woolpert Project Director John Gerhard.
“This technology provides the ability to fly at higher altitudes while acquiring data at an increased point density,” Gerhard said. “The USGS has asked us to provide an evaluation of this sensor technology in support of 3DEP.”
The USGS is developing the 3DEP initiative to respond to the growing need for high-quality topographic data nationwide, to address issues that include flood-risk management, precision agriculture, natural resource management, infrastructure management and hazard mitigation.
Woolpert — a national architecture, engineering and geospatial firm — will then evaluate the data, conduct an accuracy analysis, develop final data products and provide a comprehensive report to the USGS by the end of the year.
Esri has published an interactive Wildfire Public Information Map and a 2015 California Wildfire Activity Map.
Wildfire Public Information Map
The Wildfire Public Information Map provides continuously updated information about wildfires and their perimeters from the U.S. Geological Survey and other agencies. It provides live weather warnings and wind information from the National Oceanic and Atmospheric Administration, as well as live weather radar from AccuWeather. A local perspective on events is available by turning on geotagged social media from Twitter, YouTube and Flickr on the Layers tab.
2015 California Wildfire Activity
This story map provides a detailed look at 15 active fires throughout California. As you scroll through the map, you can view fire perimeters and hot spots for each active fire, and get up-to-date statistics about each blaze, including total acreage, percent containment and damage caused.
The European Space Agency (ESA) on June 23 successfully launched its Sentinel-2A satellite, the second satellite to be launched in Europe’s Copernicus environment monitoring program. Above is a video of the Sentinel 2A lift-off.
“We are very pleased to have such a talented new player join the team in watching Earth from space,” said Suzette Kimball, acting U.S. Geological Survey (USGS) director. “The aptly named Sentinel mission will help sharpen our focus on changes in Earth systems and contribute further insight to a great many global challenges at international to local scales, including food security, forest and wildlife conservation, and disaster response.”
NASA has published a comparison of Sentinel-2A and Landsat bandwidths.
Sentinel-2 imagery is expected to supply valuable parallels and counterparts to Landsat imagery provided by the United States. Before Sentinel-2A launched, USGS and ESA staff worked together at length to ensure that Sentinel-2 data would be as compatible as possible with Landsat data.
First launched by NASA in 1972, the Landsat series of satellites has produced the longest, continuous record of Earth’s land surface as seen from space. Landsat images have been used by scientists and resource managers to monitor water quality, glacier recession, coral reef health, land use change, deforestation rates, and population growth.
Landsat is a joint effort of USGS and NASA. NASA develops remote-sensing instruments and spacecraft, launches the satellites, and validates their performance. USGS develops the associated ground systems, then takes ownership and operates the satellites (since 2000), as well as managing data reception, archiving, and distribution. Landsat data were made available to all users free of charge under a policy change by the U.S. Department of the Interior and USGS in late 2008.
Sentinel-2A in the gantry before launch.
“We are also pleased that a free and open data policy has been adopted for users of Sentinel data,” Kimball added. “Free, open access to Landsat and Sentinel-2 data together will create remarkable economic and scientific benefits for people around the globe.”
Designed as a two-satellite constellation — Sentinel-2A and -2B — the Sentinel-2 mission carries an innovative wide swath high-resolution multispectral imager with 13 spectral bands. However, it will not fully duplicate the Landsat data stream, which includes thermal measurements. Sentinel-1A, a satellite with radar-based instruments, was launched April 3, 2014.
Once it is fully operational following several months of on-orbit testing, Sentinel-2A alone could provide 10-day repeat coverage of Earth’s land areas. With Sentinel-2A data added to the eight-day coverage from Landsat 7/8 combined, users can look forward to better-than-weekly coverage at moderate resolution. Repeat coverage capabilities will further increase with the planned launch of a second Sentinel-2 satellite (Sentinel-2B) next year.
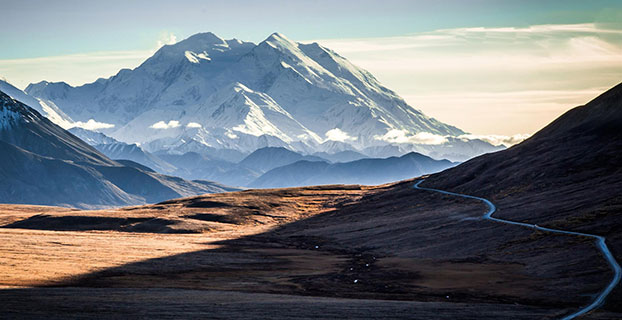
At 20, 320 feet, Mount McKinley is North America’s highest peak. (Photo courtesy of Todd Paris, UAF).
A new GPS survey of Mount McKinley, the highest point in North America, will update the commonly accepted elevation of McKinley’s peak, 20,320 feet. The last survey was completed in 1953.
The USGS, along with NOAA’s National Geodetic Survey (NGS) and the University of Alaska Fairbanks (UAF), are supporting a GPS survey of the Mount McKinley apex. Surveying technology and processes have improved greatly since the last survey and the ability to establish a much more accurate height now exists, the USGS said.
The Mount McKinley survey team, and their equipment, are expected to face temperatures well below zero, high winds and frequent snow. Current forecast, courtesy of NOAA. (Photo courtesy of Todd Paris, UAF).
An experienced team of four climbers, one from UAF and three from CompassData, will start the precarious trek to the summit with the needed scientific instruments in tow, in the middle of June. They plan to return on or before July 7 and begin work with the University of Alaska Fairbanks and NGS processing the data to arrive at the new summit elevation.
With the acquisition of new elevation (ifsar) data in Alaska as part of the 3D Elevation Program, there have been inquiries about the height of the summit. The survey party is being led by CompassData, a subcontractor for Dewberry on a task awarded under the USGS’ Geospatial Products and Services Contract (GPSC).
Using modern GPS survey equipment and techniques, along with better gravity data to improve the geoid model in Alaska, the partners will be able to report the summit elevation with a much higher level of confidence than has been possible in the past.
According to CompassData, the survey equipment includes two Trimble R10 antennas and one Trimble Net-R9 with a Zephyr-2 antenna. Also being taken up the mountain is a 10-meter specialized glacier avalanche probe and a Ground Penetrating Radar (GPR), courtesy of the University of Alaska Fairbanks.
It is anticipated the newly surveyed elevation will be published by the National Geodetic Survey in late August.
Climbing Mount McKinley, North America’s highest peak, is a daunting task for even the most experienced mountaineers at Denali National Park in Alaska. (Photo courtesy of National Geographic).
Screenshot of a mobile mapping service integrating USGS topographic data; hiking and biking trails south of Golden, Colo. Imagery with road and contour data overlaid via AlpineQuest.
Are you a developer, firm, or organization using mobile or web applications to enable your users? The United States Geological Survey (USGS) has publicly available geospatial services and data to help your application development and enhancement.
The USGS’ National Geospatial Technical Operations Center (NGTOC) will be hosting a 30-minute webinar on “Using The National Map services to enable your web and mobile mapping efforts” on June 16 at 9 a.m. MT.
Screenshot of a mobile mapping service integrating USGS topographic data; hiking and biking trails south of Golden, Colo. Trail data in KML/GPX overlaid via AlpineQuest.
This webinar will feature a brief overview of services, data and products that are publicly available, a quick overview on how AlpineQuest, a leading private firm, is leveraging this public data to benefit their users, and a Question & Answer session with a USGS developer to help you get the most out of the national geospatial services.
“This is an opportunity from NGTOC to bring developers and users together for some demonstrations and starting some dialogue,” said Brian Fox, the NGTOC Systems Development Branch Chief. “The webinar format allows us to improve awareness of USGS geospatial services and develop a better understanding of what users and developers need to make our data and services more available and usable.”
To access the webinar, you’ll need to activate Cisco WebEx and call into the conference number (toll free) 855-547-8255 and use the security code: 98212385. The webinar will display through WebEx.
Use this system diagnosis to ensure that you have the appropriate players installed for this WebEx enabled webinar.
The session will be recorded and closed caption option is available.
Click here to find out more about this and other NGOC webinar conferences.
The U.S. Geological Survey (USGS) has begun production of higher level (more highly processed) Landsat data products to help advance land surface change studies. One such product is Landsat surface-reflectance data. Landsat satellite data have been produced, archived, and distributed by the U.S. Geological Survey since 1972.
Surface reflectance data products approximate what a sensor held just above the Earth’s surface would measure, if conditions were ideal without any intervening artifacts (interference or changing conditions) that may come from the Earth’s atmosphere, different levels of illumination, and the changing geometry of the view by the sensor from hundreds of miles above the Earth. The precise removal of atmospheric artifacts increases the consistency and comparability between images of the Earth’s surface taken at different times of the year and different times of the day.
Surface reflectance and other high-level data products can be requested through the USGS Earth Resources Observation and Science (EROS) Center by accessing the EROS Science Processing Architecture (ESPA) interface. Surface reflectance data are also available using the USGS EarthExplorer; select “Landsat CDR” under the tab for datasets. More information on Landsat surface reflectance data is available at the USGS Landsat website and in an updated USGS Fact Sheet.
Data users in many different fields depend on basic Earth observation information from the USGS to conduct broad investigations of historical land surface change that cross large regions of the globe and span many years. Accordingly, this community of users requires consistently calibrated radiometric data that are processed to the highest standards.
Sixty seconds may not sound like much, but if given advance warning of an earthquake, people could take cover, trains could stop, and oil rigs could be shut down before the shaking hits.
The earthquake early warning app QuakeAlert, by Early Warning Labs, aims to provide that extra time. The app, with new technology developed in partnership the United States Geological Survey (USGS), will be tested by the USGS, the California Institute of Technology and other university researchers.
QuakeAlert is designed to alert users with a countdown to when shaking will strike their exact location, and tell the user how severe the intensity is expected in their location. The app simultaneously delivers important safety instructions to the user on how to respond if indoors, outside or in a moving vehicle. QuakeAlert will be provided to users free of charge.
The QuakeAlert app uses USGS seismic sensor network data, an Esri GIS backend and the Microsoft Azure cloud to deliver earthquake early warnings. The app is currently in private beta testing with university researchers at CalTech and USGS scientists, and will be available to the public for free once the USGS receives full funding of its early warning program and approves the technology for the public.
Early Warning Labs (EWL) is an Earthquake Early Warning technology developer and integrator in Santa Monica, Calif., and an official research and development partner with the USGS. Early Warning Labs is collaborating with university partners including Caltech, Berkeley and the University of Washington, as well as Esri.
Map of sediment thickness in state waters offshore of San Francisco. About 21,000 years ago, sea level in this area was about 125 m lower and the shelf offshore San Francisco was an emergent land surface. At that time, the Sacramento River drained through the Golden Gate and eroded a valley (“the San Francisco paleovalley”) that was filled with sediment during subsequent sea-level rise. The thickest young sediment in the region occurs in the “San Andreas graben,” a basin that formed by crustal down dropping along the offshore section of the San Andreas fault. There is very little sediment on the shelf offshore of southern Ocean Beach (a pattern that extends south to Pescadero), a factor important for understanding and forecasting coastal erosion in this area.
Three new sets of maps detail the offshore bathymetry, habitats, geology and submarine environment of the seafloor off the coast of San Francisco, Drakes Bay and Tomales Point.
Critical for resource managers, the maps are part of the California Seafloor and Coastal Mapping Program, a series of maps published by the U.S. Geological Survey with support from the California Ocean Protection Council, NOAA and 15 other state and federal partners. The maps are designed to be used by a large stakeholder community and the public to manage and understand California’s vast and valuable marine resources.
“OPC is proud to be a partner in this interagency effort,” said California’s Secretary for Natural Resources and OPC Chair John Laird. “These maps are critical to the state’s innovative approach to coastal resource management. USGS’s products form the foundation for assessing the performance of our Marine Protected Area network and preparing for climate change impacts such as sea-level rise.”
“NOAA is pleased to be partnering in this integrated ocean and coastal mapping project. By working with partners from across federal, state, academic, and private sectors, we are able to combine data resources and maximize our efficiency in applying a ‘map once, use many times’ approach that benefits all,” said Rear Admiral Gerd F. Glang, director NOAA’s office of coast survey.
The program was initiated seven years ago with the goal of comprehensively surveying and mapping all of California’s state waters. The vision was tremendously ambitious — comparable mapping on this scale has not been attempted anywhere else in the world, the USGS said. Each of the three publications includes 10 map sheets, a pamphlet and a digital data catalog.
The maps and mapping data have a large range of applications. They provide:
a foundation for assessing marine protected areas and habitats;
baselines for monitoring coastal change and sea-level-rise impacts;
critical input data for modeling and mitigation of coastal flooding;
a framework for understanding coastal erosion and developing regional sediment management plans;
contributions to earthquake and tsunami hazard assessments;
more accurate maps for safer navigation;
and essential information for planning, siting, or removing offshore infrastructure.
The new “Offshore of San Francisco” maps document the complex submarine environments along the inlet to San Francisco Bay formed by strong tidal currents, including spectacular sand waves, a deep scour pool beneath the Golden Gate, and the dynamic offshore San Francisco mouth bar and “Potato Patch” shoal.
Sediment distribution maps reveal only a thin sediment cover offshore of the Ocean Beach (San Francisco) erosional hotspot (a pattern extending south to San Gregorio), indicating that today’s present coastal erosion will be a continuing problem, likely to be exacerbated by continuing sea-level rise.
Geologic maps incorporating subsurface data document the location and geometry of the San Andreas, San Gregorio and Point Reyes fault systems, and show how their interactions led to uplift of Point Reyes and development of a deep sediment-filled basin.
The Drakes Bay and Vicinity, and Offshore of Tomales Point maps reveal the diverse and complex range of seafloor habitats typical of the California coast, ranging from the rugged granitic bedrock along the high-energy west coast of Point Reyes, to smooth sand and mud in the more protected Drakes Bay environment that includes the Point Reyes State Marine Reserve.
“There is a ‘WOW!’ factor to the new high-resolution datasets and maps,” said Sam Johnson, the USGS project lead. “They’re allowing scientists to pose new questions and are having a significant role in stimulating research. We’re also seeing a positive impact on public education and awareness.”
To date, 12 map sets and catalogs have been published. Ten additional map sets are now being formatted for publication, which will complete coverage in the Santa Barbara Channel (Oxnard to Gaviota) and from Marina northward to beyond the Russian River.
The maps are created through the collection, integration, interpretation, and visualization of swath sonar data, acoustic backscatter, seafloor video, seafloor photography, high-resolution seismic-reflection profiles, and bottom-sediment sampling data.
Map of offshore sediment thickness in State Waters between Drakes Bay and Salt Point, north of the Russian River. The thickest sediment in the region occurs offshore of the Russian River, and in a large bar along the south flank of Point Reyes Head. There is a relative lack of offshore sediment between Bodega Head and Point Reyes, where the shelf is characterized by abundant rocky habitat and much of the coastal sediment is trapped in large onshore dune fields.Perspective view looking to the southeast over entrance to San Francisco Bay. Golden Gate Bridge is to left (east) of this view. The large sand-wave field lies within Golden Gate channel, and formed from sediment transported out of the Bay by strong tidal currents. Profile A–A’ shows that the larger bedforms can reach heights of over 7 m and are asymmetrical with steeper sides towards the open coast. A smaller field of sand waves to south near Baker Beach shows the opposite symmetry (steep sides toward the Bay) indicating that the strongest tidal currents in that local area are directed eastward.“Seafloor character” map of the San Francisco Region. This is a type of habitat map that classifies the seafloor based on surface hardness and roughness. Such maps are used in various types of ecosystem assessments and seafloor zoning, such as delineation or monitoring of marine protected areas.Bathymetry bounding Tomales Point. Rugged and massive granite outcrops extend offshore from Tomales Point to water depths of as much as 60 meters. Offshore sedimentary rock outcrops (lower left part of image) form distinctive “ribs” on the seafloor and have a notably different appearance. There is minimal sediment on this part of the California shelf because the watersheds draining the west flank of Tomales Point are very small and because Tomales Point and Tomales Bay block sediment transport from the north. Rocky-shelf outcrops and rubble are excellent habitats for rockfish and lingcod, recreationally and commercially important species. Tomales Bay, approximately 20-km long and 1- to 2-km wide, formed along a submerged portion of the San Andreas Fault (very shallow water depths preclude collection of high-resolution bathymetric data at the mouth of Tomales Bay).