We now definitively declare “curtain up!” on the second act of the human and technological drama, Interoperable Global Navigation Satellite Systems, by many authors, directors, and actors, upon the global stage. It happened on August 2 with removal of the message 0 (“Do Not Use in aviation”), by the European Satellite Services Provider, from the European Geostationary Navigation Overlay Service (EGNOS) signal. It enables EGNOS use for en-route and lateral guidance approaches.
The first act of our drama, of course, saw the U.S. GPS achieve operational capability, not to mention enthusiastic worldwide reception and application. We might have declared the second act open upon GLONASS operability, intermittent though that has been — but GLONASS is not (yet) interoperable with GPS. We might have marked its beginning in 2003, when the European Council of Transport Ministers approved the Galileo program, or in 2006, when Galileo launched its first satellite and broadcast its first signal in space. But no useable navigation message has yet emanated.
The EGNOS signal is essentially a corrected GPS signal. Still, its certification for use in aviation embodies an international, interoperable navigation signal from space.
(Legalistic note: “After an operational period of three months [following August 2], the EC will declare the Safety of life (SoL) service available to the aviation community, enabling the publication of precision approach procedures with vertical and lateral navigation guidance (APV) based on EGNOS. At that time, European air navigation service providers will be in position to implement satellite-based precision approaches . . . .)
Chairman Mao said “The march of 10,000 li begins with a single step.” We have taken more than a few steps, though still at the beginning of our journey. Curtain’s up, vistas are wide. Let’s keep moving.
A Close Look at GPS SVN62 Triple-Frequency Signal Combinations Finds Carrier-Phase Variations on the New L5
By Oliver Montenbruck, André Hauschild (DLR/German Space Operations Center), Peter Steigenberger (Technische Universität München), and Richard B. Langley (University of New Brunswick)
The recently launched Block IIF satellite (SVN62/PRN25) is the first of a new generation of GPS satellites designed to transmit ranging signals for civil users on three frequencies: the C/A-code on L1 at 1575.42 MHz, the L2C-code on L2 at 1227.60 MHz, and the I5/IQ codes on L5 at 1176.45 MHz. Unlike L2, the L5 signal is located inside the protected Aeronautical Radionavigation Services (ARNS) band, which makes it specifically useful for safety critical aviation applications. In combination with the legacy L1 signal, civil aviation users can now perform ionospheric corrections without referring to the L2C signal. Compared to L2C, the new L5 signal offers a much higher chipping rate (the same as the encrypted P-code signal) of 10.23 MHz, which promises a lower ranging noise and better multipath resistance. L5 signals have already been transmitted for some time by the geostationary satellites of the United States’ Wide Area Augmentation System (WAAS) and are now about to become an integral part of the GPS constellation.
Following a short test transmission on June 17, 2010, the L5 signal was continuously activated on the morning of June 28. According to GPS officials, the checkout of the satellite is proceeding nominally and all signals have been found to fully comply with specifications. This will allow the satellite to be set healthy as soon as all commissioning tasks have been completed.
Scientists have long discussed the potential of new signals for multi-frequency, multi-GNSS applications, and expresed a great interest in signal combinations, particularly those of carrier-phase measurements, involving all three frequencies simultaneously. The use of triple-frequency combinations has, for example, been demonstrated to be of great interest for ambiguity resolution in precise carrier-phase-based positioning, for receiver autonomous integrity monitoring, and for ionospheric research (see the articles in Further Reading).
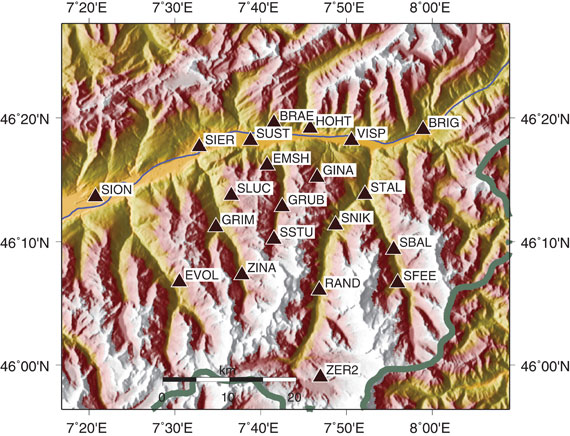
In consideration of the multitude of proposed applications for triple-frequency combinations, we took a close look at the quality of the new GPS L5 carrier-phase signal. For this purpose, we made use of measurements from the COoperative Network for GIOVE Observation (CONGO), jointly established by the German Federal Agency for Cartography and Geodesy (BKG) and the German Aerospace Center (DLR). CONGO is the first network of multi-constellation, multi-frequency GNSS receivers offering worldwide tracking of the SVN62 space vehicle on all frequencies (see Table 1).
Table 1. Subset of CONGO stations used for triple-frequency tracking of the new Block IIF satellite.
As suggested by Andrew Simsky (see Further Reading), the availability of carrier-phase measurements on three frequencies offers a particularly simple way to assess carrier-phase quality and multipath effects. By forming a linear combination
(1)
of the L1, L2, and L5 carrier-phase ranges with the additional conditions ,
a geometry- and ionosphere-free measurement is obtained, which reflects a weighted sum of the carrier-phase multipath and measurement noise on the individual frequencies. Here λ i with i = 1, 2, and 5, denotes the wavelength of the L1, L2, and L5 signals, respectively. Since the above conditions determine the factors α, β, and γ only up to an arbitrary scaling factor, we furthermore impose the normalizing conditions.
The latter condition ensures that the noise of the tri-carrier combination will match that of the individual carrier phases if the measurement noise is equal on all frequencies. As a result, we obtain the coefficients
with .
Introducing the carrier wavelengths of the L1, L2, and L5 signals, the coefficients attain the values (2)
It can be recognized that the tri-carrier combination is dominated by the L2 and L5 signals due to the proximity of their respective frequencies. Noise and multipath errors of L2 and L5 measurements are thus most prominently seen in the resulting combination, whereas any L1 phase errors are strongly attenuated.
A long pass of L1, L2, and L5 code and phase measurements from the new Block IIF satellite was recorded by the O’Higgins station of the CONGO network shortly after the activation of the L5 signal generator on June 28. The SVN62 satellite was tracked for more than 6 hours and achieved a peak elevation angle of more than 75° on this date.
Figure 1 shows the resulting multipath combination computed from carrier-phase measurements of L1 C/A-code tracking, semi-codeless L2 P(Y) tracking (rather than L2C), and L5 I/Q tracking. The data have been leveled to a zero mean over the entire pass to remove the impact of the unknown carrier-phase ambiguities. Except at low elevation angles, near rise and set of the satellite where signal strengths are low, the tri-carrier combination shows a very low noise level that is consistent with the expected carrier-phase noise on all three frequencies. However, a pronounced long-term variation with a peak-to-peak amplitude of almost 20 centimeters may be recognized, which certainly comes as a big surprise and cannot be explained by local multipath. Frequency-dependent differences of the effective phase centers of the receiving or transmitting antennas can likewise be excluded, since these would result in a purely elevation-angle-dependent variation.
FIGURE 1. Triple-frequency (M=0.142·L1-0.767·L2+0.626·L5) carrier-phase multipath combination for SVN62/PRN25 tracking from the OHIX0 station on June 28.
Looking at the entire set of measurements from all available CONGO stations, we could rapidly recognize that the variation of the tri-carrier combination with time is essentially the same for all stations with a common visibility of the SVN62 space vehicle, irrespective of the employed receiver and antenna. This suggests the presence of time-varying inter-frequency biases in the L1, L2, and L5 carriers transmitted by SVN62.
Thanks to the global distribution of the CONGO stations, the SVN62 space vehicle is always tracked by one or more stations, which enables a continuous monitoring of the L1/L2/L5 carrier-phase consistency. By adjusting the unknown offset of the tri-carrier combination for individual tracking arcs in such a way as to obtain a best match of consecutive and overlapping arcs, the variation can be traced over multiple days as shown in Figure 2. The graph shows a distinct orbital (that is, 12-hour) periodicity with a superimposed twice-per-revolution harmonic. In addition, a pronounced drift can be recognized for up to one day after activation of the L5 signal generator. Both observations suggest a temperature-dependent line bias in one or more carriers as a likely cause of the observed variation in the tri-carrier combination. (A line bias is a circuitry delay common in all observed satellites and is usually absorbed in the estimated clock offset.) However, an independent analysis of SVN62 temperature data from the onboard telemetry will be required to confirm the validity of this assumption. The space vehicle is in a deep eclipse orbit right now and therefore experiences substantial changes in its thermal conditions. However, the extreme points of the carrier-phase variation in Figure 2 are slightly shifted with respect to the local space vehicle noon (at 01:30 and 13:30 UTC) and the eclipse intervals (07:00–08:00 and 19:00–20:00 UTC).
FIGURE 2. Triple-frequency carrier-phase combination (M=0.142·L1-0.767·L2+0.626·L5) for the first five days of L5 activation on SVN62. The curve has arbitrarily been shifted to obtain a near-zero mean during the final days of the entire arc.
While the tri-carrier combination provides a very sensitive measurement for the analysis of differential delays between the individual carriers, it does not allow us to uniquely attribute the observed variations to one of the three signals. We therefore made use of code measurements (pseudoranges) to further investigate the consistency of specific sets of measurements. Since the observed variation of the tri-carrier combination exhibits an amplitude comparable to the noise level of the code measurements, a suitably chosen code-carrier combination can indeed help to identify which signal or signals are affected by line-bias variations. To this end, we consider a generalized form
of the well-known code-multipath combination, in which we difference the code measurement Pi at frequency i with an ionosphere-corrected combination of carrier-phase ranges Lj and Lk at frequencies j and k. In so doing, we remove geometric contributions along with clock and atmospheric variations, leaving primarily code multipath, receiver noise, and any signal perturbation that is not coherent on the involved frequencies. In the traditional case of dual-frequency tracking, the frequency of one of the involved carrier-phase measurements is necessarily identical to that of the code measurements. With triple-frequency tracking, in contrast, we are free to consider a larger variety of combinations. For the analysis of the SVN62 signals, we have specifically evaluated the L5 code-multipath combination using (a) the L5 and L1 carrier phases
and (b) the L2 and L1 carrier-phase measurements
The results shown in FIGURE 3 reveal a dramatic difference, which clearly hints at the L5 carrier as the main source of the observed carrier-phase variations.
FIGURE 3. L5 code-multipath combination formed with L1/L5 carrier-phase measurements (top) and with L1/L2 carrier-phase measurements (bottom). The figure is based on SVN62 tracking from the O’Higgins station and covers the same arc as considered in FIGURE 1.
In the first case, a variation close to that of Figure 1 is obtained, albeit with a 5–6 times larger amplitude that reflects the different weighting of the L5 carrier phase in the corresponding measurement combinations. A good consistency, in contrast, is obtained for the L5 code measurements when differenced against the ionosphere-corrected combination of L1 and L2 carrier-phase measurements.
Overall, we may conclude that the L5 carrier of the SVN62 space vehicle exhibits quasi-periodic line-bias variations with an amplitude of about 10 centimeters in relation to the L1 and L2 carriers. The L5 code measurements, in contrast, appear to be consistent with both the code and phase measurements on L1 and L2 at the respective noise levels. Further observations at a later time will be required to see whether the observed amplitude of the L5 phase variation is specific to the current eclipse orbit and whether it will possibly become lower when a higher angle of the Sun with respect to the orbital plane (the so-called beta-angle) is achieved.
What are the possible consequences of the L5 phase-bias variations for users of the new L5 signal? Evidently, new positioning services building on the L5 code measurements (and possible combinations) will not at all be affected! Even in the case of carrier-phase smoothing, the smoothing time scale will be much shorter than the periodicity of the carrier-phase bias variation. The L5 code measurement quality itself is well within the system specification and no concerns exist that would prevent the satellite from soon being declared healthy.
With respect to carrier-phase-based positioning applications, it is important to note that the L5 line bias acts like an additional frequency-specific satellite-clock offset. This has, for example, been confirmed in preliminary tests of SVN62 orbit determination conducted by the Technische Universität München. Orbit solutions using L1 and L5 measurements from the CONGO network differed by typically 15 centimeters (3D root-mean-square error) from reference orbits obtained by the Center for Orbit Determination in Europe analysis center using the IGS L1/L2 receiver network. At the same time, however, the L1/L5-based clock solutions showed a periodic offset from the L1/L2-based values that reflects the same variations as the tri-carrier combination discussed above.
As a common error for all receivers, the L5 line bias fully cancels in differential processing. Care must be taken though, that satellite clock offsets derived from L1/L2 carrier-phase observations cannot be employed for precise point positioning using L1/L5 measurements without explicit consideration of the inter-frequency carrier-phase bias. Likewise, efforts to correct second order ionospheric effects through the use of triple-frequency measurements are likely to suffer from an imperfect knowledge of the L5 bias and its variation with time.
Whereas some of the proposed ideas for triple-frequency processing may be difficult to materialize at present, a better characterization of the SVN62 L5 signal will certainly help to exploit the available benefits of the new signal and to establish refined processing schemes for scientific and other demanding applications. A continued monitoring of the L5 line bias and its variation with time is therefore deemed necessary and should be supported by a large number of suitably equipped tri-band GNSS monitoring stations.
— Oliver Montenbruck, Andre Hauschild (DLR/German Space Operations Center), Peter Steigenberger (Technische Universität München)
Richard B. Langley (University of New Brunswick)
Acknowledgment
The authors are grateful to Tom Stansell and Col. David Goldstein from the GPS Wing for early discussions and their independent assessment and interpretation of the SVN62 triple-frequency carrier-phase data.
Equipment
The CONGO network makes use of JavadTriumph Delta-G2T/G3TH and LeicaGRX1200+GNSS GNSS receivers for tracking GPS signals on the L1, L2, and L5 frequencies. The stations are equipped with TrimbleZephyr Geodetic II or LeicaAX1203+GNSS and AR25R3 antennas.
Further Reading
“The WAAS L5 Signal: An Assessment of Its Behavior and Potential End Use,” by H. Rho and R.B. Langley in GPS World, Vol. 20, No. 5, May 2009, pp. 42–50.
“Using Multi-Frequency for GPS Positioning and Receiver Autonomous Integrity Monitoring” by Y.-H. Tsai, F.-R. Chang, W.-C. Yang, and C.-L. Ma in Proceedings of the 2004 IEEE International Conference on Control Applications, Taipei, Taiwan, September 2–4, 2004, pp. 205–210.
“Triple Frequency Ambiguity Resolution Using GPS/Galileo” by O. Julien, M.E. Cannon, P. Alves, and G. Lachapelle in European Journal of Navigation, Vol. 2, No. 2, May 2004, pp. 51–57.
“Three’s the Charm — Triple Frequency Combinations in Future GNSS” by A. Simsky in Inside GNSS, Vol. 1, No. 5, July/August 2006, pp. 38–41.
“Total Electron Content Monitoring Using Triple Frequency GNSS Data: A Three-Step Approach” by J. Spits and R. Warnant in Journal of Atmospheric and Solar-Terrestrial Physics, Vo. 70, No. 15, December 2008, pp. 1885–1893, doi:10.1016/j.jastp.2008.03.007.
It has long been accepted that we may reasonably expect any new technical device to have some growing pains. If you examine the history of the space program you will discover evidence of this. In the case of the first GPS IIF vehicle on orbit we do not have a 12,552-mile screwdriver. but we do have dedicated software and systems engineers at Boeing and in the U.S. Air Force that will solve the issues that crop up and eventually present the world with a stable PNT platform.
I bring this to your attention because researchers at the German Aerospace Center (DLR) say they have found a small variance in the L5 signal on IIF-1. The signal variation results in no more than a 5-centimeter error with a predictable periodicity of about six hours. While observing the IIF, DLR also reports that the signal appears to be “hot” or stronger than anticipated or advertised by about 1/2 db.
Initial reaction from the GPS Wing and Air Force experts at Schriever AFB is that the signal fluctuation appears to be temperature-related, as the periodicity correlates directly to the temperature extremes the satellite is experiencing at this time of year in its MEO orbit. It is being investigated as a matter of course during the standard checkout of the satellite, which will continue for about another four weeks according to the original checkout schedule.
The GPS Wing is confident that all the IIF signal specifications will be met by the time the satellite is set healthy in about a month’s time and they will be able to move forward with the IIF launch schedule as planned. Obviously this could be perturbated by having to make corrections or adjustments to the satellites still to be launched, but this is normal procedure, and some leeway to correct anomalies is built into the schedule for the first few launches of any new satellite system.
Privately, one official commented, “It turns out that no one has ever made this measurement before. The Galileo SVs can only broadcast from 2 transmitters at a time so they are combining two E5 signals generated from the same transmitter. Furthermore, their data was collected during max Beta meaning when they weren’t in eclipse (less thermal variance).”
The press release from the GPS Wing reads as follows.
SMC Update. July 19 — “Officials from the Air Force Space Command, Space and Missile Systems Center’s Global Positioning Systems Wing announced the “on-orbit checkout” of the first IIF satellite is progressing as scheduled. “Nearing the half way point of its 90-day checkout period, GPS IIF SV-1 also known as SVN 62/PRN 25, is currently broadcasting the same L1 and L2 signals as previous GPS satellites and the new safety of life signal known as L5. All three signals being broadcast from SVN 62 are set unhealthy while experts monitor the quality and characteristics of the signals and the performance of the satellite.
“During the initial phase of testing, [DLR] combined L1, L2, and L5 signals in a technique used to characterize a number of known and modeled error sources from the signals. This three-frequency combining technique helps isolate “other” sources of location error, such as multi-path (when more than one path exists for signals to travel before reception), receiver errors, satellite induced errors and unmodeled phenomena. The L1, L2 and L5 signals from SVN-62 are operating nominally but DLR noticed higher residual errors than expected compared to previous somewhat similar measurements from Galileo’s GIOVE-A R&D satellite.
“The GPS Wing at Los Angeles Air Force Base has corroborated DLR’s results and is investigating root cause to share a deeper understanding of this new signal’s behavior with the user community. The causes of the phase variation are still being investigated, but they are likely the result of sensitivities to changes in the satellite’s thermal environment. SVN 62/PRN 25 is currently experiencing periods of both sunlight and total darkness (known as eclipse season) as the satellite orbits the Earth and traverses through Earth’s shadow. Tests to characterize the satellite’s performance during continuous sunlight exposure will continue after the current eclipse season ends later this month.
“Typical GPS receivers using stand-alone (single signal – L1, L2 or L5) or combinations of L1, L2 and L5 signals as part of their navigation solution will not be affected by this small phenomenon. The Air Force is committed to maintaining excellence in GPS navigation and timing services and to working with the user community to best use and exploit the new modernized GPS signals.
“When tests of this new generation of GPS satellites have been completed and Air Force leadership gives approval, the satellite signals will be set healthy and will operate as specified in the Interface Control Documents (ICDs).”
The field at Commonwealth Stadium in Edmonton, Alberta, recently received a CDN $2 million renovation. The old natural-grass field had become expensive to maintain properly, and the Grey Cup game, Canada’s Super Bowl, will be played at Commonwealth Stadium this year. The stage needed to be re-set.
Renovation required total removal of the existing medium and subgrade materials to a 1.2-meter depth. Wilco Contractors Northwest replaced the subgrade to a planarity or flatness tolerance of 3 millimeters over a 3-meter length. To achieve this precision, Wilco used a machine automation system on a Volvo G-960 motor grader fitted with a GPS receiver, and base station nearby. A second grader carried a robotic total station.
“We probably have a quarter-million dollars invested in this,” said Wilco President Art Maat. “The machine-control equipment pays for itself on an annual basis. It enables us to construct projects to tolerances that other contractors cannot match, even though they have the same big iron capabilities we do.”
Work began with removal of existing soil mixes, drainage rock, and subgrade clay. A bulldozer and the two motorgraders graded the subgrade to a 0.5 percent slope on both sides of the field’s center spine. The work included the D-shaped zone behind each goal post, created by a running track encircling the field. In all areas, the slope must be constant. “The problem is, how do you grade that half-circle?” said Maat. “Grader operators and surveyors want to work in straight lines or on rectangular grids. We use the geo-tracker, or robotic total station, to control the grader blade three-dimensionally. It is one step more accurate than a GPS system.”
Using the robotic total station involves entering a digital terrain model, called a TIN-file, into the grader’s onboard computer. The grader is fitted with a mast and prism, which has a fixed relation to the grader blade. The robotic total station can see the prism, read its 3D location, and communicate it back to the grader. The computer processes the differences between the actual blade location and the digital terrain model to control the blade.
The GPS-equipped grader did the rough grading at 20-millimeter accuracy, and the prism-equipped grader handled the fine grading at sub-centimeter accuracy. With final subgrade complete, Wilco dug trenches to install a drainage system, covered with a geotextile. Working in four lifts of 300 millimeters each, Wilco filled the excavation with coal bottom ash, a gritty product like playground sand. “We took the TIN file and offset the elevation by 300 millimeters at a time.”
Savings. The machine-control equipment saved Wilco $15,000–$20,000 on surveying, for 100 hours or more at $150 an hour for a crew. “The systems make our equipment 25 percent more efficient on low-tolerance sites such as fields and running tracks where grades are critical,” Maat added.
To test planarity, Wilco stretched a stringline over a 3-meter distance at many points on the field and measured with a Canadian dollar coin, a looney. If they could fit a couple of loonies under the string, they had found a low spot. If they could fit only one, the 3-millimeter tolerance had been met. “Our feedback from the consultants was that they had never seen a field prepared this well, with very little adjustment required. The slope of the field had to be 0.25 percent from the centerline spine to the sides. And the slope of the D-shaped areas behind the goal posts was exactly the same.”
Manufacturers
Wilco uses a Leica PowerGrade GPS/GNSS receiver, Leica Redline base station, Redline Power Tracker robotic total station, and Geo-Tracker.
Learning how to control a car as a race driver does, at its very limits of handling, can ultimately assist ordinary drivers who enter a turn too quickly or are driving on a wet road and don’t realize when they need to brake. DGPS and inertial sensors drive feedback and feedforward speed controllers on a twisting test track to the top of Pikes Peak.
Stanford professor Chris Gerdes and his Dynamic Design Lab have outfitted and trained a white Audi to roar up the Pikes Peak International Hill Climb, a 12.5-mile racecourse to the top of the 14,110-foot Rocky Mountain summit.
Without a driver.
Officially known as the Autonomous Audi TTS Pikes Peak, the car has been nicknamed Shelley by its crew, in honor of Michele Mouton, the first woman to win the Hill Climb, in 1984, also in an Audi.
The team of graduate and Ph.D. students and Volkswagen’s Palo Alto research lab have spent two years conceptualizing and modifying the car to make the solo climb. They have just returned from tests of the car’s DGPS and other sensors on the course. International [human] racers competed on June 30, with the fastest just missing the course record of 10 minutes, 1.408 seconds, established in 2007, by a mere 10.082 seconds. That’s an average speed of 75 miles per hour over a course with 156 turns, many of them hairpins, an elevation gain of 4,721 feet, and both paved and gravel surfaces. Speeds at the Pikes Peak Hill Climb, often described by drivers as racing against the mountain more than other vehicles, top out around 165 miles per hour.
Shelley, not specifically built as a racecar, does not have the horsepower to hit that speed, but she aims for respectable rates all the same. “We are ultimately going for the fastest time we can get in a TTS and hope to establish that range in September and shoot for it in 2011,” wrote Gerdes from the mountain.
Safety the Goal. The team’s work is a variation on one theme: make Shelley drive faster, smarter — and safer.
“We believe that if we can learn how to control a car at its very limits of handling,” Gerdes said, “then we can also help ordinary drivers who enter a turn too quickly or are driving on a wet road and don’t realize when they need to brake. That’s ultimately where we hope this goes: safety systems.”
“Average drivers sometimes end up involved in road accidents due to their inability to control a vehicle at its limits,” Gerdes and Krisada “Mick” Kritayakirana wrote in a 2009 paper, from which the following results and figures are drawn, “yet racecar drivers routinely operate a vehicle at its limits without losing control. The difference could come from two key characteristics that racecar drivers have acquired.
“First, a racecar driver has the ability to estimate the friction between the tire and the road surface. Second, a racecar driver can utilize all of the actuators to control the vehicle at its limits, such as using the throttle and brakes to steer the vehicle, which could be counterintuitive to a typical driver. If a controller could imitate a racecar driver, perhaps this same concept could be applied to a vehicle safety system to assist drivers when they are on the verge of losing control. The controller could utilize every actuator to assist the driver, and real-time friction estimation could help predict the control authority that each actuator has. The goal of this research is to create a controller that captures these two key characteristics of a racecar driver.”
Feedforward, Feedback. Before entering a corner, a racecar driver anticipates the speed and steering angle that he or she would use. Similarly, in the Gerdes/Kritayakirana research, a feedforward controller is used to predict the speed and steering commands. While cornering, a racecar driver adjusts actuator commands (steering, throttle, and brake) to cope with any disturbances or driver’s perception mismatches (modeling errors). A feedback controller is designed to imitate a racecar driver making corrections during cornering. As a consequence, the desired steering and speed commands are calculated from the sum of feedforward and feedback controllers.
Robustness Tests. At Stanford, preliminary testing of Shelley’s control systems on the student-built P1 by-wire research vehicle provided a proof of concept. As with Shelley, P1’s DGPS and inertial sensors determine path-tracking errors that can be used to implement the steering feedback controller. A large parking lot with gravel over asphalt provided the ideal proving grounds for these tests. The inconsistent surface provided varying friction in the range of 0.4 to 0.6 and therefore presented a control challenge. The steering control had to be robust enough to ensure that this variation did not result in instability and the vehicle spinning.
The vehicle trajectory in Figure 1 shows performance of the steering feedback tested in isolation with an arbitrarily chosen constant accelerator input. Because the vehicle enters the curve much faster than the friction between the tire and the road can support, large deviations from the desired path (in this particular case, a maximum lateral error of 10.7 meters, and maximum heading error of 18.73 degrees) occur.
Figure 1. Vehicle trajectory with feedback steering only.
Although it swings wide of the desired path, P1 remains stable and does not spin out. The ability to maintain control of the car even when there is a misjudgment in the friction conditions is vitally important to both the Pikes Peak climb and future safety systems.
Demonstrating the robustness of the steering control both analytically and experimentally on P1 gave the team confidence to use it as a central part of Shelley’s control logic.
Combined Controllers. The current control scheme running on Shelley adds the feedforward steering and both feedforward and feedback speed control elements to the simple steering controller demonstrated in Figure 1.
This combination can track the desired path around the corner quite closely, as shown by the trajectory in Figure 2. This plot shows the performance on a rough dirt track with a friction coefficient again between 0.4 and 0.6 and therefore a maximum possible acceleration of between 4 and 6 meters/second2.
Figure 2. Latest result of TTS on Santa Clara fairground track; arrows indicate amount of vehicle acceleration (in green) or braking (in red).Figure 3. g-g diagram plots longitudinal and lateral acceleration, from tests on a different track, with friction on this surface (.65) somewhat higher than discussed in the text (0.4–0.6).
To demonstrate that Shelley is operating at the limits of friction, a g-g diagram is depicted in Figure 3. These diagrams, which are typically used to evaluate racecar driver performance, plot the longitudinal and lateral acceleration of the vehicle. An expert driver will achieve the maximum possible longitudinal acceleration in braking and the maximum lateral acceleration in cornering.
In transition between braking and cornering, the best drivers will use all available friction, giving the ideal curve a roughly circular shape. The g-g diagram for this test illustrates that Shelley continually operates at the limits of friction. As a result, the curve bears some resemblance to the behavior of an expert racecar driver. More precise comparisons with expert drivers driving the same course are planned for the future.
Shelley at rest as crew prepares DGPS base station and checks onboard computer.
A Rich Legacy
Shelley follows in the tracks of other Stanford robot cars such Junior, an autonomous Volkswagen Passat. “Junior was a perceptual challenge,” Gerdes recalled. Junior and its predecessor Stanley, under the direction of Stanford professor Sebastian Thrun, were designed to perceive the environments around them, understand signs and recognize the driving situation of nearby vehicles, then logically respond to what they saw. Both competed in the Defense Advanced Research Projects Agency (DARPA) Grand Challenges.
Stanley and Junior, while possessing a much higher level of autonomy than Shelley and able to handle a range of environments, crept along at speeds well below the average driver’s comfort level, and placed little emphasis on driving dynamics. Shelley is highly focused on the dynamics issue.
“They’re all autonomous vehicles to some extent, but they have very different scopes, and I guess you could say, very different personalities as well,” Gerdes said.
“Can we go around turns as fast as possible, brake at the last possible minute, and accelerate out as soon as we’re steering out of a turn?” Gerdes asked. This became the group’s goal for Shelley.
Rami Hindiyeh had the task of crafting Shelley’s judgment. He writes software designed to mimic a rally car driver’s mind with a series of mathematical analyses that predict how the car should control itself in different situations. He looked at “ways to slide Shelley through turns like a rally car racer would.” Mick Kritayakirana is in charge of the autonomous racing controller to govern Shelley “at the limits, like racecar drivers race on the pavement.”
The Audi TTS’s steering, brakes, gears, and throttle are all controlled electronically, so Shelley required few mechanical modifications to integrate her systems into a controller area network that allows the vehicle’s components to communicate. The network enables the team to individually switch each component from manual to automatic so the team can test its reliability.
Shelley’s most critical components are GPS antennas and receivers coupled to an inertial system that determines speed and sideways motion. The INS controls the car’s direction during GPS signal interruptions, giving up to 200Hz updates on car position.
While the combined effects of Shelley’s systems are complex, the computer in the trunk that processes the data isn’t any faster than one you could buy a decade ago. Most calculations are done separately within the GPS and in the vehicle electronics. “We don’t need a whole lot of computational power to run the driving and racing algorithms,” Gerdes said.
“We have to spend a lot of time trying to make the car listen to what we command,” Kritayakirana added.
The Pikes Peak course was plotted on a GPS map for the car to follow, and based on that information and how much friction the computer predicts, it has an idea of how fast it can take turns at different angles and with varying road surfaces. The computer refines its speed and steering with each test turn to figure out what Gerdes calls Shelley’s “braking point.”
“When a human is driving a car and they see a turn coming up, they can, at a constant rate, so to speak, just try to turn the wheel towards that curve preemptively,” said team member David Hoffert. “And that works because roads are designed with certain mathematical geometric properties that if you do that, [you] follow the path.”
As the team nears the finish line, members continue to closely collaborate with Volkswagen’s research group. They have weekly meetings “where we talk about our current status and evaluate the hardware and software,” said Marcial Hernandez, senior research engineer at Volkswagen. The team aims to have Shelley back on the mountain in September. “We’d really like to send the car pretty close to its capability, certainly much, much faster than people would be comfortable driving unless they were highly skilled racecar drivers,” Gerdes said.
Pre-Race Tests
The team’s trip to Pikes Peak in July enabled the group to experience the International Hill Climb and watch some of the best racers in the world tackle the mountain. Following the hill climb, the project team devoted a couple of days to gathering GPS data on Pikes Peak. This included scouting locations for base stations to broadcast DGPS corrections and determining the availability of corrections at different points along the highway. In addition, the team took measurements of the road boundaries and profiles for developing digital maps of the course.
Line-of-sight issues for the GPS base stations and interference of other voice and DGPS users on the broadcast frequencies used by the team present challenges for racing on the mountain. The group made significant progress on these issues during the June experiments and has scheduled additional GPS testing for July. Travis Wolgram, a test engineer at the Association of American Railroads in Pueblo, Colorado, joined the group to discuss using the High Accuracy National DGPS system in future testing. With a prototype base station now operational at the Federal Railroad Administration’s Transportation Technology Center, 50 miles southeast of Pikes Peak, there is a unique opportunity to harness these corrections for the project.
Shelley should return to Pikes Peak in September, with the goal of driving the entire course slowly and selected segments at full race speed. With proper analysis of this data during the winter months when snow is on the mountain, the team should be prepared to make a full run at race speed in 2011.
Manufacturers
The Autonomous Audi TTS Pikes Peak uses an Applanix POS LV420 GPS and inertial measurement unit, with OmniStar HP service for 10-centimeter or better accuracy, Trimble SPS851 GPS receiver for the base station, two Trimble HPB450 transmitters for RTK signal transmission from the base station, and a Pacific Crest ADL Vantage receiver in the vehicle to receive the RTK corrections.
Tyler Brown is a Stanford undergraduate. An earlier version of this story appeared in the Stanford Daily; it has been updated and expanded here by the Dynamic Design Lab and GPS World staff.
In a few weeks, we will again observe the tragic anniversary of the 9/11 attacks on the United States. This will mark nearly a full decade since that terrible day that changed the lives of people around the world, forever. Many will remember. Many will mourn. Many will work to ensure that such an event never again threatens any nation. That is a good thing.
Few outside the position, navigation, and timing (PNT) community will also recall that the day before the 9/11 attacks, the U.S. government released a landmark document that described the vulnerabilities of services provided by GPS to disruption, whether by attack or inadvertent interference. The Department of Transportation Volpe Center’s GPS vulnerability assessment recommended that services utilizing GPS-provided PNT seek alternative sources of these services. What decisions and actions have the findings and recommendations of this report promoted? The answer is most disturbing.
The U.S. government has sealed the fate of Loran-C and kept the decision on an enhanced Loran system (eLoran) in limbo for more than 10 years. The government has spent hundreds of thousands (if not millions) of dollars studying the problem over and over again and either ignoring or classifying the results. The Department of Homeland Security (DHS), a direct outcome of the 9/11 attacks, has done nothing to address the need for a national backup other than study and re-study the problem and disregard the findings and warnings of world-class PNT experts.
On the positive side, a recent paper from the Federal Aviation Administration (FAA) attempts to address the problem by proposing to investigate alternative PNT (APNT). While the FAA does this under its Title 49 responsibility and authority to ensure the safety, security, and efficiency of our National Airspace System (NAS), and the alternatives it is looking at are certainly aviation-centric, it is admirable that somewhere in this government someone is finally moving forward to define and implement a real, operational PNT alternative to GNSS and its augmentations. [An abridgement of the FAA paper appeared in the July GPS World; the full paper is available here.]
I applaud the FAA’s actions and only hope that bureaucrats and bureaucratic processes don’t penalize it for its efforts.
But the question remains: When will a decision on the U.S. national PNT backup be made? The urgency of this issue can be highlighted by posing some simple questions about another current threat to the U.S. infrastructure and economy.
To what extent are GNSS-provided PNT services being used to identify the amount and movement of the oil in the Gulf of Mexico? What level of information exactness/integrity would be lost if GNSS-provided PNT services were not available?
To what extent are GNSS-provided PNT services being utilized by cleanup crews and other impact-mitigation services? How would the efficiency of the cleanup/mitigation activities be impeded if GNSS-provided services were not available?
Finally, what is the opportunity cost of not having a national PNT backup? Why has this decision been so hard to make? One would intuit that it has encountered political obstacles, not scientific ones. What are they, exactly?
While the FAA is doing what it must to ensure a safe, secure, and efficient national airspace, what about the rest of us? The boaters, the truckers, the farmers, the power transmission people, the telecom providers, the cell-phone users? The list goes on and on.
It has been nine years. Why is this so hard?
As we take time on September 11 to remember where we were when we heard the news, to mourn those lost, and to do, each in our our way, something to ensure that such a thing never happens again, we should also take time on September 10 to thank the folks at the Volpe Center for their important efforts. And we should try, each in our own way, to do something to ensure that the effects of a loss of GNSS-provided services will be once and for all properly mitigated.
The masked engineer harbors strong convictions, matched by a desire to hold onto a day job.
INRIX announced it has expanded its European real-time traffic coverage to 18 countries making it the largest traffic network in Europe. With the launch of real-time traffic information in Ireland, Hungary, Poland and Slovenia since February, INRIX traffic services now cover more than 1 million kilometers of motorways, city streets and secondary roads, throughout Europe — more than 2X the amount of real-time road coverage of its nearest competitor.
“Whether driving across town or across borders, European customers uniquely benefit from INRIXs ability to reliably help drivers avoid traffic congestion wherever their travels take them,” said General Manager of INRIX Europe Dr. Hans-Hendrik Puvogel. “Through our expanded coverage, continuous technology innovation in support of standards like TPEG over IP, and growing customer base, we’re proving to the market everyday why we’re the best provider of quality traffic services across Europe.”
In a separate announcement today, INRIX introduced a breakthrough in the delivery of traffic information called TPEG Connect. Based on the new encoding and transmission standard for traffic and travel information developed by the Transport Protocol Experts Group (TPEG), INRIX TPEG Connect provides automakers and navigation application providers with the ability to optimize payloads and bandwidth for delivering richer real-time and predictive traffic flow, incident, and location-based services like weather conditions on the road to devices using TPEG over IP. By providing delta support that can reduce data payloads by up to 50 percent on each message request, INRIX TPEG Connect helps OEMs and consumers save on connectivity costs by reducing data consumption in ways that ensures only the most location-relevant real-time information is delivered to the device.
“TPEG Connect provides the industry with a better way to deliver pan-European traffic information that enables the delivery of more dynamic traffic and traveler information at less cost both to the OEM as well as the consumer,” said INRIX Vice President of Product Management Ken Kranseler, “By making the standard production for use over IP, INRIX TPEG Connect removes key technical and commercial hurdles for our customers accelerating the delivery of next generation of traffic applications and driver services that will improve mobility for millions of people worldwide.”
According to the announcement, INRIX delivers the broadest and most accurate real-time traffic information through its distinctive Smart Driver crowd-sourced traffic information network and Total Fusion data analytics technologies. The company offers real time traffic information today in the following European countries:
Austria
Belgium
Denmark
Finland
France
Germany
Hungary
Italy
Ireland
Luxembourg
The Netherlands
Norway
Poland
Spain
Sweden
Switzerland
Slovenia
United Kingdom
INRIX also announced an agreement with road safety products and services company Coyote Systems to provide real-time traffic information in future Coyote products. As Coyote’s preferred global provider of traffic information, INRIX and Coyote will work together to apply each other’s expertise in user-generated content for the development of future products and services.
I had the honor of attending Colonel David Maddens’ retirement luncheon at the Space and Missile Systems Center (SMC) on Los Angeles Air Force Base (LAAFB) on June 16, and it was quite an event. Just prior to it, I asked Dave if he would like to conduct an exit interview after he took a short vacation with his family. He agreed it would be a good idea and a way to say some things he has wanted to say for awhile.
During the retirement luncheon, various people and organizations presented Dave with mementos of his time at the GPS Wing; I stopped counting at approximately 50 different presentations. This is an indication of the high regard in which Dave is held by those with whom he works on a daily basis. The military shadowbox he was presented (see photo), which is a typical military farewell presentation, had the following inscription, which is certainly not typical, and sums up the way those who work with Dave feel about him as a commander and as a person.
SHADOWBOX presented to Col. Madden on his retirement. The quote reads, in part,“The credit belongs to the man who is actually in the arena, whose face is marred by dust and sweat and blood, who strives valiantly, who errs and comes up short again and again, because there is no effort without error or shortcoming, but who knows the great enthusiasms, the great devotions, who spends himself for a worthy cause; who, at the best, knows, in the end, the triumph of high achievement, and who, at the worst, if he fails, at least he fails while daring greatly, so that his place shall never be with those cold and timid souls who knew neither victory nor defeat.” Theodore Roosevelt, 1910
“It is not the critic who counts: not the man who points out how the strong man stumbles or where the doer of deeds could have done better. The credit belongs to the man who is actually in the arena, whose face is marred by dust and sweat and blood, who strives valiantly, who errs and comes up short again and again, because there is no effort without error or shortcoming, but who knows the great enthusiasms, the great devotions, who spends himself for a worthy cause; who, at the best, knows, in the end, the triumph of high achievement, and who, at the worst, if he fails, at least he fails while daring greatly, so that his place shall never be with those cold and timid souls who knew neither victory nor defeat.”
Theodore Roosevelt
“Citizenship in a Republic,”
Speech at the Sorbonne, Paris, April 23, 1910
Dave was officially retired the next day by Colonel (USAF, retired) Bradford Parkinson. Dr. Parkinson was the first GPS Joint Program Office Director, in the early 1970s. He recently reviewed those early days and those responsible for the success of GPS with a two part series in the pages of GPS World.
Interview
Don Jewell (DJ): Dave, after almost four years first as the Vice Commander and then for the last three years the commander of the GPS Wing, of what are you most proud?
Colonel David Madden (DM): Overall, the GPS Wing has made significant progress over the years moving critical space system developments and acquisitions forward. The GPS Wing continues to lead with a “back-to-basics” foundation of rigorous system engineering, incorporated strategies like parallel risk reduction and capability insertion efforts, incremental delivery of timely and valuable capabilities to warfighters and civil users, and best business practices with solid cost estimates and contract incentives. Our new GPS III space vehicle, Next Generation Control Segment, and our GPS Modernized User Equipment programs incorporate our latest thinking of these innovations, and pave the path as a model for future acquisitions: low risk and high confidene associated with program execution (cost, schedule and technical performance).
The GPSW Team has had many specific accomplishments over the last four years. I would like to highlight just a few.
Space Segment. In the space segment, we accomplished a major milestone in GPS history with the launch of the final GPS IIR-M satellite in Aug 2009. GPS IIR-21 (M) marked a critical milestone in the GPS modernization program that was initiated in early 2000. The GPS IIR/IIR-M satellites are the cornerstone of the GPS constellation, and I expect them to perform well into the future. We’ve completed the development, testing and launch operations of the first GPS IIF Space Vehicle. The GPS IIF is the “Dawn of a New Era” of GPS services, providing new and improved capabilities that will continue to support not only the warfighter but commercial and civil users around the globe. IIF vehicles two and three will be delivered by early 2011, and two of the remaining nine fixed-priced vehicles are already proceeding down the Boeing Pulse Line.
Another noteworthy accomplishment was the award of the GPS III spacecraft contract. The GPS III will be developed in three increments with each increment to include more capabilities based on technical maturity. We successfully completed the GPS IIIA satellite Preliminary Design Review (PDR) in May 2009 and the GPS IIIA Critical Design Review (CDR) is scheduled for August 2010, two months ahead of schedule, which completes the detailed design and lays the foundation for fabrication. GPS IIIA is a back-to-basics spacecraft program with a strong focus on systems engineering, mission success, and acquisition excellence.
Ground Segment. In the GPS ground control segment, great lengths were taken to ensure the successful replacement of the decades-old command and control (C2) system with the new Architecture Evolution Plan (AEP) software, to improve GPS operator interfaces while providing a test capability for the new signals on the modernized satellites and to improve launch, anomaly, and disposal (LADO) operations. This new software will also provide robust security improvements to include “over-the-air” distribution (OTAD) of encryption keys to properly equipped military users.
I would also like to mention the successful award of the Next Generation Control Segment (OCX) back-to basics contract. The current acquisition strategy for fielding the OCX consists of four increments (commonly referred to as Blocks). The recently awarded OCX contract consists of Blocks one and two [while] Blocks three and four will be follow-on contracts that align with the future GPS IIIB and GPS IIIC spacecraft capabilities.
Colonel (USAF, retired) Bradford Parkinson congratulates Colonel Dave Madden on his fruitful career and retirement.
User Segment. In the GPS user equipment segment, we are actively working the development of a new generation of military user equipment to take advantage of the modernized M-Code [military only] signals. Currently we are conducting technical demonstrations and risk reduction for our next generation Military GPS User Equipment (MGUE) and defining a creative acquisition strategy.
USD-AT&L (the undersecretary of Defense for Acquisition, Technology and Logistics) signed an acquisition decision memorandum (ADM) on May 24, 2010, approving a material development decision for MGUE: the formal entry point for MGUE into the acquisition process. Currently, our three Military User Equipment (MUE) contractors are testing and delivering prototype cards this summer; government testing follows.
The foundation of our MGUE acquisition strategy is an incremental approach that leverages technology developed under the MUE program to move into engineering and manufacturing development of the first MGUE receivers as soon as possible. The strategy will be submitted to the Pentagon this summer after SMC coordination and PEO Space approval.
Our business strategy over the long term is to develop common GPS modules (CGMs) as the core engine for all DoD user equipment. We will develop CGMs incrementally as well, to support the form factors for the air, maritime, and ground domains. By early fall, we will have a final technical requirements document (TRD) for the MGUE form factors and CGM. We expect an RFP release in Feb 2011, and a Milestone A in May 2011. By early FY12, we should be on contract for Increment One of MGUE.
System Sustainment. From a systems sustainment standpoint, our GPS Wing detachment located at Peterson AFB has exceeded all expectation associated with ground (softwa
re and remote sites), user, and satellite systems sustainment. Even with all the system upgrades over the past year our sustainment team has kept the operational system performance well above the requirement: Read, no capability impact to civil or military users.
In fact, performance (availability, accuracy, and integrity) has been significantly improved over the last four years. Finally, they are normalizing sustainment of the current user equipment (DAGR-Defense Advanced GPS Receiver, MAGR-2K-Miniaturized Airborne GPS Receiver Version 2, and ADAP-Advanced Digital Antenna Production program) by transitioning sustainment responsibility to Air Force Material Command, specifically the Warner Robins Air Logistics Center depot at Robins AFB, Georgia.
Partnerships. The GPS Wing has established a close working relationship with Air Force Space Command Headquarters at Peterson AFB, Colorado for overall system operations, sustainment, and development responsibility; the 45th Space Wing (launch operations teams at Cape Canaveral Air Force Station in Florida), the 50th Space Wing (Overall System Operators at Schreiver AFB in Colorado), the Launch and Range Systems Wing (Los Angeles, California acquisition organization with responsibility for getting our GPS satellites successfully to orbit), the United Launch Alliance, the many government agencies (FAA, DOT, DOE, NSA, NGA, NASA, and so on), OSD organizations (PA&E, NII, AT&L, DOT&E), and our dedicated and professional prime contractors and major subcontractors to successfully sustain and enhance GPS mission capabilities — providing the highest overall daily system availability and the most robust GPS on-orbit constellation ever for war fighters and civil users worldwide. The constellation is healthier than it has ever been, and with the launch of the first IIF satellite and the on-track development of GPS IIIA, we are poised to maintain GPS as the gold standard for positioning, navigation, and timing well into the future.
The People. Finally and most importantly, I am proud of the men and women that make up the GPS Wing. They have molded many players (Aerospace, MITRE, service reps, international officers, government and civil agencies, SE&I and SETA (support) contractors, and U.S. Air Force military and civilians) into a finely tuned machine that is always focused on the number one priority: mission success. At the same time they have made the Wing a fun place to work. The GPS Wing members have made significant contributions to the quality of life in the GPSW, on LAAFB (Los Angeles Air Force Base), and the local community. Whether it was the great Company Grade Officer Association activities, tasty Tuesdays, the BBQs by the base gym, the holiday parties, the POW/MIA (Prisoner of War/Missing in Action) Run, the yearly toy contributions to the Marine Corp Toys for Tots program, regular food drives to support the Redondo Beach community, the yearly car show, the GPS Partnership Council, GPS University, or the many visits to local schools (just to name a few activities), they are truly a class act of which I was honored to be a small part.
DJ: Dave, how would you most like to be remembered?
DM: As the “AGER” guy. The one who put the enterprise back together, which will lead to better synchronization among the segments and ultimately deliver future warfighting capability to the U.S. and Allied forces. Senior AF, DoD, and Congressional leadership now look at GPSW execution as a enterprise rather than a collection of individual ACAT 1D (Acquisition Category 1D) programs. This has allowed the modernization program to move forward, significantly reducing the numbers of reviews, documents, and decision complexity.
DJ: Dave can you explain just where we are today in the ongoing GPS-IIF saga? Are we on track and on schedule to have IIF-1 activated sometime in late August? Will there be a second IIF launch this calendar year? Does Boeing finally have it all together?
DM: Don, I’m actually glad you asked the question that way, because it gives me an opportunity to address it squarely. It is completely fair to call the GPS IIF program a saga because of how long it took us to get to our first launch. But it is also important to ensure the credit and blame gets spread properly. The program did suffer from the sins of acquisition reform in the 1990s — on the government side and the industry side —- as well as major requirements changes years after program initiation. In hindsight, I’d have to say that we collectively failed again in the mid 2000s when we were overly optimistic about the time and funding needed for the challenges we would face in recovering from TSPR (Total System Performance Responsibility). On the flip side, during my tenure here I’ve had great support from my senior leadership — and from their Boeing counterparts — for taking the time necessary to ensure we have a quality program. We kept our eye on mission assurance and fixed quite a few end-of-life risks. We might not have had that luxury if the constellation weren’t so robust over the past few years.
In the end, the proof is in the on-orbit performance. So far, I’m proud to say that the checkout of SVN-62 has been proceeding very smoothly. My guys and Boeing have a great working relationship with the crews up at the 50th Space Wing, so the bird is in good hands. I expect we’ll find a few things we want to tweak before making the satellite available to users. Most space programs do that with the first satellite of a kind. In the end, the users will have a satellite that adds real benefit to the constellation performance.
Right now the teams are still pushing hard to get SV-2 ready to launch. There are still a few hurdles to clear, and the leadership needs to evaluate whether or not the constellation really needs another GPS IIF just yet or can it wait until next summer. I would love to watch another one go up this year, but it just won’t be the same watching from the sidelines!
DJ: I know it won’t be the same, Dave, but it should still be exciting. Now how about an update on the OCX program and how it is progressing?
DM: The OCX program is off to a great start. We awarded the contract to Raytheon in February 2010 and kicked off the integrated baseline review (IBR) in March. We are currently working side-by-side with Raytheon to solidify the program management baseline so we can jointly manage the program in a back-to-basics manner. Phase B software development for controlling modernized features is underway and builds on Phase A products, which we demonstrated with a prototype in December 2008. I have tremendous confidence that the OCX program will deliver promised capabilities on time to support modernized GPS.
DJ: Can you give us an update on where we are with the GPS IIIA program? Have you been successful in maintaining the no-changes mandate?
DM: GPS IIIA has maintained a stringent, back-to-basics approach since program inception. This has included significant investment in early systems engineering, and strict requirements discipline. To date, no new requirements have been levied on the GPS IIIA. Any new requirements for consideration are being addressed in future blocks as planned. The program is currently on track, and is forecasting the completion of Critical Design Review 60 days ahead of the baseline schedule.
DJ: We have satellites on orbit today that will reach their mean mission duration without broadcasting all resident signals or using all capabilities? Is there a plan to address this issue?
DM: Although there is some concern that the IIR-M satellites may reach their end of life before the L2C capability has been deployed, or that the IIF satellites may reach their end of life before L5 has gone operational, the concern is not justified by our reliability predictions and our current program plans. Current plans are for OCX Block 1 to provide L2C support, which is projected in the August 2015 timeframe, whereas the IIR-M satellites are expected to live well into the 2020 timeframe. Likewise, OCX Block 2 will provide L5 support in the 2016 timeframe, and our IIF satellites are expected to live into the 2025 timeframe. Therefore the likelihood that IIR-M or IIF satellites will be decommissioned before L2C or L5 have become operational, respectively, is very low.
Over the last couple of years, lots of discussion has gone into the integration issue, but I am not really sure what providing fully integrated GPS capability really means. What I do know is the user needs all three segments (satellite, ground command and control, and user equipment) to fully utilize new system capability. I also know that system integration comes in two forms. First and foremost from a technical design standpoint. This allows individual segments to be delivered independently but with high confidence the system will operate when all three elements arrive. This gives flexibility to the dynamics associated with budgets, policy decisions, requirements changes, unexpected technical hurdles, launch availability, and weapon platform availability for integration and testing (just to name a few variables). Rest assured the GPS enterprise is integrated at the technical level. However, it’s the second form of integration that gets all the attention: having all segments delivered in a reasonable proximity to each other. Not to make excuses, but as it relates to GPS, this is just hard to accomplish because it involves a span of control and accountability that is almost infinite. Many in the community recognize this reality, which has allowed the Air Force to set appropriate and realistic expectations so real capability can be delivered.
That being said, there are prudent things that can and are being done to speed the deployment of capability and set appropriate expectations. The most significant has been to broadcast the M-Code, L2C, and soon L5 signals from space to allow civil and military user equipment manufacturers to begin development and testing of their next generation of receivers. This gives industry a jump while the U.S. Air Force continues to develop the C2 capability and the next-generation signal monitoring capability (required to ensure signal in space performance integrity). Also, building the modernization programs with a strong mission assurance foundation is a major step forward. We understand the lessons learned that established the baseline for the current Block II systems delivery; the Block III systems are built on a solid acquisition strategy of reduced risk and increase execution confidence.
DJ: What do you see as one of the biggest GPS enterprise challenges, and what are some of your thoughts on the way ahead?
DM: That’s easy, Don: ensuring global PNT services are not interrupted as the United States continues to modernize GPS. If we don’t continue to develop a more robust means of ensuring user equipment compatibility, even a small number of non-system-compatible receivers (military or civilian) can significantly delay the delivery of critical modernized capability for everyone. Let me explain and provide some thoughts.
Since its initial design in the early 1970s, GPS has evolved in both capability and complexity. In the early days, systems engineering across the space, control, and user segments was relatively straightforward. The GPS Joint Program Office developed all military user equipment, and was able to rigorously ensure all specifications were verified prior to fielding. Over the past 20 years, however, GPS has become ubiquitous throughout the Department of Defense, with tailored satellite navigation solutions developed and acquired by dozens of program offices to support hundreds of unique requirements. Meanwhile, commercial GPS is one of the foundations of the Information Age, with GPS receivers produced in quantities approaching half a billion devices per year. The model of simply providing policies, standards, and interface control documents without providing a means to certify receiver compliance is becoming more challenging due to the continued growth in both military and civil applications for PNT, the competitive nature associated with user system applications and performance, and the increased complexity of GPS. Furthermore, it is especially difficult fielding upgrades to an established system like GPS while maintaining backwards compatibility with previously fielded equipment. These challenges are further exacerbated by difficulties associated with synchronizing the lengthy timelines associated with fielding ground-segment, satellite, and user equipment upgrades.
Recent highly isolated incidents, involving civilian and military receiver and other manufacturers, have highlighted the significant impact a very small number of receivers experiencing compatibility issues can have on the entire enterprise of worldwide users. In addition, a number of cases associated with improper receiver integration into major weapon systems have delayed system fielding as well not allowed the weapon system to best optimize GPS to the overall weapon systems performance.
Therefore, it is my opinion, to ensure worldwide PNT services are not interrupted as we continue to modernize the GPS, a more robust means of ensuring compatibility needs to be explored. (I would like to stop and make a note here: by “we” I mean all the DoD and civil agency stakeholders.) This means we need to not only continue to release “building codes” but we need to develop a capability to be more involved in the development, integration, and testing of new military and possibly civil user equipment.
We have recently taken a number of big steps in this direction.
First, we are currently significantly increasing the number of civil and military GPS receivers in our government testing labs. This will enable us to run tests against a wider variety of receivers, to gain higher confidence before we deploy system upgrades.
Second, we recognize that we need to ensure that our signal specifications, for both military and civil users, are as clear as we can make them. User-community representatives are already encouraged to be full participants in appropriate interface-control working groups. We further recognize that there is no substitute for thorough testing, and hence fully appreciate the importance of deploying signal-in-space capabilities as early as possible, on predictable schedules, so user equipment can be field-tested prior to market release or operational deployment.
Third, we are developing new upgrade fielding methodology whereby when we deploy system upgrades, we will take a more methodical approach and, whenever possible, field upgrades to smaller segments of receivers to prove compatibility without exposing all operational assets simultaneously. We will also apply a new software sustainment model to future military GPS user equipment, to ensure that inevitable system changes are systematically and rigorously executed with minimal impact on DOD programs.
Finally, we are investigating the establishment of something similar to an underwriters laboratory service to help support military programs with integrating GPS into their weapon systems during development. The teams associated with such lab services would support program design reviews as well as help develop the validation criteria for overall system acceptance. In addition, we are also starting discussions with key GPS civil receiver developers on how we might be able to provide a similar service to commercial receiver developers (potential fee-for-service type model).
Don, I highly recommend we continue to develop the four efforts I just mentioned but also dedicate significant time to critical thinking events to ensure we have minimized the risk of a widespread receiver issue, delays in delivering modernized capabilities, or sub-optimized weapon system performance. Manufacturers of equipment adversely affected by recent GPS upgrades have significantly stepped up their interactions with the GPS program office to resolve the compatibility issue and are playing a major role in providing an upgrade to their affected receivers to correct the issue. To date, no operational weapon systems have had to be grounded or civil capability degraded. I encourage the GPS community to treat recent events as a call to arms. GPS has become a critical national and international utility but it is much more complex than the electric or telephone services. How military or civil GPS receivers are designed, developed, and integrated into systems has a significant impact on the overall performance or lack of performance of the system. Don’t let recent events be a lesson not learned; let’s lead and solve the risk before it becomes an issue.
DJ: These are all excellent ideas, Dave, and many of them we have discussed in the past as concepts. It sounds like many of them are now a work in progress, but since you won’t be around to shepherd them into fruition, just what sort of prudent advice would you give Colonel Bernie Gruber as he assumes command of the GPS Wing?
DM: First and foremost, listen to your people — we have a great team! They are skilled professionals who really care about GPS. Second, keep the MGUE program focused and moving forward.
DJ: I certainly hope at a minimum that Bernie listens to your advice on MGUE. Now, Dave, when will the GPS Wing transition back to a Joint Program office, and what affect will this have on the military personnel working GPS? Will this re-designation be detrimental to their careers and future plans for the JPO? Will it lessen the GPS Wing’s/JPO’s influence in the GPS community and with other services?
DM: Don, we are scheduled to complete the transition and stand-up as the GPS Directorate on October 1, 2010. The Center is having one inactivation ceremony for all the Wings in SMC on September 8. The transition will be seamless and have a minimal effect on our military personnel. Our senior leadership is working on ensuring our materiel leader positions have group or squadron commander equivalency and will also be command-screened and boarded. There will not be very much difference within the Wing on a day-to-day basis. For the most part, the work, responsibility, and accountability will remain intact. The re-designation will have very little detriment upon the careers of the officers within the Wing. The officers’ records will show a transition and re-designation to explain the change, and that it is no cause of their own. As far as future plans for the organization, the strength of the leadership here in the Wing will still be in place and will be just as effective as it is now to lead each individual in our organization and to move forward and progress in GPS capabilities into the next era. Other services will still look to us to continue to forge advancements in GPS satellites so that our influence in the world’s GPS community will remain the standard: stronger than ever. Our organization will continue to acquire and sustain global navigation, positioning and timing services for our war fighters and civil users. We’ll still be the Green Monsters everyone knows and loves!
DJ: What message would you like to leave with our readers as you move on from GPS to the milsatcom community?
DM: GPS is in great hands. I look forward to the challenges ahead.
DJ: Any final comments, Dave?
DM: It has truly been a pleasure leading the GPS Team — my best job in 30 years of service. And you, Don, have also been a welcome friend.
GPS improves the quality of life for everyone on the planet. It saves lives both on the battlefield and in our cities and towns across the globe. The U.S Air Force and Air Force Space Command have been the diligent stewards of GPS since program inception in the 1970s and continue its commitment to this critical component of our national infrastructure. The current GPS constellation has the most satellites and the greatest capability ever. We are committed to maintaining our current level of service, as well as striving to improve service and capability through ongoing modernization efforts. The Air Force will continue to pursue an achievable path maintaining GPS as the premier provider of positioning, navigation and timing for military and civilian users around the world.
DJ: Dave, everyone at GPS World wishes you the best of luck in your future endeavors, and thank you for your honesty and candid responses to our inquiries through the years. You were the leader the GPS Wing needed for the last three plus years and you have left a legacy of which you can be justly proud. And in my opinion if the GPS Wing, Directorate or JPO thinks they have seen the last of Dave Madden, they should think again. Best of luck in milsatcom.
I attended (and presented at) the 2010 ESRI Surveying and Engineering GIS Summit (SEGS) last week, as well as the ESRI International User Conference (UC). I’m telling you, if you’ve never been to the SEGS and UC, just treat yourself one time. Make a mini-vacation out of it. San Diego is a beautiful place to visit. The weather is always moderate with low humidity and warm temperature. It was a little cooler this year than years past, but still absolutely beautiful with tons of sigh-seeing. My wife has accompanied me for the past few years and she always enjoys herself and finds something new every year.
I believe that if you just go just one time, your vision of surveying, engineering, construction and GIS will change forever. I know it sounds like an advertisement from ESRI, but I think my pitch is even better than theirs :-). Seriously though, there are so many people presenting so many different ideas, and they are all related to the kind of geographic data you work with on a regular basis.
But, like anything else, it’s not all good. There are some drawbacks, so I’ve come up with my Good, Bad, Ugly list with respect to the conference. I think its pretty objective.
The Good
The single largest gathering (13,000+) of GIS, surveyors and engineers in the world (although one could argue that Europe’s INTERGEO might be larger).
A pre-conference (SEGS) that is designed specifically to cater to the land surveying and engineering folks.
Ideas and technology are presented that you will not find anywhere else.
The opportunity to network and collaborate with a large number of peers that you will not find anywhere else.
In 2011, the national ACSM (American Congress on Surveying and Mapping) conference will be combined with the SEGS.
San Diego is a beautiful city with beautiful weather and lots to do within walking distance of the convention center.
The Bad
Since it’s a vendor-specific conference, ESRI competitors such as Autodesk, Intergraph, etc., are not invited. In fact, if you tick them off, they might not invite you back next year.
A lot of time away from work during prime field season (July).
You could be overloaded if you aren’t prepared for the barrage of information and technology.
The Ugly
The whole experience isn’t cheap. The conference registration is expensive and San Diego is an expensive place to visit.
The San Diego airport is horrible, but at least it’s a very short ride to the convention center.
The Surveying and Engineering GIS Summit (SEGS) is held the weekend prior to the massive User Conference (13,000+ people).
I’ve heard rumblings about this for quite awhile. Here are my thoughts.
The ACSM national conference is dying and needed to do something drastic. This year, it co-located with the GITA (Geospatial Infrastructure Technology Association) national conference in Phoenix, Arizona, back in April. I attended that conference, too. Even though I was disappointed in the lack of coordination between the ACSM and GITA technical programs in Phoenix, the technical content was very good. Attendance, on the other hand, was horrible. It wasn’t sustainable from a business standpoint.
Because the annual ACSM conference was on a quick road to nowhere; it had to make a move to team up with another conference. Who?
The GITA conference dissed ACSM (or maybe the other way around) and is flying solo next year in Dallas, Texas. I think the attendance at the GITA conference will be a disaster. They already have a GITA Oil & Gas conference in Houston.
Another partner choice would be ASPRS, but for some reason, ACSM and ASPRS can’t figure out how to put something together even though the conferences were at the same time this year. Someone’s ego probably got bruised.
Partner with Autodesk? No way. Autodesk is a $2 billion behemoth. They don’t need or have the time to deal with ACSM.
That leaves the ESRI SEGS. Attendance-wise, the SEGS has been flat, or even lost ground. It needed a boost. Bringing in ACSM was a smart move, essentially increasing its attendance from 300 to 1,200. For ACSM, it wasn’t the ideal choice, but it was the only choice. It couldn’t afford another solo event in some off-beat city. The bottom line is that conferences need a healthy number of exhibitors and commercial sponsors in order to be financially viable. For companies to be interested there needs to be a healthy number of attendees. It’s a vicious circle. If attendance wanes, then exhibitors and commercial sponsors start to pull out.
Even though there is some pretty good upside for ACSM and ACSM membership in combining the conferences, I think the general ACSM membership will suffer. The primary reason is because it’s stuck in San Diego for the next three years. The U.S. Mid-Westerners and U.S. East Coaster’s will hesitate to make the trip due to the distance and expense of the conference, especially with the poor U.S. economy. I think what you’ll see are the state association conferences becoming stronger as they have been in the last few years. I wish, somehow, that some of the energy and excitement from the ESRI conferences could make their way to the state conferences.
I may sound wishy-washy, but in the final analysis, I think this is a good move. For ACSM, it was the only move and for ESRI, a feather in their cap. It’s interesting to note that even though it’s a three-year agreement, either can opt out annually.
On to the technical part of the SEGS conference
I blogged about the SEGS while I was in San Diego. Click here to view my summary.
A few of points I’d like to quickly emphasize:
Crowd-sourced data. There’s a lot of buzz about this, and rightfully so. SEGS keynote speaker Nancy von Meyer commented on crowd-sourced data and the challenge of “authenticating” it. Crowd-sourced, or third-part,y data is coming in a big way. You can choose to ignore it, but the smart people will take the time to understand it and use it when appropriate.
On a related point, a Community Basemap initiative was announced at the ESRI UC Plenary. The idea is that you contribute to the “community basemap” and, in return, you receive a better basemap than you started with. Granted, you have the same “data authentication” issues as crowd-sourced data, but if you understand it, there is value.
Imagery (e.g. ,satellite images, aerial photography). From following t
he satellite imagery vendors, I’ve known that imagery is progressing. Its quality (pixel resolution) and availability is improving. But, I’ll admit that I was taken back a bit when Lawrie Jordan, founder of ERDAS (he later sold to Leica) said this is the most exciting time in his 40-year career in imagery. He said that in less than five years, every square inch of the Earth will be constantly imaged by satellites. Now, ground truth accuracy is another story…
On Sunday, I made the keynote presentation during lunch. The title of my presentation was Get It Surveyed (GIS). The title was said tongue-in-cheek of course. There were many directions I could have gone, but I decided on three topics.
A GIS isn’t driven by spatial data accuracy.
GNSS technology in the next 10 years is going to advance significantly faster than the past 10 years.
The land surveyor’s role in the next 10 years is going to change significantly more than the past 10 years.
You may take offense to some of the details in #3, and I’m sure some of you did. I assure you, my intent was not to offend, but rather stimulate thought and consideration. Some comments I received after my presentation.
“You said what I’ve wanted to say, but can’t because my RPLS colleagues would kill me” (heard a version this from several people, two of whom are very prominent in the RPLS community).
“You are spot-on” (heard some version of this several times).
“Don’t forget about those who specialize in boundary surveys.”
“Your timeline of 10 years is too conservative; it will be more like five.”
A criticism I heard (not directly, but through the grapevine), was from someone who was particularly incensed by my presentation. I’m sure there were several people with this attitude. No doubt these criticisms are in reference to my thesis about land surveyors’ practices evolving and/or my comment that most RPLS’s aren’t qualified to manage a GIS. The criticism doesn’t surprise me. I’d be surprised (and probably disappointed) if it didn’t evoke any. Change doesn’t come easy and some will choose to give up rather than change.
No matter if you were at the live presentation or not, I’d love you hear your comments on it. You can download it by clicking here.
Lastly, during the Q&A after my presentation, I was caught flat-footed with a question about GIS licensure. I sort of stumbled and then stated that the technology is moving too rapidly and the bureaucracy of licensure couldn’t keep up. It didn’t take long for me to realize, and others to point out, that it wasn’t a very intelligent answer. Several people approached me afterwards and were able to express their opinions more eloquently and clearly. For what it’s worth, not one of them was in favor of GIS licensure. I will dedicate another article to this subject.
In closing, following are some photos I took at the SEGS. I hope you enjoy them.
Interesting slide from ESRI’s Brent Jones showing the attendance breakdown at the SEGS
Countries represented at the SEGS
Panel Discussion lead by ACSM’s Curt Sumner (Nancy von Meyer – VP Fairview Industries, David Cowen – NGA Committee Member, Wayne Harrison – President NSPS)
Thought-provoking slide from Brent Jones
Another thought-provoking slide from Brent
Opportunities for surveyors in GIS according to Brent Jones
The Elephant Charge (“Dust, Sweat, and Gears”), an annual off-road motorsport charity event, brings together competitors, their families, and supporters for a wilderness weekend of GPS-driven fun and frenzy in the Zambian bush. I’m for fun, but I always wince when I see folks tearing up habitat in the name of saving it.
Elephant Charge 2010 seeks to raise funds and awareness for local conservation in Zambia, specifically for two hides, or wildlife observation posts, in Lusaka National Park along with funding for the South Luangwa, Lower Zambezi and Kafue National Parks private-sector conservation efforts. Organizers hope to attract more than 300 campers over the weekend of October 23–25 and as many day observers and participants, en route to a fundraising goal of $35,000.
Focus of the weekend is an event for car and motorbike teams that requires stamina, sweat, driving, and navigation skills through the Zambian bush. Maps showing the location and GPS coordinates of nine checkpoints are issued to teams on the evening before the race. To win, a team must complete the nine-checkpoint course in the shortest distance among competitors. Each team finds it own route between the checkpoints, in any order, through valleys, over ridges, and up (or down) escarpments. The goal of short distance explicitly encourages teams to go off-road in their vehicles. Bush roads are cut to each checkpoint and marked on the issued maps, however they never give the shortest distance.
The blog piece you are reading is armchair bushwhacking at best, and it’s hard for me to preach at a distance to Zambians on how to use, exploit, preserve, or tear up their own turf. Of course it’s heartening to see GPS enlisted in conservation and education efforts. I just wish they weren’t harming habitat — by cutting bush roads and further encouraging racers to rip off through the vegetation — in order to help preserve it.
Alternatively, for a terrific vicarious experience of the Africa savannahs and bush without leaving home, read either Don’t Let’s Go to the Dogs Tonight by Alexandra Fuller, set in Rhodesia, Zambia, and Malawi, or Sand Rivers by Peter Mathiessen, set in Tanzania. “The crack of the dry grass, the intense heat, the startling beauty of the birds, the fleeting glimpse of wary wildlife . . .”
One of the first industrial uses of GPS came in survey and seismic exploration for offshore oil, as evidenced by the cover story of this magazine’s September 1992 issue. A salient passage from that 18-year-old “Quality Control For Differential GPS in Offshore Oil and Gas Exploration” article:
“Users are in danger of being mesmerized by the apparent simplicty of the technology and abandoning quality-control principles . . . . The key to routine operations is rigorous real-time quality control.” Eerily, among the companies acknowledged for support of that article was BP Exploration.
Oil companies early-adopted GPS and private satellite differential correction services, and remain enthusiastic users today, for monitoring of and navigation around deep-sea rigs. The March 2010 cover story shows how this field continues to forge ahead, now as early adopters of multi-GNSS technology.
Positioning, navigation, and timing had nothing to do with the disaster in the Gulf of Mexico, but some important lessons float there for our learning. They concern engineering principles — principally in not forsaking them.
The full Deepwater Horizon story has yet to emerge, but it seems abundantly clear that corner-cutting and downright elimination of basic practices led to the disaster. When a natural aberration occurred, it blew right through several weakened backup systems and safety guards, ones that were withdrawn or restricted only days earlier, to shave costs and time.
Beancounting and other modern business practices have undermined vital enginering principles — rigorous mathematical analysis, based firmly in the laws of physics, situational and historical experience, and what may seem to be overcautious safety margins — not just in the Gulf, but everywhere we look, including our own GNSS backyard. Control of technical programs in both private and public sectors now rests in the hands of non-technical people who owe highest allegiance to the almighty dollar. CPAs trump engineering Ph.D.s. If a disaster hasn’t happened (yet), there’s no need to guard against it, they believe.
Has anybody here seen my old friend Loran-C?
Can you tell me where he’s gone?
He guided ships and airplanes,
But it seems the budget’s slashing-prone.
You know, I just looked around, and he’s gone.
By Simon Lutz, Marc Troller, Donat Perler, Alain Geiger, and Hans-Gert Kahle
A team of Swiss researchers is using data from a network of GPS receivers and the technique of tomography to obtain profiles of how moisture is distributed with height, which might lead to better weather forecasts.
INNOVATION INSIGHTS by Richard Langley
WEATHER FORECASTING IS STILL AN IMPERFECT ART. Humankind has been trying to predict the weather for millennia. Early attempts were based on general observations such as “Red sky at night, shepherd’s delight; Red sky in morning, sailor’s warning.” But it was only with advances in scientific thought and the invention of measuring devices, such as the mercury barometer, that more specific predictions could be made.
Towards the end of the 18th century, the father of modern chemistry, Antoine Laurent Lavoisier, said “It is almost possible to predict one or two days in advance, within a rather broad range of probability, what the weather is going to be; it is even thought that it will not be impossible to publish daily forecasts, which would be very useful to society.”
Forecasting ability has improved over the years as measurement technology, communications, and the understanding of atmospheric processes have improved. Meteorologists use measurements from various types of sensors together with mathematical models describing the physics of the atmosphere to predict its future state. The temporal and spatial density of the measurements and the sophistication of the models have a direct impact on the success of the forecasts. Weather stations on the Earth’s surface, radar installations, radiosondes, and satellite sensors all provide data for modern forecasts. Yet better sampling of the current state of the atmosphere, particularly the distribution of water vapor, is required to produce more accurate and more timely forecasts of its future state. GPS can help.
The signals from the GPS satellites must transit the atmosphere on their way to a receiver on the Earth’s surface. The atmosphere’s atoms and molecules slow down the signals so that they arrive slightly later than they would if the Earth was surrounded by a vacuum, and this effect shows up in the GPS receiver measurements. The receiver or measurement processing software needs to remove or model the effect to obtain accurate receiver positions. On the other hand, if all parameters affecting GPS measurements such as satellite and receiver coordinates are well known, then the delay imparted by the atmosphere can be estimated. It is possible to separate the effect of water vapor from that of the dry gases such as nitrogen, oxygen, and carbon dioxide and to provide a measure of the atmosphere’s moisture content. Several national weather agencies are ingesting such estimates from networks of GPS receivers into experimental or operational numerical weather forecast models. But these values represent an integrated measure of moisture above a receiver. Profiles of how moisture is distributed with height would be more useful and might lead to better weather forecasts. In this month’s column, a team of Swiss researchers discuss how they use data from a network of GPS receivers and the technique of tomography to obtain such profiles.
“Innovation” features discussions about advances in GPS technology, its applications, and the fundamentals of GPS positioning. The column is coordinated by Richard Langley, Department of Geodesy and Geomatics Engineering, University of New Brunswick.
Water vapor plays an essential role in the dynamics and thermodynamics of the atmosphere — especially storm systems — on local, regional, and global scales. It is a precursor of precipitation. Furthermore, a significant fraction of the energy released to the atmosphere comes from water vapor via latent heat. And much of the “greenhouse effect” is caused by the presence of water vapor in the atmosphere.
Beginning in 1992, a number of researchers successfully tested the hypothesis that the Global Positioning System (GPS) could be used to detect long- and short-term global and regional air-mass changes by estimating the amount of water vapor in the air above a GPS receiver. The arrival of GPS signals at a receiver is delayed by the presence of the Earth’s atmosphere. The satellite signals slow down when they encounter the atmosphere’s electrons, atoms, and molecules. In particular, the signals are affected by the presence of water vapor. Through a careful analysis of the GPS receiver’s measurements, the amount of water vapor along the signal path can be estimated. This is an integrated value that depends on the density of the water vapor molecules, or alternatively, the associated humidity at each point along the signal path. But from a single integrated value, there is no way to determine the profile of humidity — how the humidity varies with height above the surface. However, if a network of GPS receivers is deployed over a region, it is possible to determine the three-dimensional structure of humidity in the atmosphere above the receivers using tomography in a similar way to that used for medical imaging — albeit with radio waves rather than X-rays.
At the Swiss Federal Institute of Technology in Zurich (familiarly known by its German abbreviation ETH), we have developed the Atmospheric Water Vapor Tomography Software (AWATOS) for estimating humidity profiles. We have tested it with data from various measurement campaigns, including one in Hawaii. We have also used it to determine 40 humidity profiles over Switzerland with data from the Automated GNSS Network for Switzerland (AGNES) of the Swiss Federal Office of Topography, Swisstopo. And recently, we have implemented it in an operational testbed analyzing AGNES data together with observations from the Automated Swiss Weather Station Network (ANETZ) of the Swiss Federal Office of Meteorology and Climatology, MeteoSwiss.
To assess the potential of ground-based GPS water vapor tomography to support meteorological forecasting systems, the tomographic results must be available within near real-time and must be produced with an accuracy comparable to that of existing meteorological measurement techniques and numerical weather prediction models. With those goals in mind, we have carried out a project to determine humidity profiles in a region of the Swiss Alps. In this article, we outline the project, including the background theory, and discuss how we validated the results by comparing them to radiosonde measurements and weather prediction models.
Theoretical Background
Before looking at the project, we will briefly describe the theory behind our tomographic technique.
Radio Wave Refractivity. The propagation of radio waves through the Earth’s ionosphere and the electrically neutral atmosphere (the air) is accompanied by phase and amplitude variations caused by the varying refractive index of the media. Since the effect of the ionosphere on GPS signals can be removed almost completely by processing measurements on both the L1 and L2 frequencies, we are only concerned with the effect of the neutral atmosphere here. In 1951, Essen and Froome published a general formula for the refractive index of air, n, and the corresponding atmospheric refractivity, N, using the three meteorological parameters: total (barometric) air pressure, p, measured in hectopascals; air temperature, T, in kelvins; and the partial pressure of water vapor, e, in hectopascals (see Equation 1). The associated empirically determined constantsk1, k2,andk3 have been continuously improved over the years.
In the weighted mean formula for non-dispersive radio wave refractivity for air with 0.0375 percent carbon dioxide content, k1 is set to 77.6890 kelvins per hectopascal, k2 to 71.2952 kelvins per hectopascal, and k3 to 375463 kelvins-squared per hectopascal. The k1 term of Equation 1 can be associated with dry refractivity (Ndry), the refractivity of the dry constituents of air, and the second and third terms with the wet part (Nwet), which is proportional to the partial water vapor pressure.
Tropospheric Refraction. The speed of propagation of a radio wave is governed by the refractivity or index of refraction along the signal (slant) path. The path itself is determined by Snell’s Law relating angle of incidence to angle of refraction at the boundary of two media with differing refractive indices. As mentioned previously, GPS measurements include the additional or excess delay due to the presence of the neutral atmosphere. Since the bulk of the effect occurs in the lower, denser part of the atmosphere — the troposphere — we commonly refer to it as the tropospheric delay. The tropospheric slant path delay, , between station p and satellite r is defined by the following integral along the signal ray path, s:
By integrating the individual components of N in Equation 2 and applying Equation 1, the tropospheric slant path delay can be written as a function of the meteorological parameters p, T, and e.
Tropospheric delay as a function of the observation zenith angle, , (90° minus the elevation angle) is calculated using appropriate mapping functions. The mapping function, , is defined as the ratio of the electrical path length through the troposphere at a particular geometrical zenith angle to the electrical path length in the zenith direction. Typically, separate mapping functions are used for the dry and wet components. Furthermore, the slant wet delay, , for elevation angles down to 3 degrees can be represented as the sum of the isotropic term, ZWDp (zenith wet delay at station p) with its corresponding mapping function, and a non-isotropic component, :
The Tomographic Voxel Model. Separate slant delays only provide integrated measures of the tropospheric refractivity — a one-dimensional view, if you like. To get the three-dimensional structure of refractivity, we need a different approach. We divide the troposphere into small volume elements or voxels (short for volumetric pixel). With multiple, simultaneous raypaths criss-crossing the model volume, it is possible, in principle, to estimate the refractivity of each voxel and hence get a height profile of refractivity.
The tomographic voxel model is a three-dimensional geometrical structure with ellipsoidal borders. The grid spacing defines the resulting resolution of the tomographic analysis. In the horizontal plane, the voxel model covers the whole catchment area. For each voxel, an unknown but constant refractivity is introduced. Figure 1 illustrates the principle by means of one single observation.
FIGURE 1 Principle of GPS tomography. The refractivity in the atmosphere along the raypath of a GPS satellite signal to a ground-based receiver is discretized by a three- dimensional voxel model.
According to Equation 2, the wet part of the slant path delay ( ) for one observation between station p and satellite r can be expressed as a summation over each individual voxel i of the voxel model with a total of k voxels, through which the GPS signal passes:
The refractivity value, Ni, of each voxel is determined by performing a least-squares adjustment. A priori models and inter-voxel constraints can be introduced into the tomographic inversion system. The a priori tomographic model consists of selected voxels, which have externally estimated refractivity values. Inter-voxel constraints provide a spatially smoothing characteristic, as the actual state (or the refractivity) of the atmosphere is smoothly changing from point to point.
Double-Difference GPS Tomography. The software package AWATOS is based on double-difference GPS observations; that is, the difference of measurements made by a pair of receivers between a pair of satellites. Common errors such as those of satellite and receiver clocks difference out. The remaining errors in the observation equation are primarily just those due to atmospheric refraction. The influence of the ionosphere can be corrected to first order by using a linear combination of dual-frequency data as previously mentioned.
Therefore, in double-difference processing, the tropospheric slant path delay, , can be reconstructed by combining four observations (between two stations p and q and two satellites r and s). Similar to Equation 3, the total double-difference path delay, , can be written as a function of the GPS processing output (the zenith path delay, ZPD, and the double-difference phase residual ):
Usually, the dry and wet path delays are treated individually with appropriate models and mapping functions. This separation is carried out within the software package AWATOS for both the path delays and the phase residuals.
Introducing the double-difference slant path delays, , as well as the estimation of the zenith total delays, ZTD, for each station, a priori refractivity values, N0, and inter-voxel constraints , (with the scalar product condition ), into the tomographic equation system, the final form of the inversion equation for the unknown refractivity, N, according to Equation 4 including the design matrix A of the observations is:
To obtain only the wet part of the resulting refractivity field (values of refractivity and their gradients, , the individual components of the tomographic observation vector (the left-hand side of Equation 7) have to be correspondingly preprocessed. This is done by introducing additional meteorological observations or numerical data as well as tropospheric mapping functions and models.
Data Description
We recently carried out two measurement campaigns to study the feasibility of our method on a non-permanent densification network in the Swiss Alps. We were interested in investigating such a small-scale high-resolution configuration to see how it can help to determine and model water vapor over a local, mountainous catchment area. We also carried out these campaigns with an eye towards the development of a near real-time analysis procedure with a high update rate of less than one hour and the potential to support short- and medium-range weather forecasts and hydrological hazard assessment.
The Project Area. Two field campaigns, each lasting seven days, were carried out in an area of about 50 kilometers by 50 kilometers in the eastern part of the mountainous canton of Valais in the southwest of Switzerland (see Figure 2) in July and October 2005. This region was selected because of its high degree of exposure to hydrological hazards such as flooding of river valleys.
Figure 2. Project area (identified by the rectangle) in the Swiss Alps in the southwest of Switzerland. The elevation of the topography varies from 500 meters to over 4000 meters above mean sea level.
Besides the impact of the fast-changing meteorological situation in the project area, the rough topography is also a challenge for high-precision GPS analysis because of limited fields of view.
GPS Network and Meteorological Data. Ground-based geodetic GPS stations with dual-frequency receivers were deployed for continuous measurement during the period of the two campaigns. The network was complemented by permanent GPS stations from the national network. The ensemble of all stations used in July 2005 is portrayed in Figure 3.
Figure 3. The 21 GPS stations in the project area in the mountainous canton of Valais (see also Figure 2) used during the measurement campaign in July 2005. The stations’ altitudes vary between 527 meters (SION) and 3119 meters (ZER2).
In October 2005, the non-permanent three-dimensional geodetic Turtmann network was operated with six additional stations in the vicinity of the stations BRAE, SUST, and EMSH (see Figure 3). Furthermore, for this second campaign, data from three stations of the permanent geodynamics/tectonics network in Valais, TECVAL, in the northwestern part of the project area was available.
Several GPS stations were collocated with non-permanent meteorological measurement systems collecting surface temperature, humidity, and air pressure data. Also, rainfall was recorded for validation purposes at five ANETZ stations within the project area. The temperature, humidity, and air pressure observations were processed with the software package Collocation of Meteorological Data for Interpolation and Estimation of Tropospheric Path Delays (COMEDIE) developed at the Geodesy and Geodynamics Lab, ETH Zurich. COMEDIE provides a four-dimensional modeling of meteorological data in space and time. It is based on the method of least-squares collocation and interpolation, meaning that the model is described by a functional and a stochastic part. The interpolated data was used for the separation of the total delay (and refractivity) into a dry and a wet part and to obtain a priori values, N0, for the tomographic analysis (see Equation 7).
To compare the results from GPS processing and tomography, independent measurement techniques were used during the measurement campaigns: solar spectrometry, using the Geodetic Mobile Solar Spectrometer (GEMOSS), for integrated path delays as well as weather balloon soundings up to the tropopause for meteorological profile data.
The Numerical Weather Model COSMO-7. MeteoSwiss uses the COSMO-7 model, developed by the Consortium for Small-scale Modelling, for its operational numerical weather forecasts. The model domain is covered by a grid of 383 × 325 points over western and central Europe with a horizontal resolution of 7 kilometers. The model consists of 45 levels vertically distributed between the filtered orography (or mountain topography) and an altitude of 22.5 kilometers.
For comparison and validation, a subset of the reanalyzed COSMO-7 vertical grid point profile data was processed in order to obtain refractivity profiles as well as integrated and interpolated time series of zenith path delays using another of our software packages, Collocation and Interpolation of Tropospheric Path Delays (COITROPA).
Results
We processed the GPS data from the two measurement campaigns and have compared the results with those from GEMOSS, COMEDIE, radiosonde data, and COSMO-7.
GPS Data Processing. The GPS processing yields high-quality receiver coordinates, tropospheric parameter estimates (ZPD), and ionosphere-free double-difference residuals to reconstruct the slant path delays (see Equation 5). International GNSS Service (IGS) precise products, including satellite orbits, were used to analyze the data, and for ray tracing in AWATOS.
Bernese GPS Software, version 5.0, was chosen for the processing of the GPS data due to its flexibility, modular design, and state-of-the-art modeling characteristics. The network solution was obtained by using minimally constrained coordinates of selected stations of the IGS reference frame with baseline lengths of up to 1,000 kilometers. The mean repeatabilities for the north, east, and up components of the daily coordinate solutions for all stations within the project area are given in Table 1. Final as well as ultra-rapid orbits and broadcast ephemerides were used to compare the best possible results with those that could be expected in real time.
The larger number of stations during the October campaign has a positive influence on the mean coordinate repeatabilities in the horizontal plane, whereas the up component remains at the same order of magnitude. Depending on the antenna and receiver types, there was a slightly positive or negative correlation discovered between the trend of the daily coordinates and the ZTD estimates.
Comparison of ZTD Time Series. The time series of zenith total delays (ZTD) from GPS, GEMOSS, integrated ground meteorological data (COMEDIE), and radiosondes coincide well. In particular, the passage of a cold front with heavy rainfall in the middle of the October 2005 campaign is reflected in the two local delay maximums on October 23 (see Figure 4).
Figure 4. Comparison of zenith total delay (ZTD) at station SUST obtained with COMEDIE, GPS, the local radiosondes (RS) and solar spectrometry (GEMOSS) for the October campaign in 2005. The mean values of the ZTD time series and the standard deviation are given for each technique for comparison purposes in parentheses.
The ZTD from the balloon soundings show an almost systematic overestimation. This may be due to an inaccurate self-calibration of the sensors or a lack of data in the upper atmosphere, and the related mismodeling of the zenith path delay. Differences in the COMEDIE time series are due to meteorological inhomogeneities in the lowest part of the troposphere and the influence of distant radiosondes, which were added to get the vertical information in the upper part. The interpolated ZTD values derived from the numerical weather model COSMO-7 are on average smaller than the GPS estimates (see Table 2).
The ZTD time series of both methods, GPS and the numerical weather model, correlate well with rainfall data. There is a slow increase of the zenith path delay before the precipitation event due to the accumulation of atmospheric water vapor and an abrupt decrease afterwards. Usually, the impact of short periods of localized precipitation is more clearly represented in the GPS data of the dense observation network than in the data of the weather model. The COSMO-7 time series seem to be too smooth.
Effect of Voxel Model Resolution. In order to assess the quality of the results obtained by applying the high-resolution GPS tomographic technique, special time series contour plots were created. They consist mainly of the wet refractivity profiles for each voxel model column between mean sea level and an altitude of 10 kilometers. The height of the nearest GPS station is given by a dashed line.
Figure 5 and Figure 6 give two examples from station SUST in the northwest of the project area (see Figure 3) during the October 2005 campaign. Figure 5 shows the wet refractivity variation from a 16-layer voxel model with 5-kilometer horizontal grid spacing, whereas Figure 6 was calculated with 32 layers with the same horizontal resolution.
Figure 5. Vertical wet refractivity distribution (in parts per million) from a 16-layer voxel model (the increasing vertical distances with height of the voxels are given by black tick marks on the left-hand side) in October 2005. The time series of integrated wet delays (ZWD) from 15 radiosondes (RS), the interpolated profiles from the numerical weather model COSMO-7, and the GPS tomographic results (AWATOS) are shown for comparison purposes with a corresponding scale on the right-hand side. Mean values and their standard deviations are shown in parenthesesFigure 6. Vertical wet refractivity distribution (in parts per million) from a 32-layer voxel model over the timespan of the October campaign in 2005 and ZWD time series of integrated AWATOS, COSMO-7, and the corresponding radiosonde (RS) profiles for comparison purposes.
The integrated wet refractivity profiles and the reference radiosonde measurements agree better the more layers that are introduced into the tomographic voxel model. The largest differences between the results with different numbers of layers can be detected in the middle troposphere between 4- and 6-kilometers altitude (see Figure 7). It is also recognizable that in the lower troposphere, voxel models with a large number of layers are even able to resolve refractivity inversions.
Figure 7. Tomographic wet refractivity profiles (in parts per million) from 16-, 26-, and 43-layer voxel models, and that of the corresponding radiosonde (RS) launched at station GRUB at 1844 meters above mean sea level on July 13, 2005, 17:04 UTC.
We analyzed tomographic voxel models with horizontal resolutions of 15, 10, 7.5, 5, 3.75, and 3 kilometers. Increasing the horizontal resolution of the model leads to an increase in the estimated wet refractivity above an altitude of 6 kilometers compared to both the radiosondes and the numerical weather model. Due to the mean distance of about10 kilometers between the ground-based GPS stations in the project area, the best results were obtained with a similar resolution.
Table 3 gives the results of the comparison between the wet refractivity profiles of the tomographic analysis and the radiosondes launched within the project area.
Effect of Temporal Resolution. The tomographic results shown here are based on one-hour time windows for the GPS double-difference data. Higher update rates are also possible without changing the input options of AWATOS. Figure 8 shows the wet refractivity variation based on a 10-minute window together with rainfall data at the ANETZ station Evolène in the western part of the project area.
Figure 8. Wet refractivity distribution at station Evolène (EVOL) in the western part of the project area from a 26-layer tomographic voxel model with an update interval of 10 minutes. Rainfall data in millimeters per 10 minutes is shown as vertical bars with the corresponding scale on the right-hand side.
Even though the wet refractivity profiles are affected by higher-frequency variations in the upper troposphere, precipitation and weather changes are still recognizable in the 10-minute time series.
Although the Bernese GPS Software is not designed for real-time parameter estimation, near real-time conditions can be simulated by introducing specific input files. Thus, the sensitivity of AWATOS to real-time conditions can be assessed. In terms of coordinate repeatability, the results of the horizontal components degrade by about 30 percent when using the predicted part of the ultra-rapid products (see also Table 1). Using broadcast ephemerides, the three-dimensional accuracy suffers even more.
Implications. We collected input data for both the spatially and temporally high-resolution GPS tomographic analysis and the validation of the results. The inhomogeneous distribution of rainfall in the local project area would necessitate even more rain gauges in the meteorological measurement network to perform a hydrological hazard assessment.
The comparison of independent techniques showed that the ZTD time series agree within 2 centimeters on average; that is, to better than 1 percent. The correlation of the GPS data and the data derived from the numerical weather model is greater than 70 percent. However, local rain showers are sometimes more clearly represented by the data of the dense GPS network than by COSMO-7.
It is possible to increase the spatial and temporal resolution in GPS tomography, so it can enhance numerical weather models. The better agreement of the tomographic profiles with radiosonde data, compared to the COSMO-7 estimates, indicates that the numerical weather prediction models will benefit from additional information on the vertical distribution of water vapor provided by high-resolution GPS tomography.
To assess the potential of near real-time GPS tomography, IGS satellite products with short latency and fast update rates were tested in the GPS processing. With ultra-rapid orbits, we obtained satisfactory results for the tropospheric parameters in almost real-time mode. The use of predicted orbits in the tomographic processing degrades the results of the wet refractivity profiles by 20 percent compared to using final (that is, best available) products.
Conclusions
In this brief article, we have shown that high-resolution GPS tomography is well suited for application in mountainous regions, especially in view of its potential to contribute to hydrological hazard assessment. We have been able to estimate the wet refractivity field with a spatial
and temporal resolution comparable with the current and the next generation of numerical weather models (COSMO-2 with 2-kilometer horizontal resolution).
We have been successful in illustrating several beneficial aspects of GPS tomography in supporting high-resolution numerical weather prediction models. We would also point out that tomographically determined wet refractivity fields may also be used in conjunction with directly estimated integrated slant path delays to adjust the GPS observations, especially those obtained at low elevation angles. Implemented in GPS processing software, GPS tomography could provide completely anisotropic tropospheric corrections for very high-accuracy positioning applications.
Acknowledgments
The research discussed in this article was financially supported by the Swiss National Science Foundation and the Swiss Geodetic Commission.
The Swiss Federal Office of Meteorology and Climatology, MeteoSwiss, and the Swiss Federal Office of Topography, Swisstopo, provided necessary data sets for processing, analyzing, and validating the results.
Furthermore, O. Heller and Dr. A. Somieski supported the field work and several residents or public organizations in the canton of Valais offered their premises for temporary mounting of the campaign measurement systems.
SIMON LUTZ is a research fellow at the Astronomical Institute of the University of Bern, Switzerland, and a member of the Center for Orbit Determination in Europe analysis center team. He received M.S. and Ph.D. degrees in geodesy and geodynamics from the Swiss Federal Institute of Technology (ETH), Zurich, Switzerland.
MARC TROLLER is a communications, navigation, and surveillance (CNS) expert at Swiss Air Navigation Services Ltd., Skyguide, Switzerland. He received M.S. and Ph.D. degrees in geodesy and geodynamics from ETH Zurich.
DONAT PERLER is a Ph.D. candidate at ETH Zurich. He received an M.S. degree in computer science from ETH Zurich.
ALAIN GEIGER is a professor in the Geodesy and Geodynamics Lab of the Institute of Geodesy and Photogrammetry at ETH Zurich. He received an M.S. degree in physics and a Ph.D. in geodesy and geodynamics, both from ETH Zurich.
HANS-GERT KAHLE is professor emeritus of geodesy and geodynamics at ETH Zurich and was leader of the Geodesy and Geodynamics Lab from 1979 to 2009. He received a Ph.D. degree from the University of Kiel, Germany, and the habilitation in geophysics from ETH Zurich.
FURTHER READING
• Seminal Paper on Use of GPS for Meteorology
“GPS Meteorology: Remote Sensing of Atmospheric Water Vapor Using the Global Positioning System” by M. Bevis, S. Businger, T.A. Herring, C. Rocken, R.A. Anthese, and R.H. Ware in Journal of Geophysical Research, Vol. 97, No. D14, 1992, pp. 15787–15801, doi:10.1029/92JD01517.
• Other Studies on Using GPS to Monitor the Atmosphere
“Using the Global Positioning System to Study the Atmosphere of the Earth: Overview and Prospects” by J.L. Davis, M.L. Cosmo, and G. Elgered in GPS Trends in Precise Terrestrial, Airborne, and Spaceborne Applications edited by G. Beutler, G.W. Hein, W.G. Melbourne, and G. Seeber, editors, Volume 115 of the International Association of Geodesy Symposia, Springer Verlag, Berlin, 1996, pp. 233–242.
“GPS Meteorology: Direct Estimation of the Absolute Value of Precipitable Water” by J. Duan, M. Bevis, P., Fang, Y. Bock, S. Chiswell, S. Businger, C. Rocken, F. Solheim, T. van Hove, R. Ware, S. McClusky, T.A. Herring, and R.W. King in Journal of Applied Meteorology, Vol. 35, No. 6, 1996, pp. 830–838, doi:10.1175/1520-0450(1996)035<0830:GMDEOT>2.0.CO;2.
• Effect of the Atmosphere on GPS Positioning
“Atmospheric Modelling in GPS Analysis and Its Effect on the Estimated Geodetic Parameters” by T.R. Emardson and P.O.J. Jarlemark in Journal of Geodesy, Vol. 73, No. 6, 1999, pp. 322–331, doi:10.1007/s001900050249.
“Determination of the Spatial and Temporal Variation of Tropospheric Water Vapour Using CGPS Networks” by M. Troller, A. Geiger, E. Brockmann, and H.-G. Kahle in Geophysical Journal International, Vol. 167, No. 24, 2006, pp. 509–520, doi:10.1111/j.1365-246X.2006.03101.x.
“Diagnosis of Three-Dimensional Water Vapor Using a GPS Network” by A.E. MacDonald, Y. Xie, and R.H. Ware in Monthly Weather Review, Vol. 130, No. 2, 2002, pp. 386–397, doi:10.1175/1520-0493(2002)130<0386:DOTDWV>2.0.CO;2.
“3-D Refractivity Field from GPS Double Difference Tomography” by M. Troller, B. Bürki, M. Cocard, A. Geiger, and H.-G. Kahle in Geophysical Research Letters, Vol. 29, No. 24, 2149, 2002, 4 pp. doi:10.1029/2002GL015982.
• Radio Wave Refractivity of Air
“Refractive Index Formulae for Radio Waves” by J.M. Rüeger in Proceedings of the XXII International Federation of Surveyors (FIG) International Congress, Washington, D.C., April 19–26, 2002.
• Previous GPS World Articles on Tropospheric Propagation Delay
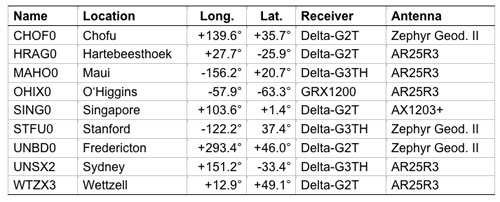
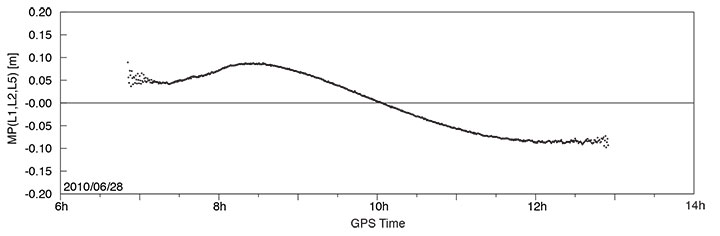
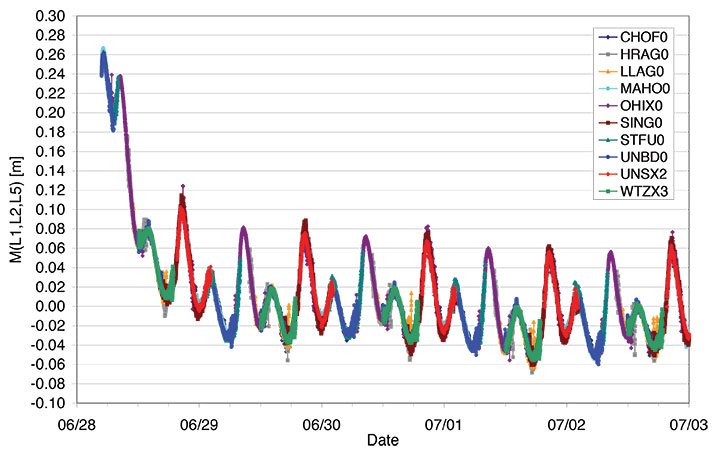
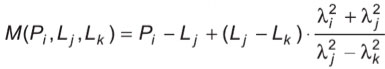
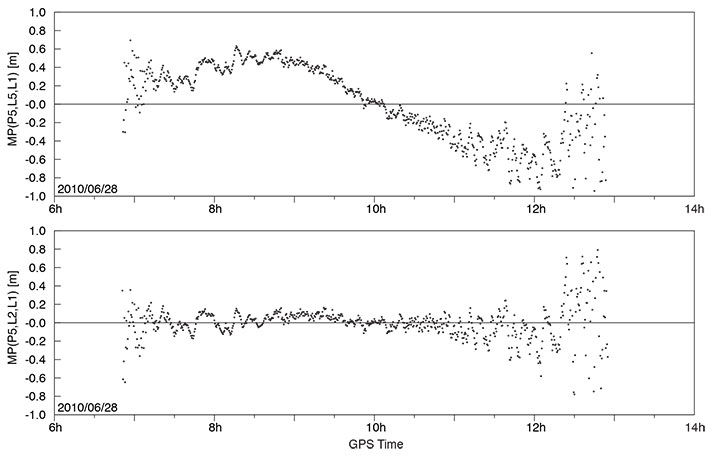
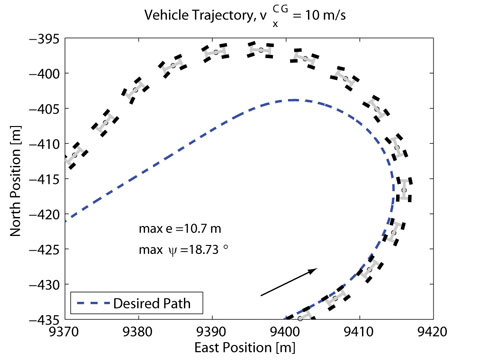
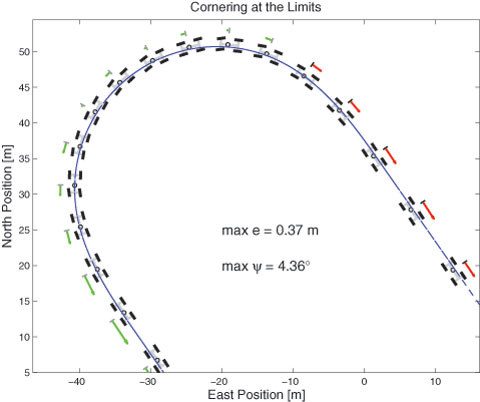
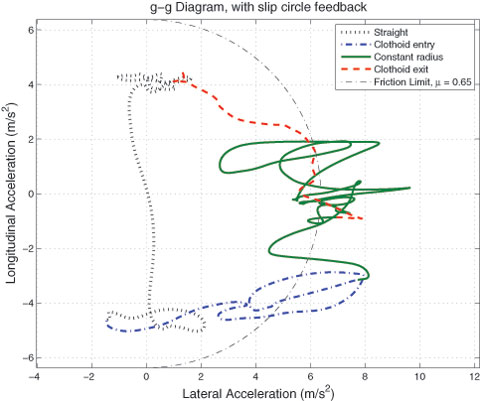
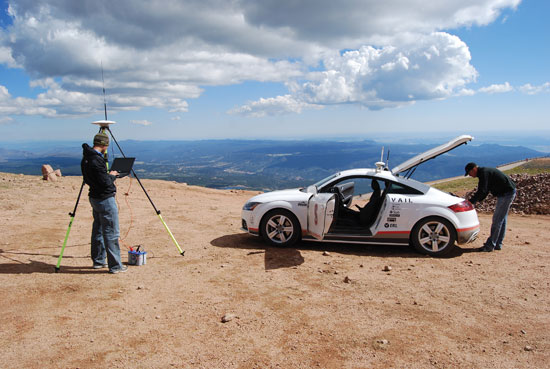

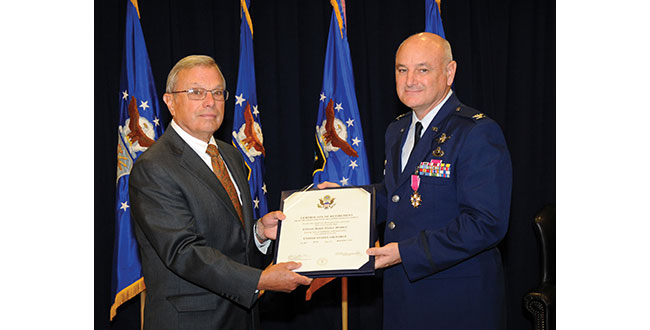


 The Elephant Charge (“Dust, Sweat, and Gears”), an annual off-road motorsport charity event, brings together competitors, their families, and supporters for a wilderness weekend of GPS-driven fun and frenzy in the Zambian bush. I’m for fun, but I always wince when I see folks tearing up habitat in the name of saving it.