Capitol Appraisal Group Inc. (CAGI) has contracted with the Sidwell Co., asking it to provide a system to inventory, value, and keep track of oil and gas infrastructure and the land parcels on which they are built.
CAGI provides appraisal and information services to governmental entities primarily for the purpose of property taxation. It contracted with Sidwell after deciding to pursue a geographic information system that would facilitate the collection of field appraisal data.
This project will be completed in three phases, according to Sidwell and CAGI. The first phase includes review of the typical workflow for field data collection as performed by CAGI technicians, development of a prototype database design, creation of custom forms for ArcPad data capture, and the design and implementation of a system to associate digital camera images directly to records in the ArcPad database.
Phase Two will consist of refinement of the data capture forms and database design to enhance the data collection workflow, and on-site installation, configuration, testing, and training. Phase Three, the enterprise deployment of the entire system, will include installation and configuration of ESRI’s ArcGIS Server, data loading and tuning, technical consulting, and ArcGIS Server administrator training, according to Sidwell and CAGI.
I try to stay current on all the business happenings, product introductions, etc. throughout the year and occasionally report on them.
Back in my November 2008 column, I discussed the huge price disparity between various real-time kinematic (RTK) systems on the market. One of the products I featured was the Spectra Precision Epoch 25. I featured it because it was being offered at a very low price (comparatively speaking) at approximately U.S. $19,000, including UHF radios for a base/rover configuration. Granted, the Epoch 25 doesn’t offer GLONASS support or support for GPS L2C or L5, but for the price, you couldn’t really argue.
Spectra Precision is owned by Trimble. Trimble uses the Spectra brand to address the low-price market so they can hold the prices on the Trimble branded systems like the R8 GNSS. One of the ways to create a differentiation between products is to not offer as many features on the low-end product (eg. Epoch 25 vs. R8 GNSS).
Just last week, Spectra introduced the Epoch 35 GNSS system. It adds a few features like GLONASS, Bluetooth, internal radio, and all-around better packaging. What makes this interesting is the addition of GLONASS to their low-end RTK system. It significantly narrows the feature gap between Trimble’s high-end and Spectra/Trimble low-end RTK systems. Something’s going to give at some point if they keep adding features to the low-end RTK systems. The Epoch 35 GNSS system price is “only” U.S. $32,900, compared to a Trimble R8 GNSS for US$56,000.
I think what it’s showing us is the trend of high-precision RTK system pricing. The trend is heading downward, and it’s not just due to the economy. The reduction of pricing for RTK systems is going to happen no matter what the economy does (granted the economy may accelerate the trend).
High-precision RTK systems are going to follow the path of notebook computers with respect to price and features. With notebook computers, each year they are faster, brighter, and packed with new features. Last year’s model is still offered, but at a lower selling price. As RTK system manufacturers attempt to hold the pricing on high-end systems, I think you’ll see more and more features packed into those premium systems, while the low-end systems also become more powerful.
Sokkia/Topcon
We haven’t seen the fallout of the Sokkia/Topcon merger yet.
At this point, Sokkia products are still using Novatel (now owned by Leica) GNSS technology via their joint venture called Point Inc. In 2009, I think you’ll see that starting to change. First of all, you’ll see Sokkia products starting to ship with Topcon GNSS technology. Actually, maybe you won’t see it. Maybe they’ll make the transition transparent … imagine what the local Topcon dealer would do if, all of the sudden, the local Sokkia dealer was selling “Topcon Inside” products with a Sokkia label? I’m sure the Topcon/Sokkia marketing bobble-heads have put some thought into that transition already.
Also, I’ve written this before and I still believe it. Topcon/Sokkia will be the new Trimble/Spectra Precision. Topcon will address the premium, high-end market while Sokkia will address the entry-level, low-end market. It makes a lot of sense since they are already positioned in the market that way. I could see Sokkia being the entry-level RTK brand that addresses basic RTK functionality while Topcon would provide leading-edge GNSS technology plus other sensor integration such as laser, gyro, inertial navigation, etc.
On the subject of Sokkia, their GNSSS products appear to offer a very good value. GLONASS is standard in the GSR2700 ISX and it supports modernized GPS signals (L2C and L5), so it’s not affected by the impending (albeit twelve years from now) Civil P/Y phase-out. When compared side-by-side with the Spectra Epoch 35 GNSS, the Sokkia system looks pretty favorable. I haven’t used either one so don’t take that as a stamp of approval. I was just comparing the system specifications.
The challenge for Sokkia is not one of technical specifications, but one of product distribution and reputation. They just never got any momentum going in the GNSS business. It will be interesting to see how the Topcon/Sokkia merger addresses that.
So this year will be the beginning of the battle between Trimble/Spectra and Topcon/Sokkia. You have to give Topcon some credit. They’ve really pulled it together this decade and put together a formidable GNSS product line-up. This isn’t to say that Trimble hasn’t been on its game. They’ve been scooping companies right and left to fortify their position.
Where Does That Leave The Rest?
Trimble, Topcon and Leica own 75 percent of the world’s high precision GNSS business. Leica doesn’t currently have a dual-brand strategy like Trimble/Spectra and Topcon/Sokkia. One could say that Novatel is their other brand, but Novatel is strictly an OEM manufacturer that doesn’t have a retail presence in the survey/construction market.
The other 25 percent of the market share is held by Magellan, Javad, Septentrio, Hemisphere, Navcom, and Novariant. They all have commercially viable GNSS technology, but struggle to develop a solid distribution channel to push their products into the survey/construction market. Whereas 10 years ago there were some companies available to partner with that had a strong market presence in the survey/construction market, in 2009 there are virtually none. All of the significant players are paired up and spoken for. It will take some very creative thinking to establish alternative methods of distributing their products into this increasingly competitive high-precision GNSS market.
A portable spoofer implemented on a digital signal processor mounts a spoofing attack, characterizes spoofing effects, and suggests possible defense tactics. GNSS users and receiver manufacturers should explore and implement authentication methods against sophisticated spoofing attacks.
By Todd E. Humphreys, University of Texas, Brent A. Ledvina, Virginia Tech, Mark L. Psiaki, Brady W. O’Hanlon, and Paul M. Kitner, Jr., Cornell University
Seven years after the Volpe Report warned that “[a]s GPS further penetrates into the civil infrastructure, it becomes a tempting target that could be exploited by individuals, groups, or countries hostile to the U.S.,” civil GPS receivers remain as vulnerable as ever to this threat. Among other types of interference, the Volpe report considers civil GPS spoofing, a pernicious type of intentional interference whereby a GPS receiver is fooled into tracking counterfeit GPS signals. More sinister than intentional jamming, spoofing deceives the targeted receiver, which cannot detect a spoofing attack and so cannot warn users that its navigation solution is untrustworthy. The Volpe report noted the absence of any off-the-shelf defense against civilian spoofing and lamented that “[t]here also is no open information on . . . the expected capabilities of spoofing systems made from commercial components.” It recommended studies to characterize the spoofing threat: “Information on the capabilities, limitations, and operational procedures [of spoofers] would help identify vulnerable areas and detection strategies.”
We recently canvassed four manufacturers of high-quality GPS receivers. They revealed that they were aware of the spoofing vulnerability but had not taken steps to equip their receivers with even rudimentary spoofing countermeasures. The manufacturers expressed skepticism about the seriousness of the threat and noted that countermeasures, if required, had better not be too expensive. Such attitudes propel further examination of the threat and practical countermeasures.
Important research into spoofing countermeasures during the last decade begins with an internal memorandum from the MITRE Corporation recommending these techniques to counter spoofing:
Amplitude discrimination
Time-of-arrival discrimination
Consistency of navigation inertial measurement unit (IMU) cross-check
Polarization discrimination
Angle-of-arrival discrimination
Cryptographic authentication
The first two techniques could be implemented in software on GPS receivers, but would be effective against only the most simplistic attacks. The next three tactics would be effective against some — but not all — more sophisticated attacks. In particular, angle-of-arrival discrimination, which exploits differential carrier-phase measurements taken between multiple antennas, could only be spoofed by a sophisticated coordinated spoofing attack (discussed later). However, they require additional hardware: multiple antennas or a high-grade IMU, whose cost militates against widespread adoption.
Cryptographic authentication, the last technique on the list, has received detailed study since 2001. Logan Scott offered several levels of authentication in a 2003 ION GPS/GNSS paper and urged their prompt adoption in a GPS World op-ed column in July 2007. His methods are backward-compatible with non-compliant GPS receivers. Spreading-code authentication, the basis for his Level 2 and 3 authentication, entails embedding messages in the GPS ranging codes and periodically authenticating these messages. Because this method effectively binds a digital signature to the ranging codes, it would render a compliant receiver practically impervious to a spoofing attack except during the short interval between reception and authentication of the embedded messages.
These cryptographic techniques all require modification of the civil GPS signal structure. Such changes appear extremely unlikely in the short term because, as one experienced observer noted, “signal definition inertia is enormous.” A less effective but more practical approach over the United States would be to authenticate only the WAAS signal managed by the U.S. Department of Transportation and the Federal Aviation Administration. Since the WAAS signal is constructed on the ground and transmitted via bent-pipe communication spacecraft, it is more amenable to immediate modification. Even so, efforts to persuade WAAS officials to adopt spreading code authentication have so far proven fruitless.
The Homeland Security Institute, a research arm of the U.S. Department of Homeland Security, has also considered the threat of civil GPS spoofing. On its website it has posted a report listing seven spoofing countermeasures. The proposed countermeasures include the first three techniques from the list here. Some of the remaining four countermeasures would be trivial to spoof. None of the seven would adequately defend against a sophisticated attack. Nonetheless, the posting claims that its proposed techniques “should allow suspicious GPS signal activity to be detected.” We worry that such optimistic language in such a prominent posting will mislead many readers into believing that the spoofing threat has been adequately addressed.
Our goals here are to assess the spoofing threat and develop and test practical and effective countermeasures. To advance these goals we found it necessary to go through the exercise of building a civil GPS spoofer. The process of developing a complete portable spoofer allows one to explore the range of practical spoofing techniques. Thus one discovers which aspects of spoofing are hard and which are easy to implement in practice. With this information, we can more accurately assess the difficulty of mounting an attack, and receiver developers can prioritize their defenses by choosing countermeasures that are effective against easily implementable spoofing techniques.
Software-defined GPS receivers furnish a natural platform for the study of civil spoofing and its effects. In a software receiver, real-time correlators, tracking loops, and navigation solver are all implemented in software on a programmable processor.
Initial Threat Assesment
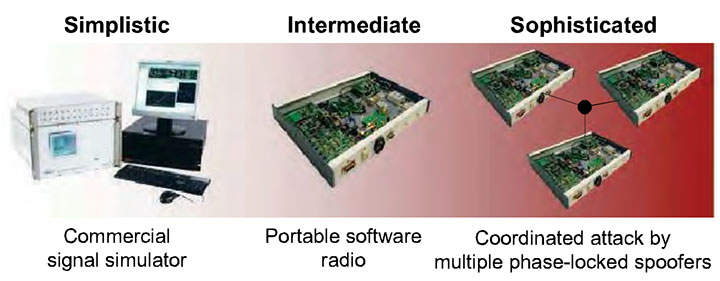
Consider the spoofing threat continuum in FIGURE 1, roughly divided into simplistic, intermediate, and sophisticated spoofing attacks for threat analysis.
FIGURE 1. The spoofing threat continuum: simplistic, intermediate, and sophisticated spoofing attacks.
Simplistic Attack via Simulator. As far as we know, all stand-alone commercial civilian GPS receivers available today are trivial to spoof. One simply attaches a power amplifier and an antenna to a GPS signal simulator and radiates the RF signal toward the target receiver. A successful attack along these lines was demonstrated by researchers at Argonne National Laboratories in 2002.
Despite the ease of such an attack, it has some drawbacks. One is cost: the price of modern simulators can reach $400,000. Simulators can be rented for less than $1,000 per week, making them accessible for short-term mischief, but long-term use remains costly. Size is another drawback. Most GPS signal simulators are heavy and cumbersome. If used in the simplest attack mode, situated close to a target receiver’s antenna, a signal simulator would be challenging to plant and visually conspicuous. Of course, if the custodian of the target receiver is complicit in the spoofing attack — as is the case, for example, with the fishing vessel skipper who spoofs the onboard monitoring unit to fish undetected in forbidden waters — the conspicuousness of the signal spoofer is irrelevant.
The menace posed by such an attack is diminished by the fact that it is likely easy to detect, because of the difficulty of synchronizing a simulator’s output with the GPS signals in its vicinity. An unsynchronized attack effectively acts like signal jamming, and may cause the victim receiver to lose lock and have to undergo a partial or complete reacquisition. Such a forced re-acquisition would raise suspicion of a spoofing attack. If the unsynchronized attack somehow avoids causing loss-of-lock, it will nonetheless cause an abrupt change in the victim receiver’s GPS time estimate. The victim receiver could flag jumps of more than 100 nanoseconds as evidence of possible spoofing. The spoofer can attempt to counter this defense by intentionally jamming first and then spoofing, but an extended jamming is itself telltale evidence of interference.
Of course, the fact that a simulator-type attack is easy to defend does not increase security. A gaping vulnerability will remain until civil GPS receivers at least are equipped with the rudimentary spoofing countermeasures required to detect a simulator-type attack.
Intermediate Attack. One of the challenges that must be overcome to carry out a successful spoofing attack is to gain accurate knowledge of the target receiver antenna’s position and velocity. This knowledge is required to precisely position the counterfeit signals relative to the genuine signals at the target antenna. Without such precise positioning, a spoofing attack is easily detected.
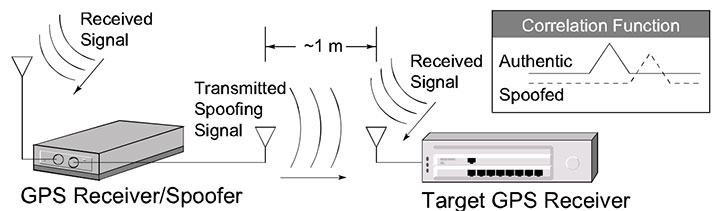
An attack via portable receiver-spoofer, portrayed in FIGURE 2, overcomes this difficulty by construction. The receiver-spoofer can be made small enough for inconspicuous placement near the target receiver’s antenna. The receiver component draws in genuine GPS signals to estimate its own position, velocity, and time. Due to proximity, these apply approximately to the target antenna. Based on these estimates, the receiver-spoofer then generates counterfeit signals and generally orchestrates the spoofing attack. The portable receiver-spoofer could even be placed somewhat distant from the target receiver if the target were static and its position relative to the receiver-spoofer had been pre-surveyed.
FIGURE 2. Illustration of a spoofing attack via portable receiver-spoofer.
Each channel of the target receiver is brought under control of the receiver-spoofer as illustrated in the inset at the upper right of Figure 2. The counterfeit correlation peak is aligned with the peak corresponding to the genuine signal. The power of the counterfeit signal is then gradually increased. Eventually, the counterfeit signal gains control of the delay-lock loop tracking points that flank the correlation peak.
As one might imagine, there are no commercially available portable receiver-spoofer devices. This of course decreases the present likelihood of the receiver-spoofer attack mode. Nonetheless, the emergence of software-defined GPS receivers significantly erodes this barrier. As we demonstrate here, the hardware for a receiver-spoofer can be assembled from inexpensive off-the-shelf components. The software remains fairly sophisticated, but it would be unwise to assume it was beyond the capabilities of clever malefactors. The civil GPS signal structure is, after all, completely detailed in a publicly available interface control document, and entire books have been written on software-defined GPS receivers. In perhaps the most worrisome scenario, anticipated in Scott’s 2003 paper, the software definition of a receiver-spoofer may someday be available for download from the Internet. The expertise required to download and exercise the code would surely be within the reach of many potential malefactors.
An attack via portable receiver-spoofer could be difficult to detect. The receiver-spoofer can synchronize its signals to GPS time and, by virtue of its proximity to the target antenna, align the counterfeit and genuine signals. A receiver equipped with a stable reference oscillator and a low-drift inertial measurement unit (IMU, for receivers on dynamic platforms) could withstand an attack via receiver-spoofer for several hours. Eventually, however, a patient receiver-spoofer would gain undetected control by keeping its perturbations to time and position within the envelope allowed by the drift rates of the target receiver’s oscillator and IMU.
The only known user-equipment-based countermeasure that would be completely effective against an attack launched from a portable receiver-spoofer with a single transmitting antenna is angle-of-arrival discrimination. With a single transmitting antenna, it would be impossible to continuously replicate the relative carrier phase between two or more antennas of an appropriately equipped target receiver.
While an intermediate attack is not presently likely because the requisite device is not readily available, the emergence of software-defined GPS receivers increases its future likelihood. Furthermore, this mode of attack could defeat most known user-equipment-based spoofing countermeasures.
Sophisticated Attack. The angle-of-arrival defense against a portable receiver-spoofer can be thwarted by a coordinated attack with as many receiver-spoofers as antennas on the target receiver. Imagine a receiver-spoofer the size of a pack of cards, small enough to mount directly atop a target antenna. The receiver-spoofer’s receiving and transmitting antennas are situated respectively on the upper and lower faces of the device and are shielded to avoid self-spoofing. Now imagine several such devices sharing a common reference oscillator and communication link, with each device mounted to one of the target receiver’s antennas. The angle-of-arrival defense fails under this attack scenario.
Naturally, this attack inherits all of the challenges of mounting a single receiver-spoofer attack, with the additional expense of multiple receiver-spoofers and the additional complexity that the perturbations to the incoming signals must be phase-coordinated.
The only known defense against such an attack is cryptographic authentication.
Thus, an attack via multiple phase-locked portable receiver-spoofers is somewhat less likely than an attack via single portable receiver-spoofer, but may be impossible to detect with user-equipment-based spoofing defenses.
Target Spoofer Type. The foregoing discussion of the spoofing threat continuum suggests that a spoofing attack via GPS signal simulator poses the greatest near-term threat. However, there are known effective defenses against such an attack, and these can be implemented in software on commercial GPS receivers. In contrast, an attack launched from one or more portable receiver-spoofer(s) poses the greatest long-term threat. Known user-equipment-based defenses against such attacks are few and of limited effectiveness. Accordingly, we focus here on the portable receiver-spoofer attack mode. To better understand this mode, we built a software-defined portable receiver-spoofer as a research platform.
Architecture
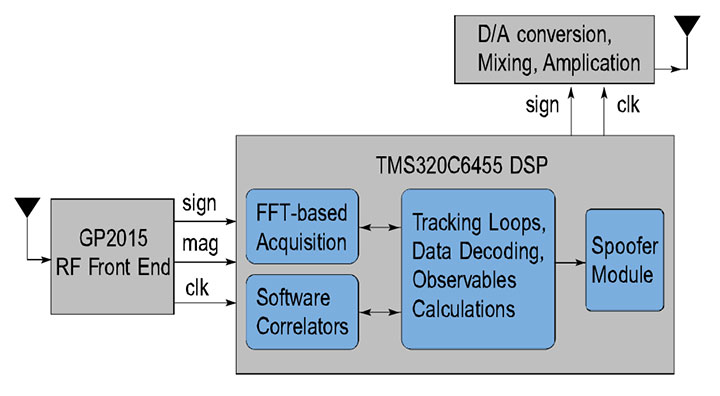
We developed a software-defined receiver-spoofer as an extension of the Cornell GRID receiver, adding a spoofer software module and transmission hardware; see FIGURE 3.
FIGURE 3. Block diagram of the reciever-spoofer architecture.
Receiver Module. The hardware consists of an RF front end, a complex programable logic device (CPLD) for signal multiplexing (not shown), and a digital signal processor (DSP). The receiver software includes a full navigation solution engine. Software is entirely written in natural-language C++ to facilitate code development and maintenance.
The software correlation engine, based on a bit-wise parallel correlation technique, is crucial to meeting real-time deadlines in the receiver-spoofer under the simultaneous burdens of receiver processing and spoofing. Here is an overview.
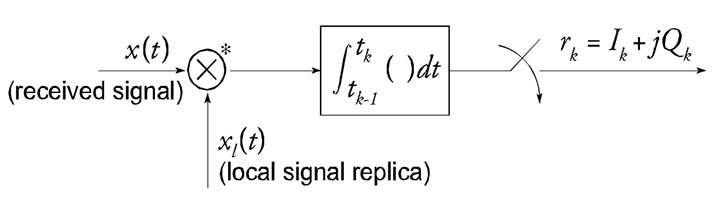
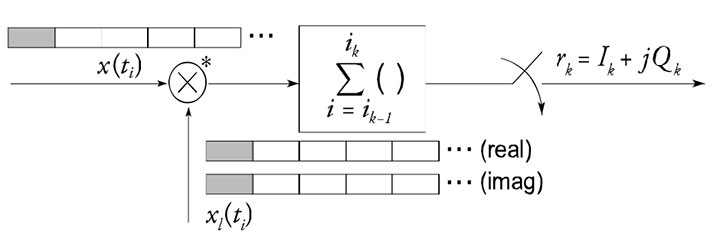
FIGURE 4 depicts the standard correlation operation that occurs within any GPS receiver. The incoming signal x(t) is mixed by complex multiplication with a complex local signal replica, xl(t). The product is integrated over a short interval (typically 1–20 milliseconds) and sampled to produce the quadrature baseband components Ik and Qk , also known as baseband accumulations.
FIGURE 4. Standard correlation operation. The local signal replica xl(t) is complex and ⊗* denotes complex multiplication.
FIGURE 5 depicts a byte-wise software implementation of the standard correlation operation. In this implementation, the individual signal samples are stored in 8-bit bytes.
FIGURE 5. Byte-wise implementation of the correlation operation. Boxes in the signal trains represent bytes, each of which stores an 8-bit signed representation of the signal x or of the complex local replica xl. Grayed boxes represent the operands of one complex multiplication operation.
Because many DSPs and general-purpose CPUs are capable of performing several multiply-and-accumulate operations in parallel (for example, eight in high-performance fixed-point DSPs), the byte-wise implementation can be quite computationally efficient. However, storing the local carrier and code replica samples as bytes makes the tables in which they are packed for efficient table look-up prohibitively large for storage in on-chip (fast) memory. Furthermore, despite its computational efficiency, the byte-wise implementation is still only one-quarter to one-half as fast as the bit-wise parallel implementation when implemented on a high-performance fixed-point DSP.
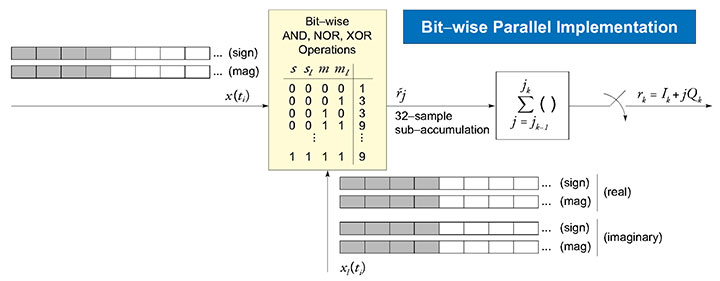
FIGURE 6 depicts the bit-wise parallel correlation implementation. The operation assumes the incoming signal and the local signal replicas are quantized to two bits — one sign and one magnitude bit. The sign and magnitude bits are packed into 32-bit words. Explicit complex multiplication is replaced by a combination of the bit-wise logical operations AND, NOR, and XOR. In effect, the bitwise parallel method performs 32 multiply-and-accumulate operations in parallel. Importantly, storage of the local carrier replicas as bit-packed sign and magnitude words is also memory-efficient, which makes on-chip storage of the local signal replica look-up tables possible.
FIGURE 6. Bit-wise parallel implementation of the correlation operation. Boxes in the signal trains represent 8-bit bytes. Grayed boxes represent operands of one complex multiplication operation, implemented by bit-wise AND, NOR, and XOR operations. (Click to enlarge).
Spoofer Module. Beyond the hardware required for the GPS receiver, the receiver-spoofer requires only signal transmission hardware: a digital/analog converter, a frequency synthesizer and mixer for mixing to near the GPS L1 frequency, in-line attenuators, and a transmission antenna. For this article, we conducted no over-the-air tests to avoid possible FCC violations; hence, we do not further discuss the transmission hardware.
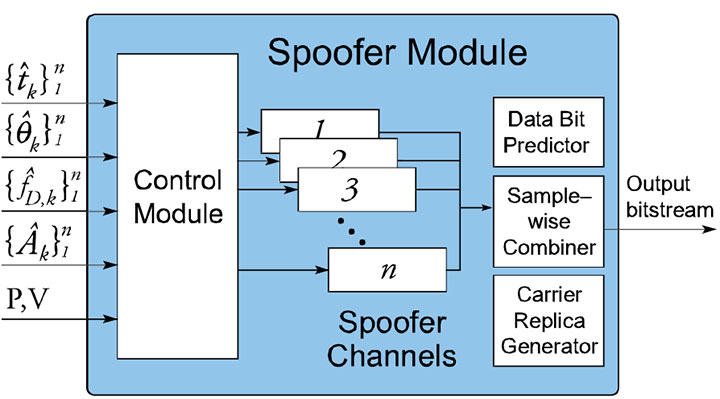
The heart of the spoofer is the spoofer software module, shown in FIGURE 7.
FIGURE 7. Block diagram of the spoofer module.
Control Module: The spoofer’s control module coordinates a spoofing attack by directing the frequency, code-phase offset, and signal amplitude applied in each of n spoofing channels. Some components of the control module described here remain under development.
The control module accepts the following inputs from the receiver module:
estimates {t (circumflex) k } 1 n of the start times of the kth C/A code period on receiver channels 1–n;
the estimates {θ (circumflex) k } 1 n of the beat carrier phase on receiver channels 1–n at times {t (circumflex) k } 1 n ;
the estimates {f (circumflex) D,k } 1 n of the Doppler frequency shift on receiver channels 1–n at times {t (circumflex) k } 1 n ;
the estimates {A (circumflex) k } 1 n of the signal amplitudes on receiver channels 1–n at times {t (circumflex) k } 1 n ;
the receiver-spoofer’s current 3-dimensional position P and velocity V.
The control module orchestrates a spoofing attack in the following way. It begins by commanding n spoofer channels to generate signals with Doppler frequency offsets equal to {f (circumflex)D,k } 1n and code phases whose relative alignment is equivalent to that dictated by {t (circumflex)k } 1n. It then applies a common-mode code phase advance to compensate for buffering delays within the receiver-spoofer. If this advance is chosen correctly, then each spoofing signal will be code-phase-aligned with its genuine-signal counterpart at the target receiver’s antenna. The control module then commands an increase in the signal amplitude of one or more spoofer channels to effect lift-off of the target receiver’s tracking points. This continues until all target receiver channels are presumed to be under control of the spoofer.
At this point the control module gradually leads the target receiver off its true position and time to an alternate position or time. Let ΔxD (tk ) = [Δvx (tk ), Δvy (tk ), Δvz (tk ), Δb•(tk )]T be the perturbation that the control module applies to the target receiver’s observed velocity and clock rate bias at receiver-spoofer time tk . The time rate of change of the perturbation Δb•(tk ) must be less than the expected drift rate of the target receiver’s reference oscillator. Likewise, the time rate of change of the velocity perturbations Δvx (tk ), Δvy (tk ), and Δvz (tk ) must be less than the accelerations that the target receiver expects, or, if the target receiver is equipped with an IMU, less than the expected uncertainty in the accelerometer bias.
To enforce ΔxD (tk ), the control module linearizes the standard Doppler frequency measurement model about the current receiver time, position, and velocity estimates and computes offsets to the quantities {f (circumflex)D,k } 1n that are commensurate with the perturbation ΔxD (tk ).
Similarly, let Δx(tk ) = [Δx(tk ), Δy(tk ), Δz(tk ), Δt(tk )]T be the perturbation that the control module applies to the target receiver’s observed position and time at receiverspoofer time tk . Δx(tk ) is calculated by integrating the time history of ΔxD (tk ) values from some initial condition, typically ΔxD (tk ) = 0 so that the target receiver’s observed velocity and clock rate bias is initially approximately equal to its true velocity and clock rate bias. To enforce Δx(tk ), the control module linearizes the standard pseudorange measurement model about the current receiver time and position estimates and computes offsets to the quantities {t (circumflex)k } 1n that are commensurate with the perturbation Δx(tk ).
Following this strategy, the control module can, as gradually as necessary, misdirect the target receiver’s observed position and time.
The spoofer control module currently makes no attempt to align the beat carrier phases of its output signals with those of the received GPS signals, and so the phase values {θ (circumflex)k } 1n are currently discarded. More sophisticated future versions of the receiver-spoofer will likely make use of these phase values.
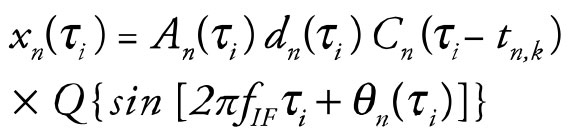
Spoofer Channels: Each of the n spoofer channels is configured to correspond to one of the n authentic GPS signals that the receiver module tracks. The signal generated by the nth spoofer channel can be modeled as
(1)
(2)
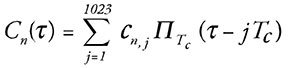
where xn(τi) is the ith sample of the signal, τi is the time of the ith sample, An (τi ) is the control-module-commanded amplitude at τi , dn (τi ) is the data bit value that applies at τi , Cn (τi –tn,k ) is the C/A code chip value that applies at τi , tn,k is the control-module-commanded start time of the kth C/A code period, Q{•} is a 2-bit quantization function, fIF is the intermediate frequency, θn (τi ) is the beat carrier phase at τi , and fD,n,k is the control-module-commanded Doppler frequency shift at time tn,k . The C/A code function Cn(τ) can be further represented as
(3)
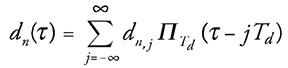
and the data bit function dn(τ) as
(4)
where {cn,1 , cn,2 , …, cn,1023 } and {dn,j , dn,j+1 , …} are the unique C/A code chip sequence and navigation data bit sequence corresponding to the GPS satellite whose signal is being emulated on the nth spoofer channel, Tc and Td are the duration of one C/A code chip and one navigation data bit, and ∏T(τ) is the usual rectangular support function equal to unity over 0 ≤ τ< T and zero otherwise.
To generate the C/A code samples {Cn (τi )}, i = 1,2, …, the spoofer channels make use of the same bit-packed C/A code replicas that are employed for signal correlation in the receiver module, which are stored in large look-up tables. However, to generate the samples of the quantized carrier replica
(5)
the spoofer channels cannot exploit the same bit-packed carrier replicas that are used for signal correlation in the receiver. This is because, to minimize on-chip memory requirements, the receiver’s carrier replicas all begin at the same phase value and have only a coarse 175-Hz frequency resolution. The receiver compensates for these factors by performing a rotational “fix-up” on the in-phase and quadrature accumulation values. Unfortunately, such a scheme is unworkable for generating the sampled carrier replicas in the spoofer channels because anything less than precise phase and frequency control over the carrier replicas would potentially alert a target receiver to a spoofing attack. Consequently, it was necessary to develop a carrier-replica generator more capable than that used in the receiver module.
Carrier-Replica Generator: Two requirements drove the carrier-replica generator design: precision and efficiency. Regarding precision, to evade detection the generator must be able to set the initial phase of a carrier replica segment to within approximately one degree and the Doppler frequency offset over the segment to within approximately 1 Hz. Regarding efficiency, to meet real-time deadlines the generator would have to be capable of generating a replica segment T S seconds long in less than T S /30 seconds. We developed a generator meeting these requirements.
A quantized sampled carrier replica can be represented in bit-wise parallel format as a block of 32-bit words. In the simplest case, the carrier replicas are one-bit quantized with 0 and 1 respectively representing the values –1 and 1. The carrier replica generator can be configured to generate 1- to 4-bit-quantized samples. Two-bit quantization was chosen for implementation within the spoofer, with one bit representing the sign and the other representing the magnitude of the signal. The choice of 2-bit quantization balanced a tradeoff between efficiency and the amount of quantization noise introduced into the final linear combination of the spoofer channel outputs.
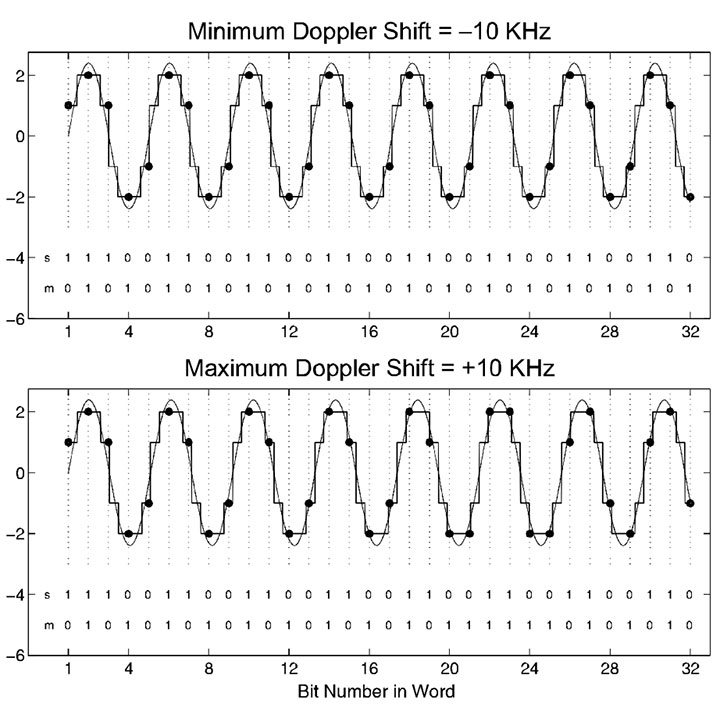
The carrier replicas are sampled at a rate fS > 2fIF Hz as shown for the minimum and maximum Doppler frequency shifts in FIGURE 8. The key observation that makes real-time generation of the carrier replicas possible is the following: There is little diversity in the 32-bit words that result from packing 32 samples of quantized carrier replicas over a ±10-kHz range of Doppler frequency offsets and 2π radians of carrier phase. This is another way of saying that the information content of the quantized sampled carrier replicas is low, which is to be expected.
FIGURE 8. Two-bit quantization of the local carrier replica at the maximum and minimum Doppler frequency shifts.
Figure 8 illustrates this concept by showing a case with a sampling frequency fS = 5.714 MHz, an intermediate frequency fIF = 1.405 MHz, and a Doppler frequency range of ±10kHz. This Doppler frequency range covers the expected range of Doppler shifts seen by a terrestrial GPS receiver, with ~ 5 kHz of margin for receiver clock rate error. The sampling and intermediate frequencies are typical for civil GPS applications. Over the interval shown in Figure 8, the total number of cycles for the two signals, whose initial phases are aligned, differs by less than 1/8 of a cycle. When sampled and 2-bit quantized into the sign (s) and magnitude (m) bits that run along the bottom of each frame, the resultant carrier replicas have the same sign-bit history and only 10 different magnitude bits. This indicates that the sampled carrier replicas covering a reasonable Doppler shift frequency range are primarily a function of the initial phase offset for each 32-bit word. This observation remains true whenever fIF < fS and fD,mabs << fIF , where fD,mabs is the maximum absolute value of the Doppler frequency shift.
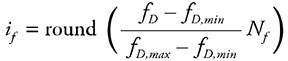
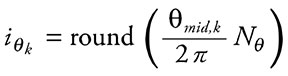
The low information content of the sampled carrier replicas makes them amenable to tabular storage and efficient retrieval. Two tables are required, one each for the sign and magnitude bits. Let if ∈ {0,1, …, Nf – 1} and iθ ∈ {0,1, …, Nθ – 1} represent the respective indices into the frequency and phase dimensions of the tables. For each carrier replica segment (typically 1-ms long), a single frequency index is calculated as
(6)
where fD is the exact desired frequency and fD,min and fD,max are the minimum and maximum Doppler frequency shifts. The phase index iθ is different for each of the 32-bit words that are strung together to compose the carrier replica segment. Let τk be the time offset of the midpoint of the kth word in the segment relative to the time of the first sample in the segment. The phase at the midpoint of the kth word is calculated as
(7)
where θ0 is the phase of the first sample in the segment, and the modulo operation is modulo 2π. Finally, the phase index of the kth word is calculated as
(8)
To meet precision requirements, the number of indices into the frequency and phase dimensions of the tables were set respectively to Nf = 32 and Nθ = 256. With this table size, the table-generated carrier replicas are not significantly different from carrier replicas generated by applying the exact phase and frequency values using double-precision computations. The sign and magnitude tables occupy a total of 64 kB in on-chip memory.
Data Bit Predictor: The GPS L1 navigation data bit sequence {d n,j , d n,j+1 , …} required by the nth spoofer channel is most easily generated in one of two ways. The simplest approach is to pass data bits to the spoofer channels as soon as they can be reliably read off the incoming GPS signals. Naturally, this approach produces a delay in the arrival time of the spoofing data bit as compared to that of the true data bit at the target receiver’s antenna. The delay is most conveniently made an integer number of 1-ms C/A code intervals. Clearly, such a delay is undesirable in a spoofer because a target receiver could be designed to watch for such a delay and thereby detect a spoofing attack.
The second approach is to predict the data bits based on knowledge of the bit structure and a recent bit observation interval. This is the function of the receiver-spoofer’s data bit predictor. This method relies on the fact that the GPS navigation message has a 12.5-minute period and remains nearly perfectly predictable for a period of two hours. In fact, the almanac component of the 12.5-minute data block is refreshed by the GPS Control Segment only once per day, and the remaining data — the individual satellite ephemeris data — can be observed in less than one minute. There are data bit segments within the TLM word of the navigation message that are unpredictable on a regular basis. However, these segments are also unpredictable for the target receiver (in the absence of external data bit aiding). Therefore, the spoofer can simply fill the unpredictable data bit segments with arbitrary data bits and adapt the parity bits and HOW word polarity accordingly.
Discrepancies have been observed between the almanac data of Block IIA and later satellites. For example, the least significant bits of particular ephemeris parameters can differ. This is believed to be a rounding error in early satellites. These discrepancies cause problems with data-bit prediction for Block IIA satellites. The GPS control segment has been alerted to this and is taking corrective measures. Meanwhile, the spoofer module’s data-bit predictor keeps two copies of almanac data: one for Block IIA and one for later satellites.
During a spoofing attack, rising GPS satellites pose a challenge for the data-bit predictor; indeed, for the entire receiver-spoofer. The receiver-spoofer must prevent the target receiver from acquiring bit lock on the new signal until the data-bit predictor has a chance to observe the new satellite’s ephemeris data. This could be done by transmitting a spoofing signal with arbitrary data bits whose boundaries change sporadically by an integer number of C/A code periods.
Sample-Wise Combiner: Summation of the bit-packed signals generated in each of the spoofer channels is performed sample by sample. The ith sample from the nth spoofer channel is weighted by A n (τ i ) and summed with the corresponding samples from the other spoofer channels, each weighted appropriately. While computationally expensive, sample-wise operations are necessary to generate a combined signal that represents a quantized superposition of the individual spoofing signals with correct relative amplitudes. The composite signal is then re-quantized to 1 or 2 bits before being loaded into the output circular buffer. Re-quantization of the composite signal introduces additional signal distortion, which decreases the carrier-to-noise ratio of each component signal. For 1-bit re-quantization, which is the current configuration, the signal distortion is tolerable until more than eight spoofing signals are combined. More precisely, 1-bit requantization can sustain no more than eight equal-amplitude component signals at a carrier-to-noise ratio of C/N 0 = 48 or higher.
Implementation
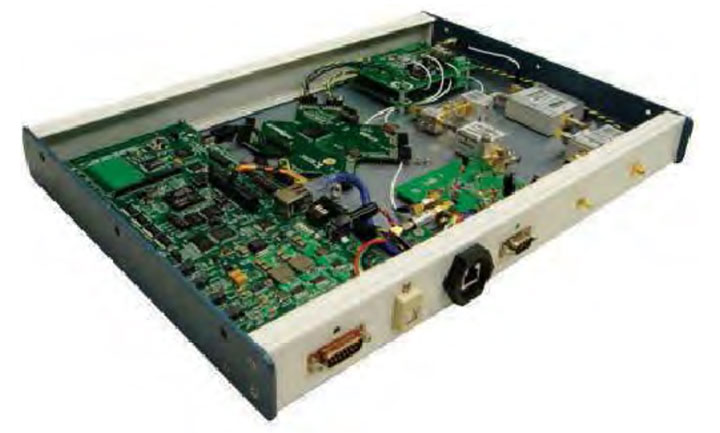
The software-defined receiver-spoofer has been implemented on the Cornell GRID receiver platform (FIGURE 9). Receiver and spoofer software modules run on the same processor.
FIGURE 9. The Cornell GRID receiver, hardware platform for the receiver-spoofer.
When tuned for efficiency, the receiver-spoofer meets real-time deadlines with computational resources to spare. At full capability, the receiver-spoofer tracks 12 GPS L1 C/A signals and simultaneously generates 12 spoofing signals, in addition to performing a 1-Hz navigation solution and continuous background acquisition. The 1-bit re-quantization of the composite spoofing signal limits the spoofer module practically to eight component signals. Future versions of the receiver-spoofer may trade computational resources for 2-bit re-quantization, permitting more than eight component spoofing signals.
The marginal computational demands of each tracking and spoofing channel are respectively 1.2 percent and 4 percent of the DSP, the latter value reflecting the high computational cost of carrier replica generation and sample-wise signal combination within the spoofer module.
The core Cornell GRID receiver software is the product of hundreds of developer-hours of work. Developing the spoofer module and extending the core GRID receiver software to include it required a team of three experienced developers working approximately 40 hours apiece, or approximately three developer-weeks. The hardware components of the receiver-spoofer platform shown in Figure 9 are all off-the-shelf components whose total cost is approximately $1,500.
Demonstration Attack
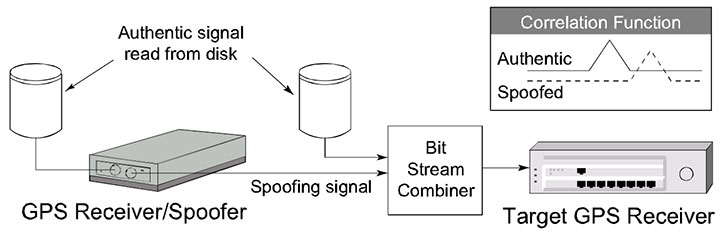
We devised a method for demonstrating a spoofing attack without actually transmitting RF signals at the GPS L1 frequency over the air, which would have violated FCC restrictions on transmitting in a protected band. An interval of digitized authentic GPS L1 C/A code data sampled at 5.7 MHz was stored to disk. The data were input to the receiver-spoofer, which tracked the six GPS signals present, generated corresponding spoofing signals, and combined these into a 1-bit quantized output bitstream. The output bitstream was then combined with the original data by interleaving, and the resulting bitstream was input to a Cornell GRID receiver acting as target receiver, as shown in FIGURE 10.
FIGURE 10. The “bit combination” framework for demonstrating a spoofing attack.
The receiver-spoofer accurately reproduced the code phase, frequency, data-bit values, and relative amplitude of all six GPS L1 signals present. The spoofing signals’ carrier phases, while not designed to match those of the genuine signals, were continuous across accumulation intervals as intended.
To enable observation of the spoofing attack, the target receiver was augmented with correlator taps at 81 different 0.2-chip offsets about the prompt tap, which is nominally aligned with the incoming signal. The amplitude time history from each correlator tap can be combined to produce “footage” of the spoofing attack from the perspective of the individual channels.
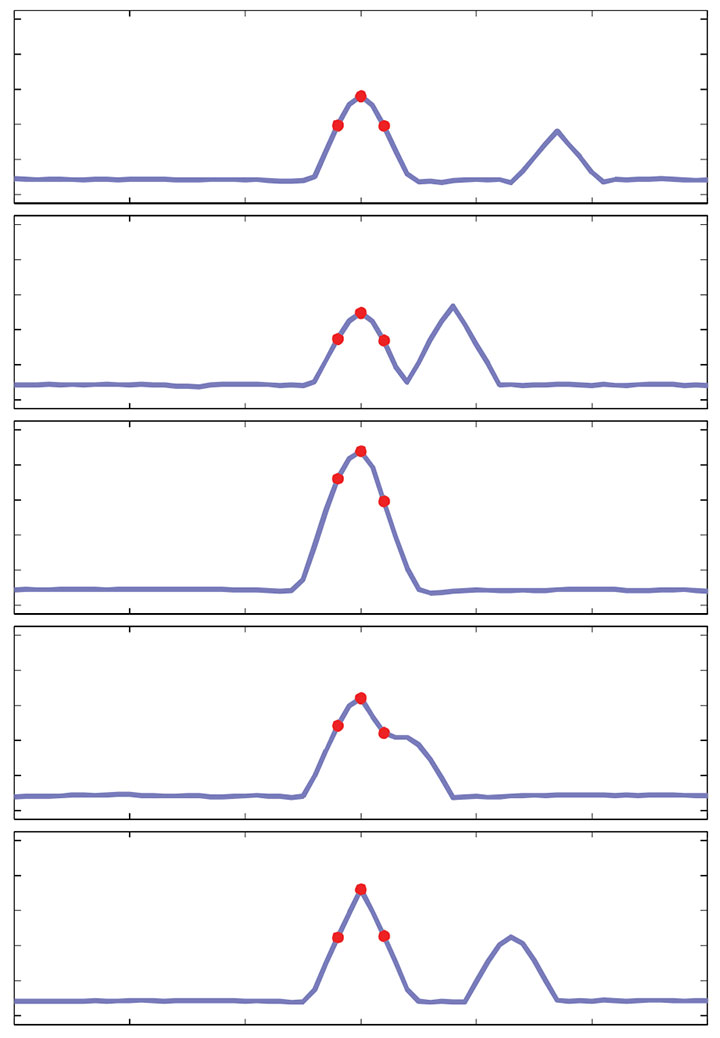
FIGURE 11 shows a sequence of frames depicting the attack on one of the channels. The attack lasts approximately 30 seconds. Each successive panel represents a snapshot of the 81 taps’ amplitudes at roughly 6-second intervals. The three red dots represent the delay-lock loop’s tracking points, which continuously attempt to align themselves so that the center point is maximized and the flanking points are equalized. The top frame shows the tracking points nicely aligned on the genuine signal’s correlation peak, while the counterfeit signal’s peak approaches furtively from the right. Of course, in a typical spoofing attack, the counterfeit peak would simply be initially aligned with the genuine peak and initially smaller than the counterfeit peak in the top panel; its approach from the right and large size in the present case is merely for clarity of presentation.
FIGURE 11. A sequence of frames (from top to bottom) showing a successful single-channel spoofing attack.
After the spoofed peak aligns with the genuine one, its signal power is gradually increased until it begins to control the tracking points. Eventually, the counterfeit peak drags the tracking points off to the left of the true peak. In the lower two panels of Figure 11, the true peak appears to drift off towards the right because the counterfeit peak has hijacked the 81 taps of the figure’s image zone, which are tied to the victim receiver’s tracking points, and it drags them all leftward relative to the true peak. A sophisticated spoofing attack will attempt right-to-left, or late-to-early, tracking lift-off wherever possible so as to disguise the attack as multipath.
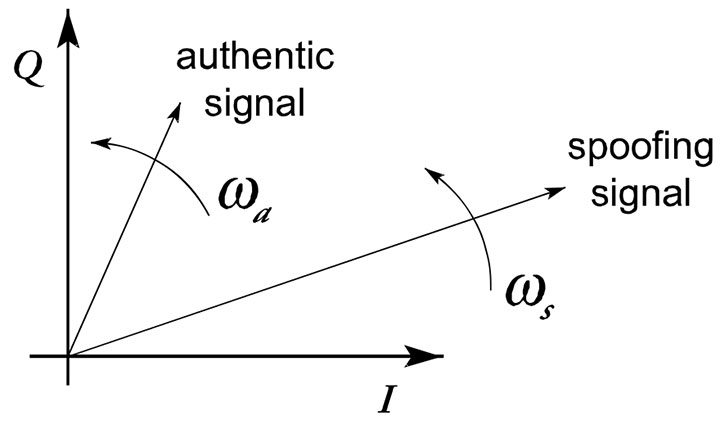
FIGURE 12 illustrates the attack from the perspective of the baseband phasors in the complex plane. In the present version of the receiver-spoofer, no attempt is made to phase-align the authentic and spoofing signals. Consequently, a sign change in the data bit stream is possible as the spoofing phasor’s amplitude gradually increases and the target receiver’s phase-lock loop eventually transitions from tracking the authentic phasor to tracking the spoofing phasor. However, the rotational rates of the two phasors, ωa and ωs in Figure 12, should be nearly equivalent. From Figure 12 it should be apparent that if a receiver-spoofer were capable of phase-aligning with a genuine signal, it could, by transmitting the exact difference between a desired spoofing signal and the true signal at the target antenna, simultaneously produce a spoofing phasor and suppress the authentic phasor. When combined with data-bit prediction, such an attack could be impossible to detect relying solely on user-equipment-based defenses.
FIGURE 12. The authentic and spoofing baseband phasors with respective rotational rates of a and s on the complex I-Q plane.
Countermeasures
Three spoofing countermeasures have been suggested by work to date. Two of these, both software-defined user-equipment-based defenses, are presented here. These can be thought of as additions to the five user-equipment-based countermeasures presented earlier. The third method, a promising low-impact cryptographic technique, will be disclosed in a separate publication. Neither of the user-equipment-based defenses discussed below is spoofproof; however, each is straightforward to implement and increases the difficulty of mounting a successful spoofing attack.
Data-Bit Latency Defense. The data bit-latency defense is premised on the difficulty of re-transmitting the GPS data bits in real time. The alternative, data-bit prediction, is itself somewhat challenging and is vulnerable to detection at the 2-hour ephemeris update boundaries and when a GPS satellite rises above the horizon.
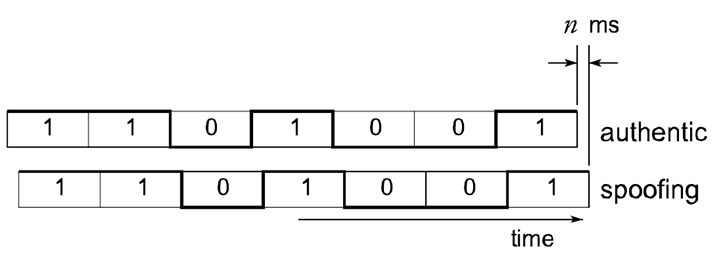
FIGURE 13 illustrates the latency between the spoofing and authentic data bit streams that would arise in the absence of data-bit prediction. To detect this condition, the target receiver has only to continuously monitor bit lock. In other words, the receiver looks for a data-bit sign change between consecutive accumulations at the C/A code-length interval. If a sign change is detected at other than an expected data-bit boundary, then the target receiver raises a flag. Except in unusual circumstances, such as low signal power or ionospheric scintillation, a raised flag betrays a spoofing attack. We have implemented and validated the data-bit latency defense on a modified Cornell GRID receiver.
FIGURE 13. Illustration of the likely latency of the spoofing data bit stream compared to the authentic data bit stream.
Besides by data-bit prediction, a spoofer can attempt to counter the data-bit latency defense by jamming until the target receiver loses bit lock and then spoofing during reacquisition. However, as with the time-discrepancy defense, an extended jamming period may be required to sufficiently widen the target receiver’s window of acceptance, and extended jamming is itself telltale evidence of interference.
Vestigial Signal Defense. This defense is premised on the difficulty of suppressing the authentic signal after successful lift-off of the delay-lock loop tracking points. To suppress the authentic signal, a spoofer must transmit the difference between a desired spoofing signal and the true signal at the target antenna. Construction of an effective suppressor signal requires knowledge to within roughly 1/8 of a cycle of each authentic signal’s carrier phase at the phase center of the target antenna. Such precise knowledge of carrier phase implies centimeter-level knowledge of the 3-dimensional vector between the target antenna and the transmitter phase centers. This would be challenging except in circumstances where the receiver-spoofer could be placed in the immediate proximity of the target antenna phase center.
Absent an effective suppressor signal, a vestige of the authentic GPS signal will remain in the input to the target receiver. Soon after lift-off of the delay-lock loop tracking points, the vestige may be well disguised as multipath, but its persistence and distance from the spoofed correlator peak will eventually distinguish the two effects.
To detect the vestigial authentic signal, the target receiver employs the following software-defined technique. First, the receiver copies the incoming digitized front-end data into a buffer used only for vestigial detection. Next, the receiver selects one of the GPS signals being tracked and removes this signal from the data in the buffer. This is the same technique used to remove strong signals in combating the near/far problem in spread-spectrum multiple-access systems, including GPS. Once the tracked signal has been removed, the receiver performs acquisition for the same signal (same PRN identifier) on the buffered data.
These steps are repeated for the same GPS signal and the results are summed non-coherently until a probability of detection threshold is met for some assumed C/N0 value and some desired probability of false alarm. If a significant vestigial signal is present in the data, this technique will reveal it.
Conclusions
The deepening dependence of the civil infrastructure on GPS and the potential for financial gain or high-profile mischief makes civil GPS spoofing a gathering threat. The software-defined receiver-spoofer described here demonstrates that it is straightforward to mount a spoofing attack that would defeat most known user-equipment-based spoofing countermeasures. Moreover, it appears that nothing short of cryptographic authentication can guard against a sophisticated spoofing attack.
With the addition of each modernized GNSS signal, the cost of mounting a spoofing attack rises markedly, and would quickly exceed the capabilities of the GPS L1 civil spoofer demonstrated here. Nonetheless, faster DSPs or FPGAs would make multi-signal attacks possible. Moreover, there will remain many single-frequency L1 C/A code receivers in critical applications for years to come.
It is imperative that more research and funds be devoted to developing and testing practical and effective user-equipment-based civil GPS spoofing countermeasures such as the data-bit latency defense and the vestigial signal defense introduced here. Further research into cryptographic authentication methods should also be pursued. Officials in the U.S. Department of Transportation, the Federal Aviation Administration, and the Department of Homeland Security should consider the perils of civil GPS spoofing and oversee development and adoption of effective countermeasures. Commercial manufacturers of GPS user equipment should adopt at least rudimentary spoofing countermeasures.
In conclusion, consider two security maxims advanced by the Vulnerability Assessment Team at Argonne National Laboratory. The first certainly applies to civil GPS spoofing. One can only hope that the second does not.
Yippee Maxim: There are effective, simple, and low-cost countermeasures (at least partial countermeasures) to many vulnerabilities.
Show Me Maxim: No serious security vulnerability, including blatantly obvious ones, will be dealt with until there is overwhelming evidence and widespread recognition that adversaries have already catastrophically exploited it. In other words, “significant psychological (or literal) damage is required before any significant security changes will be made.”
Acknowledgments
The Cornell GRID receiver development has been funded under ONR grant N00014-04-1-0105. A Reference/Further Reading section will be appended to the version of this article appearing online at env-gpsworld-integration.kinsta.cloud. An earlier version of this article was published in the Proceedings of the September 2008 Institute of Navigation GNSS Conference in Savanna, Georgia.
Manufacturers
The receiver-spoofer consists of a Zarlink/Plessey GP2015 RF front end, a CPLD for signal multiplexing, and a Texas Instruments TMS320C6455 DSP.
TODD E. HUMPHREYS is a research assistant professor in the department of Aerospace Engineering and Engineering Mechanics at the University of Texas at Austin. He received a Ph.D. in aerospace engineering from Cornell University; [email protected].
BRENT M. LEDVINA is an assistant professor in the Electrical and Computer Engineering Department at Virginia Tech. He received a Ph.D. in electrical and computer engineering from Cornell University.
MARK L. PSIAKI is a professor in the Sibley School of Mechanical and Aerospace Engineering at Cornell. He received a Ph.D. degree in mechanical and aerospace engineering from Princeton University.
BRADY W. O’HANLON received a B.S. in electrical and computer engineering from Cornell University,where he pursues a M.S./Ph.D degree.
PAUL M. KINTNER, JR. is a professor of electrical and computer engineering at Cornell. He received a Ph.D. in physics from the University of Minnesota.
References
“Vulnerability assessment of the transportation infrastructure relying on the Global Positioning System,” Tech. rep., John A. Volpe National Transportation Systems Center, 2001.
Key, E. L., Techniques to Counter GPS Spoofing,” Internal memorandum, MITRE Corporation, Feb. 1995.
Scott, L., “Anti-spoofing and authenticated signal architectures for civil navigation systems,” Proc. ION GPS/GNSS 2003,Institute of Navigation, Portland, Oregon, 2003, pp. 1542-1552.
Hein, G., Kneissi, F., Avila-Rodriguez, J.-A., and Wallner, S., “Authenticating GNSS: Proofs against spoofs, Part 1,” Inside GNSS, July/August 2007, pp. 58-63.
Hein, G., Kneissi, F., Avila-Rodriguez, J.-A., and Wallner, S., “Authenticating GNSS: Proofs against spoofs, Part 2,”Inside GNSS, September/October 2007, pp. 71-78.
Ledvina, B. M., Cerruti, A. P., Psiaki, M. L., Powell, S. P., and Kintner, Jr., P. M., “Performance Tests of a 12-Channel Real-Time GPS L1 Software Receiver,” Proceedings of ION GPS 2003, Institute of Navigation, Portland, OR, 2003.
Ledvina, B. M., Psiaki, M. L., Powell, S. P., and Kintner, Jr., P. M., “Real-Time Software Receiver Tracking of GPS L2 Civilian Signals using a Hardware Simulator,”Proceedings of ION GNSS 2005, Institute of Navigation, Long Beach, CA, Sept. 2005.
Ledvina, B. M., Psiaki, M. L., Powell, S. P., and Kintner, Jr., P. M., “Bit-Wise Parallel Algorithms for E±cient Software Correlation Applied to a GPS Software Receiver,”IEEE Transactions on Wireless Communications, Vol. 3, No. 5, Sept. 2004.
Humphreys, T. E., Ledvina, B. M., Psiaki, M. L., and Kintner, Jr., P. M., “GNSS Receiver Implementation on a DSP: Status, Challenges, and Prospects,”Proceedings of ION GNSS 2006, Institute of Navigation, Fort Worth, TX, 2006.
Warner, J. S. and Johnston, R. G., “A simple demonstration that the Global Positioning System (GPS) Is Vulnerable to Spoofing,”Journal of Security Administration, 2003.
Borre, K., Akos, D., Bertelsen, N., Rinder, P., and Jensen, S.,A Software-defined GPS and Galileo Receiver: A Single-frequency Approach, Birkhauser, 2007.
Ledvina, B. M.,”Real-Time Generation of Bit-Packed OverSampled Carrier Replicas,” 2008, in preparation.
Johannesson, R. J.,Cross-correlation mitigation in GPS signal acquisition for a real-time software receiver, Master’s thesis, Cornell University, 2007.
This article addresses how best to quantify “which navigation system performs best” in a realistic testing scenario. The methodology focuses on land vehicles navigating in urban environments, but applies equally well to pedestrian navigation and can be adapted for testing assisted-GNSS implementations. During a drive test, the truth-reference system and RF recording system log samples to disk, with no need for the receivers under test to be included during the actual drive.
By Eric Vinande, Brian Weinstein, Tianxing Chu, and Dennis Akos, University of Colorado, Boulder
FIGURE 1. Traditional in-vehicle receiver testing.
Radio frequency record-and-playback systems (RPS) have recently become commercially available. These systems sample the RF environment and store it to disk during a drive test and can replay it through receivers back in the lab environment. Here we explore the improvements in dynamic testing methodology created by these units.
RPS test system installation.
RPS constitute a stark contrast to more traditional signal simulators that use pre-defined trajectories and mathematical models to determine appropriate RF output. Signal simulators attempt to reproduce environmental error factors such as multipath, inertial aiding system errors, and building and vehicle obstructions. They rely on mathematical models to simulate these various error sources. In some cases they do a reasonable job of reproducing these errors, but the dynamic urban environment is so complex (for example, rapidly varying/fading signal strength(s), multiple multipath signals, short/long duration obstructions of multiple layers) that even a sophisticated mathematical model can not replicate all effects completely. Some simulators include software that enables the user to define a trajectory and a limited amount of urban scenario details. Again, only so much realism can be created in a simulation environment. Existing testing standards are simulator-based, and as such, are circumscribed by the signal simulator limitations in representing a dynamic environment.
Positioning performance of a satellite navigation receiver under test (RUT) is coupled with its RF front-end system and local oscillator quality. Because of the variation in RF components between RUTs, some likely have superior RF interference (RFI) immunity. RFI can be a serious issue in certain land vehicles due to on-board electrical systems or because of external interference sources.
This article describes a testing method applicable to all receiver types, and complementary to that described in the December 2009 GPS World article by Mitelman and colleagues, “Testing Software Receivers,” regarding validation testing within a production environment. Added elements include taking into account truth-system uncertainty and a repeatability verification of the RF playback process through non-deterministic hardware receivers.
We present here the dynamic testing approach currently used at the University of Colorado in Boulder for receiver evaluation and comparison in the urban environment. The approach also includes the ability to assess the effect of sensor augmentations (for example, inertial, environmental) on positioning performance.
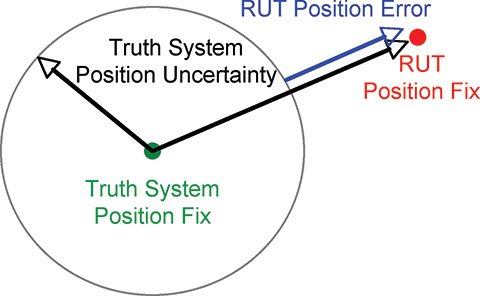
Truth Reference. Comparison with a truth reference system is essential for evaluation of satellite navigation receivers. For dynamic testing, this typically includes a survey-grade receiver coupled with a tactical-grade (or better) inertial measurement unit (IMU) and associated carrier-phase differential post-processing software. This software is filter-based and provides a positioning-error estimate in various components. Truth reference systems provide a continuous position estimate whose quality can vary depending on factors experienced in the urban environment, including length of full/partial satellite signal outage. In this study, we subtracted the 99th-percentile horizontal positioning error estimate of the truth system from the nominal RUT positioning error at each reporting epoch, as shown in Figure 2.
If the RUT position happens to lie within the truth-system position uncertainty, it is not considered to have any position error.
We focus here on a method to evaluate and compare mass-market, consumer-grade receivers to survey-grade receivers. One difference between these two receiver types is the way they handle the trade-off between accuracy and availability. Consumer receivers strive to provide the user with the highest availability, whereas survey receivers’ goal is to maximize accuracy. As a result, consumer-grade receivers will produce more regular position updates in harsh signal-tracking conditions, but must sacrifice accuracy to do so.
FIGURE 2. RUT position error calculation
Current Testing Standards
Currently accepted A-GPS standards such as those used by the 3rd Generation Partnership Project (3GPP) provide very limited dynamic testing in simulated urban conditions, being mainly designed to evaluate the first position calculation achieved in a particular simulated scenario. High-sensitivity receivers that pass or greatly exceed the 3GPP tests, in our opinion, are not guaranteed to have superior navigation performance in urban areas. Also, local oscillator performance is not specified. The trajectory dynamics imposed can actually be much smaller than the clock dynamics of a very low-cost local oscillator. A GPS receiver cannot tell the difference between the two and must track the effective Doppler variation.
The 3GPP defines five independent tests for A-GPS receiver certification. They include tests in the areas of: sensitivity with coarse/fine time assistance, nominal accuracy, dynamic range, multipath performance, and moving scenario/periodic update performance. The last three tests include elements that ostensibly pertain to the urban environment. These tests specify discrete, constant signal power levels for implementation in a hardware signal simulator. The discrepancy between the 3GPP-prescribed signal levels and those observed during actual drive testing is detailed as follows.
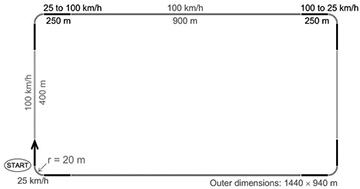
The 3GPP moving scenario/periodic update performance test trajectory is shown in Figure 3.
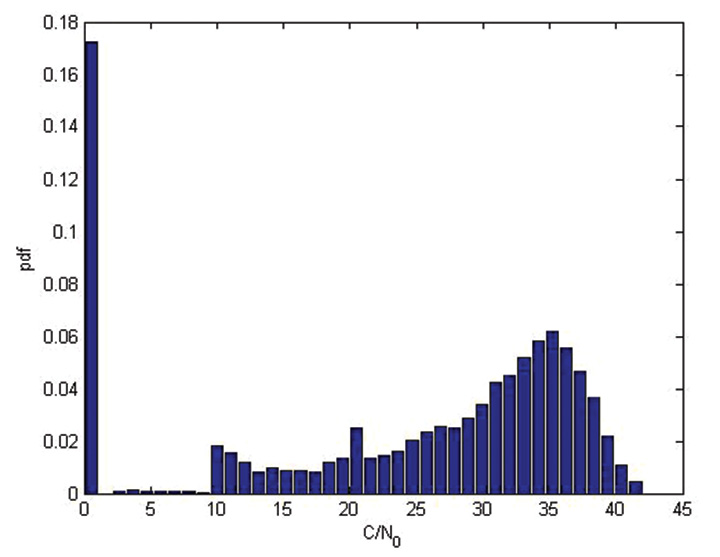
This test profile calls for the simulation of five satellites with a constant signal strength of 2130 dBm while the vehicle travels around the racetrack trajectory. In contrast, during an actual drive test in an urban area, a receiver reported the distribution of carrier-to-noise-density values for all tracked satellites as shown in Figure 4. This more accurately shows the range of signal strengths that should be expected in urban conditions.
FIGURE 4. Drive-test C/N0 distribution
The 3GPP moving test is considered passed if positions are reported regularly, and 95 percent of them are within 100 meters of the true position. This is not a particularly difficult test for a RUT to retain signal lock through, as the linear acceleration is about 0.15 g and the centripetal acceleration is about 0.25 g.
It is difficult for independent third parties to carry out a receiver evaluation following 3GPP guidelines as several of the tests require receiver restarts, which in turn requires testing automation. Depending on the receiver-evaluation hardware availability, restart commands may not be available to to an independent evaluator.
3GPP receiver testing results are quoted as pass or fail over a large number of short evaluations. For the dynamic environment, the system performance over continuous time is required to make a proper comparison between evaluated receivers.
In general, evaluating the GPS engines embedded within cell phones or other devices is difficult. Most are not made to interface with an external antenna, and the mere act of adding an antenna connection can significantly alter performance. The output format is not always documented, if it is even available to an end user. To allow fair across-the-board comparisons, GPS chipset manufacturers should make available development kits that have external antenna connections and well-documented message output formats.
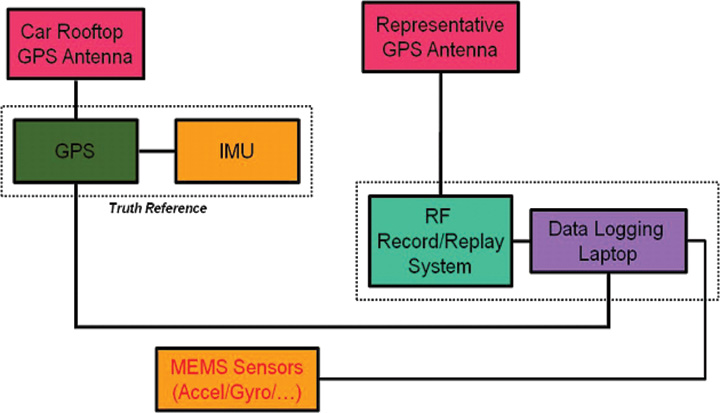
Drive-Test Configuration
Current live dynamic testing requires multiple systems to be operating in a moving vehicle (see opening Figure 1). A truth-reference system, usually a high-grade GPS/INS device along with post-processing, provides the basis to which all other RUT are compared. This system requires a dedicated vehicle rooftop antenna with the best possible sky view, separate from a lower-grade test antenna located within the vehicle. Each RUT is connected to the representative consumer-grade antenna located in the vehicle through a high-isolation splitter that suppresses inter-receiver interference. It is important at this point that the gain be set appropriately for each RUT, depending on the front-end expectations while maintaining an equivalent noise figure across all receivers.
Visualization Methods
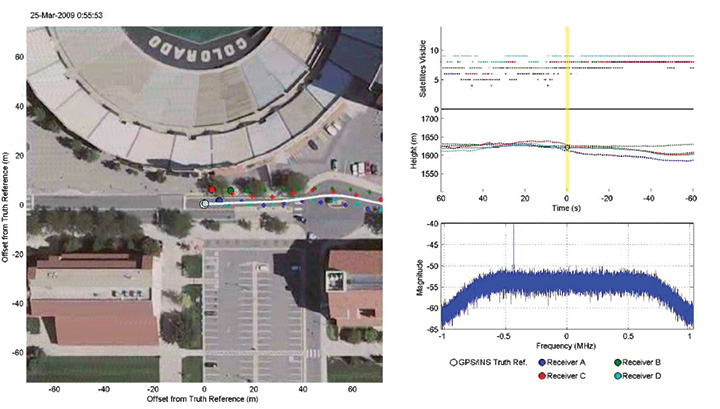
In addition to quantitative methods, we have created a qualitative visualization to assist with interpretation of the raw data. The same parsed data sets that provide the statistical script input are fed into a viewer script along with the post-processed truth reference data. With the truth-reference system data plotted in the center of the screen, each RUT is then plotted the correct distance and direction away, based on the distance and direction of error compared to truth. The receiver plots are overlaid onto Google Earth images centered on the truth-reference location. Plots of number of satellites utilized (top right of Figure 5) and elevation (middle right) as reported by each receiver and the sampled RF spectrum (lower right) are also included.
For each reporting epoch, based on the data frequency of the truth-reference system, a frame is generated with the aforementioned characteristics. These frames are gathered and encoded into a movie clip which can then be used as a quick and simple qualitative tool for receiver comparison. Figure 5 shows an individual movie frame. A forward-looking camera capability is also being added to this movie so the test environment can be documented from multiple angles.
FIGURE 5. Movie visualization screenshot
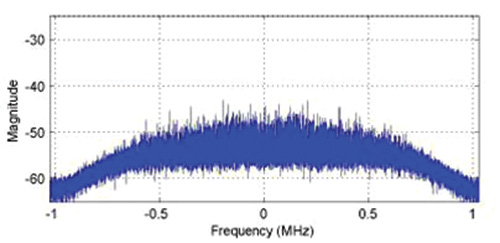
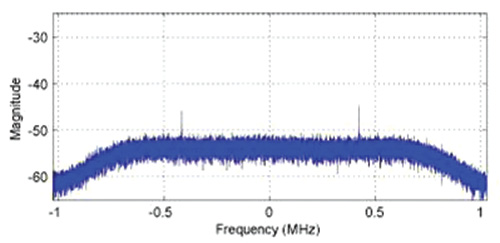
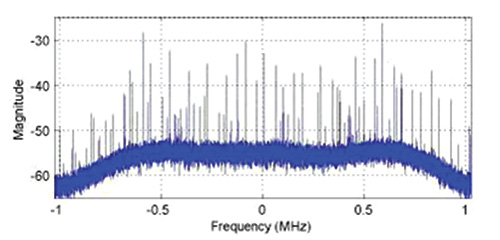
While observing this movie, variations in the sampled RF spectrum from interference or blockages can be associated with the current landscape. Locations of RFI sources can be identified and avoided (or included) in future testing. These RFI and significant blockage locations are of interest for receiver RF component and navigation filter development. The next three figures show spectrum snapshots during various parts of a drive test. In Figure 6, the cumulative GPS spectra rises above the noise floor and is visible during open sky conditions. While below ground level, Figure 7 shows only the front-end filter shape (and relatively minor RFI). Figure 8 shows an example of severe RFI when near a specific parking garage location.
FIGURE 6. Open-sky spectrum (centered on 1575.42 MHz)
FIGURE 7. Spectrum while below ground level (centered on 1575.42 MHz).
FIGURE 8. Spectrum near interference source (centered on 1575.42 MHz).
Record/Playback Concept
To overcome the limitations of hardware signal simulators and repeated vehicle drive testing, the RF record/playback testing method is utilized at the university. Commercially available equipment, capable of recording and playing back an RF signal, has recently become available. Equipment options exist for between $10,000–100,000, with 1–16 bit sampling and 4–25 MHz front-end bandwidth.
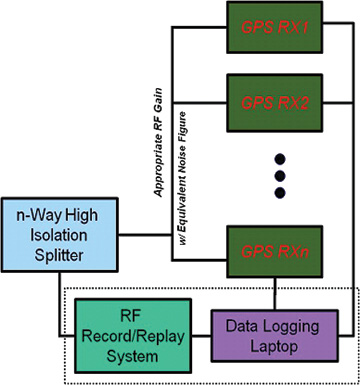
Figures 9 and 10 show the concept of “record once, playback many times.” During a drive test, the truth-reference system and RF recording system log samples to disk. There is no need for the RUT to be included during the actual drive test.
In the laboratory, the logged RF samples are replayed through a splitter to all RUT. The effect of receiver configuration changes can be evaluated without having to repeat the drive test. At a later time, additional receivers can also be tested using the same stored RF sample file.
During separate record and playback phases, testing considerations and methods discussed previously are implemented.
Since the recording process can only obviously capture current conditions, additional drive-test collections are required if different satellite geometry is desired, or if additional representative antennas need to be evaluated.
Repeatability of RPS Testing
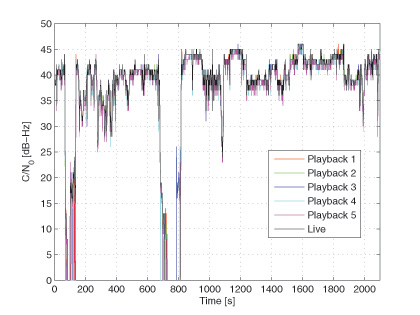
To validate that the playback signal levels were not significantly different from live signals, we conducted an urban, dynamic evaluation. Figure 11 shows that there is typically not more than a 1 dB difference in reported C/N0 between live and playback modes when testing a receiver that only reported integer values. The two dropout instances were excursions into parking garages.
FIGURE 11. Live and playback C/N0 values
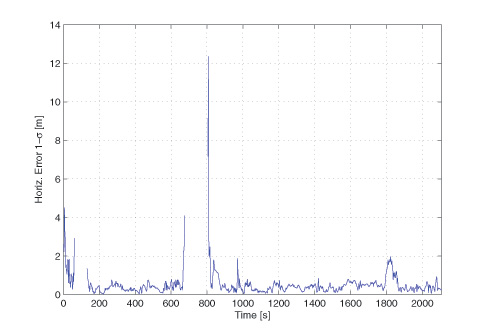
Figure 12 compares the navigation statistics between replays, using the same five playbacks as in Figure 11. The playbacks show a 1-sigma horizontal position solution spread under 1 meter for approximately 83 percent of the test.
FIGURE 12. Playback Horizontal Position Error Spread.
These two figures verify the repeatability of the RPS testing method and solidify it as an alternative to both signal-simulator testing and live testing of satellite navigation receivers.
Denver Testing Method
To evaluate the RPS concept, we conducted tests in three locations: Boulder, Denver, and Interstate Highway 70, all in Colorado. The Boulder and Denver locations were urban collections, while the Interstate 70 location was a natural canyon with significant elevation change. The collection at each location was repeated with two different representative antennas (patch and cell phone) at nearly the same sidereal time in order to keep the overhead satellite constellation similar.
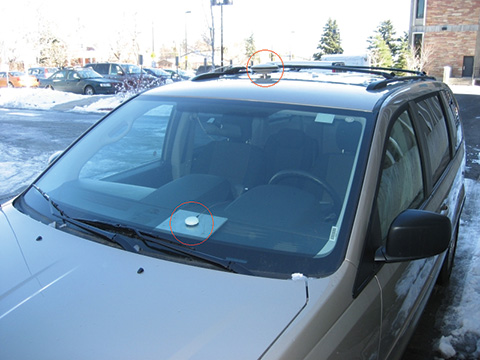
We examine here the November 11 and 16 Denver tests. The November 11 test used a patch antenna that places nearly all its gain in the upward direction, making it more immune to interfering sources below and to its sides. Figure 13 shows the patch antenn
a location on the van, as well as the truth-system antenna location utilized for testing on both days.
FIGURE 13. Patch antenna (dashboard) and truth-system antenna (rooftop) locations.
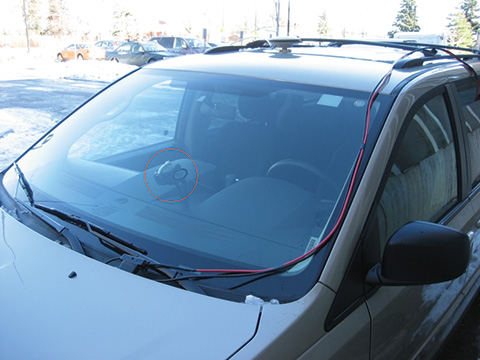
The November 16 test used a cell-phone GPS antenna that does not have a preferential gain direction, making it more susceptible to interfering sources below and to its sides. This antenna type is representative of the typical low-cost antenna (in some cases as simple as a piece of wire) found in consumer cell phones. Figure 14 shows the cell-phone antenna suction-cup mounted to the front window of the testing van. The representative antenna mounting location was chosen to minimize locally-generated RFI effects while also being representative of a typical vehicle-use case.
FIGURE 14. Cell-phone antenna location.
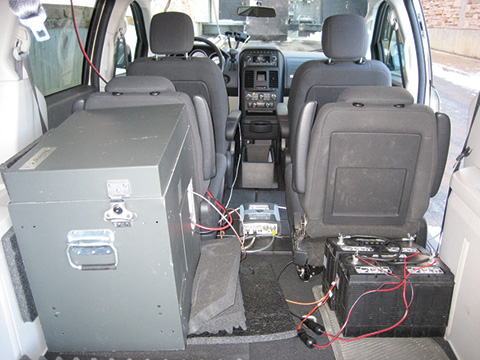
The required equipment and connections are minimal when performing RPS drive testing, as no RUTs are included. The inset to Figure 1 at the beginning of this article shows the RPS unit in the rear of the van, mounted on layers of foam to reduce vibration, which, if not properly addressed, can cause errors in mechanical hard drives writing data at high rates. Also visible are the truth receiver on the center of the van floor, and the car batteries for powering it and the IMU. The IMU is mounted to the vehicle frame and is not shown.
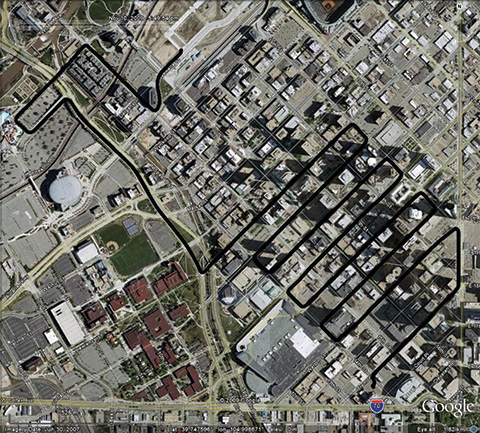
The test drive trajectory through Denver on November 11 and 16 as reported by the truth system is shown in black in Figure 15 and is also repeated in Figures 16 and 17. The test lasted approximately 40 minutes on both days. It started in the upper left part of Figure 15 and continued zig-zagging through downtown to the lower right.
FIGURE 15. Truth trajectory for November 11 and 16 tests.
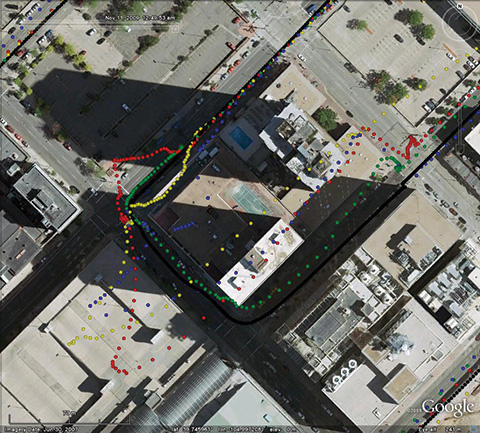
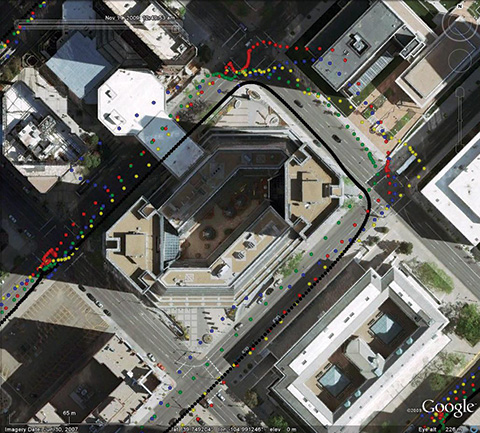
Figures 16 and 17 show particularly difficult blocks for the four receivers tested under the replay method. These receivers are denoted A (green), B (blue), C (red), and D (yellow).
FIGURE 16. Difficult block #1 during November 11 test and truth system antenna (rooftop) locations.
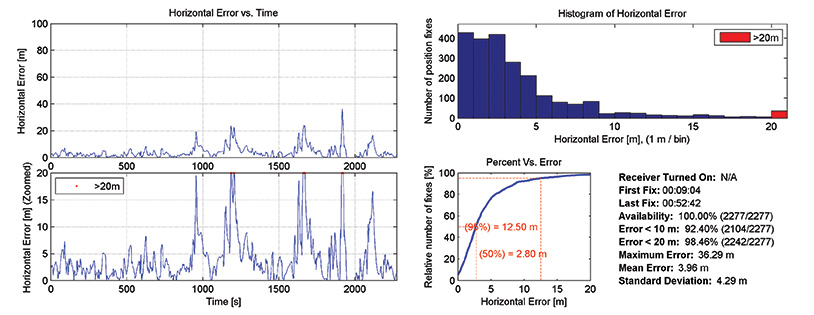
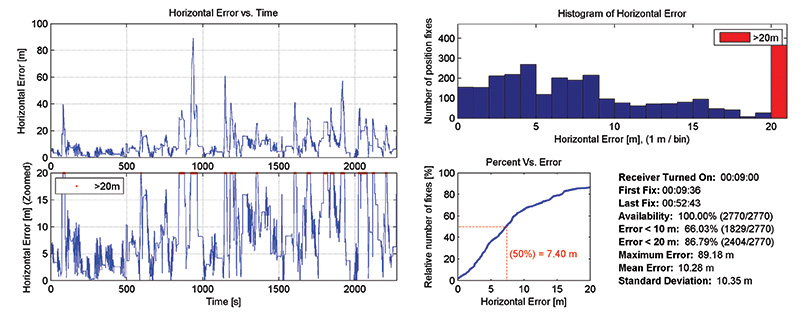
The horizontal positioning error statistics for two receivers on the November 11 test are shown in Figures 18 and 19. The left side shows horizontal error in two different zoom levels. The right side shows a histogram and cumulative distribution of errors, and several reporting metrics over the entire test. Even though receiver A in general outperformed receiver B, from the error time histories there are noticeable periods where both receivers simultaneously had positioning difficulties.
FIGURE 17. Difficult block #2 during November 11 test.
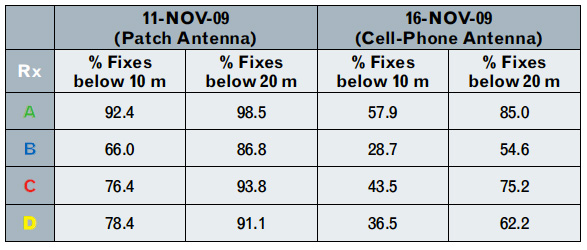
Table 1 summarizes the horizontal positioning statistics for all receivers during both tests. Positioning accuracy was severely degraded when replaying samples collected with the cell-phone antenna as compared to the patch antenna. Receiver A was the most accurate across both tests, while receiver B was the least accurate. The uncertainty of the truth system was subtracted out when producing the horizontal positioning results for all receivers.
Table 1
Conclusions
The record-and-playback system testing approach, in our opinion, represents the best way to test hardware receivers. It overcomes the fidelity limits of simulator-based testing, especially when considering the difficult-to-model urban environment. During receiver development, it requires only a single drive test for each location, as sampled RF data can be replayed from disk.
Having demonstrated that RPS testing is repeatable, we have produced a library of RF sample files representing real-world conditions for continued receiver development and testing purposes.
Eric Vinande is Ph.D. student at the University of Colorado studying GPS/MEMS inertial sensor integration and urban RFI aspects.
Brian Weinstein is a BSEE student participating in the Undergraduate Research Opportunity Program for GNSS receiver testing at the University of Colorado.
Tianxing Chu is a visiting researcher at the University of Colorado from Peking University where he is a Ph.D. student.
Dennis Akos is an associate professor within the Aerospace Engineering Sciences Department at the University of Colorado with concurrent appointments at Stanford University and Luleå University of Technology.
Manufacturers
Development of the methodology described here used two different RPS systems, one from LabSat (RaceLogic) and one from Averna. The test data come from the Averna system.
Being December, it’s time for my look into next year. It’s become somewhat of a tradition for me and this year is no different. What does 2009 have in store for the GNSS user?
GPS will push forward in 2009 with the launch of the two remaining IIR-M satellites and launch of the first IIF satellite which will, incidentally, introduce a new civil frequency, L5, to the world. Those are very important milestones, but is it enough to grab the headline as the 2009 GNSS of the Year?
Nope.
It’s been a couple of years since I published a column titled “GLONASS — the Comeback Kid”.
Indeed, at that point the GLONASS program was building steam, albeit slowly. The problem was that although the Russian government was launching six satellites a year, there were still many legacy GLONASS satellites that were being decommissioned. The launch rate was barely keeping up with the rate of attrition. For this reason the GLONASS constellation has fluctuated between 10 and 14 operational satellites for many years. That is changing. In 2009, GLONASS will reach heights we’ve not experienced before.
With almost all of the legacy GLONASS satellites decommissioned and the Russians still launching new GLONASS satellites at a rate of six per year, it won’t be long before the GLONASS constellation starts to look really, really good. Currently, there are 17 operational GLONASS satellites and three more are scheduled to launch later this month on their annual Christmas Day present to the GNSS world. Assuming the Russians bring them online within 60 days or so after launch, you’ll have 20 GLONASS satellites at your disposal in the first quarter of 2009. There are still some adjustments forthcoming to the constellation due to legacy satellites, according to Sergey Revnivykh of the Russian Space Agency (RSA), so “18 satellites in January/February is nominal.” In other words, we’ll have 20 with a possibility of it dropping to 18.
Even with 17, the benefits are shining bright for RTK users. Nothing illustrates this better than a couple of plots using mission planning software (provided by Trimble Navigation free of charge via website). These plots are based on my location in Portland, OR USA using an elevation mask of 10 degrees.
Figure 1: Satellite visibility chart based on using GPS satellites only (plot date is Dec. 15, 2008).
Figure 2: Satellite visibility chart based on using GPS and GLONASS satellites (plot date is Dec. 15, 2008).
The evolution of GLONASS isn’t a complete surprise. GLONASS was declared operational in 1993, the same year as GPS. However, Russia’s political and economic struggles relegated GLONASS to the back burner and the program began a long, steady decline to a skeleton of what it once was. At its lowest point, in 2002, there were only eight operational satellites.
As Russia’s economic and political climate stabilized (some say that oil has contributed largely to the revitalization of GLONASS), Russia brought the GLONASS program back to the front burner in 2001 when it announced an ambitious plan to revitalize the program by 2010. The plan was to fly 30 GLONASS satellites by 2010.
As with many long-term plans, especially a multi-year, publicly financed plan to spend billions, the devil is in the details . . . and execution is the devil. Well, nearly eight years later, the Russians seem to have executed their plan quite well. It wasn’t an easy road with quick results, either. As I mentioned above, the attrition rate of GLONASS satellites was high most of this decade, so they had to be very aggressive in developing and launching new satellites just to keep their head above water.
This is not to say there haven’t been any problems along the way. I’ve heard several complaints from users of excessive RTK initialization times that were eventually traced back to troubled GLONASS satellite data. For example, a few months ago Topcon issued a Service Bulletin regarding “GLONASS Satellite 9.” The bulletin states that it is “not (currently) broadcasting a P2 signal. This may have an effect on RTK performance. It may cause the receiver to stay in float for a longer period of time.”
Looking Beyond 2009
I reported in 2007 that Russia was on the path to bringing GLONASS closer to GPS with respect to compatibility. Currently, GPS uses the CDMA (Code Division Multiple Access) signal-processing scheme while GLONASS uses the FDMA (Frequency Division Multiple Access) signal-processing scheme. They aren’t compatible at all . . . sort of like CDMA (Sprint) vs. GSM (AT&T) networks for mobile phones. They just don’t work together, so manufacturers essentially have to build two receivers (one for GPS and one for GLONASS) in one box. While it’s impressive that manufacturers have been able to squeeze such amazing functionality into small boxes, it’s a complicated design.
Russia has announced its commitment to support CDMA on the next generation of GLONASS satellites (GLONASS-K). While this will go a long way in making GPS/GLONASS receivers easier/cheaper to design/build, Russia and the U.S. are in discussions to even take it a step further towards interoperability with GPS L5 and the future L1C signal. However, keep in mind the space business works at a different pace than most businesses. It will be well into the next decade before we see any GLONASS satellites broadcasting CDMA signals.
GLONASS funding is also looking pretty solid at this point. Last September, it was announced that Russian Prime Minister Vladimir Putin signed a budget directive allocating 67 billion rubles (US $2.6 billion) to further develop GLONASS with the majority being steered towards adding satellites. Compare that with the GLONASS budget in 2007 being 9.9 billion rubles ($418.25 million) and 4.7 billion rubles ($200 million) in 2006.
Congratulations
Because of GLONASS’s exceptional value to the survey/construction user community in 2009, GLONASS has indeed earned my vote as GPS World magazine’s award of 2009 GNSS of the Year. Remember, the purpose of this particular column is to look forward into the future instead of a year in review. I believe that in 2009 GLONASS will add even greater value to the survey/construction user than we have ever seen.
What is a GIS guy doing at a training simulation conference? Having a lot of fun — and learning that GIS makes everything better.
By Art Kalinski, GISP
Last week I attended the Interservice/Industry Training, Simulation, and Education Conference (I/ITSEC) in Orlando, Florida. It was an international gathering of more than 16,000 attendees, both military and civilian, that featured some 550 exhibits focusing primarily on military-related training and simulation. I know that Geospatial Solutions is a GIS-focused publication and that most of you are GIS professionals, but this conference clearly demonstrated the merging of many disciplines in formerly unrelated communities, including GIS.
When we hear the word “simulators,” we generally think of flight simulators — and there were many of those on display — but the exhibits also included ground combat, medical, logistic, and cultural immersion simulators. This conference demonstrated the most realistic and up-to-date training and simulation tools available in the world today, and GIS played a fundamental role as the underpinning of many applications. Autodesk, ESRI, and 3D model builders Precision Lightworks all had booths at the four-day event.
One interesting terminology quirk that I noticed is the difference in usage of the term “database.” We GIS folk generally use the word to describe our vector data and attributes, with imagery as separate layer. But in the training environment, the term is used to describe all the datasets that feed the simulators, including maps, imagery, GIS data, DEMs, CAD drawings, photos, objects, characters, TINS, wireframes, draping textures, skins, etc. The overlap with the video gaming community is significant, but GIS is growing in importance as many applications strive for real-world connectivity.
Experiencing the Exhibit Hall
Some of the exhibits showed a significant investment, not just in the technology but in the displays themselves. It was apparent that training and simulation is a big business, with lots of dollars at stake. One exhibitor summed it up this way: “With aircraft and ships costing tens and hundreds of millions each, simulators are a low-cost way of building competence without risking expensive equipment.” The same holds true for soldiers in the field. Actual combat is not the place to conduct training, and everyone is striving to create training that is so realistic that it is indiscernible from actual combat.
Many exhibitors showcased new display technology, such as very high-resolution projectors from Sony. Most simulators used large flat screens, tripled in some cases to provide panoramic views. One flight simulator used nine separate screens, but even more impressive were large concave screens similar to IMAX. that provided realistic and seamless images, even in 3D.
Big screen display technology.
Some trainers used head-mounted displays (HMDs) for combat action scenarios, but an unusual addition was a 10-foot spherical cage for humans that resembled a giant hamster ball. The subject enters the cage wearing a wireless HMD, and can move in any direction responding to the HMD display and program. The cage was so well designed that it moved with just light finger pressure. Users indicated that getting used to walking or even running in the cage became natural quite rapidly.
Users indicated that walking in the cage — or even running — became natural quite rapidly.
Some of the exhibits showed significant expense, not just the technology but the displays themselves. The Augusta Westland helo trainer was one example.
The Augusta Westland helo trainer.
It was apparent that training and simulation is a big business with lots of dollars at stake. One exhibitor summed it up stating, “With aircraft and ships costing tens and hundreds of millions each, simulators are a low cost way of building competence without risking expensive equipment.” The same holds true for soldiers in the field. Actual combat is not the place to conduct training and everyone is striving to create training that is so realistic that it is indiscernible from actual combat
I expected to see more simulators that imitated the movement of flight, but as one of the exhibitors told me, the motion and G forces of jet fighters are so great that simulators can’t even come close — so they replicate other aspects of the experience instead. Two motion simulators that were effective included a helicopter flight and gunner simulator, and a Hummer simulator that recreated the motion of a vehicle struck by an improvised explosive device (IED). The shock and rollover over of the vehicle trained soldiers how exit a turned over vehicle while under fire, the goal being to simulate and practice what could happen so there were no surprise situations.
Vehicle rollover trainer.
Lockheed Martin featured a shipboard engine-room simulator that enabled the training of engineering personnel by simulating various casualties and damage control actions, without risk to people or equipment. The operation was very similar to a video game, with realistic characters responding to the commands of the trainee. As a former Navy Surface Warfare Officer I had to try my hand at the Kongsberg ship bridge simulator. I can attest that not only did the simulator look good, the physics, behavior and reaction of the ship was dead on accurate.
As a former U.S. Navy surface warfare officer, I had to try my hand at the Kongsberg ship bridge simulator. I can attest that not only did the simulator look good, but the physics, behavior, and reaction of the ship were dead-on.
There were numerous small arms trainers and ranges on display that were capable of training individuals, multiple trainees, and even groups acting as teams within a combat environment. I also saw countless examples of wearable gear that permitted simulation of small arms combat using of laser weapons to simulate hits. Numerous urban building mock-up trainers incorporated video displays, realistic sounds, and even explosions and smoke.
Weapons team training.
Medical simulation included traumatic injuries and triage scenarios played via video screens. Sickeningly realistic moulage kits imitated all types of injuries, complete with exposed bones and spurting blood. There were many exhibits of peripheral equipment and supplies such a carrying cases, communication gear and even very high quality surface coated mirrors for projectors and displays. One little gem that I hands-on tested at the ESRI booth was a 3D mouse by 3D Connexion. The “Space Navigator” was the smoothest, most intuitive, most precise, quality feeling mouse I’ve ever used. I’m getting one.
3D mouse.
An area I found fascinating — because I didn’t expect to see it — featured exhibitors that focused on human simulation and cultural immersion. DI-Guy and MetaVR were displaying human simulations of crowds that looked realistic and could be programmed to behave in various ways, with each character acting as both an individual and part of the group. The photo shows a Mideast group walking toward an infantry squad while hiding two terrorists in their midst. Some of the video characters are a little blocky, but new techniques derived from the video gaming industry include draping “skins” on mesh frames instead of boxes or tins. The end result is smoother-looking characters and objects, such as flowing robes.
Computer generated crowd.
One exhibitor that displayed human motion capture tools used by Hollywood to create animations. They had a young dancer wearing a capture suit whose motion was transferred to a character on a video display. She won the unofficial endurance record since she danced continuously during the four-day exhibit hall operation.
Human movement capture.
Another exhibitor, the Tatitlek Corporation, takes cultural immersion to the extreme with live, culturally correct role players that recreate Middle Eastern environments. The live players create the look, sounds, and feel of being in the region, so that it’s not a shock for our troops when they arrive in-theater. Tatitlek displayed one example of their cultural simulations: a sheik’s tent complete with rugs, seating, accessories, and even staged arguments and police intervention.
Live cultural immersion.
Enhancing Reality with GIS and Imagery
So how does GIS fit into this community? As I learned from people that have been in this business for years, training simulation first evolved from physical mock-ups to computer-based, CAD-like “cartoon” environments that were only loosely tied to reality. It was considered a challenge to get an image up on the screen that represented reality and make it move around in response to the trainee, but that’s no longer good enough. Now imagery and GIS-referenced data is enhancing the entire environment.
Lockheed Martin was a big presence at the conference, and created a buzz with flight simulation systems that incorporated photo-realistic and photo-accurate oblique imagery and 3D models into geo-referenced applications that simulate weather conditions and even provide night-time views. This kind of accurate simulation achieves realism not previously seen, and now has captured the attention of mission planners, who have significantly different needs from trainers. The mission planners, as their title implies, plan real missions just before actual execution. For their work they need up-to-date information that is accurate, geo-referenced, and measurable. They cannot tolerate made-up data or imagery — it may be perfectly fine for training, but could be disastrous if relied upon for real execution. The bar has been raised.
Attending I/ITSEC, I could see the growing convergence of GIS, CAD, BIM models (see my August column for the BIM – GIS convergence), computer display technology, and the training/simulation applications. It’s amazing to watch how everything is coming together. An especially interesting system displayed by the Navy was a flight simulator that collected brain wave data and recorded images of the pilot’s eyeball movements.
Human factors flight simulator.
As I viewed this rig I couldn’t help but recall a photo I saw at Moody Air Force Base of an early flight trainer crafted from plywood and broom handles. Imagine how alien this new Navy system would look to the designer of that plywood trainer. I wonder where we will be in 20 more years.
Celartem Inc.’s LizardTech has launched a series of videos that focus on different LizardTech applications and will appear regularly on its corporate Web site.
The series begins with a video showing Express Server in action with applications such as AutoCAD Map 3D and other programs to access imagery via WMS, according to the company. Additional videos will reportedly be posted in the weeks to come.
“We’ve had many customers ask us which applications can integrate with Express Server, and now, by watching a video, they can see many of the different ways imagery can be efficiently served,” said Jon Skiffington, LizardTech senior product manager.” In this video, in addition to seeing our other integrations, we showcase our compatibly with AutoCAD Map 3D, which is exciting since the Autodesk University 2008 conference is taking place this week in Las Vegas. This way users can get a sneak peak of the applications working together on our website then come visit us in booth 417 for more information.”
At the annual ION GNSS conference in Savannah, Georgia, in September, GPS World magazine hosted its third annual Leadership Dinner. Many of the world’s leading GNSS experts attend this dinner. Those experts include research scientists, professors from renowned universities, and heads of companies, as well as influential government representatives and GNSS consultants.
Earlier this year, Alan Cameron, GPS World editor in chief, was mulling ideas for the theme of this year’s GPS World Leadership Dinner. He said he’d like to dovetail off of this year’s U.S. presidential election. I threw some ideas at him, as did other editors and associates.
Richard Langley, University of New Brunswick GNSS guru and GPS World Innovation column editor, had this great idea of a two-party system for the 2008 GNSS Election. Thus, the Satellites Party (Blue) and the Signals Party (Red) were born.
In the election planning stages, an idea for a third party, the Power Party (Green), was floated by Len Jacobson but not enough support was garnered to add it to the general ticket, so to speak. The Power Party was in favor of boosting power on all satellites while keeping the number of satellites and existing signals as they are today.
As much as the election was designed for entertainment value, the arguments from both parties are real world, and from people waist-deep in GNSS receiver and infrastructure development.
The Satellites Party position statement: We pledge to implement a total GNSS constellation of 60 satellites, all broadcasting signals that exist on-air today.
The Signals Party position statement: We pledge to implement full operating capability of L2C, L5, L1C, Galileo’s range of signals, and GLONASS CDMA, broadcast solely from the satellites on orbit today.
Leading the Satellites Party were Greg Turetzky, SiRF director of marketing, new product technology, and IP; Yatin Acharya, Texas Instruments GPS hardware and software systems product manager; and Per-Ludvig Nomark, NordNav founder and currently a Cambridge Silicon Radio fellow of GPS software. Leading the Signals Party were Javad Ashjaee, Javad GNSS president and CEO, and David Wither, Sarantel Ltd. CEO.
As you may recall, I was scheduled to moderate the election along with fellow contributing editor Don Jewell. Hurricane Ike had other plans for me. My flight to Savannah was canceled because it was routed via Houston. Alas, ION GNSS 2008 was not meant for me.
Perhaps it was a blessing in disguise. During the election planning process, I had conferred with Alan privately: “Do I, as a moderator, need to remain objective during the debate?” I queried, knowing full well what the answer would be.
“Yes, my friend, you do,” said Alan.
Perhaps that was the beginning of the end for me, at least in my mind.
Past newsletter columns and other GPS World articles presented way too much incriminating evidence that my objectivity was not just tainted, but downright biased. It reminded me of a writing competition in a journalism class where my paper was promptly returned to me with the words “not objective” scratched in red ink across the entire page by the first evaluator who read it. I was not born lacking neither an opinion nor the desire to express it. I would make a horrible news reporter.
Back to the Debate
Javad Ashjaee made some powerful and convincing arguments for the Signal Party. He says the signal quality (read: accuracy) is the foundation from which everything is built.
“We are the party of building infrastructure. They are party of building toys. They are worried about finding their friends in the middle of downtown New York. We are the party of building roads, generating accurate maps, growing your food by automating agriculture, and synchronizing your power stations. We are even working on automatically landing aircraft to use the air space more efficiently,” said Ashjaee.
“The latest figure from Col. David Madden, the GPS lead commander, it says costs between $60 million to $70 million to build a GPS satellite, and $200 million is the cost of launching the vehicle, and then add the cost to monitor it and keep it in orbit and a dozen monitoring stations,” Ashjaee continued. “In its lifespan it will cost over $300 million dollars. These guys have no sense for money. They are spoiled brats, especially that Turetzky there (laughs), who want to spend $300 million dollars to play on their cellphones or do those fox games at night in the middle of canyons, of urban canyons, like in New York. I mean, they want to do that with their 99-cent chipsets and they want us to spend $300 million dollars.”
Hmmm … interesting. Save money by plugging more signals into the same satellites. Makes sense. Leverage off of what you have rather than creating something new. Sort of like adding more memory to the computer you own instead of buying a new computer.
For the Satellite Party, Greg Turetzky made equally enlightening and convincing arguments. Essentially, quality doesn’t matter if you are unable to benefit from it.
“We already have an L1 signal. We already have an L2 signal. We already have GLONASS signals. How many signals do we really need? I’m not arguing for one; I’ve got three. I don’t need a whole lot more. What I need, then, is to put satellites in the proper orbits, so that they can access all the different people all over the world who have and need more signals on the same satellites. This way we can actually leverage all the investment that we’ve made in the receivers that we already have.
“All the people here in the audience, who — I know you don’t own survey receivers, so I won’t go there — but how many of you own a Garmin or a TomTom? Right, or a PND?” Turetsky continued. “How many of you would like if next year it just worked better? You didn’t have to do anything? You don’t have to buy anything new, you don’t have to change any software, just all of a sudden there are more satellites in better orbits all over the world, anywhere you go. It just works better. This is what my party is about — improving the life of every single one of you without costing you an additional penny for everything you’ve already purchased.”
Fellow Satellite Party member Per-Ludvig Normark chimed in: “I just want to sort of look at, if you don’t see a signal, you don’t see a signal. What is the point of actually throwing in more signals, if you don’t see the first one? I mean it doesn’t really help you. I would argue that you need more satellites to see more signals. That is really what we need. That is what we should focus on.”
Good points, huh? Especially from Mr. Normark. That theme seems to cross all applications of satellite navigation, whether low-cost vehicle navigation or high-precision construction staking.
Election Results
The electorate was offered the opportunity to ask questions of each party.
Alison Brown of NavSys asked: “Would either party bring forward a collaboration between our American and European brethren in bringing more capability to the end user?”
Greg Turetzky responded for the Satellite Party responded: “Absolutely. What we’re after is launching more of the satellites that we’ve already designed and built rather than designing and building new things that we’re not quite sure how they’re going to work, whether or not they’re going to be successful or delivered on time, and spending a lot of money to deliver new systems that we’re not really sure what the benefit will be.”
Representing the Signal Party, Javad Ashjaee rebutted: “Greg, for how many years do you suggest that we freeze and build the same Model T?”
For a group of rocket scientists, these people are pretty funny. There were 123 delegates in attendance who were registered (attendance confirmed by their dinner order) to cast their ballot. No mail-in ballots were accepted.
Satellite Party: 62
Signal Party: 46
Of course, the election results are being disputed. See the Letters to the Editor section in the December 2008 issue of GPS World. In a move to unify the two parties and soften party boundaries, President-Elect Greg Turetzky has created a new cabinet post, Minister of Accuracy, and offered it to Dr. Ashjaee.
Epilogue
The light-hearted debate mixed with real-world issues made this event a one-of-a-kind in the GNSS industry. Although I wasn’t in attendance, I listened to the audio recording and read the transcripts.
In reality, nations around the world are pushing forth with both the Satellite Party and Signal Party initiatives. There are both more satellites and more signals on the horizon. The hunger for positioning, whether it’s for car navigation, indoor pedestrian navigation, or geodetic surveying, is continuing to grow and push the capabilities of the existing satellite navigation systems. It’s not dissimilar to computing horsepower. It seems that just as we have enough processing power to efficiently run the software we operate, new software packages are introduced that demote our six-month-old computer into the under-powered category.
Editor’s Note: Full transcripts of the pre-election debate are available here: Part 1 and Part 2.
I hereby notify you that I contest your counting of the ballots of the Signal Party versus the Toy Party. Here are some facts:
According to your own admission, there were 123 people at the dinner, and you counted 108 votes. The 15 votes that you did not count were obviously cast for me, which makes my count 46 + 15 = 61. My son-in-law voted absentee which you did not count. He officially registered and was part of the meeting. That makes my votes 62, equal to the Toy Party. If you add my own vote, I am a clear winner.
(I will not bring up the fact that you unfairly did not allow my two grandsons to vote. You cannot use the excuse that they could not write. My daughter could have filled the ballots for them. )
Even if you don’t count my vote, Tom Hunter was the only legitimate vice president at the meeting. According to the rules, the VP casts the final vote when votes are equal. He votes for me! You can ask him directly if you don’t believe me.
Your process was not fair:
My investigation reveals that many voters had “hanging chads,” some from Florida;
many people voted twice for Greg
some dead people voted (I can name them if you want!)
You even counted votes of Canadians!
The main moderator (Richard) was bribed by Greg! I have photo of Greg buying Coke for Richard and giving him a free Garmin for his car. I copy to Richard and Greg to admit their guilt! Otherwise I will publish the photo of Richard drinking Coke.
I may also find your photo drinking Coke.
This is a serious national security concern. I will bring it up at next year’s meeting and am ready to take it all the way to the Supreme Court if you don’t count the votes fairly!
There are lots of questions to be answered to the court: Who had custody of the ballots before, during, and after the count? Who were the people who participated in counting the ballots, and what were their qualifications?
The fact is that the Signal Party won. I demand a re-count!
— Javad Ashjaee
Once again, I can only express my deepest disappointment that my colleague would feel the need to drag such a clear outcome through the mud and unnecessary contortion of the legal arena. We all know that does not serve either of our constituencies, but simply enriches the lawyers. I would have expected Mr. Ashjaee to be one of the people who most clearly understood that the will of the people is not subject to the random decision-
making of the judicial branch. However, as a concilitory gesture to move our great industry forward, I would offer Mr. Ashjaee a seat in the new cabinet as Minister of Accuracy in the Satellite Party government.
— President-elect Greg Turetzky
Editor’s Note: The parties have entered out-of-court discussion to which the magazine is not privy, nor will it entertain any further disputation. Election results stand as announced. However, in the interest of full public disclosure, we wish to allay Minister Ashjaee’s concerns about the identities and qualifications of the ballot guardians and counters.
The Marine Department of Malaysia’s Ministry of Transportation has chosen Spain’s GMV and Astronautic Technology Sdn. Bhd. (ATSB) to establish the country’s coastal differential (DGPS) network.
This contract is partly a result of GMV’s close relationship with ATSB, a Malaysian company, forged more than three years ago in a business cooperation forum organized by the Spanish Overseas Trade Institute in Malaysia, according to the companies. The network established by GMV and ATSB will include four transmitting stations, two remote monitoring centers, and a control center. Along with coordinating the installation of the systems, GMV also will set up the necessary communications software, reference stations and integrity monitors at each site and track the specific remote-monitoring and control-center software.
“The system we have developed for this project provides dynamic support and flexibility for markets in the maritime sector,” said Luis Mayo, GMV CEO. The project validates Madrid-based GMV’s international expansion and strengthens its position in Malaysia, where it now boasts a portfolio of signature clients, the company said.
LizardTech is partnering with Smartronix to enable the U.S. Air Force to access to imagery in support of U.S. troops in Iraq and Afghanistan, reducing turnaround time from months to weeks.
Smartronix, a consultant to the U.S. Air Force Special Operations Command (AFSOC), was tasked to provide the Air Force a faster means to serve out imagery to support war efforts in the Iraqi and Afghan theaters. Previously, AFSOC employed a process for storing and serving imagery, however the delay time was typically in excess of three months from image acquisition to deployment, according to the companies. After implementing LizardTech’s Express Suite, AFSOC was able to compress their imagery to Multiresolution Seamless Image Database (MrSID), a wavelet-based image encoder, viewer, and file format, reproject it, load it into Oracle, and have it ready to serve to the field in less than three weeks, reportedly four and a half times faster than before.
“Using the LizardTech Express Suite family of products we were able to save the Air Force time and money,” said David Streed, spokesman for Smartronix, Inc. “Our requirements for storage dropped from terabytes to gigabytes, which kept equipment costs down, allowed a significantly smaller footprint, and saved our client in excess of 1,700 man hours – all while providing the imagery they needed in a timely manner.”
I receive many requests for advice and/or recommendations from folks who are looking to buy GPS/GNSS equipment for survey and construction. Of course, if they haven’t told me, the first question I ask is, for what type of project are they are planning to use the equipment?
Some are typical projects like topographical surveys and construction staking, while others are not-so-typical. But no matter what type of project it is, the common denominator is the need for high precision data. It may be real-time or post-processed, networked or base-to-rover, single frequency or dual frequency, single constellation or multi-constellation, machine control or man-pack – it could be any of the above, as well as other configurations. But … no matter what … it has to deliver high precision results.
Although it may not seem like it, there is a myriad of GPS/GNSS equipment that will provide high precision, or centimeter (cm)-level positioning. To people who are knee-deep in the industry like you and I, it’s a daunting enough task to wade through all the different GPS/GNSS products to find the one that fits the best. To a first-time purchaser, it can be absolutely confusing and mind-numbing to sift through the brochures, Web sites and flyers.
To further complicate the purchasing process, prices can vary widely. I’ll give you an example. Within the past few months, I’ve been forwarded copies of quotes provided to prospective purchasers of GPS/GNSS equipment and asked to comment on them. You might be amazed at the variation in price.
Two quotes in particular caught my attention. One was for a Spectra Precision Epoch 25 RTK system. Spectra Precision is owned by Trimble Navigation. The Spectra Precision Epoch product line is distributed by Tripod Data Systems (TDS), which is also owned by Trimble. The other quote was for a Trimble-branded R8 GNSS system. The R8 GNSS is Trimble’s top-of-the-line GPS survey system with all the bells and whistles you can get these days on a GPS survey system. I’ve used the R8 GNSS and it’s a sweet ride.
Essentially, the Epoch 25 and R8 GNSS can accomplish the same tasks. Both are dual-frequency RTK systems. The Epoch 25 is dual frequency, GPS-only (no GLONASS), and doesn’t support GPS modernization (L2C and L5). The R8 GNSS supports GPS modernization (L2C and L5) and it supports GLONASS. The R8 GNSS is a much sexier package. It is a single, lightweight unit with the radio/GSM modem fully integrated inside a single unit. The Epoch 25 is essentially two pieces instead of one; the receiver itself and the antenna with a cabled connection between the two. There are other subtle differences, but like I said, for the most part they can both accomplish the same tasks and deliver the same precision, although the GLONASS option on the R8 GNSS has some definite benefits in terms of working in areas where the sky is obscured.
What do you think the price difference is between the two systems?
The R8 GNSS system quote was U.S. $56,900. The Epoch 25 system quote was U.S. $19,000. That’s a big difference.
This isn’t meant to pick on Trimble, because the entire industry is the same. In fact, there is a saying I’ve heard for years: “If you don’t like today’s price, check again next Tuesday.” That’s especially true in these economic times when there are fewer potential purchasers of GPS/GNSS equipment so manufacturers and dealers must add more incentive to attract buyers.
When considering purchasing GPS/GNSS equipment, price isn’t the only thing. Local support is an important consideration for most buyers. Local support means technical support as well as sales support (spare parts, etc.). For some buyers who aren’t as technically savvy, it’s obviously even more important. Another variable is that some dealers are more technically competent than others. It doesn’t do you any good if you know more about the system than the local tech representative of the company that sold it to you.
Which GPS/GNSS Equipment Is Right for Me?
Answering this one question will help point you in the right direction:
Do I need the results in real-time, or can I wait until I process the data back in the office (or with a laptop in the field)?
The answer to this question will make a big difference in the type of systems you should consider. Also, the answer might not be so easy. If you are making a first-time purchase for your surveying firm, you may not know what type of projects your business will be working on a year from now. If you really think you’ll be doing a lot of construction staking and sizeable topo surveys, then it’s pretty clear that RTK is the way to go. If you aren’t sure, then a lower cost pair of single frequency receivers may be the way to go. The return on investment (ROI) for those is pretty quick because they are reasonably inexpensive compared to a full-blown RTK system.
Systems for post-processing (a pair of single-frequency receivers) can be purchased for well under U.S. $10,000 and deliver centimeter-level horizontal/vertical measurements. Establishing site control is a good example of how those can be used. However, staking of any kind requires real-time kinematic (RTK) positioning. Also, while post-processing can be used for topographic surveys, RTK is a much more efficient tool when the projects are larger.
Essentially, RTK trades money for time (e.g., you pay more for the equipment but it takes less time to complete the task), while post-processing trades time for money (e.g., you pay less for the equipment but spend more time to complete the task). I know I’ll get a few letters about that because there are some exceptions, but they are generally true statements.
As you see in the example above in comparing the R8 GNSS and the Epoch 25 system, “full-blown RTK systems” can carry significantly different price tags. These days, there are generally three different levels of RTK survey systems:
L1-only RTK. A relatively new technology, this is an entry-level RTK survey system for under U.S. $15,000. It’s suited well for environments that are ideal GPS conditions, such as wide-open construction sites with a clear view of the sky. The distance between base and rover is generally limited to 10 km, or about (six miles).
Legacy L1/L2 RTK systems. These are the traditional RTK GPS systems like the one I own and like the Epoch 25 system mentioned above. They use L2 in addition to L1, so a longer distance between base and rover is achievable. They are the traditional dual-frequency receivers. They don’t accommodate the new GPS signals being broadcast and planned (L2C and L5), nor can they utilize neither the Russian GLONASS system nor the planned Galileo system. Prices for these systems typically range from U.S. $19,000 to $35,000.
Advanced GNSS RTK systems. These are the state-of-the-art RTK survey systems that utilize all signals being broadcast by GPS and GLONASS, as well as taking into account future GPS (L5), GLONASS and Galileo signals (as much as possible). These bleeding-edge systems will allow you to push the envelope as far as possible with satellite positioning. Due to the additional signals they are able to utilize, you will be able to use these systems at times when the other two can’t perform due to lack of satellite signals. Prices for these systems typically range from U.S. $35,000 to U.S. $60,000.
It’s tough to cover a topic such as this in a single column, so I’m sure I’ll visit it again. Maybe some of you will email and perhaps I can write about some specific case studies and publish some sort of purchase decision analysis for GPS/GNSS equipment. I’ve also got a few case studies I could include in such a discussion. Given the economic climate, I think this issue will be discussed often throughout 2009, at least.