The United States Geospatial Intelligence Foundation (USGIF) is now accepting applications for its 2015 Scholarship Program. The program assists promising students pursuing the geospatial sciences with scholarship awards to further the advancement of the geospatial intelligence tradecraft.
In 2014, $101,000 in scholarships was awarded to 22 recipients. Since 2004 when the scholarship program began, $792,000 in scholarships has been awarded to more than 170 students.
“The USGIF Scholarship Program is open to students with innovative ideas for advancing the use of geospatial science, data, and technology to solve human security challenges such as conflict, natural disaster, emergency response, public safety, health, the environment, transportation, and more,” said Maxwell Baber, USGIF’s director of academic programs. “We accept applicants from any discipline focused on human-scale activity and the human-environment interface.”
Graduating high school seniors, undergraduate, graduate, and doctoral students studying geospatial intelligence, geography, political science, computer science, biology, anthropology, and any other field in the natural and social sciences are encouraged to apply. Applications can be found at USGIF’s website and are due no later than April 20.
USGIF is a nonprofit educational foundation dedicated to promoting the geospatial intelligence tradecraft and developing a stronger GEOINT Community with government, industry, academia, professional organizations, and individuals who develop and apply geospatial intelligence to address national security challenges. USGIF’s mission is to build the community, advance the tradecraft, and accelerate innovation.
For more information on the USGIF Scholarship Program or to read about past USGIF scholarship recipients, visit usgif.org/education/scholarships.
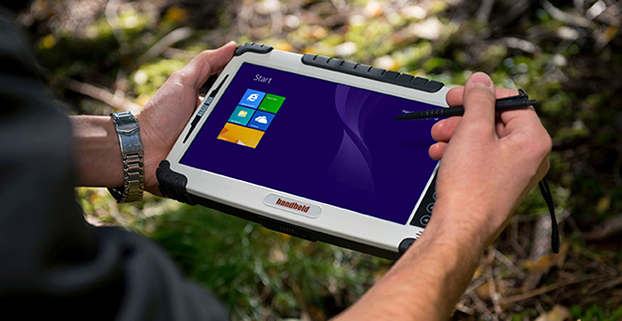
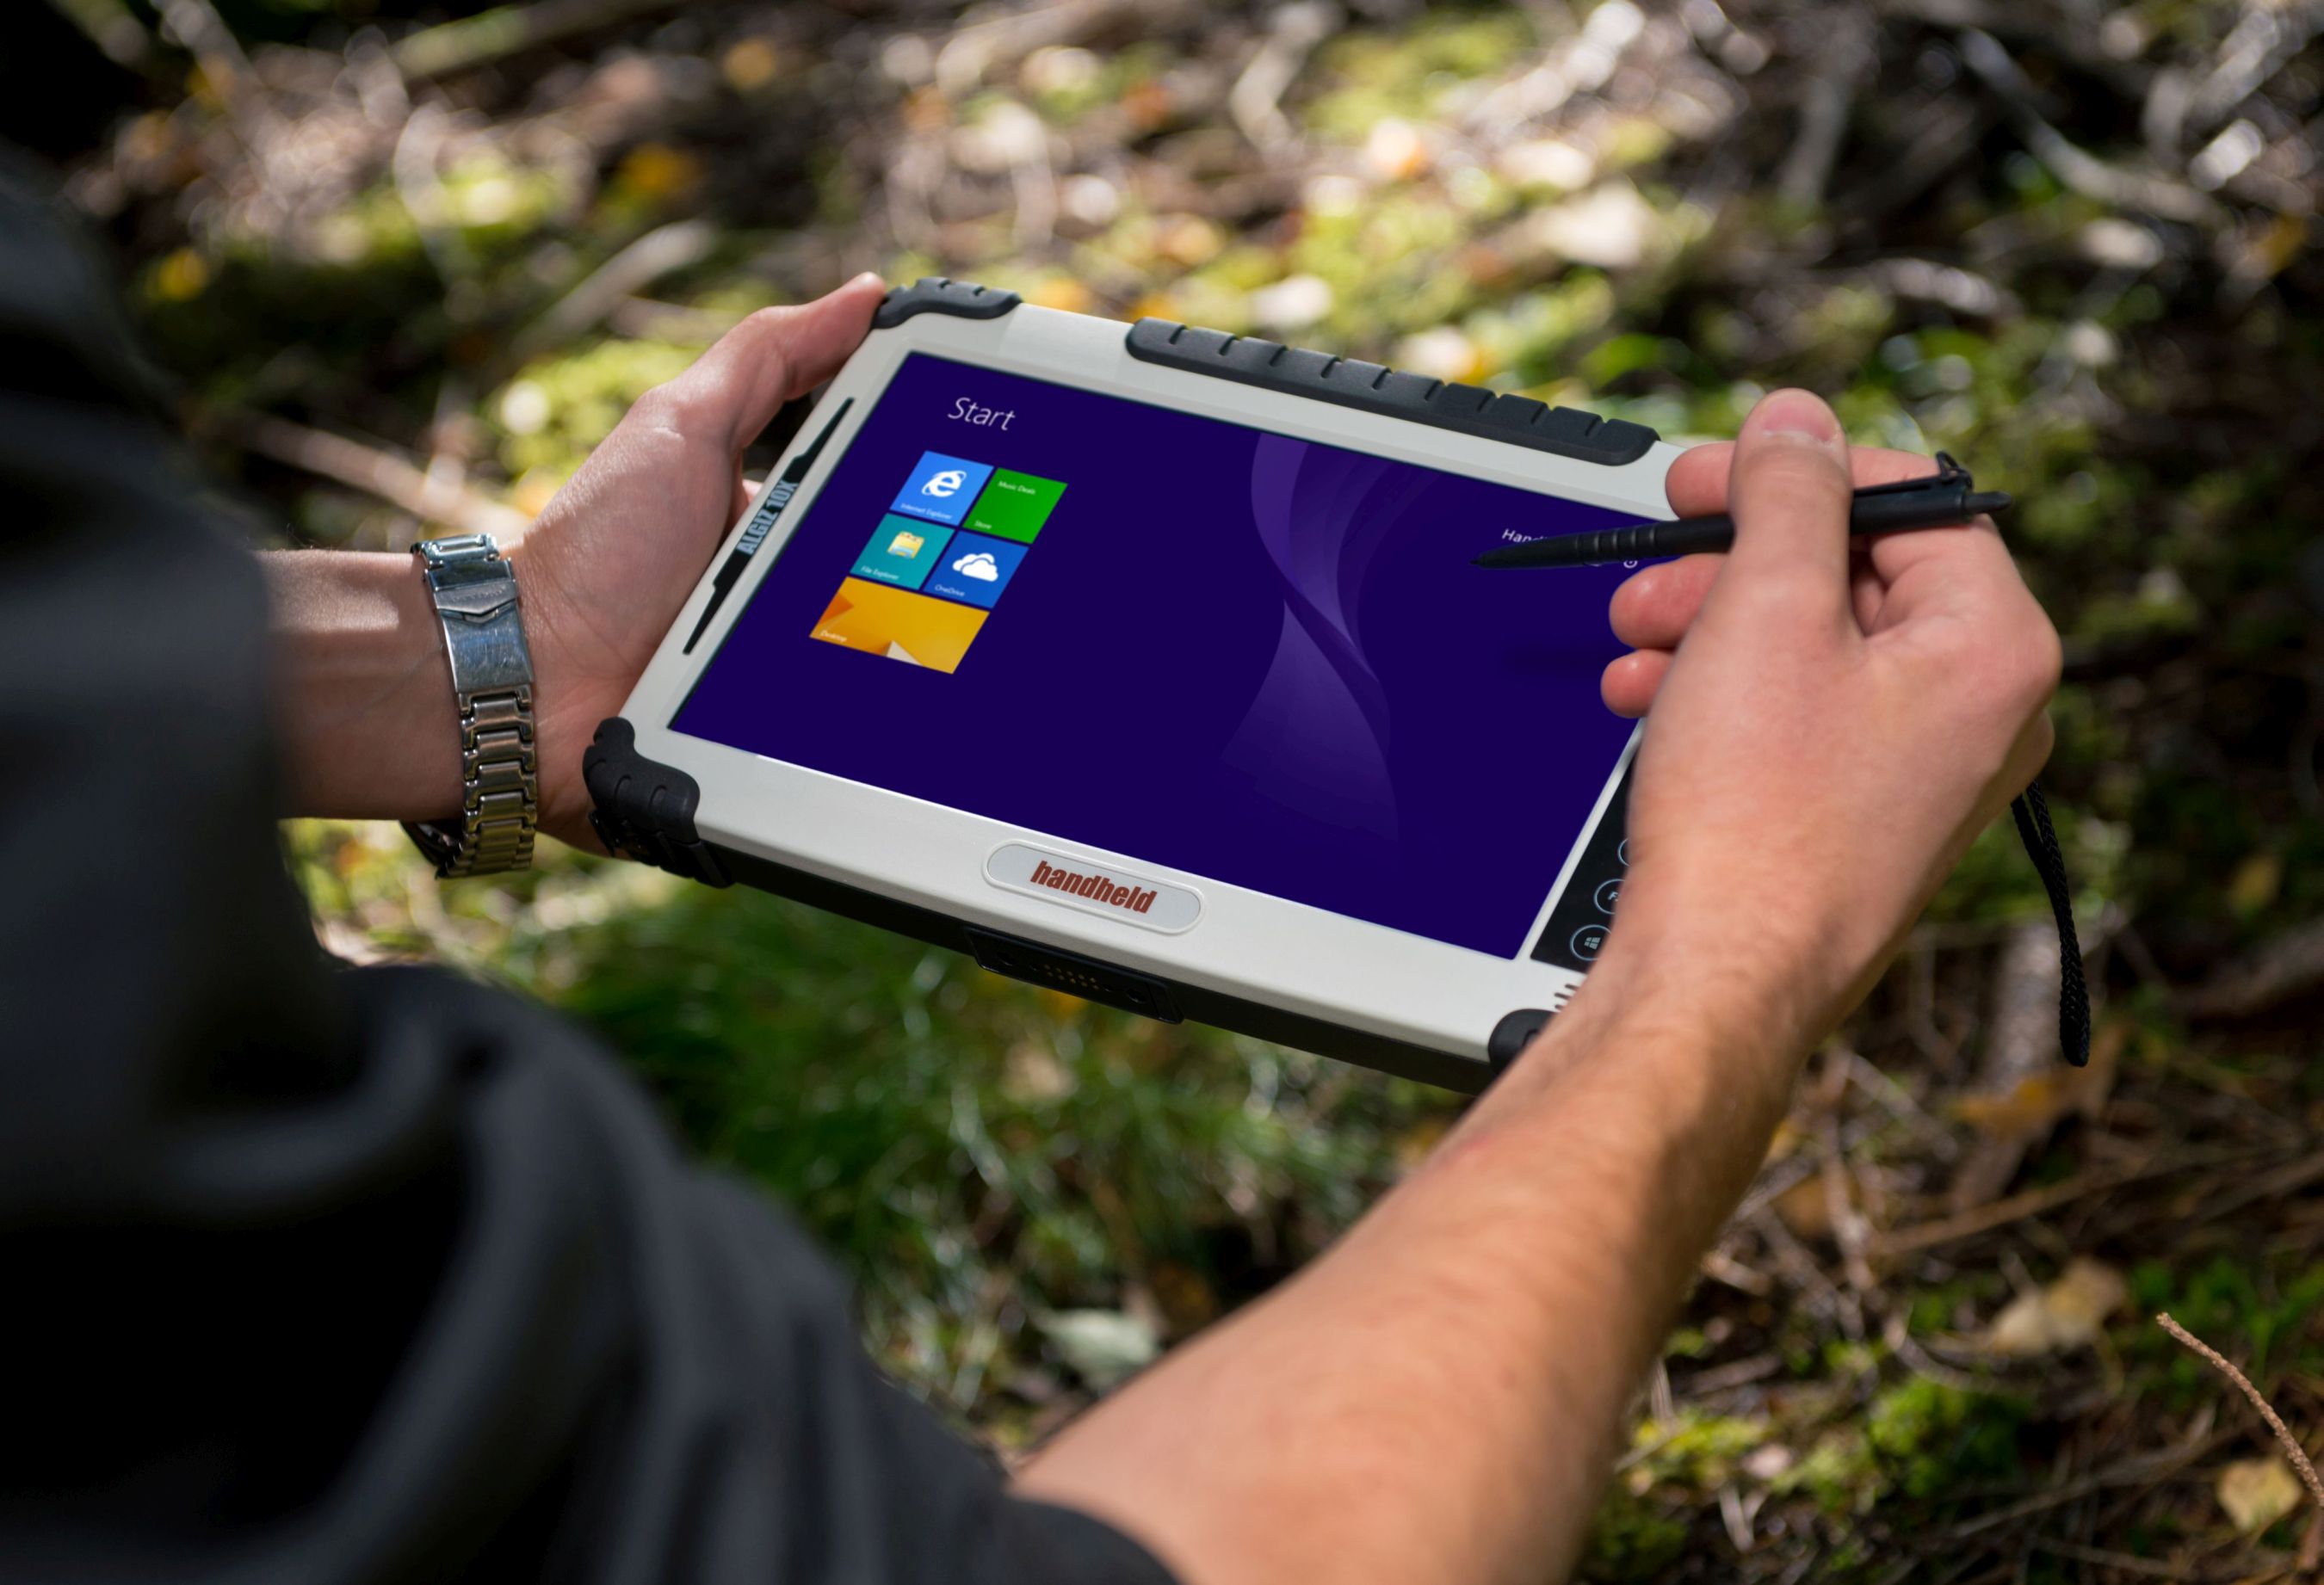
Handheld’s Algiz 10X rugged tablet now has Windows 8, a faster processor.
Handheld Group is upgrading its Algiz 10X tablet. With the upgrade, the rugged tablet for field professionals now features the Windows 8.1 Pro operating system, which is downgradable to Windows 7. Windows 8.1 Pro offers enhanced features to help users connect to company networks, access one PC from another, encrypt data and more.
The upgraded Algiz 10X also has a more powerful processor that speeds startup and operation, increases software compatibility and doubles processor performance. Its has an integrated u-blox GPS receiver with WAAS/EGNOS/MSAS capability.
Like all of Handheld’s rugged PDAs, smartphones and mobile computers, the Algiz 10X is specifically developed for field workers in industries such as geomatics, logistics, forestry, public transportation, utilities, construction, maintenance, mining, military and security. It is IP65-rated and meets stringent MIL-STD-810G military standards — protected against dust, water, vibrations, drops and extreme temperatures. It has a 10.1-inch touchscreen, weighs 1.3 kilograms (2.9 pounds) and is 32 millimeters (1.2 inches) thick.
“By using the very latest operating system available from Microsoft, customers can now enjoy quicker startup and operation, increased software compatibility and improved support for touchscreen-based tablets, among other benefits,” said Johan Hed, Handheld’s director of product management.
The new Algiz 10X also has the powerful Intel quad-core N2930 1.83 GHz processor with 2.16 GHz boost. This processor allows for both higher performance and cooler running temperatures. Compared to the Algiz 10X’s previous processor, the N2930 more than doubles performance benchmarking, RAM support, number of cores and performance per watt.
“We have dramatically increased performance levels without sacrificing operating time or mechanical design,” Hed concludes. “We have also improved our wireless communication support. Besides 802.11 b/g/n on 2.4 GHz, we now support both 802.11ac and 802.11a on 5 GHz. The upgraded Algiz 10X also supports LTE, which provides substantially faster data speeds, both up- and downstream, and increased overall network coverage.”
Key features of the Algiz 10X version 2:
Powerful Intel quad-core N2930 1.83 GHz processor
128 GB SSD, expandable via microSD
4 GB of DDR3 RAM
Windows 8.1 Industry Pro (downgradeable to Windows 7)
10.1-inch touchscreen with high-brightness MaxView screen technology
IP65 rating and conformity to stringent MIL-STD-810G test standards
LTE capability with a fully integrated modem and antennas
Integrated u-blox GPS receiver and WAAS/EGNOS/MSAS capability
Antenna pass-through connectors for both GSM and GPS
Several connectivity options, including WLAN and BT, USB 2.0 and USB 3.0, VGA and RS232 ports
The upgraded Algiz 10X is available now and orders can be placed immediately.
You may have heard about “NMEA data” with respect to GPS.
NMEA is an acronym for the National Marine Electronics Association. NMEA existed well before GPS was invented. According to the NMEA website, the association was formed in 1957 by a group of electronic dealers to create better communications with manufacturers. Today in the world of GPS, NMEA is a standard data format supported by all GPS manufacturers, much like ASCII is the standard for digital computer characters in the computer world.
The purpose of NMEA is to give equipment users the ability to mix and match hardware and software. NMEA-formatted GPS data also makes life easier for software developers to write software for a wide variety of GPS receivers instead of having to write a custom interface for each GPS receiver. For example, VisualGPS software (free), accepts NMEA-formatted data from any GPS receiver and graphically displays it. Without a standard such as NMEA, it would be time-consuming and expensive to write and maintain such software.
What makes NMEA a bit confusing is that there are quite a few “NMEA” messages, not just one. So, just like there are all kinds of GPS receivers with different capabilities, there are many different types of NMEA messages with different capabilities. Furthermore, NMEA data can be transmitted via different types of communications interfaces such as RS-232, USB, Bluetooth, Wi-Fi, UHF and many others.
NMEA Message Structure
To understand the NMEA message structure, let’s examine the popular $GPGGA message. This particular message was output from an RTK GPS receiver:
13 denotes number of satellites used in the coordinate
1.0 denotes the HDOP (horizontal dilution of precision)
495.144 denotes altitude of the antenna
M denotes units of altitude (eg. meters or feet)
29.200 denotes the geoidal separation (subtract this from the altitude of the antenna to arrive at the Height Above Ellipsoid (HAE).
M denotes the units used by the geoidal separation
1.0 denotes the age of the correction (if any)
0000 denotes the correction station ID (if any)
*40 denotes the checksum
The $GPGGA is a basic GPS NMEA message. There are alternative and companion NMEA messages that provide similar or additional information.
Here are a couple of popular NMEA messages similar to the $GPGGA message with GPS coordinates in them (these can possibly be used as an alternative to the $GPGGA message):
In addition to NMEA messages that contain a GPS coordinate, several companion NMEA messages offer additional information besides the GPS coordinate. Following are some of the common ones:
$GPGSA – Detailed GPS DOP and detailed satellite tracking information (eg. individual satellite numbers). $GNGSA for GNSS receivers.
$GPGSV – Detailed GPS satellite information such as azimuth and elevation of each satellite being tracked. $GNGSV for GNSS receivers.
$GPGST – Estimated horizontal and vertical precision. $GNGST for GNSS receivers.
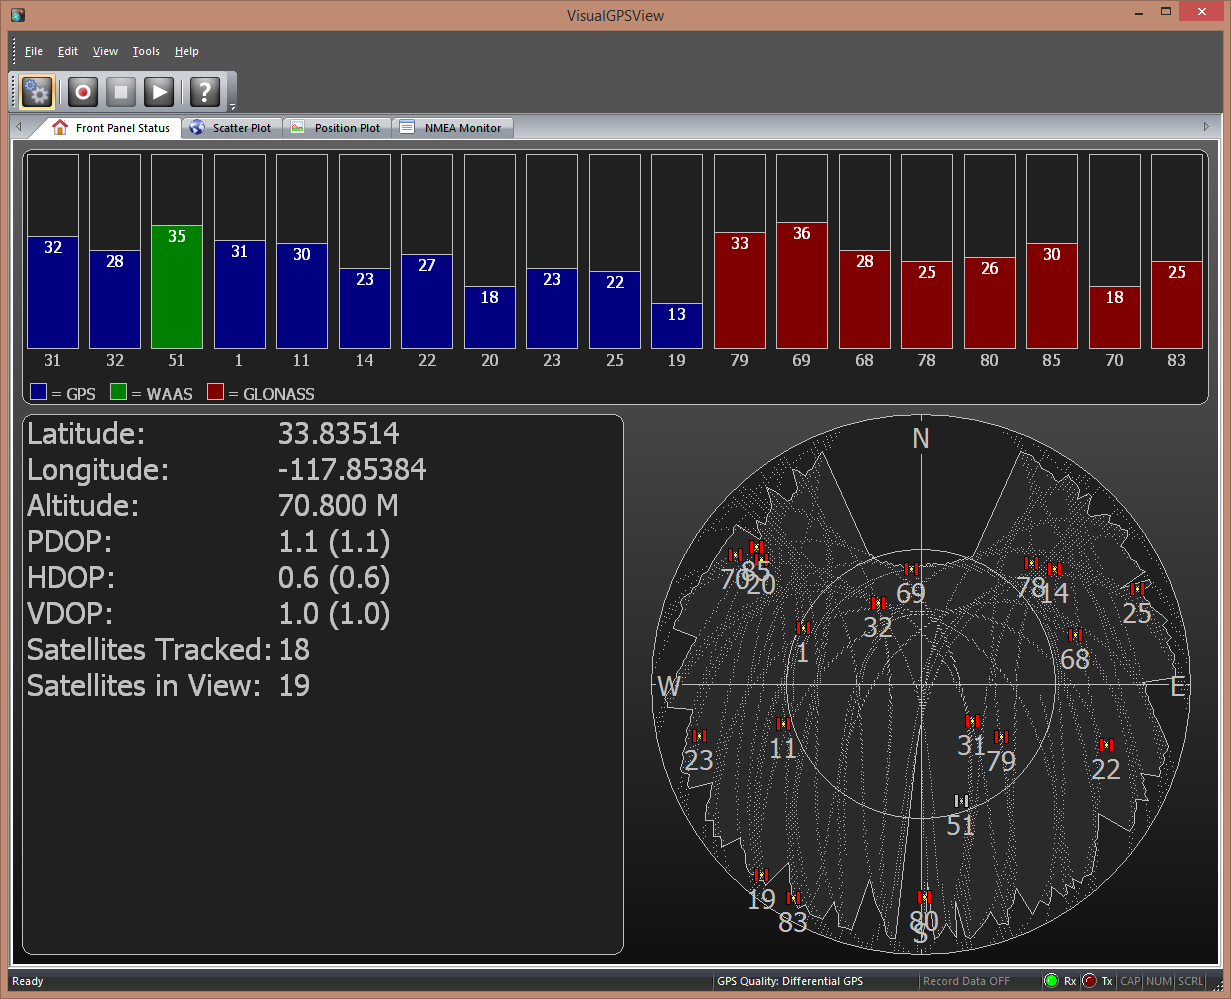
Rarely does the $GPGGA message have enough information by itself. For example, the following screen requires: $GPGGA, $GPGSA, $GPGSV.
VisualGPSView screenshot. (Photo: VisualGPC LLC)
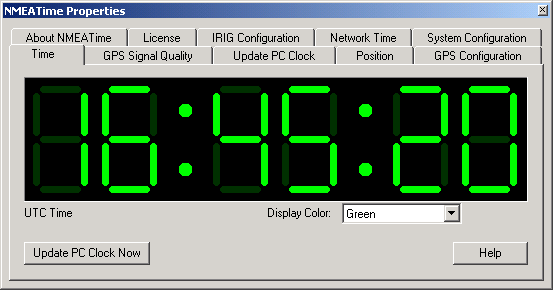
The following screen, focused on the time capabilities of GPS, requires a slightly different set of NMEA messages: $GPGGA or $GPRMC or $GPZDA, $GPGSA, $GPGSV.
NMEATime. (Photo: VisualGPC LLC)
The above screenshot examples are useful for the general GPS user. The $GPGST message is particularly useful for high-precision GPS mapping and surveying. In fact, I would say it’s a requirement for high-precision users. The reason is that GPS metadata is very important for the high-precision user as a method of assisting in determining the quality of a particular GPS coordinate. Typical GPS real-time metadata used in understanding the quality of the GPS coordinate include: PDOP, number of satellites tracked, correction method and horizontal/vertical standard deviation values. If a GPS receiver user has the ability to see this information in the field during data collection, they have a level of confidence in the precision of the GPS data they are collecting. If you’ve used RTK before, you probably recall the familiar horizontal RMS (HRMS) and vertical RMS (VRMS) values displayed on your data collection device. The $GPGST message generates those values.
DD.MMMMMMM, DDMM.MMMMM, or DDMMSS.SSSSS
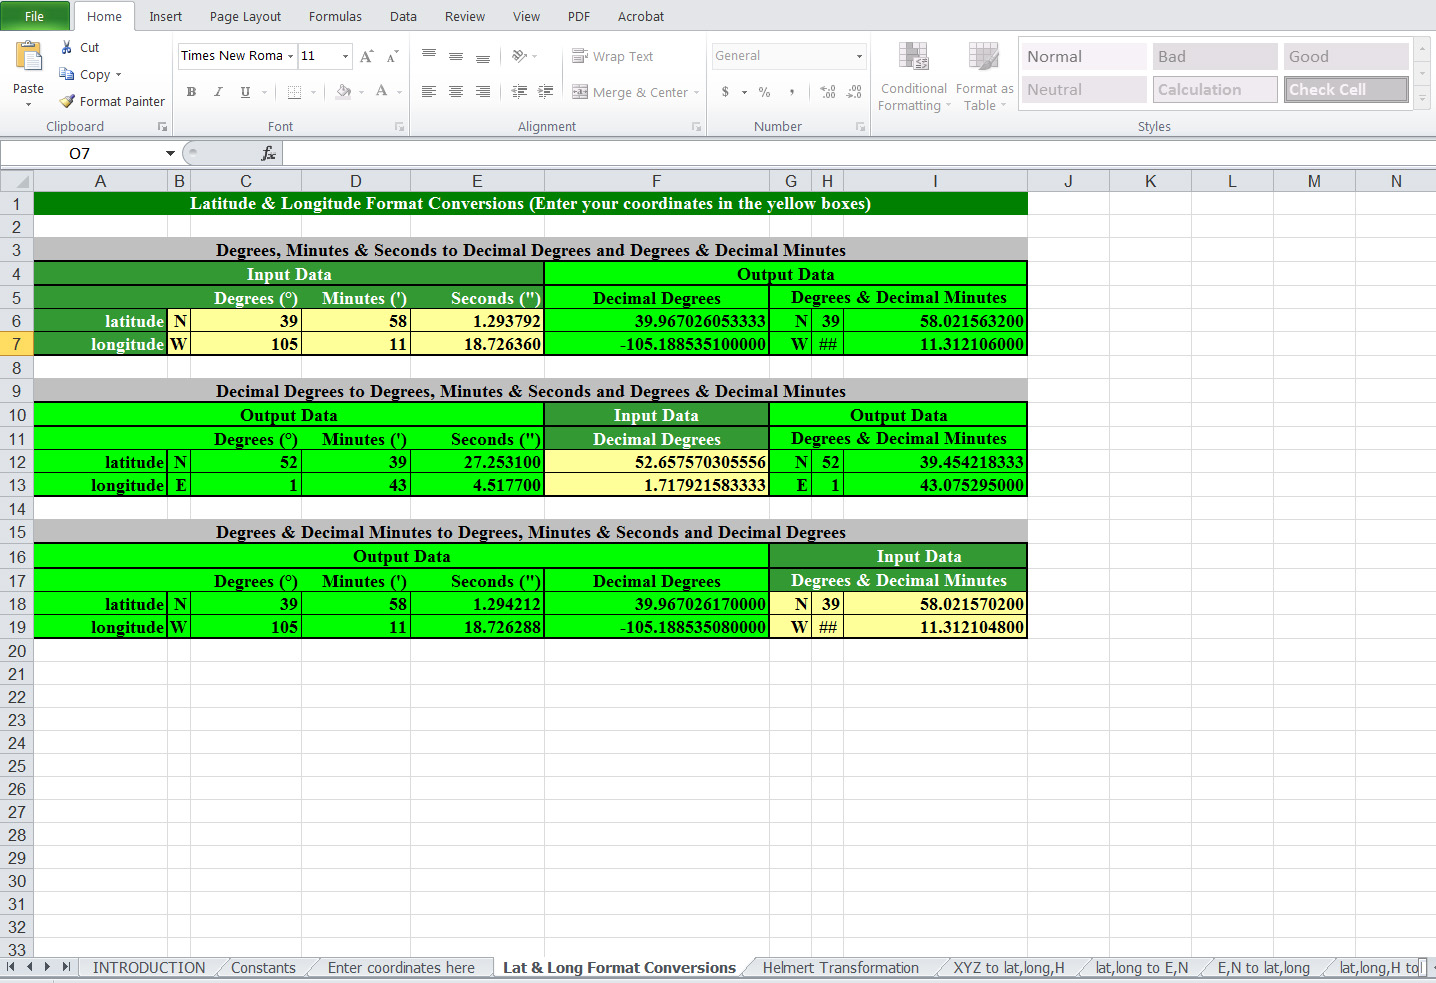
One of the challenges in dealing with raw NMEA data (data not using a software like VisualGPS to decode it for you) is the format of the GPS coordinate. It’s not user-friendly. It’s expressed in DDMM.MMMMM; degrees, minutes and decimal minutes. To display the coordinate in a different format, there’s a useful Excel spreadsheet published by the UK Ordnance Survey.
UK Ordnance Survey Coordinate Calculator
To use the spreadsheet, simply enter the GPS coordinate in the format you have, and the spreadsheet will calculate and display the GPS coordinate in the other two formats.
Click here to download the UK Ordnance Survey Excel spreadsheet coordinate calculator.
Topography of Mount Cook, New Zealand’s tallest peak, changed following a rock avalanche. (Photo Wikipedia Commons, C.M. Lynch)
The National School of Surveying, University of Otago, implemented Hexagon Geospatial technologies provided by Intergraph in its quest to measure the summit of Mount Cook, the tallest mountain in New Zealand and a UNESCO World Heritage Site. The University of Otago is New Zealand’s oldest university.
The university turned to Hexagon Geospatial’s ERDAS IMAGINE and IMAGINE Photogrammetry (formerly LPS) to help measure the height of Mount Cook, also called Aoraki, following a large rock avalanche that changed the peak’s topography and height in 1991. For many years, the university has benefited from Hexagon Geospatial’s education licenses through Intergraph, and chose these technologies for the project because of their image processing and photogrammetric capabilities, as well as integrated workflows.
“ERDAS IMAGINE is the cornerstone of the project. It started from there,” said Pascal Sirguey, senior lecturer at National School of Surveying and project leader. “Using the photogrammetric capability, we were led to look more closely at what the model was telling us. The software gave us the right answer in the end.”
Following the avalanche, a resurvey found the mountain to be 3,754 meters high — down from the surveying estimate of 3,764 meters in 1881. The university undertook the unique challenge of validating the new elevation. Photogrammetry and remote sensing were the only viable methods for measuring the summit as it is considered sacred by the Maori tribe of Ngāi Tahu and standing on it is prohibited.
Using Hexagon Geospatial’s software, along with Global Navigation Satellite System receivers, the university determined the actual height of Mount Cook is 3,724 meters. For the university’s remarkable efforts, Sirguey received the top award from the New Zealand Institute of Surveyors in 2014 for teaching and education and the New Zealand Spatial Excellence Award 2014 in the Education and Professional Development category.
The University of Otago was founded in 1869 by an ordinance of the Otago Provincial Council. Its School of Surveying offers the only academic qualification leading to professional recognition as a professional land surveyor in New Zealand, following a period of post-graduation training and examination by the New Zealand Institute of Surveyors. The courses offer a broad range of disciplines — surveying, land planning and development, survey measurement and Geographic Information Systems — that equip graduates for a professional career.
Provided through Intergraph, Hexagon Geospatial’s education program provides the university with a complete geospatial software portfolio that offers support and tools for academic research projects and teaching.
Hemisphere GNSS is offering the Vector V104, a tiny high-accuracy, dual-receiver GPS compass and the latest addition to its precise heading and positioning product line.
“Our Vector V104 provides an astonishing level of accuracy in such a small form factor,” said Chuck Joseph, Hemisphere president and CEO. “The smart, compact design offers better than 2° heading accuracy and sub-meter DGPS position accuracy without requiring maintenance or calibration and while being immune to magnetic interference.”
Based on the company’s patented Crescent Vector technology, the Vector V104 integrates two GPS antennas, a multi-axis gyro, and a tilt sensor into a single, easy-to-use system. The dual-integrated antennas provide both heading and position data, and the gyro and tilt sensor improve system performance and provide backup heading information if the GPS-based heading is ever lost.
The Crescent technology provides highly accurate code phase management and outstanding multipath mitigation. This results in excellent accuracy and stability, enabling the user to install the V104 in areas where competing products have difficulty.
“As the world’s smallest GPS compass, the V104 will significantly change the onboard experience in navigation, making it more accurate, easier to install, and more cost efficient,” said Anders Bergström, founder and senior partner of True Heading AB, who sells a custom-branded V104 as the Vector Compact into the marine market.
An alternative to traditional gyro and fluxgate compass sensors, the Vector V104 offers a choice of either serial or NMEA2000 communications and is designed for a wide array of applications, especially in the marine, GIS mapping, and machine control markets.
Presentations, posters and articles presented at the 10th International gvSIG Conference are now available online. The conference was held Dec. 3-5, 2014, in Valencia, Spain.
Videos of sessions and workshops are also available online. All of the videos are available with both English and Spanish audio, except for three workshops given on Wednesday and Thursday that are only in Spanish.
“With this publishing, we pretend to bring the Conference closer to the interested people that couldn’t attend the event, having the possibility to access the recording of the different sessions,” gvSIG organizers said.
Python Scripting for ArcGIS,a new book published by Esri Press, seeks to help experienced users of ArcGIS for Desktop get started with Python scripting. The book teaches users how to write Python code that works with spatial data to automate geoprocessing tasks in ArcGIS. Experience with other scripting or programming languages is helpful but not required.
Key topics in this book include Python language fundamentals, exploring and manipulating spatial data, working with geometries and rasters, map scripting, debugging and error handling, creating functions and classes, and creating and sharing script tools. Python Scripting for ArcGIS contains 14 chapters with corresponding online data and exercises available on the Esri Press book resource page.
Author Paul A. Zandbergen is an associate professor of geography at the University of New Mexico in Albuquerque where he teaches classes in GIS and spatial analysis. His areas of expertise include GIS applications in criminology, economics, health, and ecology, as well as spatial and statistical analysis techniques using GIS.
Python Scripting for ArcGIS is available at online retailers worldwide, at esri.com/esripress, or by calling 1-800-447-9778. Outside the United States, visit esri.com/esripressorders for complete ordering options, or visit esri.com/distributors to contact your local Esri distributor. (Print ISBN: 978-1-58948-371-2, 358 pages, US$79.99) (E-book ISBN: 978-1-58948-362-0, 358 pages, US$79.99).
A mobile-optimized edition is available from the Esri Books app (ISBN: 978-1-58948-402-3, US$59.99).
DAT/EM Systems International has released the 7.1 edition of DAT/EM software products, including Summit Evolution, Landscape, Capture, MapEditor, Ortho+Mosaic, Airfield3D and Contour Creator. The advancements in the 7.1 DAT/EM Photogrammetric Suite represent the latest evolution in technology and are based on customer input and growth within the geospatial industry, the company said.
DAT/EM Photogrammetric Suite Version 7.1 Highlights
A new Multiple Project Solution combines different project types that have any input coordinate systems and displays them in multiple viewports. The viewport cursors move together where the diverse projects share the same geographic area. This allows use of imagery from sources such as aerial, orthophoto, ADS, and satellite RPC at the same time.
Oblique imagery support in the aerial project type. Oblique options will apply for any imagery where omega and phi are greater than 15 degrees.
Enhanced printing options, such as print preview, print in anaglyph, print with boundaries, print with full superimposition, virtually print to TIFF, and print to a higher resolution.
A Direct Linear Transform (DLT) model has been added to Summit close range projects. This model allows Summit to orient photos without a known camera calibration.
Named Image Adjustments is a new tool that saves image adjustment profiles for repeated use. It can also link to a Channel Map configuration.
Aerial projects can now define image scale, earth curvature correction, and refraction correction by a new Use heights method, which defines individual model scales and is used in steep terrain.
A second generation beta of the Global Mapper Extension. The Extension connects Blue Marble Geographics Global Mapper with any Summit Evolution edition (Professional, Feature Collection or Lite).
LandScape offers a new slider to adjust the intensity of color.
All DAT/EM products support new file formats, including LAZ format for both read and write operations, all LAS 1.4 for read only, and LAS 1.4 non-waveform formats for read and write.
ArcGIS 10.3 is now available with the release of ArcGIS Pro, Esri announced. ArcGIS 10.3 realizes the vision of web GIS, which empowers customers to use information anywhere and on any device. It includes new apps and enhancements that continue to advance the science of geography and GIS and enable users to more readily share their work throughout their organizations, Esri said.
“ArcGIS 10.3 is a very large release that fully completes the picture of ArcGIS for organizations and enterprises,” said Sud Menon, director of software development and engineering, Esri.
The release of ArcGIS 10.3 transforms the entire ArcGIS platform and is headlined by the introduction of ArcGIS Pro.
ArcGIS Pro
ArcGIS Pro is a new desktop GIS application from Esri. Designed as a multithreaded 64-bit application for Windows, ArcGIS Pro takes advantage of modern technology that allows users to visualize, edit, and analyze data faster than ever before. With ArcGIS Pro, users can create and work with geographic layers in both 2D and 3D and share map information as feature layers, imagery, maps, analysis services, 3D web scenes, and web maps.
“ArcGIS Pro is an integral part of the ArcGIS platform,” said Menon. “It’s our premium application for authoring maps and scenes that can be easily shared through the web GIS model.”
ArcGIS Pro is included at no charge with every license of ArcGIS 10.3 for Desktop. Users can run ArcGIS Pro simultaneously with any version of ArcMap.
SmarterBetterCities, a start-up based in Switzerland, uses ArcGIS Pro to help cities understand the impacts of zoning changes in 3D. “We understand our world in 3D. ArcGIS Pro is a fantastic platform for us to create affordable next generation planning tools for small town and big city planning,” said Antje Kunze, CEO of SmarterBetterCities.
ArcGIS in Your Own Infrastructure
At ArcGIS 10.3, Portal for ArcGIS is now included at no charge with ArcGIS for Server Standard or Advanced licenses. With Portal for ArcGIS, users can bring the full ArcGIS experience into their own infrastructure for secured stand-alone or hybrid deployments in ArcGIS Online. Portal for ArcGIS also gives organizations access to the full suite of ArcGIS apps, including the new Web AppBuilder for ArcGIS, so that they can more easily share maps and analyses across their enterprise.
Better 3D across the Platform
ArcGIS 10.3 features improved support for 3D data across the entire ArcGIS platform. In addition to the 3D capabilities in ArcGIS Pro, Esri has also released a new web scene viewer in ArcGIS Online that lets users create 3D scenes by mashing up existing layers directly within a browser.
Real-Time GIS
ArcGIS 10.3 fully integrates real-time, streaming data into the ArcGIS platform. ArcGIS GeoEvent Extension for Server delivers improved performance and throughput capabilities, as well as faster spatial filtering. ArcGIS GeoEvent Extension for Server also offers better scalability by allowing organizations to create clusters that can handle higher volumes of data. Users can take advantage of new spatial operators and processors in ArcGIS 10.3 to perform more powerful spatial filtering and real-time analytics.
More Opportunities for Developers
From the launch of Web AppBuilder for ArcGIS to the enhanced JavaScript API, ArcGIS 10.3 offers new capabilities for developers across the board. This release also marks the beginning of a wave of releases that will further help developers build mobile applications using ArcGIS Runtime.
For more information on the dozens of other improvements in ArcGIS 10.3, visit esri.com/whatsnew.
The U.S. Geological Survey citizen science project, The National Map Corps, has realized remarkable response. In less than two years, the volunteer-based project has harvested more than 100,000 “points.” Hundreds of volunteer cartographers are making significant additions to the USGS ability to provide accurate mapping information to the public.
Each point represents a structure or manmade feature on a map that has been verified and updated, and then submitted to support The National Map and US Topo maps.
Using crowd-sourcing techniques, the USGS Volunteer Geographic Information project known as The National Map Corps (TNMCorps) encourages citizen volunteers to collect manmade structure data in an effort to provide accurate and authoritative spatial map data for the USGS National Geospatial Program’s web-based map products.
“I am 80 years old. I work three days a week for a golf course trapping moles and gophers,” said a prominent citizen scientist volunteer who goes by the handle Mole Trapper. “I spent 11 years volunteering for a fish and wildlife agency. When the big landslide at Oso, Washington, happened, I went on the USGS website and discovered the map corps. I worked summers while in high school for a surveyor who was very precise, and he told me an inaccurate survey is worthless. I hate inaccurate maps, so this program was just right for me. I hope my work is as accurate as it can be, but if it isn’t, I plead old age.”
Structures being updated include schools, hospitals, post offices, police stations and other important public buildings. The data being collected by volunteers becomes part of The National Map structures dataset, which is made available to users free of charge.
“I am retired from an unrelated field, but I have loved maps and travel all my life,” explained another active volunteer who goes by fconley. “When I saw that USGS was looking for volunteers, I immediately joined, first working with paper maps and quads. As digital mapping, satellite imagery, and GPS became more available I was enthralled. With the imagery now accessible, it is almost like being able to travel sitting at my desk. At times, locating structures seems similar to solving puzzles or detective work. This whole project is not only enjoyable,it makes me feel that I am making a lasting and useful contribution. I am thankful for the opportunity to be involved in this fascinating endeavor.”
Beginning as a series of pilot projects in 2011, The National Map Corps has grown state by state to include the entire U.S. By August 2013, volunteers were editing in every state in the country and the U.S. territories. To date, the number of active volunteers has grown to 930, including some participants who have collected in excess of 6,000 points.
To show appreciation of the volunteers’ efforts, The National Map Corps instituted a recognition program that awards “virtual” badges to volunteers. Each edit submitted is worth one point towards the badge level. The badges consist of a series of antique surveying instruments and images following the evolution of land survey and moving to aerial observation of the Earth’s surface, such as pigeon-mounted cameras and hot-air balloons. Additionally, volunteers are publicly acknowledged (with permission) via Twitter, Facebook and Google+.
The gvSIG Association has published the final version of gvSIG 2.1. This is the first version based on the new architecture oriented to users, and offers many new features, the association said.
Besides the new functionalities and the correction of a great number of errors that were detected through community collaboration, the association wants to highlight the availability of a distribution for Linux 64 bits and portable versions for Windows as well as Linux.
Along with the gvSIG 2.1 release, gvSIG has published a new gvSIG website that includes the old gvSIG Association website as well as the project website. It will also serve as a knowledge portal about gvSIG technology. The new website features gvSIG’s catalog of products, such as gvSIG Roads or gvNIX.
“We want to take advantage of this announcement to thank all the people that have collaborated in making this new version reality, and all the entities that have counted on the gvSIG Association services to solve their needs on geomatics, helping to guarantee the sustainability of the project,” the association said in a statement.
Features in the latest version include:
Legends
– Expresions
– Proportional symbols
– Graduated symbols
– Dot density
– Quantities by category
– Charts (pies and bars)
– Import/export SLD
Copy/paste geometries
Lateral buffer
Split line
Consecutive numbers function
Duplicated records function
Derived geometries
Chart document
Map sheets (map series)
Connection with OpenStreetMap services
New symbol libraries: Geology, POI Cities, Commerce, Military-APP6, Collective Mapping, Colors, AIGA, Weather
PostGIS 2.x support (raster and vector)
Layout
– Insert chart
– New layout with TOC (table of contents) included.
– New grid functionalities.
Portable views (thematic maps plugin)
Advanced dissolve geoprocess
Labeling
– Advanced labeling
– Halo option
– Always show label option
Raster
– Set projection to layer
– Change data type
– Create multi-file layer
– Convert to grayscale
– Integration of tools in the geoprocessing toolbox
Trimble has introduced Trimble TrimView Direct, a mobile application that leverages existing real-time data collected by Trimble’s TrimFleet Suite for the ready-mix concrete industry. Trimble has teamed with development partner, BCMI, to expand on how the data is viewed and used by top-level management.
By leveraging mobile technology, organizations have access to instantaneous information so managers no longer need to wait for paper reports to understand the state of their business. Using TrimView Direct, ready-mix producers and management across the organization have real-time access to critical data that impact their daily business decisions. The app collects information from existing systems and integrates it in a Web-based environment to deliver an accurate view of the company’s strengths, customer trends and opportunities for improvement on a mobile platform.
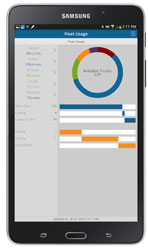
The app, available on iOS and Android devices, provides a dashboard of real-time data, including order status, ticket details, order timelines, fleet analytics and performance, vehicle location, trip status, signal health, driver hours and performance. The data can be filtered and viewed using maps, graphs, charts and timelines for a visual representation of critical information.
TrimView Direct is organized in modes: delivery, fleet and driver. Navigating using scrolling menus and toggle screens, users can tap or swipe the page to instantly find and record data.
For example, managers use the fleet dashboard to see average cycle miles, current fleet usage, average costs, signal health and delivery performance for a fleet, plant, truck or group of trucks. Sales and account managers who are on a customer site can reference data in the field, including order status, performance, timeline and ticket information.
“Our work with BCMI empowers today’s mobile worker,” said Glenn Bramer, director of marketing for Trimble Construction Logistics. “As we continue to develop solutions that transform the way work is done, we must look at how we can extend valuable information beyond desktop users and enable management to make smarter decisions anytime, anywhere. TrimView Direct is a bold step in this direction.”
“Coupling Trimble’s expertise in collecting real-time data for improved productivity with our movement to modernize the tools and processes for ready mix operations, we have enabled the entire concrete production chain, both human and machine, to interact with actionable, real-time information,” said Bernie Benson, co-founder of BCMI.