My colleague Janice Partyka wrote a provocative blog in the Wireless/LBS Insider on discovery of the brain’s inner GPS, which won three scientists a Nobel Prize for medicine. The piece struck me so forcefully in the hippocampus, locus of my location sensibility, that I was tempted to place it here verbatim. That would not justify me, however, in drawing my pay, so I add my two cents worth. Literally. Two cents worth.
Partyka’s theme: “How does our brain understand where our body is in space, and navigate us from home to work?” She wrote that one scientist found “a type of nerve cell in the brain’s hippocampus, our short-term memory storage bin, was always activated when a rat was at a certain place in a room. As a rat ran through a maze, a particular sequence of individual neurons fired. Other nerve cells were activated when the rat was positioned elsewhere. O’Keefe concluded that these ‘place cells’ formed a map of the room.
“When the rats slept, the same sequences of place cells that were fired earlier in the day fired again. Researchers think that this replay helps to transfer the rat’s memory of the maze from the hippocampus into long-term storage. Place cells also attach to memories of a particular location. When sitting at a table, a person or maybe even a rat might remember a pizza that was eaten at that spot.
“Many decades later, the Mosers discovered another component of the brain’s positioning system. They identified ‘grid cells,’ which are thought to act like a dead-reckoning system and generate a coordinate system to allow for precise positioning and pathfinding. The grid cells create a location to put place cells and organize position locations. Rats running around an open floor (hopefully not mine), will fire neurons that map out a grid of equilateral triangles that serve as a spatial map. Grid cells can function in complete darkness, without visual cues. Together, place and grid cells make it possible to determine position and to navigate.
“While place and grid cells were first discovered in rats, studies using brain imaging indicate that they also occur in humans.”
As I sit here in mid-October listening to the World Series (for some deeply buried irrationality, sleeping in the Americana of my mind, I believe that baseball is better on radio than on TV), I visualize the athletes lunging and spearing and leaping about the field of play, barely having to look because they know the cells and grids of it so well. They just react to the ball and — smack! — it arrives in the first baseman’s glove. And what of the pitcher, who knows the strike zone so totally, so certainly, so inwardly, at 60 feet’s distance from his outstretched arm, that he can navigate a small spheroid precisely, on a curved path no less, to its lower left corner?
Technology enhances our sense of location, as we in particular know so well. But technology can be fooled, perhaps more easily than the brain. Could the brain be convinced that its body was speeding towards Libya when in reality it placidly cruised northward in mid-Adriatic? Imagine how your brain would fare against the spoofer in this issue’s cover story.
Ambiguity and Environmental Data: Two Further Key Challenges of Multisensor Positioning
By Paul D. Groves, Lei Wang, Debbie Walter, and Ziyi Jiang, University College London
The coming requirements of greater accuracy and reliability in a range of challenging environments for a multitude of mission-critical applications require a multisensor approach and an over-arching methodology that does not yet exist. Part 1 of this article, in the October issue, examined the two key concepts of complexity and context. In this continuation, we complete our overview with exploration of the requirements of ambiguity and environmental data.
Ambiguity occurs when measurements can be interpreted in more than one way, leading to different navigation solutions, only one of which is correct. Any navigation technique can potentially produce ambiguous measurements. The likelihood depends on both the positioning method and the context, both environmental and behavioral. Urban and indoor positioning techniques that do not require dedicated infrastructure are particularly vulnerable to ambiguity. Poor handling of ambiguity results in erroneous navigation solutions and the navigation system can become “lost,” whereby it is unable to recover and may even reject correct measurements.
There are six main causes of ambiguity: feature identification, pattern matching, propagation anomalies, geometry, system reliability, and context ambiguity. Each of these is described in turn below.
Feature Identification Ambiguity. The proximity, ranging, angular positioning, and Doppler positioning methods all use landmarks for positioning. These may be radio, acoustic, or optical signals, or natural or man-made features of the environment. For reliable positioning, these signals or features must be correctly identified.
Digital signals intended for positioning incorporate identification codes. However, where a signal is weak and/or interference is high, it may be possible to use the signal for positioning but not decode the identification information. For signals of opportunity — that is, not designed for positioning — the identification codes may be encrypted, while analog signals do not typically have identifiers. These signals must be identified using their frequencies and an approximate user position, in which case there may be multiple candidates. Even where a signal of opportunity is identifiable, the transmission site may change without warning. For example, Wi-Fi access points are sometimes moved and mobile phone networks are periodically refigured. Thus, there is a risk of false landmark identification.
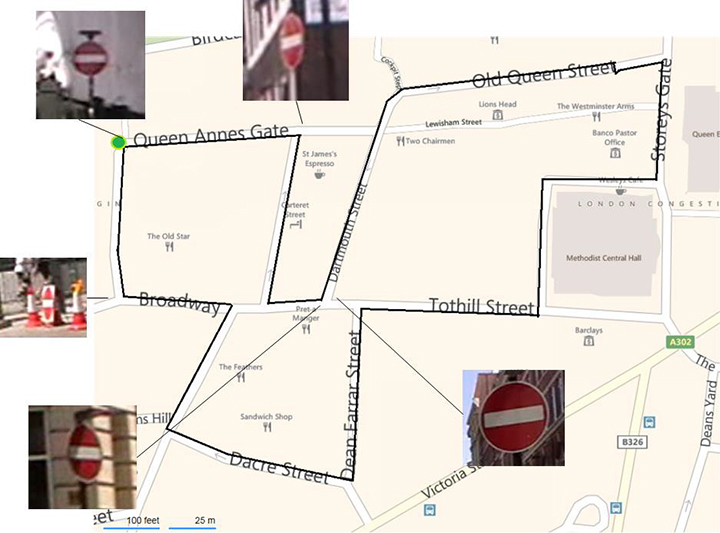
Environmental features are difficult to identify uniquely. In image-based navigation, man-made features, such as roads, buildings, and signs, are easiest to identify in images due to their line and corner features. However, similar objects are often repeated in relatively close proximity. For example, Figure 18 shows the locations of the five “no entry” signs in a 1,200-meter circuit of Central London streets. Two of the signs are within 20 meters of each other. (Figure numbering continues the sequence beginning in Part 1, October issue.)
Figure 18. “No entry” signs in a 1,200-meter circuit of Central London. (Background image courtesy of Bing maps | Photo: Paul D. Groves, Lei Wang, Debbie Walter and Ziyi Jiang, University College London)
Pattern-Matching Ambiguity. The pattern-matching positioning method maintains a database of measurable parameters that vary with position. Examples include terrain height, magnetic field variations, Wi-Fi signal strengths, and GNSS signal availability information. Values measured at the current unknown user position are compared with predictions from the database over a series of candidate positions. The position solution is then obtained from the highest scoring candidate(s).
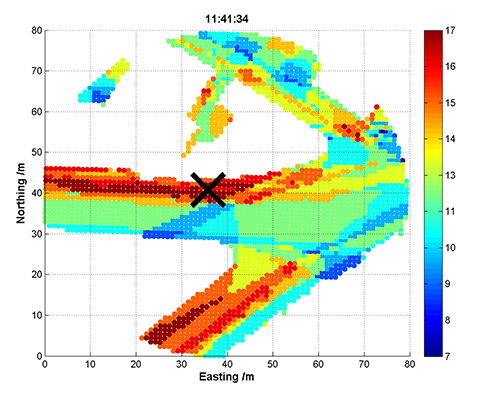
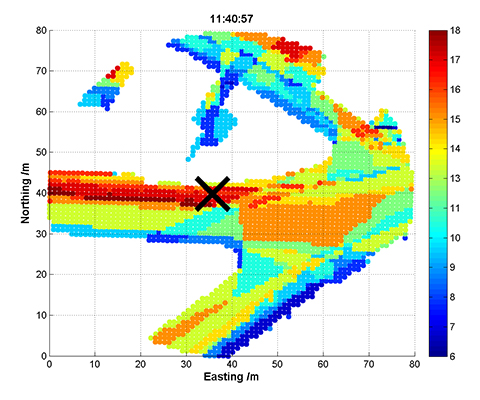
An inherent characteristic of pattern matching is that there is sometimes a good match between measurements and predictions at more than one candidate position. Figure 19 and Figure 20 show GNSS shadow-matching scoring maps based on smartphone measurements taken at the same location 40 seconds apart. The scores are obtained by comparing GNSS signal-to-noise measurements with signal availability predictions derived from a 3D city model. In Figure 19, maximum scores (shown in dark red) are only obtained in the correct street, whereas in Figure 20, there is also a high-scoring area in the adjacent street, giving two possible position solutions.
Figure 19. GNSS shadow-matching scoring map – unambiguous case (the cross shows the true position and white areas are indoor locations). (Photo: Paul D. Groves, Lei Wang, Debbie Walter and Ziyi Jiang, University College London)Figure 20. GNSS shadow-matching scoring map – unambiguous case (the cross shows the true position and white areas are indoor locations). (Photo: Paul D. Groves, Lei Wang, Debbie Walter and Ziyi Jiang, University College London)
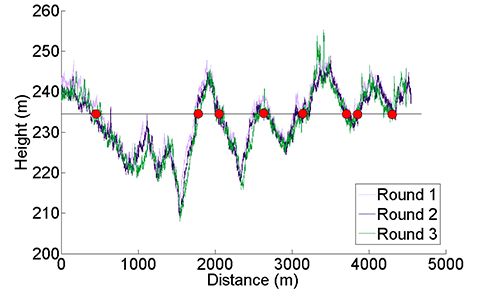
Figure 21 presents another example, showing the height of a road vehicle derived from a barometric altimeter at three different times. Provided the altimeter is regularly calibrated, it may be used for terrain-referenced navigation (TRN), determining the car’s position along the road by comparing the measured height with a database. However, if only the current height is compared, it will typically match the database at multiple locations within the search area, as the figure shows. The ambiguity can be reduced by comparing a series of measurements from successive epochs, known as a transect, with the database. This approach is applicable to any pattern-matching technique. However, increasing the transect length to reduce the ambiguity also reduces the update rate, and the ambiguity problem can never be eliminated completely.
Figure 21. Height of a car derived from a barometric altimeter at three different times; readings of around 235 m are highlighted. (Photo: Paul D. Groves, Lei Wang, Debbie Walter and Ziyi Jiang, University College London)
Signal Propagation Anomalies. The ranging, angular positioning, and Doppler positioning methods all make the assumption that the signal propagates from the transmitter (or other landmark) to the user in a straight line at constant speed. Significant position errors can therefore arise when these assumptions are not valid due to phenomena such as non-line-of-sight reception, multipath interference, and severe atmospheric refraction. In challenging environments, such as dense urban areas and indoors, multiple signals are typically affected by propagation anomalies, and it is not always easy to determine which signals are contaminated.
Where the position solution is overdetermined (that is, more than the minimum number of signals are received), different combinations of signals will produce different position solutions when there are significant propagation anomalies.
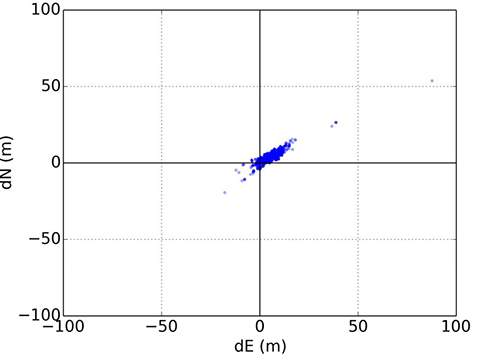
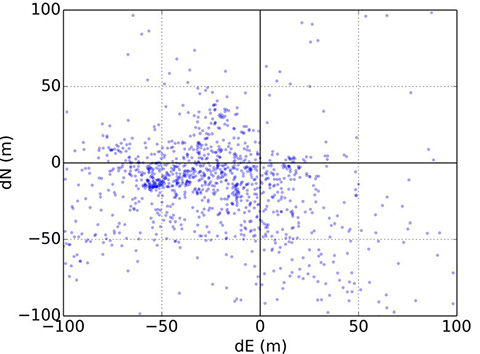
Figures 22 and 23 illustrate this for conventional GNSS positioning using a Leica Viva geodetic receiver, showing the position errors obtained using different combinations of GPS and GLONASS signals. In Figure 22, the receiver is located on a high rooftop and the majority of position solutions are within 15 meters of the mean, with the remainder easily dismissible as outliers. However, in Figure 23, where the receiver is located in a dense urban location, the candidate position solutions are spread over more than 100 meters, and the correct position solution is not clear. The densest cluster of positions is far from both the centroid and the truth. Therefore, anomalous signal propagation may be treated as an ambiguity problem.
Figure 22. GNSS position errors using different combinations of signals in a rooftop environment. (Photo: Paul D. Groves, Lei Wang, Debbie Walter and Ziyi Jiang, University College London)Figure 23. GNSS position errors using different combinations of signals in a dense urban environment. (Photo: Paul D. Groves, Lei Wang, Debbie Walter and Ziyi Jiang, University College London)
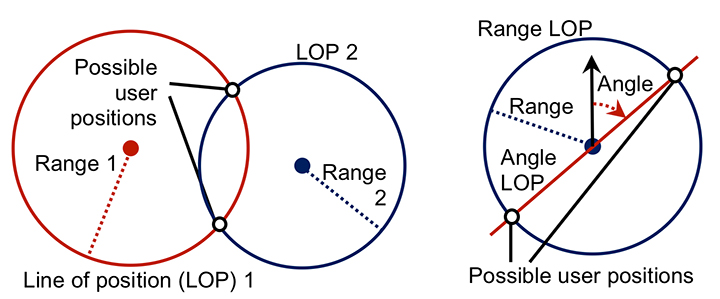
Geometric Ambiguity. Geometric ambiguity occurs when more than one position solution may be derived from a set of otherwise unambiguous measurements. Figure 24 shows two examples. On the left, two ranging measurements in two dimensions produce circular lines of position that intersect in two places. On the right, a ranging measurement and a direction-finding measurement are made using the same signal. As direction finding has a 180° ambiguity, the lines of position also intersect at two places.
Figure 24. Geometric ambiguity in two dimensions from two ranging measurements (left), and a ranging and direction-finding measurement (right). (Photo: Paul D. Groves, Lei Wang, Debbie Walter and Ziyi Jiang, University College London)
System Reliability. Navigation subsystems can produce incorrect information for a host of different reasons. Some examples include:
user equipment hardware and software faults;
transmitter hardware and software faults;
out-of-date databases used for pattern matching, including TRN, GNSS shadow matching, and map matching;
wheel slips in odometry;
the effects of passing vehicles and animals on environmental feature visibility, availability and strength of radio signals, and Doppler-based dead reckoning.
Some of these failure modes are easily detectable through the measurements failing basic range checks or being absent altogether. In other cases, faults may be detected by consistency checks within the subsystem. For example, wheel slip may be detected by comparing measurements from different wheels, while Doppler radar and sonar systems typically incorporate a redundant beam to enable the interruption of a beam by a vehicle or animal to be detected.
Subsystems can sometimes output incorrect information that is plausible. An ambiguity thus exists where it is uncertain whether or not a measurement may be trusted. An ambiguity also exists where a fault has been detected, but not its source. Thus, some of the information produced by the subsystem must be incorrect, but some of it may be correct.
Context Ambiguity. As discussed in Part 1 of this article (October issue), the optimum way of processing sensor information depends on the context. However, if context information is used, the navigation solution will then depend on the assumed context. For example, if an indoor environment is assumed, indoor radio positioning and map-matching algorithms that are only capable of producing an indoor position solution may be used. Similarly, if an urban environment is assumed, GNSS shadow matching and outdoor map matching may be selected, resulting in an outdoor position solution. Adoption of pedestrian and vehicle motion constraints can also lead to different navigation solutions.
Context determination is not a completely reliable process. Therefore, to minimize the impact of incorrect context assumptions on the navigation solution, the context should be treated as ambiguous whenever there is significant uncertainty.
Possible Solutions
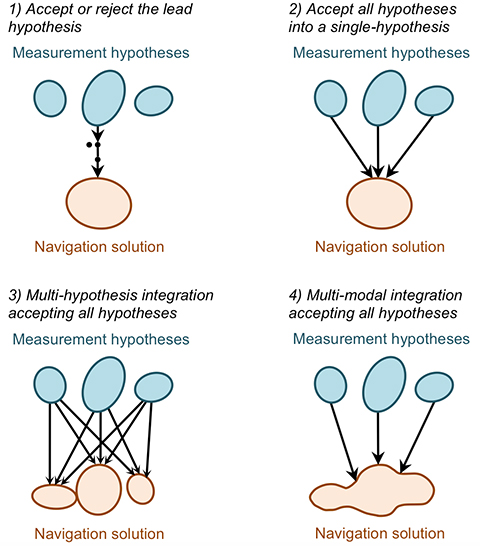
There is no obvious solution to the ambiguity problem. Instead, different approaches to integrating ambiguous information may be adopted depending on the relative priorities of solution availability, reliability, and processing load. The main approaches, illustrated in Figure 25, are discussed below. They all require the subsystems to present the different measurement hypotheses and their associated probabilities to the integration algorithm.
Figure 25. Methods of handling ambiguous measurements in a navigation integration algorithm. (Photo: Paul D. Groves, Lei Wang, Debbie Walter and Ziyi Jiang, University College London)
Accept or reject the lead hypothesis. The simplest way of handling ambiguous information is to maintain a single-hypothesis navigation solution and consider only the most-probable hypothesis from each subsystem. This is then accepted or rejected based on the following criteria:
Whether the probability of the highest scoring hypothesis above a certain threshold.
Whether the probability of the second-highest scoring hypothesis below a certain threshold.
Whether the highest-scoring measurement hypothesis is consistent with the current integrated navigation solution. (Determinable using measurement innovation filtering.)
Context may be incorporated into this approach by accepting the highest-scoring behavioral and environmental contexts where they meet the above criteria and computing a context-independent navigation solution otherwise.
This approach is processor-efficient, but high integrity and availability cannot be achieved simultaneously. Low acceptance thresholds provide high reliability by rejecting most erroneous measurements, but low solution availability as many good measurements are also rejected. Conversely, high acceptance thresholds provide availability at the expense of reliability.
Accept all hypotheses into a single-hypothesis solution. A probabilistic data association filter (PDAF) accepts multiple measurement or context hypotheses, weighting them according to their probabilities, but represents the navigation solution as the mean and covariance of a uni-modal distribution. The measurement update to the state estimation error covariance matrix accounts for the spread in the hypotheses such that the state uncertainties can sometimes increase following a measurement update.
This approach reconciles the demands of integrity and availability at the price of a moderate increase in processing load. However, the uni-modal navigation solution can sometimes be misleading. For example, if a pattern-matching system determines that the user is equally likely to be in one of two parallel streets, the overall position solution will be midway between those streets.
Multi-hypothesis integration accepting all hypotheses. Multi-hypothesis integration deals with multiple measurement and context hypotheses by spawning multiple integration filters, one for each hypothesis. Each filter is allocated a probability based not only on the probabilities of the measurements input to it, but also on the consistency of those measurements with the prior estimates of that filter. This consistency-based scoring is essential; otherwise the filter hypothesis that inputs the highest-scoring measurement hypotheses will always dominate, regardless of whether those measurements are consistent across subsystems and successive epochs.
A fundamental characteristic of multi-hypothesis filtering is that the number of hypotheses grows exponentially from epoch to epoch. This is clearly impractical, so the number of hypotheses is limited by merging the lowest scoring hypotheses into higher scoring neighbors.
The overall navigation solution is the weighted sum of the constituent filter hypotheses. Each individual filter hypothesis describes a uni-modal distribution. However, the combined navigation solution is multi-modal. Thus, the position probability can be higher in two streets than in the buildings between those streets. This is a clear advantage over the PDAF-based approach, but the processing load is higher.
Multi-modal integration accepting all hypotheses. A multi-modal filter is not constrained to model the states it estimates in terms of a mean and covariance. This enables it to process multiple measurement and/or context hypotheses and represent the result as a weighted sum of the probability distributions arising from the individual hypotheses. Suitable data-fusion algorithms include the Gaussian mixture filter and the particle filter. A key advantage over multi-hypothesis integration is that measurements may be treated as continuous probability distributions instead of as a set of discrete hypotheses. This enables pattern-matching measurements to be integrated more naturally and offers greater flexibility in handling signal propagation anomalies.
A Gaussian mixture filter models the probability distribution of the navigation solution as the weighted sum of a series of multi-variate Gaussian distributions. An example is the iterative Gaussian mixture approximation of the posterior (IGMAP) technique, which has been applied to terrain referenced navigation integrated with inertial navigation.
A particle filter models the probability distribution of the navigation solution using a series of semi-randomly distributed samples, known as particles. Between a thousand and a million particles are typically deployed, with a higher density of particles in higher probability regions of the distribution. Particle filters have been used with a number of different navigation technologies, including TRN, pedestrian map matching, Wi-Fi positioning, and GNSS shadow matching.
Multi-modal integration algorithms offer the greatest flexibility in reconciling the demands of solution availability and reliability, but also potentially impose the highest processing load.
Issues to Resolve
The key challenge in handling ambiguous measurements is determining realistic probabilities for each hypothesis. A probability must also be calculated for the null hypothesis, that is, the hypothesis that every candidate measurement output by the subsystem is wrong. The same applies to ambiguous context.
A feature identification algorithm must allocate a score to every database feature that it compares with the sensor measurements. In practice, only features within a predefined search area, based on the prior position solution and its uncertainty, will be considered. Features scoring above a certain threshold will be possible matches. Similarly, pattern- matching algorithms allocate a score to each candidate position in the search area according to how well the sensor measurements match the database at that point. For correct handling of ambiguous matches, these scores should be as close as possible to the probabilities of the feature match or candidate position being correct.
Feature identification and pattern-matching algorithms can also fail to consider the correct feature or candidate position for several reasons. The correct feature or position may be outside the database search area. It may be absent due to the database being out of date. The sensor may also observe or be affected by a temporary feature that is not in the database, such as a vehicle. The null hypothesis probability must account for all of these possibilities. In practice, it will be higher where there is no good match between the measurements and database.
Signal propagation anomalies affect the error distributions of ranging, angle, and Doppler shift measurements, and the positions and velocities derived from them. These error distributions depend on whether the signals are direct line-of-sight (LOS), non-line-of-sight (NLOS), or multipath- contaminated LOS. However, this is not typically known. Signal strength measurements, environmental context, signal elevation (for GNSS), distance from the transmitter (for terrestrial signals), consistency between different measurements, and 3D city models can all contribute useful information. However, their relationship with the measurement errors is complex, so a semi-empirical approach is needed.
Moving on to reliability, virtually any subsystem can produce false information. The overall probability will typically be very low and thus only significant for high-integrity applications. However, the failure probability will be higher in certain circumstances, in which case the relevant subsystem should report a higher null probability. For example, in odometry, the probability of a wheel slip depends on host vehicle dynamics. Similarly, a radio signal is more likely to be faulty if it is weaker than normal. Repeated measurements, changes to the update interval, and sudden changes in a sensor output are also indicative of potential faults.
Geometric ambiguity is easy to quantify as the candidate solutions have equal probability in the absence of additional information.
As proposed in Part 1, the context determination process should produce multiple context hypotheses, each with an associated probability. Therefore, it is important to ensure that all navigation subsystems that use this context information do so in a probabilistic manner. Thus, where different context hypotheses lead to different values of the measurements output by a navigation subsystem, each measurement hypotheses should be accompanied by a probability derived from the context probabilities.
A further issue to resolve is the relationship between discrete and continuous ambiguity. Ambiguities in feature identification, solution geometry, failures, and context categorization are discrete and are suited to integration filters that treat them as a set of discrete hypotheses. However, the position solution ambiguity in pattern-matching is continuous, that is, the probability density is a continuous function of position, albeit sampled at discrete grid points. This probability distribution may be input directly to a particle filter. However, if the integration algorithm is a uni-modal filter or a bank of uni-modal filters, the probability distribution must be converted to a set of discrete hypotheses. This can be done by fitting a set of Gaussian distributions to the probability distribution. For signal propagation anomalies, their presence or absence is discrete. However, the resulting measurement error distribution is continuous, so a similar approach is appropriate.
The same challenging environments that require multiple navigation subsystems to maximize solution availability, accuracy, and reliability can also induce those subsystems to produce ambiguous measurements. Consequently, the modular integration architecture proposed in Part 1 should be capable of handling ambiguous measurements.
This is discussed further in our IEEE/ION PLANS 2014 paper, “The Four Key Challenges of Advanced Multisensor Navigation and Positioning.”
Environmental Data
Position-fixing systems need information about the environment, sometimes known as a “world model,” to operate. Proximity, ranging, and angular positioning all use landmarks that must be identified. For GNSS and other long-range radio systems, identification codes are determined when the system is designed and incorporated in the user equipment. However, this is not practical for shorter range signals, whether opportunistic or designed for positioning, due to the vast numbers of transmitters available worldwide and the fact that many will be installed during the lifetime of the user equipment. The user equipment will also require information on the characteristics of a signal to enable it to use that signal for ranging. A mobile device equipped with a generic radio or transceiver may be required to download software to enable it to use a proprietary indoor positioning system. For environmental feature-matching techniques, the user equipment requires information to enable it to identify each landmark.
Navigation using landmarks also requires their positions and, for passive ranging, their timing offsets. Signals designed for positioning typically provide this information, but it can take a long time to download (30 seconds for GPS C/A code) and can be difficult to demodulate under poor reception conditions. The positions of opportunistic radio transmitters and environmental features must be determined by other means.
For positioning using the pattern-matching method, a measurement of radio signal strength or a characteristic of the environment, such as the terrain height or magnetic field, is compared with a database to determine position. Therefore, a database providing values of the measured parameter over a regular grid of positions is required. Map matching requires a map database to indicate where the user can and cannot go. GNSS shadow matching requires a 3D city model to predict signal visibility.
Finally, as discussed in Part 1 of this article, mapping is required to determine environmental context information from the position solution and to enable location-dependent context connectivity information (for example, the location of train stations) to be used for context determination.
Possible Solutions
We discuss in turn the environmental data collection and its distribution to the user equipment.
Data Collection. Positioning data may be collected either from a systematic survey or by the users. In either case, regular updates will be required. A systematic survey might be conducted by the subsystem supplier, a national mapping agency, or a private third party. The user will need to pay for the data in some way. It could be included in the equipment cost, via a subscription payment, by accepting advertising, or through general taxation (for some national mapping agency data). For mobile devices, such as smartphones, mapping data may be available for some applications, but not others.
Single-user data collection does not involve user charges, but only provides data for places the user has already visited. A simple approach requires a good position solution to collect mapping data. This can work for applications that normally use GNSS, but require backups for temporary outages. However, it does not work for areas where GNSS reception is poor. Simultaneous localization and mapping (SLAM) techniques can perform mapping without a continuous position solution. However, there are several constraints. First, a good position solution that is independent of the data being mapped is required at some point, usually the start. Second, a navigation system including dead-reckoning technology must be used. Third, locations must be visited repeatedly within a short period of time (to achieve “loop closure”). Finally, only features close to the user can be mapped.
Cooperative mapping by a group of users solves many of the problems of single-user mapping. It can provide individual users with data for places they have not visited before. Distant landmarks can also be mapped more easily by multiple users, particularly where it is necessary to determine a timing offset as well as the location. However, a method for comparing and combining data from multiple users is required.
Data Distribution. For data collected by a systematic survey, there are two main data distribution models: pre-loading and streaming. Pre-loading requires sufficient user equipment data storage to cover the area of operation. New data may have to be loaded prior to a change in operating area, and updates will be required. However, a continuous communications link is not needed.
Streaming requires much less data to be stored by the user and provides up-to-date information, but only where a communications link is available. Although buffering can bridge short outages, navigation data is simply not available for areas without sufficient communications coverage. Continuous streaming can also be expensive. One solution is a cooperative approach using peer-to-peer communications for much of the data distribution. A pair of users traveling in opposite directions along the same route will each have data that is useful to the other. A further possibility is to incorporate local information servers in Wi-Fi access points for exchanging information relevant to the immediate locality. This might be best suited to indoor navigation, where there is an incentive for the building operator to provide the service.
For data collected by a single user, no data distribution is required other than a back-up. For cooperative data collection by multiple users, a method of data exchange is needed. This can be via a central server, communicating either in real time or whenever the user returns to base. It can also be through peer-to-peer communications or through local information servers, where there is an incentive to provide them.
Issues to Resolve
Standardization is a major part of the data management challenge. A multisensor navigation system will typically incorporate multiple subsystems with data requirements. This might include road or building mapping, radio signal information, terrain height, magnetic anomalies, visual landmarks, and building signal-masking information for GNSS shadow matching. There will be a different standard for each type of data. Furthermore, different subsystem suppliers will often use different standards for the same type of data. This is sometimes done for commercial and/or security reasons, so the data may be encrypted. There may also be technical reasons for different data standards. For example, in image-based navigation, different feature recognition algorithms require different descriptive data.
Ideally, all navigation data in a multisensor system should be distributed by the same method. This requires agreement of storage and communication protocols that can handle many different data formats, including encrypted proprietary data and future data formats. Open standards for each type of data should also be agreed, noting that consumer cooperative positioning using peer-to-peer communications and/or local information servers is probably only practical with open data formats. Ideally, the standards should be scalable to enable precisions, spatial resolutions, and search areas to be adapted to the available data storage and communications capacity.
Peer-to-peer data exchange requires a suitable communications link. Bluetooth is the established standard for consumer applications. Classic Bluetooth provides sufficient capacity, but it takes longer to establish a connection than passing pedestrians or vehicles remain within range. Bluetooth low energy can establish a connection quickly, but the data capacity is limited to 100 kbit/s. This is sufficient for some kinds of navigation data, but not others. Professional and military users have more flexibility to select suitable datalinks.
Finally, establishing local information servers requires both standardization and an incentive for the hosts. Demand would be greater if there were applications beyond navigation and positioning. Possibilities include product information in shops and exhibit information in museums, both of which might be provided more efficiently from a local server than the Internet. For home users to provide local information servers, they would also have to benefit from them, a potential “chicken-and-egg” problem. For military applications, local information servers are a potential security risk and a target for attack.
Conclusions and Recommendations
Achieving accurate and reliable navigation in challenging environments without additional infrastructure requires complex multisensor integrated navigation systems. However, implementing them presents four key challenges: complexity, context, ambiguity, and environmental data handling. Each of these problems has been explored and solutions proposed.
Conclusions. In Part 1 of this article, a modular integration architecture was proposed to enable multiple subsystems from different organizations to be integrated without the need for whole system expertise or sharing of intellectual property. Furthermore, context-adaptive navigation was proposed to enable a navigation system to respond to changes in the environment and host vehicle (or user) behavior, deploying the most appropriate algorithms. A new probabilistic approach to context determination was proposed and results presented from a number of context detection experiments.
Here, it has been shown that navigation solution ambiguity can arise from feature identification, pattern matching, propagation anomalies, solution geometry, system reliability issues, and context ambiguity. A number of methods for handling ambiguous measurements in a multisensor navigation system have been reviewed.
Finally, methods of collecting and distributing data such as locations of radio transmitters and other landmarks, information for identifying signals and landmarks, road or building mapping, terrain height, magnetic anomalies, and building signal-masking information (for GNSS shadow matching) have been discussed.
Implementing the ideas proposed in this two-part article requires both standardization and further research. Standardization is needed to enable the communication between modules produced by different suppliers of information such as the integrated navigation solution, sensor measurements and characteristics, calibration parameters, performance requirements, context information, mapping, and signal and feature characteristics.
Further research is needed to support this standardization process, including the identification of a set of fundamental measurement types and their error sources, and the establishment of the best set of context categories for integrated navigation.
Extensive research into context detection and determination is needed, including the measurements to use, the statistical parameters to derive from those measurements, and a set of context association and connectivity rules.
An assessment of the different methods for handling ambiguous measurements is needed, comparing accuracy, reliability, solution availability, and processing load. This will enable the community to determine which methods are suited to different applications.
Finally, there is a need for a practical demonstration of the key concepts proposed in this paper, including modular integration, context adaptivity, ambiguous measurement handling, and collection and distribution of environmental data.
Paul D. Groves is a lecturer at University College London (UCL), where he leads a program of research into robust positioning and navigation. He is an author of more than 60 technical publications, including the book Principles of GNSS, Inertial and Multi-Sensor Integrated Navigation Systems, now in its second edition. He is a Fellow of the Royal Institute of Navigation and holds a doctorate in physics from the University of Oxford.
Lei Wang is a Ph.D. student at UCL. He received a bachelor’s degree in geodesy and geomatics from Wuhan University. He is interested in GNSS-based positioning techniques for urban canyons.
Debbie Walter is a Ph.D. student at UCL. She is interested in navigation techniques not reliant on GNSS, multi-sensor integration, and robust navigation. She has an MSci from Imperial College London in physics and has worked as an IT software testing manager.
Ziyi Jiang was a postdoctoral research associate at UCL until 2014, working on urban GNSS and other projects. He holds a bachelor’s degree in engineering from Harbin University and a Ph.D. in rail positioning from UCL. He now works in finance.
All authors are members of UCL Engineering’s Space Geodesy and Navigation Laboratory (SGNL).
Pravda is reporting that the United States refused to negotiate with Russia to deploy GLONASS ground on its territory, citing an interview with Russian Deputy Prime Minister Dmitry Rogozin.
Rogozin stressed that no negotiations were taking place. “We have made a statement in the spring. I offered to initiate talks with the United States to deploy GLONASS infrastructure in their territory, as long as negotiations go, hang the existence of infrastructure GPS stations on the territory of the Russian Federation,” Rogozin said.
Russian specialists are excluding use of the GPS stations on Russian territory for military purposes, he said, adding that he would not reveal how this was accomplished.
“I will not expand on how we did it for obvious reasons, but we did it,” said Rogozin. “We do not want to cut off the nose to spite our face to deprive our users of the ability to work with GLONASS and GPS. Why should we create fewer opportunities for our own people? But we have completely destroyed any prospect, even an indirect one, for the use of the American navigation system for our high-precision guidance weapons,” said the official.
At the same time, it was reported that Russia and China would discuss possible joint projects in the field of space exploration. According to Rogozin, the two countries cooperate in the field of space, working on “possible joint projects in the field of space exploration.” The official said that China and Russia were having a “pretty tumultuous relationship,” and “we would like to say a big thank you to Western countries for their active development.”
The next GLONASS launch — the GLONASS-K1 satellite from Plesetsk scheduled for November 20 — is being insured for 2.17 billion rubles ($50 million US). The insurance is costing Russia 242 million roubles ($5.6 million US).
Russia has faced numerous technical difficulties in its launches. On May 15, a Proton-M satellite crashed. In 2013, Russia lost three GLONASS satellites when their launch aboard a Proton-M rocket went awry, sending the satellites crashing into the Baikonur Cosmodrome in Kazakhstan instead of aloft into space. In 2010, three other GLONASS satellites ended up in the Pacific Ocean aboard a Proton-M rocket.
The insurance covers the launch and flight tests of the carrier rocket Soyuz-2.1b, with the satellite GLONASS-K. Flight tests, according to the tender documentation, will last for three months.
NovAtel, Inc.’s Calgary facility has been awarded the prestigious 2014 Manufacturing Excellence Award from the Association for Manufacturing Excellence (AME). The award acknowledges North American facilities that have demonstrated excellence in manufacturing and business, and recognizes NovAtel’s dedication to continuous improvement, best practices, creativity and innovation.
A representative of the AME presented the award to NovAtel at the company’s Calgary headquarters on October 23. NovAtel will also be recognized at the 2014 AME International Excellence Inside Conference, November 10-14 in Jacksonville, Florida.
NovAtel Inc. designs and manufactures high-precision, OEM, global positioning products and employs more than 400 people.
During their evaluation, the AME assessment team highlighted NovAtel’s work culture, observing that improvement systems were evident throughout the organization. They also praised the company’s commitment to creating a continuous improvement culture and systems. The assessment team remarked, “NovAtel leadership and plant employees can be proud of the site’s manufacturing excellence achievements to date.”
“We are very proud to receive an award which recognizes NovAtel as a leader in Enterprise Excellence in North America,” said Michael Ritter, president and CEO of NovAtel. “Fostering a culture of innovation, excellence and continuous improvement, in all aspects of our business, is something we strive for every day.”
Ritter added, “Our lean manufacturing initiatives are just one of the many ways we strive to add value for our customers. Making data-driven decisions in combination with fostering employee teamwork, mutual respect and accountability, throughout all levels of our organization, is essential to our long-term success in a global marketplace.”
“This award confirms that we are indeed on the right path 11 years into our ‘Lean’ journey,” said Mike McAloney, VP Operations for NovAtel. “We view ‘Lean and Continuous Improvement’ initiatives as the foundations of the operational excellence that lets us achieve our corporate mission: to generate customer success by providing precise positioning and augmentation technologies that are easy to integrate and provide exceptional return on investment.”
A high-resolution aerial photo captured by the senseFly swinglet CAM over an advancing flow breakout heading towards Pāhoa, Hawai‘i, on October 22.
Using an unmanned aerial vehicle equipped with a camera, a team from the University of Hawaii is mapping the active lava flow front of the Kilauea Volcano on Hawaii Island.
On October 22, a flight team from the UH Hilo Spatial Data Analysis and Visualization (SDAV) Laboratory used a senseFlyswinglet CAM professional GIS drone to map the active flow front. The high-resolution still images captured by an RGB camera payload were then merged into a full orthomosaic for use by Civil Defense emergency planners. The flight was a collaborative partnership with Hawaii County Civil Defense and the U.S. Geological Survey Hawaiian Volcano Observatory.
As of October 29, the lava flow is headed toward the town of Pāhoa in the district of Puna, threatening to cut off the main highway and other access roads, isolating an area of about 10,000 residents from the rest of the island. The flow is advancing at 10 yards an hour and is 280 yards from Pahoa Village Road.
The researchers plan to fly again and continue supporting relief operations with quick aerial assessments when needed. Sensefly representatives are closely monitoring and supporting the team’s mapping relief effort and are ready with additional equipment as needed.
The UH Hilo flight team includes Ryan Perroy, assistant professor of geography and environmental science; Nicolas Turner, SDAV cyber computer programming analyst; and Arthur Cunningham, consultant for aeronautical science.
“The lava flow has already impacted the lives of many residents in Puna,” Perroy said. “Our UAV support can provide quick and accurate information to emergency responders.”
The team closely monitored the flight performance of the swinglet CAM UAV as it traveled over the lava and noted minor turbulence as it crossed the thermally dynamic environment. A county helicopter provided support with an air observer on board from the UAV team during flight operations.
The Unmanned Aircraft Systems Integration Office of the Federal Aviation Administration worked closely with the Hilo research team on approval of their Certificate of Authorization. The flights are in direct support of disaster-relief operations in the area, and the FAA and flight team worked together to make sure all safety concerns were met.
The lava flow advances directly behind researchers (from left) Matt Patrick and Frank Trusdell, geologists at the U.S. Geological Survey Hawaiian Volcano Observatory; Asia Addlesberger, GIS specialist with the County of Hawai‘i; Tim Orr, head geologist at HVO; and UH Hilo researchers Ryan Perroy, assistant professor of geography and environmental science; Nicolas Turner, cyber computer programming analyst; and Jonathan Price, associate professor of geography.
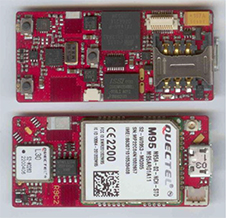
KCS BV has launched a new tiny tracker, the TM-202LAR. It’s the newest addition to the KCS family of TraceME products. The KCS GPRS/GPS range of modules enable users to remotely track and trace people, animals and a variety of objects, such as vehicles, containers, motorcycles, lawn mowers, or other valuable assets.
KCS TraceME TM-202LAR is targeted for personal use, or any other application that needs a small size with long battery life while still featuring the options and server connection that full-size units have.
The TraceME TM-202LAR is KCS’s smallest full featured GPS tracker at 46 x 21 x 6.5 mm, weighing 7 grams. Other features and options include:
GPS, RF and GSM antennas
advanced power saving, down to 2.5µA
10 years of operation from one Lithium C-Cell
RF connectivity, up to 2 km
location-based positioning (LBS/Wi-fi/GPS)
onboard sensors for compass, temperature, acceleration
Matters sit not well with Galileo, the European GNSS. Only one of six currently orbiting satellites can be said to be truly and fully operational. With these troubles augmented by persistent uncertainties regarding the fitness of Soyuz rockets, despite a recent inquiry panel that identified a root cause of the August launch failure, the European Commission has nixed an upcoming December launch. The European Space Agency will have to wait until February 2015 to see if the skies clear by then for the next opportunity to place two new satellites into orbit.
Hard-charging veteran investigative reporter Richard Langley has learned from his eastern listening post in New Brunswick that “E11 and E12 [launched three years ago] exhibit ongoing problems with the onboard clocks. E20 [launched two years ago] has experienced power-supply problems and, following a brief outage, is now broadcasting on E1 only and with a reduced power. The latest two satellites [rose August 22 of this year] are in irregular orbits and will likely not form part of the final constellation. This leaves E19 [born October 12, 2012] as the only fully operational satellite operating within specifications.
“So, strictly speaking, only one of the currently orbiting satellites is fully operational. However, for most (E1/L1-only, single-point) users, four of the six satellites are currently quite useable. Moreover, preliminary studies suggest that, once on line, the latest two satellites will be perfectly usable, despite the irregular orbits. And, as we have heard, there will be attempts to make the orbits somewhat more circular.”
Langley cites “knowledgeable researchers” as his sources.
The initial quartet of in-orbit validation (IOV) satellites — E11, E12, E19, and E20 — constructed by Astrium GmbH and Thales Alenia Space have experienced a range of difficulties outlined above. The decision to cancel the next scheduled launch in December of the newest duo of full operational capability (FOC) satellites, manufactured by a consortium led by OHB AG, comes on the heels of a completed inquiry that blamed a “design ambiguity” of the Soyuz rocket’s Fregat stage for the too-low orbits of Satellites 5 and 6, but left several lingering doubts about other Soyuz issues that were uncovered and must be corrected.
The situation is complicated by further unresolved issues aboard the two FOC satellites themselves. They each failed to deploy one of their two solar arrays on the first try. After several days of effort and re-orientation of the satellites by ground controllers, the arrays were successfully unfolded, but the cause of the initial failure remains unknown. “There is no conclusion on a root cause,” stated one official. “Was it a consequence of the bad orbit, or is there an issue with the solar array deployment mechanism? We cannot yet say for sure.”
As for their incorrect orbit, getting them into their originally planned paths around the Earth is impossible. They simply do not have enough fuel onboard. ESA does, however, plan to raise the perigees of the satellites to get them out of the Van Allen radiation belt, which could severely damage the satellites. The agency also envisions reducing the maximum Doppler frequency shift from 9.6 kHz to at least 6.8 kHz to allow receivers to easily acquire and track the satellites but leave enough hydrazine for future station-keeping. Spokespersons hold out hope that the satellites may yet be usable somehow, someday, after some adjustment measures are taken: a rephasing, a special almanac, perhaps other adjustments.
Overall, a disheartening picture, with some pessimists concluding that “2013 and 2014 have been lost.” The recent slip of full operational capability declaration from 2018 to 2020 may have to be revised yet again. However, lessons learned, etcetera. Galileo has had its ups and down. Advocates may draw comfort from the wisdom imparted by 19th-century German philosopher Friedrich Wilhelm Nietzsche, “Was mich nicht umbringt, macht mich stärker.” That which does not destroy me, makes me stronger.
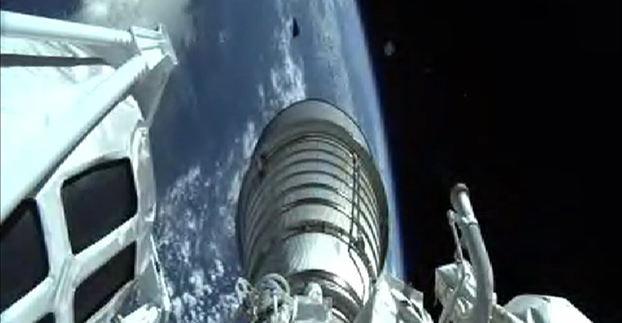
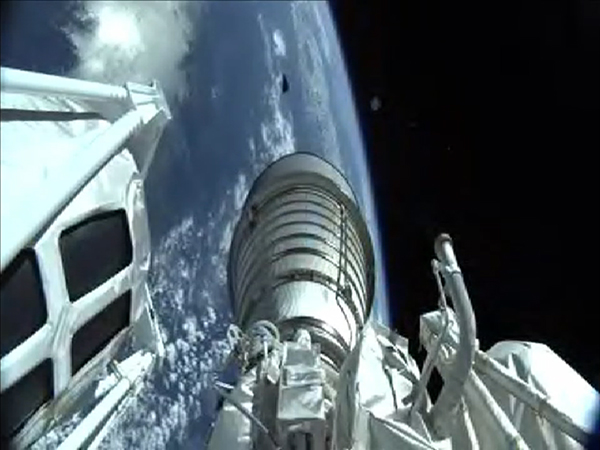
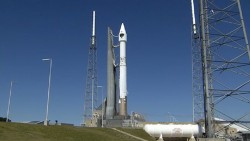
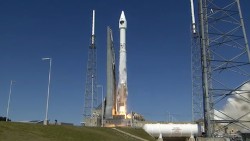
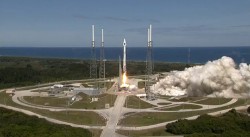
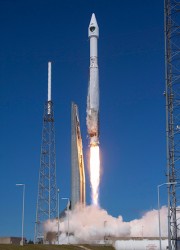
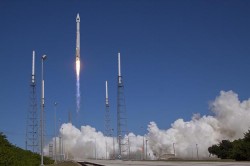
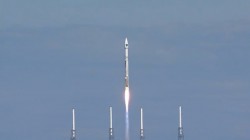
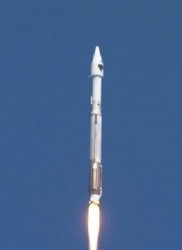
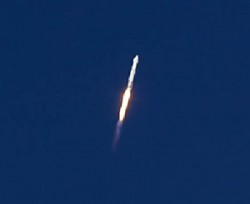
The U.S. Air Force launched the eighth GPS IIF satellite from Cape Canaveral Air Force Station in Florida today at 1:21 Eastern Time, as scheduled. An Atlas V 401 carried the GPS satellite aloft.
GPS IIF-8 is one of the next-generation GPS satellites, incorporating various improvements to provide greater accuracy, increased signals, and enhanced performance for users. With this eighth satellite now launched, only four more Block IIF satellites remain to be placed into orbit. Three are in storage awaiting launch, and one is in production.
“I’m delighted with the outcome of today’s launch. Thanks to the men and women of SMC, the 45th, 50th and 310th Space Wings; Boeing; ULA; the Aerospace Corporation; and the GPS IIF and Atlas V launch teams ceaseless efforts, commitment, dedication, and focus on mission success, we successfully launched the fourth GPS IIF space vehicle this year,” said Col. Bill Cooley, director of Space and Missile Systems Center’s Global Positioning Systems Directorate. “Today’s launch demonstrates our commitment to users around the globe that GPS is the gold standard for position navigation and timing and will continue to deliver capabilities for the foreseeable future,” he said.
After launch, the mission entered a coast phase that lasts about three hours. Following a short second burn of the RL10 engine, the Centaur second stage will deliver the Boeing-built GPS IIF-8 satellite to semi-synchronous orbit over the southern ocean north of Antarctica. Separation takes place about 3 hours, 24 minutes after liftoff.
GPS IIF-8 is the United Launch Alliance‘s fourth GPS launch this year. The mission marks ULA’s 89th mission launched since the company was founded in 2006.
GPS IIF-8 (SVN-69/PRN-03) will replace SVN-51 in the E plane slot 1. SVN-51 will be re-phased from E1 to an auxiliary node at E7 somewhere around SVN-54 currently on station at E4, according to the Air Force Second Space Operations Squadron (2 SOPS). SVN-38/PRN-08 will be taken out of the operational constellation prior to SVN-69 payload initialization and sent to Launch, Anomaly Resolution and Disposal Operations (LADO). PRN-08 will be assigned initially to SVN-49 and set to test.
SVN-38 was launched on November 5, 1997, successfully serving nearly 17 years, 9.5 years beyond its designed service life, due to the diligent efforts of the men and women of the U.S. Air Force. SVN-51 will remain in an auxiliary node once it completes its re-phase journey. The SVN-51 re-phase will take about six months after the initial burn occurs.
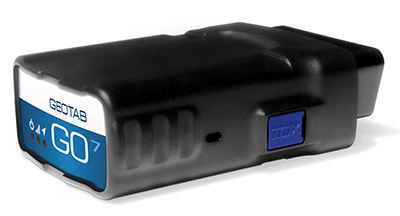
Geotab, a telematics engineering company, has launched its new GO7 telematics device. The GO7 allows fleet management applications to receive vehicle data communications from the engine, drive train, instrument cluster and other subsystems.
The Geotab GO7 is the newest device in Geotab’s line of telematics solutions and has added a number of new features such as programmable CANBUS, OBD, J1708 connection pins, enhanced auto-protocol detection and higher sensitivity accelerometer — making the solution future-proof and cost effective for any fleet to install and maintain, the company said.
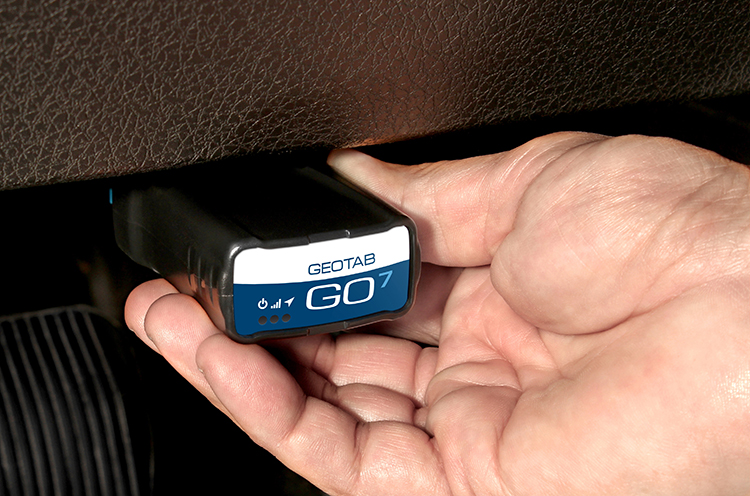
The GO7 is an plug-and-play device with internal antennas that eliminates installation and out-of service vehicle time, which significantly lowers installation costs and improves fleet productivity, according to Geotab. The latest edition of Geotab’s GO devices caters to more than one vehicle protocol at a time, allowing the device to collect data simultaneously for all possible datasets, such as RPM, VIN, fuel level, seat-belt detection and odometer. The secondary protocol support provides detailed engine data for a variety of vehicles, including Ford, GM, Chrysler, Volvo and Mazda. The technology is scalable, from light duty, medium duty, to heavy commercial trucks in addition to supporting all major vehicle manufacturers globally, Geotab said.
Photo: Geotab
“Our goal is to provide the most advanced and efficient telematics solution in the industry,” said Neil Cawse, CEO, Geotab. “Together with our MyGeotab software, the all-new GO7 device allows us to provide our customers with the most sophisticated end-to-end fleet management solution on an industry leading platform — providing great productivity enhancements, safety features and cost-savings to our fleet customers.”
Top features of the GO7 include:
Easy plug-and-play installation
External device expandability via IOX Technology
Intelligent in-vehicle driver coaching
Small form factor device
Breakthrough accident detection and notification
Accurate engine diagnostics, DTC, and proprietary engine data
Real-time vehicle data
Fast GPS acquisition time using Almanac OTA support
LandWorks, Inc., a developer land management solutions, has added individual parcel polygons to its cloud-based offering of GIS-ready map products. Clients can now search, purchase and download digital parcel data sets with related attributes directly from the LandWorks website — in orders as small as a single parcel — at a cost of $2 per parcel.
LandWorks developed the online parcel purchase application for industries and professions that need up-to-date surface land ownership information in their GIS. Some of the sectors already taking advantage of LandWorks’ online offerings include utilities, oil and gas, pipelines, real estate, banking, departments of transportation, renewable energy and mining.
“The main benefits of buying parcel data from the LandWorks website are affordability and instant access,” said LandWorks President Jerry Bramwell. “Until now, digital map users had to order parcel polygon products by the county and then wait two to three weeks for delivery.”
On the LandWorks website, there is no minimum or maximum purchase limit. The customer simply logs onto the parcel data page and searches for the desired parcel or parcels. The user may graphically select the desired parcels by searching and clicking on a map display or by uploading a spreadsheet containing the county tax parcel ID numbers.
“The online database accessed through the LandWorks website contains parcel data for most of the United States,” said Bramwell. “This data comes from county assessor files or is manually digitized from paper plats and is updated quarterly.”
The LandWorks site keeps track of desired parcels during the search process. When the user is ready, the website reports the number of parcels that have been selected and their total cost calculated at $2 per parcel. The user can add or delete parcels as desired. The user then decides to purchase the parcel polygons in either NAD 27 or NAD 83 map datum. Prior to purchase, the site gives the user the option of receiving the digital data sets in Esri shapefile or file geodatabase format. Each parcel polygon is delivered with key attributes — parcel number, parcel address, owner name/address, and official legal description.
The digital parcel polygons come ready for download directly into Esri ArcGIS software as well as other popular mapping systems such as IHS Petra, IHS Kingdom and LMKR GeoGraphix.
Esri has released the first commercial version of ArcGIS Runtime SDK for the Microsoft .NET Framework. This software development kit (SDK) joins Esri’s line of Runtime products, including iOS, Mac OS X, Android, Java, Qt, and Windows Presentation Foundation (WPF). ArcGIS Runtime SDK for .NET has been built as a new, shared API across native app platforms promoted by Microsoft.
Using the new ArcGIS Runtime SDK for .NET, developers can integrate ArcGIS into Windows apps for desktop and mobile platforms. The SDK includes a wide range of online or offline mapping functionality including editing, routing, geocoding, spatial analysis, and data visualization.
Windows Store apps are new types of apps that run on Windows 8.1 devices and emphasize streamlined content with a consistent, touch-friendly user experience. Windows Phone 8.1 and Windows 8.1 support a shared development experience to build universal apps on a common Windows Runtime. ArcGIS Runtime SDK for .NET lets developers use XAML and C# to embed ArcGIS capabilities into location-aware, universal apps for the latest Windows devices.
To get an app to market quickly, developers can use the same development and deployment model across all the Esri ArcGIS Runtime SDKs with unified licensing. Download any of the Runtime SDKs at no cost and get access to Basic and Standard functionality for development and testing purposes. To deploy an app for offline use, applications must be licensed at the Standard level.
WPF developers also can migrate new and existing applications created with ArcGIS Runtime SDK for WPF to the new ArcGIS Runtime SDK for .NET.
For more information on ArcGIS Runtime SDK for .NET or to get started, visit developers.arcgis.com.