Blog

  • USGS Releases Earthquake Hazard Map

    2014 USGS National Seismic Hazard Map, displaying intensity of potential ground shaking from an earthquake in 50 years (which is the typical lifetime of a building).
    2014 USGS National Seismic Hazard Map, displaying intensity of potential ground shaking from an earthquake in 50 years (which is the typical lifetime of a building).

    To help make the best decisions to protect communities from earthquakes, new USGS maps display how intense ground shaking could be across the nation.

    The USGS recently updated its U.S. National Seismic Hazard Maps, which reflect the best and most current understanding of where future earthquakes will occur, how often they will occur, and how hard the ground will likely shake as a result.

    42 States at Risk; 16 States at High Risk

    While all states have some potential for earthquakes, 42 of the 50 states have a reasonable chance of experiencing damaging ground shaking from an earthquake in 50 years (the typical lifetime of a building). Scientists also conclude that 16 states have a relatively high likelihood of experiencing damaging ground shaking. These states have historically experienced earthquakes with a magnitude 6 or greater.

    The hazard is especially high along the west coast, intermountain west, and in several active regions of the central and eastern U.S., such as near New Madrid, Missouri, and near Charleston, South Carolina. The 16 states at highest risk are Alaska, Arkansas, California, Hawaii, Idaho, Illinois, Kentucky, Missouri, Montana, Nevada, Oregon, South Carolina, Tennessee, Utah, Washington, and Wyoming.

    While these overarching conclusions of the national-level hazard are similar to those of the previous maps released in 2008, details and estimates differ for many cities and states. Several areas have been identified as being capable of having the potential for larger and more powerful earthquakes than previously thought due to more data and updated earthquake models. The most prominent changes are discussed below.

    Students conduct the “drop, cover, hold on” safety procedure during an earthquake preparedness drill. Photo Credit: Jessica Robertson, USGS
    Students conduct the “drop, cover, hold on” safety procedure during an earthquake preparedness drill. Photo Credit: Jessica Robertson, USGS

    Informed Decisions Based on the Maps

    With an understanding of potential ground shaking levels, various risk analyses can be calculated by considering factors like population levels, building exposure, and building construction practices. This is used for establishing building codes, and in the analysis of seismic risk for key structures. This can also help in determining insurance rates, emergency preparedness plans, and private property decisions such as re-evaluating one’s home and making it more resilient.

    These maps are part of USGS contributions to the National Earthquake Hazards Reduction Program (NEHRP), which is a congressionally-established partnership of four federal agencies with the purpose of reducing risks to life and property in the U.S. that result from earthquakes. The contributing agencies are the USGS, Federal Emergency Management Agency (FEMA), National Institute of Standards and Technology, and National Science Foundation (NSF). As an example of the collaboration, the hazards identified in the USGS maps underlie FEMA-sponsored seismic design provisions that are incorporated into building codes adopted by states and localities. The maps also reflect investments in research by academic and other scientists supported by grants from the USGS and the NSF.

    “The standards for seismic safety in building codes are directly based upon USGS assessments of potential ground shaking from earthquakes, and have been for years,” said Jim Harris, a member and former chair of the Provisions Update Committee of the Building Seismic Safety Council.

    “The committees preparing those standards welcome this updated USGS information as a basis for making decisions and continuing to ensure the most stable and secure construction.”

    Key Updates

    East Coast

    The eastern U.S. has the potential for larger and more damaging earthquakes than considered in previous maps and assessments. As one example, scientists learned a lot following the magnitude 5.8 earthquake that struck Virginia in 2011. It was among the largest earthquakes to occur along the east coast in the last century, and helped determine that even larger events are possible. Estimates of earthquake hazards near Charleston, SC, have also gone up due to the assessment of earthquakes in the state.

    Damage to the Washington National Cathedral in DC from the earthquake in Virginia on August 23, 2011. Photo Credit: William Leith, USGS
    Damage to the Washington National Cathedral in DC from the earthquake in Virginia on August 23, 2011. Photo Credit: William Leith, USGS

    In New York City, the maps indicate a slightly lower hazard for tall buildings than previously thought (but still a hazard nonetheless). Scientists estimated a lower likelihood for slow shaking from an earthquake near the city. Slow shaking is likely to cause more damage to tall structures in contrast, compared to fast shaking which is more likely to impact shorter structures.

    Central U.S.

    The New Madrid Seismic Zone has been identified to have a larger range of potential earthquake magnitudes and locations than previously identified. This is a result of a range of new research, part of which was recently compiled by the Nuclear Regulatory Commission.

    West Coast

    In California, earthquake hazard extends over a wider area than previously thought. Most notably, faults were recently discovered, raising earthquake hazard estimates for San Jose, Vallejo and San Diego. On the other hand, new insights on faults and rupture processes reduced earthquake hazard estimates for Irvine, Santa Barbara and Oakland. Hazard increased in some parts of the San Francisco Bay Area and Los Angeles region and decreased in other parts. These updates were from the new Uniform California Earthquake Rupture Forecast Model, which incorporates many more potential fault ruptures than did previous assessments. Recent earthquakes in Alaska, Mexico and New Zealand taught scientists more about complex ruptures and how faults can link together. This insight was applied to California for which approximately 250,000 potential complex ruptures were modeled.

    New research on the Cascadia Subduction Zone resulted in increased estimates of earthquake magnitude up to magnitude 9.3. Deep-sea cores were collected that show evidence within the sea-floor sediments of large earthquake-generated mudflows. Earthquake shaking estimates were also increased following abundant data gathered from the magnitude 9.0 earthquake in Tohoku, Japan in 2011 and the magnitude 8.2 earthquake offshore of Chile in 2014, as those events ruptured along subduction zones similar to the Pacific Northwest zone. 

    In Washington, scientists incorporated new knowledge of the Tacoma Fault into the maps and identified changes to the geometry of the Whidbey Island fault in the northern Puget Sound. Earthquake hazard also increased for Las Vegas because of new science. In Utah, scientists dug trenches to study prehistoric earthquakes along the Wasatch Fault. While the overall seismic hazard didn’t change significantly, detailed changes were made to the fault models in this region and robust data were acquired to hone the assessments. This is valuable since approximately 75% of Utah’s population, including the residents of Salt Lake City, lives near this fault.

    The magnitude 7.9 earthquake in Wenchuan, China in 2008 provided many new records of shaking that are very similar to anticipated future earthquakes in the western U.S., as the fault structures are similar. Previously, scientists did not have nearly as many shaking records from earthquakes of this size.

    Induced Earthquakes — Research Underway


    Some states have experienced increased seismicity in the past few years that may be associated with human activities such as the disposal of wastewater in deep wells.

    One specific focus for the future is including an additional layer to these earthquake hazard maps to account for recent potentially triggered earthquakes that occur near some wastewater disposal wells. Injection-induced earthquakes are challenging to incorporate into hazard models because they may not behave like natural earthquakes and their rates change based on man-made activities.

  • Business Aviation Agrees to Promote EGNOS Use at European Airports

    The European Business Aviation Association (EBAA) and the European GNSS Agency (GSA) have signed a Memorandum of Understanding to promote the wide use of EGNOS — precision-based navigation (PBN) — at regional airports in Europe, following discussions at the European Space Solutions Conference in Prague in June.

    Maintaining all-weather access at secondary and tertiary airports is becoming more and more important for the air transport community with ever-increasing difficulties when it comes to access at major hubs, according to the EBAA. Business aviation is now in a position to optimize access at more of these regional airports which are often characterized by limited investment or technical innovation on the ground. By improving penetration of EGNOS, the entire air transport value chain will be enhanced, the EBAA said.

    “The aviation community stands to benefit greatly from EGNOS because it means safe access to small- and medium-sized airports without the need for expensive ground equipment,” said Fabio Gamba, EBAA CEO. “Approach procedures have been published for around 100 airports, which is still a far cry from where we should be. A move towards this technology is well overdue, and this is evident if you compare Europe to the U.S. We are proud to have signed this MoU with GSA and together we are committed to having many more procedures published in the near future.”

    “The business aviation segment is a pioneer in the use of EGNOS and most new business aircraft are already equipped. This means that operators can start using published LPV procedures immediately, without making any upgrades, just by obtaining the operational approval from the authority where the aircraft is registered,” said Carlo des Dorides, GSA executive director.

    “EGNOS increases accessibility and enables safer approaches to underserved airports also in poor weather conditions,” said Gian Gherardo Calini, GSA head of market development. “We are committed to working with business operators to enable opening new routes that best serve their specific needs.”

  • Esri Launches Global Disaster Resilience App Challenge

    Esri and the United Nations are working hard to help communities build resilience to impending twenty-first century disasters. Esri’s Global Disaster Resilience App Challenge is born from the United Nations Office of Disaster Risk Reduction (UNISDR) campaign “Making Cities Resilient: My City is Getting Ready,” and supports the UN secretary-general’s efforts to accelerate actions that build resilience to climate change. Participating developers will create map tools that help communities see, understand, and prepare for a variety of disasters.

    “This partnership with Esri can help bridge the gap between aspiration and implementation,” said Margareta Wahlström, the head of UNISDR. “It puts the latest science and technology at the disposal of those who have joined the Making Cities Resilient campaign.”

    UNISDR launched the Making Cities Resilient campaign to improve land use and urban planning for more than 1,800 participating cities worldwide. These communities have committed to observe UNISDR resiliency recommendations. Esri is collaborating with UNISDR on the initiative and giving these cities access to its developer technology. Esri invites the developer community to lend a hand and use the ArcGIS platform developer tools.

    Esri launched the Global Disaster Resilience App Challenge to help local, regional, and national governments find the tools they need to reach their goals to become resilient. Developers will build apps relevant to UNISDR’s 10 Essentials for Making Cities Resilient. Esri will present a $10,000 award each for the best professional/scientific app and the best consumer/public-facing app. Winners will be announced in mid-September, one week before the Climate Summit to be convened by UN secretary-general Ban Ki-moon on September 23.


  • u-blox Launches Online Shop for GPS/GNSS Modules, Tools

    u-blox Launches Online Shop for GPS/GNSS Modules, Tools

    Swiss u-blox, a provider of cellular, short-range radio and GPS/GNSS semiconductor components, has launched a new online shop in the U.S. and Canada, with expanded features and reduced prices.

    u-blox’ Online Shop is a fast and secure way to obtain module samples and pre-production quantities of the company’s comprehensive line of cellular modem and GPS/GNSS positioning modules, u-blox said. Support tools such as evaluation kits and wireless module adapters can also be ordered.

    All module products and support tools are typically shipped within 24 hours directly from the u-blox U.S.-based warehouse in Reston, Virginia, near the Washington Dulles International Airport. Technical support for all products are provided from one of u-blox America’s three technical support centers in Virginia, Minnesota, and California.

    For convenience and improved production planning, customers can also request a specific delivery date at no extra cost. Customers with an established line of credit with u-blox America can order against invoice. Credit card and pre-payment options are available.

  • Topcon Adds Cellular Connectivity to HiPer SR for GIS

    HiPerSR_GIS_Topcon-WTopcon Positioning Group has added a cellular modem option for the HiPer SR for GIS receiver.

    “The integrated modem provides greater functionality for the HiPer SR,” said Jason Hooten, Topcon GIS national sales manager. The unit can now be used as a cellular base station through the MAGNET® Relay option. In addition, the cellular feature allows the receiver to provide a connection to existing data collectors that do not contain internal cellular modems.

    “With the new cellular modem and HSPA (High Speed Packet Access), the receiver not only enables users to easily obtain Spectrum-RTK (Real Time Kinematic) and RTK corrections via the Internet, it also allows it to function as a mobile base station as part of the MAGNET Relay GIS broadcasting service, ‘relaying’ corrections to multiple rovers,” Hooten said.

    “The multiple configuration options make the compact and lightweight HiPer SR extremely versatile for any GIS user,” said Hooten.

    Additional features of the HiPer SR for GIS include 226-channel Vanguard technology with Universal Tracking Channels and Fence Antenna® technology for signal tracking sensitivity and multipath rejection.

  • Colorado County Authorized to Operate Trimble’s Unmanned Aircraft System

    Trimble has announced that Mesa County in Colorado has received a Certificate of Authorization (COA) that will allow the Public Works Department to operate its Trimble UX5 Aerial Imaging Solution throughout the county. A COA is an authorization from the Federal Aviation Administration (FAA) allowing the operation of an unmanned aircraft in a designated area and not for commercial use.

    The authorization is currently required to legally operate a public unmanned aircraft in the U.S. The COA was granted to the Mesa County Sheriff’s Office, who manages the county’s unmanned aircraft system (UAS) operations and has been flying systems since 2008.

    Mesa County’s Public Works chose the Trimble UX5 for a variety of applications including determining volumes and compaction of its county landfill, surveying and monitoring capital improvement projects such as roads and bridges, as well as assist the Mesa County Sheriff’s Office or other county departments, as needed. “With the Trimble UX5, Mesa County is one of the first to benefit from a cutting-edge solution that can change how surveyor’s collect data,” said Frank Kochevar, GPS/Survey Supervisor for Mesa County Public Works. The Trimble UX5 was used by Mesa County Public Works to gather aerial images of the landslide that occurred in Western Colorado in May of this year.

    “Trimble’s goal is to allow geospatial professionals to quickly and efficiently capture and convert existing field conditions into actionable information for their customers. We are pleased that Mesa County will now be able to apply the Trimble UX5 Aerial Imaging Solution to meet their public works department needs,” said Phil Sawarynski, business area director for Trimble’s Geospatial Imaging solutions.

    Mesa County has received multiple COAs since 2008 from the FAA for public safety purposes. This is the first COA issued to the Mesa County Sheriff’s Office that will be used specifically for aerial mapping on surveying and engineering projects, in partnership with the Public Works Department. According to Ben Miller, UAS Program Director for the Mesa County Sherriff’s Office and coordinator for all their COA’s, “In collaboration with Trimble, Mesa County, Colorado continues to demonstrate that small unmanned aircraft are not just a tool to save lives, but a community asset that can help save its citizens tens of thousands of tax payer dollars.”

    The Trimble UX5 is an unmanned fixed-wing aircraft targeted at the surveying, oil & gas, mining, environmental and agriculture industries. The system autonomously captures a series of high-resolution images during flight, which is typically up to 50 minutes covering as much as 2.3 square kilometers (approximately 1 square mile) when flying 120 meters (approximately 400 feet) above the ground. Using Trimble Business Center Office software, images are used to easily generate 2D and 3D deliverables such as orthomosaic images, three-dimensional point clouds and contour maps. The Trimble UX5 enables the collection of large amounts of data, often faster than traditional surveying technologies.

  • Report from the 2014 Esri International User Conference

    Live from Esri in San Diego: The Hottest Mapping Trends

    If you’d like to experience an industry first, I think, I’ll be participating in a live webinar being held during the Esri conference at the San Diego Convention Center on Thursday, July 17, at 10:00 a.m. U.S. Pacific time. I’ll have some planned guests, and perhaps drop-in guests, discussing the complexities of integrating mobile devices with disparate operating systems (Android, iOS, Windows, Windows Mobile, Windows Phone) into your GIS workflow. If you’re at the conference and would like to see us in action, stop by the podcast booth near Room 27 of the convention center. If you’d like to tune in live via the Internet, please sign up by clicking here.


    This week is the mecca of GIS, at least in the U.S.; the Esri International User Conference (UC) in San Diego, California, and I’m swimming in GIS up to my ears.

    There’s always a myriad of Esri-centric meetings and events during the weekend prior to the UC, and this year was no exception. During the weekend prior, I attended the AEC Summit, formerly named the Survey Summit. The AEC Summit bills itself as the “Forum for High-Accuracy” GIS.

    The dominant technology discussed at the AEC Summit was UAS (aka UAVs, Drones). There was lots of discussion about the forthcoming Federal Aviation Administration rules (due September 30, 2015) and “potential” UAS applications. However, one presentation gave the audience a practical look at the value of a UAS. Burns & McDonnell, in association with the University of Connecticut, reported their company worked nine months to gain approval (Certificate of Authorization) from the Federal Aviation Administration (FAA) to conduct a transmission line inspection using a rotary-wing aircraft.

    Steven Santovasi, GISP at Burns & McDonnell, gave a summary presentation of their experience with UAS technology. He started with this slide that frames the UAS device market, divided into three device segments: fixed-wing, rotary craft, and a hybrid version with the hover features of a rotary UAS but the speed and stability performance of a fixed-wing UAS.

    Types of UAS used for Mapping
    Types of UAS used for Mapping

    Santovasi reported that using the rotary UAS allowed his company to perform an inspection that he thought couldn’t be performed by a manned aircraft. He said that the UAS was able to get within five feet of the structure and take detailed, high-resolution photos. In fact, he said his team was able to identify a failing bolt that may have caused a significant power outage. He reported that a representative of the transmission line owner said that the discovery of the failing bolt “paid for the project.” The transmission line is strung on a 250-foot-tall tower.

    Following is a photo of the bolt (and accompanying structure) taken by the rotary craft UAS. There’s actually a much higher-resolution an close-up photo of the bolt I’ll try to obtain and update in this article.

    Failing Bolt Identified by High-Resolution Photo Captured from a UAS
    Failing Bolt Identified by High-Resolution Photo Captured from a UAS at Close Range

    There was some discussion in the audience that the FAA may not make the September 30, 2015, deadline, or that it will issue a partial set of rules. Last month, a Washington Post article reported the same. If that happens, it’s going to be really interesting. It seems like with each day that goes by, the heat gets turned up a little more for the FAA to act. More frequently, perhaps fueled by the FAA vs. Pirker case where the FAA was slapped by a NTSB judge for not having enforceable rules to punish “violators,” there are media reports that individuals and companies are using UASs for commercial purposes regardless of the FAA’s position. For example,

    However, the FAA is not giving up in its attempt to assert its rules despite the ruling by the NTSB judge. On June 23, the FAA issued a press release offering “guidance to Model Aircraft Operators” in an attempt to squelch commercial UAS operators from believing they can fly under modeler rules.

    User Conference Plenary

    Every year, I look forward to Esri President Jack Dangermond’s keynote at the plenary. I love that Esri is still a privately held corporation, having only to answer to themselves. They don’t have to worry about Wall Street quarterly reports as publicly-traded companies do, so they can choose to change strategy or take on projects that may not appeal to public shareholders. Given that, you really never know what Mr. Dangermond might decide to do, or say, so it’s always interesting to listen to his thoughts on Monday morning.

    Of course, there were tons of ideas shared, some new products introduced, and some impressive fourth-graders speaking to a crowd the size that 99.5% of us will never have the opportunity to address. But, after listening to the plenary, watching Twitter, reading blogs and news releases, etc., I can boil it down to one word where this technology is headed…real-time (or is that two words hyphenated? :-) ). I want current information, and I want information as events occur. That is the definition of real-time. I was struck by the City of Rancho Cucamonga’s  presentation, which won Esri’s President’s Award. The city has deployed a GIS that allows it to “see” events as they happen, whether it be a traffic accident, fire or other public emergency. Of course, you can easily extrapolate that to include public works nuisances like potholes, traffic signal outages, and street closures, then further extrapolate to society where you have something like Waze, a mobile phone app that allows millions of drivers to share real-time information about traffic conditions.

    City of Rancho Cucamonga Executive Dashboard for Monitoring Municipal Gov't Activity
    City of Rancho Cucamonga Executive Dashboard for Monitoring Municipal Gov’t Activity

    In geographic regions where there is solid wireless connectivity, there’s no reason we can’t or shouldn’t have access to real-time information on a broad scale, in a very accessible manner. And of course, geographic location is a super-important part of that real-time information. Accurate, real-time information allows us to make accurate, real-time decisions.

    The real-time theme bubbles and oozes from GIS, and GIS is begging to be a real-time technology. This is largely driven by mobile devices and sensors. It’s not like the real-time “transaction,” as Mr. Dangermond has coined in past Esri UC conferences, is a new concept. That concept hasn’t changed. What has changed is the proliferation of mobile devices and sensors that enable us to carry the power of GIS in our pockets. They are the technology enablers of real-time GIS, and the trend is crystal clear. It is what people want, and they will get it because GIS, mobile devices and sensor technologies are converging, and to a price point that is very affordable. This year, Mr. Dangermond mentioned the Internet of Things during the general plenary. This is exactly what I’m referring to. Devices and sensors will each have an IP address, or some method of making themselves known on a network. Some people call this Big Data. Regardless, we’re seeing this transformation beginning.

    I saw a great example of the transition from labor-intensive transactions to real-time transactions at a Esri UC presentation this week. It’s a utility company that was using a data check-in/check-out workflow to collect high-precision GPS data for its infrastructure (e.g., valves, meters, etc.). The company was spending a significant amount of time dealing with the data check-in/check-out procedure and  data post-processing. Some downsides of the data check-in/check-out workflow listed were:

    • many opportunities for human or technical error
    • clunky and arduous QA/QC process
    • slow and expensive workflow that is difficult to scale
    • software maintenance cost and overhead

    In the past six months, the company transitioned to a real-time data collection process that posts high-precision GPS transactions in real-time within SDE in ArcMap. Some of the benefits listed were:

    • GPS points update in real-time within SDE
    • laterals and fittings draw and populate automatically
    • support for a wider variety of software data collection tools like ArcGIS Mobile, ArcPad (either SDE or ArcGIS Online) or Collector
    • simple design for tablet use (either online or offline)
    • software cost reduction (unlimited seats of ArcGIS Mobile w/Server, Collector free through ArcGIS Online)

    Perhaps the words that best describe the company’s transition to a real-time GIS transaction workflow were contained in the summary page of the presentation.

    Time: Our Most Precious Resource

    ‘ Nuf said.

    Plenary Opening Keynote by Mr. Dangermond

    If you want to take a look Mr. Dangermond’s opening keynote, including the presentation by the City of Rancho Cucamonga, following is a 22-minute video that’s worth a look.

    Thanks, and see you next time.

    Following me on Twitter at https://twitter.com/GPSGIS_Eric

  • Slideshow: 2014 Esri User Conference

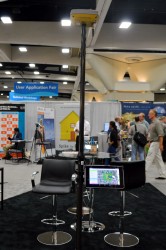
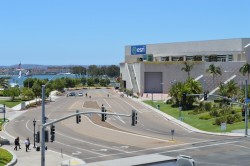
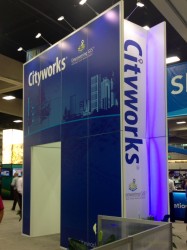
    GPS World is at the 2014 Esri User Conference, being held July 14-18 in San Diego. Check out our slideshow for key photos from the first day of the conference. Follow tweets from GPS World and Geospatial Solutions for live updates from the conference.


  • Topcon Releases MAGNET Relay for GIS

    MAGNET_Relay_GIS_Topcon-W

    Topcon Positioning Group has added the MAGNET Relay for GIS to its suite of cloud-based solutions software. As a component of MAGNET Field GIS, MAGNET Relay GIS is a mobile base station real-time kinematic (RTK) broadcasting service. The system is designed to allow subscribers to connect a GNSS base receiver to MAGNET Relay via a cellular connection for high-accuracy RTK corrections.

    “The RTK base station can be used by up to 10 rovers, which makes MAGNET Relay a great solution for large scale and highly precise GIS projects,” said Jason Hooten, Topcon national sales manager for GIS products.

    “MAGNET Relay for GIS allows for data to be collected in the field without the need for post processing, and then quickly transferred to the office using the company’s secure, cloud-based MAGNET Enterprise account,” Hooten said.  “Additionally, the service brings real-time network-based corrections to project sites that do not have existing coverage.”

  • PenBay Solutions Launches InVision 1.5 for Facilities Management

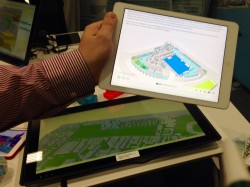
    PenBay Solutions Launches InVision 1.5 for Facilities Management


    Photo: PenBay Solutions

    PenBay Solutions, a developer of GIS-based facility management and public safety software, is introducing InVision 1.5 in booth #F116 at the Esri User Conference in San Diego, July 14-17. The new technology will also be featured at the InVision Special Interest Group Lunch in room 28B at 12 p.m. on July 16 at the conference.

    InVision software is built on the Esri ArcGIS platform to help users visualize, analyze and interpret data in ways that reach beyond individual buildings and site maps. InVision bridges the gap between managing exterior and interior built environments by aggregating all facility and infrastructure data from various sources into a single, comprehensive, visual system for portfolio management, operations, and safety and security.

    The 1.5 release of InVision software introduces several new features and enhancements with an emphasis on mobile capabilities. InVision 1.5 introduces mobile viewers for:

    • Space Management: view space types, uses and assignments while in the field to more easily find and understand space use and classification.
    • Asset Management: remotely view utility and asset types, statuses and conditions to more quickly locate and evaluate assets.
    • Campus Viewing: provide information about campus points of interest so employees, residents and visitors can easily find what they are looking for.
    • Security Planning: view security plans – including both indoor and outdoor environments – and share that security information via mobile devices with outside public safety agencies and response personnel.
    • Security Operations: view critical building, floor, space and security asset information in the field to better understand the location and status of security assets in real time.

    “Mobility is critically important to our customers,” said Stu Rich, Chief Technology Officer at PenBay Solutions. “These new InVision Mobile Viewers are just the beginning. We’re in the process of developing mobile applications designed for data collection, data editing and inspection workflows as well. Watch for announcements around those exciting new applications in the coming months.”

    The InVision Secure Event Management Solution supports a range of activities and users throughout event planning, coordination, and operations. With InVision Secure, users can coordinate plan creation, manage the review and approval process, and securely share information that is relevant to the safety and security of events. The solution helped make Super Bowl XLVIII a safe and successful event, according to PenBay Solutions.

    “PenBay Solutions was instrumental in helping us with all the agencies we worked with to gather data, and for implementing a public safety system that met our needs for the Super Bowl,” said Captain Steven Pollackov of FDNY’s GIS Unit. “As we move forward, we will be utilizing this platform more and more.”

  • CompassCom Previews On-the-Fly Geofencing at Esri User Conference

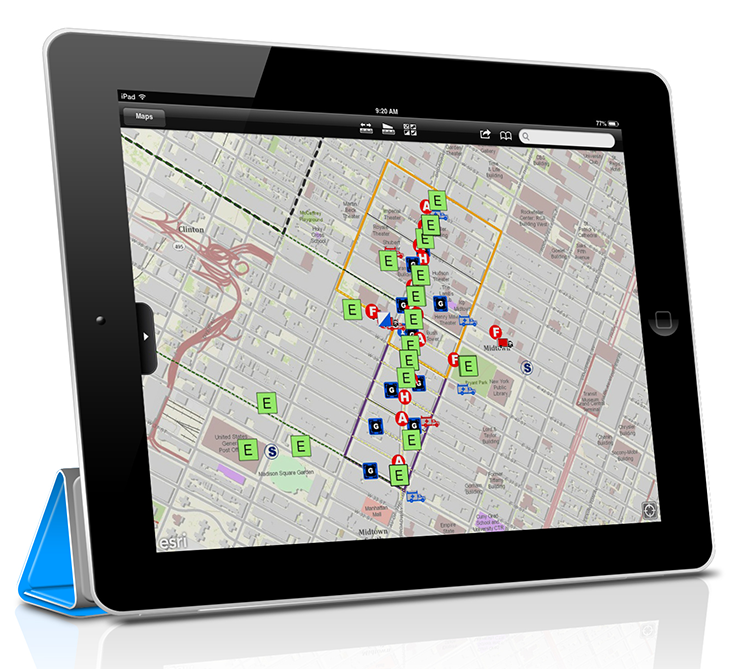
    CompassCom will offer Esri User Conference attendees a sneak peek at advanced asset tracking capabilities in the upcoming version of its CompassTrac software powered by Esri ArcGIS technology. Scheduled for release in late summer, CompassTrac 6 provides Esri users with custom digitizing tools for geofencing applications and map optimization for any electronic device.

    CompassCom will demonstrate the new CompassTrac 6 capabilities in booth #2307 at the Esri User Conference, being held July 14-18 in San Diego.

    “The newest version of CompassTrac will enable Esri GIS users to keep track of their vehicles and high-value assets with greater ease than ever before whether they are in the office or out in the field,” said CompassCom CEO W. Brant Howard. “On-the-fly geofence alerts increase fleet efficiency and improve crew safety.”

    CompassTrac is the software tool that enables Esri ArcGIS users to view the locations and statuses of vehicles and other high-value assets on their GIS map in real time. Leveraging existing Esri architecture and GIS data files, CompassTrac locates addresses and displays vehicle positions, speeds, and heading on the fly using selected ArcGIS data layers as the map background, including satellite and aerial imagery, the company said.

    Over the past 16 years, CompassTrac has provided field service management services for thousands of vehicles operated by organizations involved in public safety, public works, utilities, road maintenance, delivery and transportation.

    The premier upgrade to CompassTrac version 6 is a set of digitizing tools that allows the user to draw a geofence polygon around any feature or area — a street, neighborhood or town — on the GIS map. If any vehicle or asset being tracked by the system crosses the geofence boundary, CompassTrac will automatically send a text or email alert to select users and highlight the vehicle in question on the map display. These geofence alerts occur instantly and on the fly in real time, providing enhanced tracking of mobile resources to help operators manage their mobile work force.

    Now with version 6, CompassTrac is also hardware agnostic. The software will automatically scale, or optimize, its map view to fit on the screens of desktop computers, laptops, tablets and smartphones, giving Esri users the ability to track assets from any location where they have Internet.

    Visitors to CompassCom’s booth #2307 at the Esri User Conference will also view demonstrations of the new CompassLDE Connector, which provides plug-and-play capabilities to link AVL and mobile resource management tracking to the Esri ArcGIS GeoEvent Processor.