CoreLogic, a global property information, analytics and data-enabled services provider, has introduced a new land records management solution to provide a single source of location information and property characteristics data for the oil & gas, utilities and telecommunications industries. SpatialRecord by CoreLogic integrates CoreLogic parcel-level spatial data with the company’s vast property-level database to provide expanded data analysis and more granular information.
The patented technology used to create SpatialRecord technology converts raw data into easily digestible information that can be leveraged to make more informed exploration, planning, serviceability and compliance process decisions. SpatialRecord, appends and normalizes location information and property characteristic data that is often otherwise dispersed across a variety of sources so that it’s ready for client use quickly and without further analysis required.
“Whether managing field infrastructure, planning the path of a new transmission line, or managing legal compliance and risk, it’s vital for oil & gas, utility and telecommunications companies to have access to complete information to make critical decisions quickly and accurately,” said Jay Kingsley, senior vice president for CoreLogic Spatial Solutions. “This integration of location information and property-specific data, combined with the quick turnaround and comprehensive front-end analysis, puts crucial information at a users’ fingertips, reducing the time and resources required and allowing a greater focus on core business activities.”
SpatialRecord provides highly granular data that is updated daily from more than 4,700 sources on 99 percent of properties throughout the U.S. In addition to combining the data sets into a single, ready-to-use resource, the expanded integration of CoreLogic spatial and property-level data includes:
Land property use, as well as the actual and effective year a structure was built on the property
Land, structure and property valuation and tax information
Property and structure area
Construction and structure details, including specifics on the type of foundation, roof covering used, the number of bathrooms and the number of fixtures in each
Mailing addresses that coincide with site addresses, which can help prevent delays and mistakes in compliance processes and communications
Both first and last names of primary property owners, as well as first and last names of secondary property owners to increase accuracy in identifying and communicating with land owners
“Combining the most granular property characteristics with parcel-level accuracy not only saves time and money, but also improves efficiencies in the complex processes of planning, exploration and compliance,” said Kingsley. “And the benefits extend to land and property owners as well. With a more comprehensive record of a property in hand, these companies are better positioned to work more effectively, minimize errors or disruptions and provide a higher level of service to individual land owners.”
Rand McNally has launched a new online educational tool that delivers dynamic maps with social studies, history and geography content as well as reading programs and writing lesson plans. The online service, Rand McNally World Atlas, was designed to be cross-curricular and intuitive for both educators and students.
At the heart of World Atlas is an engine that allows educators to annotate and share maps. The flexible, easy-to-use tool lets teachers access historical maps, boundaries and demographics on present day maps; create custom maps; and easily share maps back and forth with students, teachers and other classes. Educators can print out a fully populated or outline map of any place in the world.
“Rand McNally World Atlas harnesses technology to help students understand the world around them,” said Stephen Fletcher, CEO of Rand McNally. “Not only does World Atlas illustrate and support topics across curricula, but the interface allows teachers and students to easily share ideas and assignments.”
World Atlas includes a variety of thematic maps and data layers including population density, climate, historical boundaries, and natural hazards. Maps can be annotated and customized, and then downloaded, printed and shared with other educators and students.
With World Atlas, it’s possible to:
Customize maps with a wide range of thematic overlays.
Use dozens of lesson plans and resources to help build presentations.
Access world event articles for reading and writing connections.
Print or download custom maps anywhere in the world.
Create individual accounts for students allowing them to customize and save their own maps.
Access from anywhere with an internet connection, from the classroom or from home.
Use one intuitive, easy-to-use tool for a wide variety of purposes.
World Atlas is aligned with state and the Common Core standards. The product is available via annual subscription from Rand McNally. For more information on World Atlas, or to sign up for a free online demo, visit World Atlas.
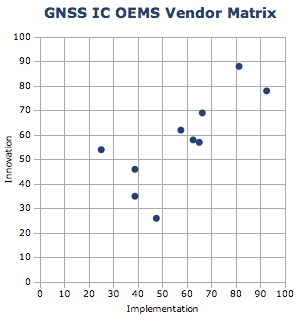
ABI Research’s 2014 GNSS IC vendor matrix names Qualcomm as the leading GPS integrated circuit (IC) vendor, followed by Broadcom in second place. For the first time, MediaTek achieves a top three finish after another year of strong growth and robust shipments as a result of its targeted design strategy, ABI Research revealed in its “GNSS IC OEMs” report.
The vendor matrix compares companies on 17 criteria across the broader categories of GNSS Innovation and Implementation. Qualcomm remains the dominant player with a strong ubiquitous location platform in IZat — this will be vital for success in high volume cellular handsets in 2015. It is also in a strong position to grow in other GNSS markets.
Broadcom continues to compete aggressively through innovation, receiving the highest score for this category for yet another year. Already in 2014, Broadcom has announced its concurrent tri-band BCM 47531 IC and the BCM 4771 GNSS SoC designed for wearables, featuring a sensor hub and always-on capabilities. Finally, it has also announced its 5G Wi-Fi SoC, which supports its new proprietary FTM-based AccuLocate technology.
u-blox has also moved up a position to fourth in this year’s assessment. It continues to grow revenue year-on-year, with little to suggest this will change in the coming year. It is also the first time u-blox has finished ahead of CSR, which was ranked fifth. CSR continues to transition and faces another arduous year in 2014. It will be 2015/16 when the effects of these tough decisions are proven out to be correct or not.
MediaTek has now emerged as a major threat, taking third on innovation and 2012 market share rankings, following very impressive shipments of its combo ICs into local Chinese smartphone manufacturers. It is also strong on PNDs/recreational and cameras, with a growing presence in other markets. Its move to fully embedded GPS in 2013 should prove significant in driving market share in the future.
Beyond this, STMicroelectronics also deserves a mention with its new Teseo III platform giving it significant design flexibility allowing it to compete aggressively in existing markets while expanding into new opportunities.
LocationSmart, a provider of cloud-based location and interactivity services, has announced the issuance of US Patent 8,666,373 by the U.S. Patent Office for location reporting based on the dynamic status of a user. The patent covers a system and method of determining location for the user, including dynamically determining a status of the user and allowing acquisition of the user’s location based on the determined status.
The issued patent enhances LocationSmart’s cloud-based, cross-carrier location and interactivity platform that is powering the enterprise with location insights through a comprehensive set of web services application programming interfaces (APIs), the company said.
This patent further covers the location reporting of a person based on a dynamically monitored status; for example, when an employee is on the job versus when the employee is on his or her own time. Reporting is responsive to the received location tracking request, based on current status and allowed permissions. This is significantly instrumental for monitoring and managing mobile workforces, LocationSmart said.
“Knowledge of when to obtain location information based on dynamically changing status is fundamental to several of our key verticals,” said Mario Proietti, CEO of LocationSmart. “This patent strengthens the protection and rendering of our services for mobile check-ins and status reporting in the workforce management and transportation sectors.”
The LocationSmart platform is employed by leading companies in a number of industries, enabling a multitude of applications including service assistance, proximity marketing, workforce check-ins, emergency alerting, mobile gaming and transaction verification.
The European Commission is considering a requirement for mobile phones, and perhaps other portable devices such as tablets, to be equipped with Galileo receivers that would automatically send location data as part of any emergency call to 112.
E112 is a location-enhanced version of the 112 universal European emergency services number via telephone, equivalent to 911 in the United States, in which the telecoms operator receiving the call for help transmits location information to the emergency dispatch center, which has further connection to police, firefighters, medical, and other emergency services.
A European Union Directive on E112 requires all mobile phone networks to provide emergency services with available information on the location of the caller. Currently this data is the cell id, which is of limited use in localising a call as, for example, in rural areas where the mobile cell may have a radius of two to twenty kilometres — not very helpful for police or medical emergency crews in finding someone in distress.
Whether the Commission (EC) should mandate Galileo, or take a different option, is currently the subject of consultation. The EC convoked a public hearing in Brussels in May to chew over the pros and cons.
Legal Obligation
The Commission has a legal obligation to look at potential activities that can maximise the societal benefits of Europe’s huge investment in satellite navigation technologies such as Galileo and EGNOS. It is also tasked to assess how these technologies could reinforce Europe’s economic infrastructure. To me, the E112 mandate is a low-hanging fruit ready to be picked, and the majority of stakeholders who voiced an opinion at the hearing evinced great enthusiasm for the proposal.
Interestingly, the regulatory route to achieve a mandated use of Galileo for E112 would be via a delegated act; the relevant radio equipment and telecommunication directives are already effectively in place. This means that if the Commission decides to mandate, it can do so without the need for further regulation.
Mandating a specific GNSS system for a regional service of this type is not a new idea. Russia and China have both done so. As Richard Catmur of Spirent Communications put it: “We are not seeing Galileo being pushed like GLONASS and Beidou in the market. We need input from this forum.”
Justyna Redelkiewicz of the European GNSS Agency (GSA) outlined some technical reasons for mandating Galileo. Over and above (yet to be fully proved) improved accuracy, availability. and a faster time to first fix, the likely inclusion of signal authentification in the Galileo open service would reduce any impact of spoofing — a very useful characteristic in what is essentially a safety-critical system.
Johannes Vallesverd, who chairs the group within the European Conference of Postal and Telecommunications Administrations, Electronic Communications Committee tasked with delivering harmonisation of the 112 number across Europe, was also very positive: “We need to talk about how we could be saving lives Europe.” He advocated a proactive and rapid decision.
This was reinforced by Gary Machado, CEO of the European Emergency Number Association (EENA). He estimated the annual economic cost of the delays induced by inaccurate location data at more than €4 billion across Europe. In contrast, the cost of implementing a system to relay GNSS location from equipped smart phones was of the order of €250 million. Economically, it is a no-brainer.
Bruno Gagnou from Thales Alenia also thought that GNSS — and specifically Galileo — gives the right answer for E112 positioning. “The technology is reliable and accurate,” he said, “with obvious benefits for society. Lives will be saved, the security of citizens enhanced due to quicker intervention, and European industry will be supported.” He noted that this was also the experience in the United States when the enhanced 911 regulation was introduced.
Gagnou thought that Galileo should be mandated in order to ensure a harmonised approach across Europe and avoid an anarchic, non-compliant deployment of technologies for E112. “EU emergency services should rely on EU technology,” he concluded. “EU citizens deserve the best E112 emergency service.” Galileo should be favoured, all mobile devices should be addressed, but this will require mandating. It seems to me that the Commission will agree with him.
Quantum Navigation: Ultra-Cold Alternative to GNSS?
Some potential future tech! The Quantum Timing, Navigation and Sensing Showcase at the UK’s National Physical Laboratory (NPL) in mid-May highlighted the possible use of quantum technology for highly accurate timekeeping and advanced, GNSS-independent, navigation. This so-called second quantum revolution’\ could make a big impact on the field of Timing, Navigation and Sensing (TNS) through technology based on ultra-cold, laser-cooled atoms.
The meeting was organised by the UK’s Defence Science and Technology Laboratory (DSTL). It presented a number of research projects including a table-top quantum accelerometer designed to provide ultra-precise, highly reliable positional data for submerged submarines.
As we know, GNSS does not work well underwater, so submarines navigate using accelerometers to register every twist and turn of the submerged vessel relative to its last surface GNSS fix.
“Today, if a submarine goes a day without a GPS fix, we’ll have a navigation drift of the order of a kilometre when it surfaces,” said Neil Stansfield of DSTL. “A quantum accelerometer will reduce that to just one metre.”
Once chilled to an ultra-cold state, the rubidium atoms in the accelerometer achieve a quantum state that is easily perturbed by an outside force. Another laser can then be used to track these perturbations and calculate the size of the outside force, and therefore the relative position.
At present, such devices are only found in the laboratory, but research is pushing past classical physical limits towards optimal performance, as scientists investigate miniaturisation and the potential use of new materials to reduce costs and increase the practicality of the devices. Following land trials in late 2015, it is anticipated that a sea-going version will be demonstrated in a British sub during 2016.
”The defence industry often acts as a pioneer in the development of new technologies. The potential benefits of a future in which we can navigate by inner space rather than outer space will impact both the military and civilian world,” commented Neil Stansfield.
Bob Cockshott from NPL said: “Whilst the most immediate applications are in the defence field, future quantum navigation technologies could also have significant civilian applications across a wide variety of activities, covering high frequency trading, network synchronisation, robust and ubiquitous navigation, geo-surveying, and mineral prospecting. With the first applications potentially ready for market in five years, now is the critical moment time to consider the opportunities provided by quantum.”
Cockshott points out that chip-scale atomic clocks using similar principles are here now from Microsemi in the United States — indeed, they have been integrated with GPS in some U.S. military applications — and can provide low-power, low-cost hold-over for timing applications. He expects to see European designs on the market within five years and a steady improvement in capability thereafter.
“Cold atom accelerometers may also appear in high-value (probably military) applications within five years. These could form the basis of a quantum compass,” he predicts .
GPS-like progression. He envisages something like the progression seen in GPS receivers from expensive military equipment to high-value professional users and then mass-market. DSTL and the UK’s Technology Strategy Board are working hard to get industrial suppliers of support equipment and of quantum devices working as quickly as possible to get these technologies to market, and consumer devices are certainly the ultimate aim.
“I would see these technologies as complements to GNSS, at least in the short and medium term, providing hold-over in poor GNSS environments (such as urban canyons etc) and capability where GNSS will never work — in tunnels, for example,” comments Cockshott.
Of course companies like Google would like to guide city dwellers through urban underground metro systems, switching seamlessly to GNSS when they step out into the open air. “The quantum compass will not of course provide position fixes, only information about positional changes from a known starting point,” he points out.
However, in the long term, such gravity sensors combined with detailed maps of the Earth’s gravitational field may be able to provide GNSS-free positioning and navigation. Militaries are interested in this option because there is no known physics that could jam or spoof such sensors. “But it’s hard to see them matching the precision available from GNSS,” he concludes.
Galileo First Fixers
The European Space Agency (ESA) handed out certificates to the first 50 global citizens to determine their position using only the Galileo system. They got responses from around the world.
While half the applications for certificates came from Galileo’s home continent, Europe, others first-fixers came from Australia to Canada, Egypt to Vietnam.
The first positioning fix using only Europe’s civil-owned navigation system took place at ESA’s Navigation Laboratory in Noordwijk, the Netherlands, on March 12,2013.
The Galileo team knew of fixes being performed on an informal basis, so to mark the anniversary of the first positioning fix they decided to issue commemorative certificates to groups who had picked up the signals to perform their own fixes. Teams were asked to include details of the receiver they used, the start and finish of the fixes in Universal Time Coordinated (UTC), and a plot of their latitude/longitude positioning overlaid on a map.
Italy turned out to be the single best represented country in Europe, with six separate fixes, followed closely by Germany and the UK with five each. Several groups had achieved fixes on the same day as ESA in 2013.
Most of the employed receivers were software-based radio systems, with signal processing performed by software on a computer linked to a radio-frequency front end. Professional receivers were also customised for the job.
“Most of the applications were obtained with static receivers and simple position fixes with Galileo’s Open Service signals,” explains Galileo engineer Gaetano Galluzzo.
Belgium’s Royal Military Academy performed Galileo’s first position fix at sea, aboard Belgian frigate Leopold-I, while sailing along the Norwegian coast.
A German telecom company made use of the satellite signals for timing and network synchronisation – one of the most important applications of Galileo will be as a nanosecond-scale time source, enabling the effective synching of financial, power and data networks around the globe.
Finally
Talking of fixes – has anyone heard anything from Galileo GSAT0104 recently? According to the European GNSS Service Centre, the fourth IOV satellite is “unavailable until further notice.” The setting of unavailability may be due to in-orbit validation testing, as the website implies may be the case, but no further official statement has appeared, nor active user notifications (NAGUs) at http://www.gsc-europa.eu/system-status/user-notifications.
There have been a number of NAGUs over the past couple of months concerning outages and, at different times, one or more of the Galileo satellites have been off line while this extended period of testing takes place.
The message to the recent European Space Solutions conference in Prague was simple enough: EGNOS is here, so let’s use it; Galileo is almost here, so let’s promote it.
Neither task is straightforward.
Take the European Geostationary Navigation Overlay Service (EGNOS), the European piece of a near-global network of terminals on geostationary satellites linked to networks of ground stations to verify GPS signal accuracy, primarily for aviation but with further applications as well. Other pieces of this global network are the Wide Area Augmentation System (WAAS) in the United States, the System for Differential Corrections and Monitoring (SDCM) in Russia, GPS-aided GEO-augmented Navigation (GAGAN) in India, and Multi-functional Satellite Augmentation System (MSAS) in Japan.
EGNOS is operational. It works. Once airports publish the required specificafions for localizer performance with vertical guidance (LPVs), aircraft with EGNOS terminals ultimately will be able to use EGNOS for flight terminations up to as low as 200 feet above the runway. Gone is the need for runway infrastructure, and welcome to the long-promised world of satellite-based augmentation systems. “It offers cheap solutions for precision approach,” said Fabio Gamba, chief executive of the European Business Aviation Association.
In the United States, where business aviation is a bigger market than in Europe, some 3,400 LPVs have been published for 1,670 airports. In Europe, the equivalent figure is 108 LPVs at 77 airports.
Why the sluggish response? Gamba cited a long list of issues, including some that appeared more political than technical. Part of the reason, some said, was that the EGNOS backers, including the company under contract to manage the system — European Satellite Services Provider (ESSP) of Toulouse, France — have not done enough to get the word out.
After all, these observers said, EGNOS suffered multiple delays, and its bigger younger brother, Galileo, has had bad press for years as its business model, ownership, regulatory backing, and schedule took turns in making eyes roll in Europe.
But that’s yesterday’s issue. Thierry Racaud, chief executive of ESSP, said EGNOS posted greater than 99 percent availability in May for its safety-of-life service, which is currently available on none of the other regional GPS augmentation systems except WAAS.
Racaud promised that the 108 LPVs signed so far would grow to 180 by the end of this year, and that 200-foot level approaches would be certified by late 2015. He said he hoped all 28 member nations of the European Union would have concluded their EGNOS regulatory approvals by 2017 or 2018.
“What we need now is more users,” Racaud said.
If EGNOS is not well known on its home turf, imagine its status in Africa, where European companies are trying to sell its adoption. Abdel Nasser Saint’Anna, director of the EGNOS-Africa Joint Program Office, said Africa should be Exhibit A for an EGNOS success pitch. Of the 2,500 runways in Africa, he said, only 177 were equipped with instrument landing systems (ILS), the system EGNOS and Galileo ultimately would like to replace.
Galileo, with Four, in Fourth
Galileo, too, appears headed for a successful adoption in many areas around the world even if, once operational, it likely will be the fourth global GNSS system in place, after GPS, Russia’s GLONASS and China’s BeiDou — not counting the large regional Indian and Japanese systems now being developed.
For those with scorecards, recall that four Galileo satellites, designed to validate the system’s performance, are in orbit. Carlos des Dorides, director of the European GNSS Agency (GSA) in Prague, said tests in May proved Galileo’s interoperability with GPS.
More importantly, des Dorides said the tests demonstrated how much better it is for consumers when their terminals access GPS and Galileo together. That should be obvious. Less obvious: Results were much better than with terminals tracking both GPS and GLONASS, he said.
The more satellites, the better? Yes, at least up to a point. Whether terminal manufacturers will see fit to incorporate all four global GNSS constellations, plus one or two of the regionals, in their hardware remains to be seen.
But the pent-up demand for Galileo does now seem better than it was as little as a year ago, despite the fact that some Asian nations attending the conference said they need Galileo to demonstrate its vitality sooner rather than later. Some officials said signal-quality issues with Beidou, and the recent GLONASS outage, will more than make up for Galileo’s delays as long as deployment progress is visible.
The fact remains that by 2020 there will be more than 100 GNSS satellites in medium-Earth orbit, in addition to the augmentation terminals on geostationary satellites.
A graphic presented by SpaceTec Partners’ Rainer Horn, whose company has been charged with preparing the Asian market for Galileo, showed just how dense the Asian skies will be with GNSS assets at the end of the decade. India, China, Japan, Taiwan, and South Korea are SpaceTec’s current Asian targets.
The message from these markets: Launch Galileo now. Drum up support. Occupy the media space.
Did the European Commission get the message? Time will tell. The next opportunity to wave the Galileo flag comes in late August, when the first two of 22 full-operational-capability satelllites will be launched from Europe’s spaceport in South America. Two more are scheduled to follow late this year.
Eight satellites in orbit by Christmas will not make an operational service, whatever the brochures say. But does that matter? Galileo now has secure funding, through 2020, for most — not all — of what it needs to launch a full constellation. Absent a new issue, by 2017 few will remember the delays.
Paul Weissenberg of the European Commission, who has seen the Galileo wars up close, reminded the European Space Solutions audience in Prague that one future Galileo customer sits outside the commission’s offices, waiting for approval to use Galileo’s PRS encrypted service. The U.S. Defense Department’s desire for Galileo does not have an expiration date. Just launch it.
Potential GNSS Back-up Improves to GPS-Level Accuracy
A new enhanced differential Loran system demonstrates 5-meter accuracy not achievable by the current DLoran system, and requires less expensive reference stations. A prototype tested in Rotterdam’s Europort area uses standard mobile telecom networks and the Internet to reduce correction data latency — a key source of error — by one to two orders of magnitude.
By Durk van Willigen, René Kellenbach, Cees Dekker, and Wim van Buuren
For maritime applications, Loran is considered as the most promising backup for GNSS for situations where the use of navigation satellite signals is denied. For this reason, the Dutch Pilots’ Corporation askedReelektronika to investigate whether differential Loran could meet the Dutch Pilots’ 5-meter accuracy requirement for a harbor navigation system. This proved to be an enormous challenge, as preliminary tests showed that even 10 meters was difficult to achieve with differential Loran (DLoran) as promoted by Trinity House, the UK lighthouse authority. This led to a thorough renewed investigation of all possible error sources of a complete differential Loran system. The outcome of this research is very promising, as a couple of major error sources could be isolated. This made the complete system better understandable, so adequate countermeasures could be taken.
Loran History
The development of Loran-C started in the United States about fifty years ago. It is a terrestrial low-frequency (100 kHz) system organized as chains, each consisting of a master station with two or more secondary stations. Each station broadcasts in a strict time format series of 8 or 9 pulses of approximately 250 µs. The effective radiated power is in the range of 100 to 1,000 kW, depending on the required working range. These high powers are required by the high levels of atmospheric noise in the 100 kHz frequency band.
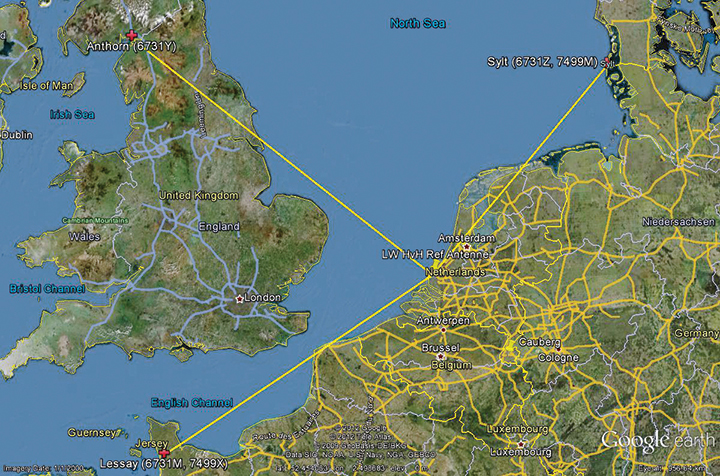
Figure 1 shows the test area of enhanced Differential Loran (eDLoran), using the Loran stations of Lessay (France), Sylt (Germany), and Anthorn (UK).
Figure 1. The Loran configuration in the test area of Europort.
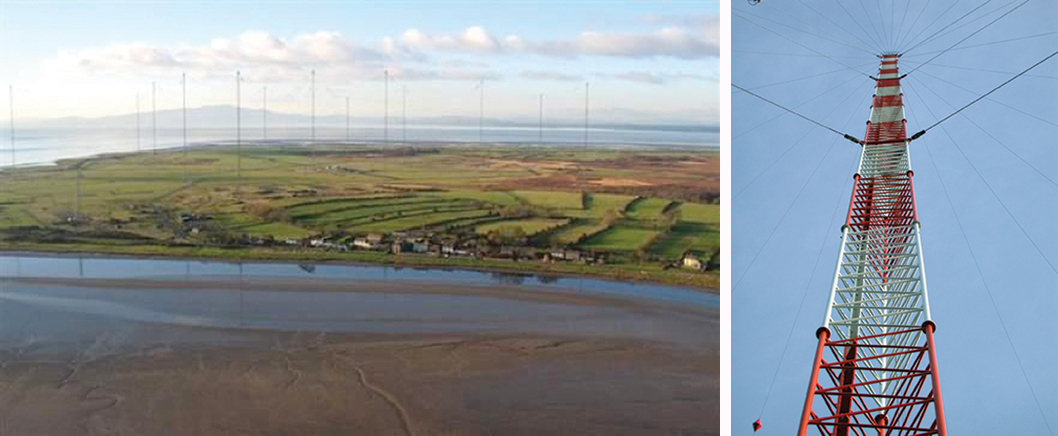
Radiating such high-power pulses requires large vertical transmitting antennae of about 200 meters height (Figure 2). These high power levels have long been seen as a drawback of Loran-C. However, the upcoming GNSS interference risks changed this apparent drawback into an advantage, as jamming such high field strengths is hardly achievable unnoticed. Loran-C is, unfortunately, less accurate than GNSS but it is nearly impossible to jam over large areas. This is one of the major reasons that Loran gets so much renewed interest by all who face risks in life-critical and environment-critical applications of radio navigation.
Figure 2. Left, the antenna park of 13 masts of ≈200 meters at Anthorn, UK. Right, the 200-meter mast at Sylt, Germany.
Differential Loran
Standard Loran does not meet accuracy requirements for harbor entrance and approaches. The International Maritime Organization requires 10 meters (95 percent), which is at least 5 times more demanding than standard Loran can provide. So, differential techniques have been developed and implemented, which are comparable with differential GPS. Although the error sources of GPS and Loran are quite different, the major common error source in both systems is the lack of accurate propagation models.
Several years ago, the General Lighthouse Authorities (GLAs) of the UK and Ireland implemented Differential Loran (DLoran) in the test area around Harwich. DLoran is based on a Loran reference station in the area of interest which measures temporal deviations of the measured pseudoranges. These “errors” are then sent to the user receiver through the Eurofix Loran Data Channel. This technique strongly resembles that of differential GPS. Unfortunately, for a number of reasons it proved to be impossible to achieve absolute accuracies of better than 10 meters with DLoran.
This has led to a new research project to find a more accurate differential Loran technique. All possible error sources have been investigated again where possible, producing unexpected solutions regarding accuracy and cost.
Error Sources
The total position error of Loran depends on the accuracy in time of the high-power generated Loran pulses feeding the antenna, the stability of the physical phase center of the Loran transmitter antenna, stability of the tuning of the antenna circuit, the accuracy of the measured additional secondary phase factor stored in the Additional Secondary Factor (ASF)database, and the quality of the Loran receiver. ASF is the additional delay when Loran signals propagate over land with a varying conductivity. As the ASF data are not fixed but vary slightly over time, temporal de-correlation, differential techniques have been developed to counteract that effect. In standard DLoran systems, the differential corrections are sent to the user through the Eurofix data link. Particular error sources include:
Transmitter Timing Accuracy. A Loran transmitter sends about 100 pulses per second. Each station has three cesium clocks time-synchronized to Coordinated Universal Time (UTC) via a time-transfer network. A two-way satellite time-transfer system will make it simpler and more accurate.
Antenna Phase-Center Stability. Loran transmitter antennas are vertical towers approximately 200 meters high to provide vertical polarization. Its phase center, at the published position, does not move more than about 1 meter according to the station crew at Sylt.
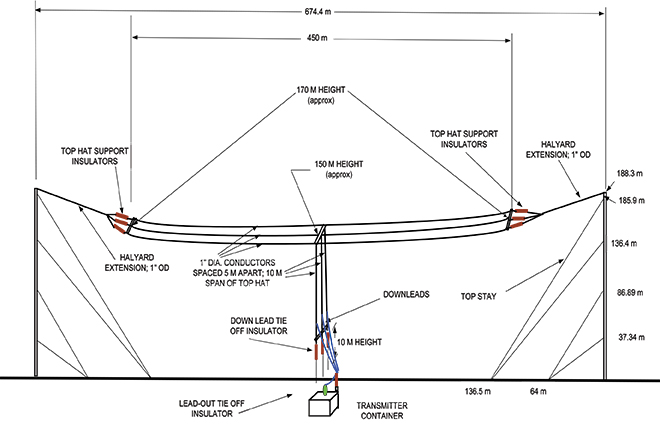
This situation is very different for a wire antenna as installed at the station at Anthorn in Northern England. The top-loaded wire antenna is installed between two towers 200 meters tall and separated by 675 meters (Figure 3). In stormy weather, the antenna position is not stable and does not continuously coincide within 1 meter of the published position of the antenna.
Figure 3. The enormous top-loaded Loran wire antenna at Anthorn. This type of antenna is not rigidly stable during storm. By courtesy of Babcock International Group.
ASF Data. The net travel time of the Loran signal from the transmitter to the receiver antenna is the sum of the propagation through the atmosphere (primary factor or PF), some extra delay due to traveling over seawater (secondary factor or SF), and finally ASF. The PF and SF are calculated from models, while the ASF must be measured. These calculations can only be accurate if the net travel time can be accurately determined and the distance between transmitter and receiver can be calculated with the help of GPS-RTK. The time stamps of the signal when leaving the antenna are not sufficiently accurate. The time stamps on the received signals are established by using a GPS-disciplined rubidium (Rb) clock. In conclusion, we cannot accurately measure and compute the absolute ASF values. All mentioned possible errors led to the use of differential techniques.
Differential Loran
As it is not possible to measure ASF data to sufficient accuracy, time-stamp errors at the transmitter can be circumvented by applying differential techniques over a limited area of interest. The receiver at the reference site and the rover receiver experience the same transmitter timing error, which makes it a common error and harmless in differential Loran. It is more difficult to cope with the offset of the Rb clocks at the reference and the rover sites, which is, unfortunately, not common-mode. Differential clock errors of a moving rover receiver may easily rise to 20 ns, equivalent to 6 meters. This type of error limits the achievable accuracy of an ASF data base.
The measured/calculated ASF data are due to weather effects on propagation slightly moving with time. That is the reason to use a reference receiver to measure these temporal variations and send these as AFS corrections to the rover receiver via the 30 bps Eurofix data link. Unfortunately, this rather slow data link introduces significant data latency, which turned out to be the source of significant differential Loran errors.
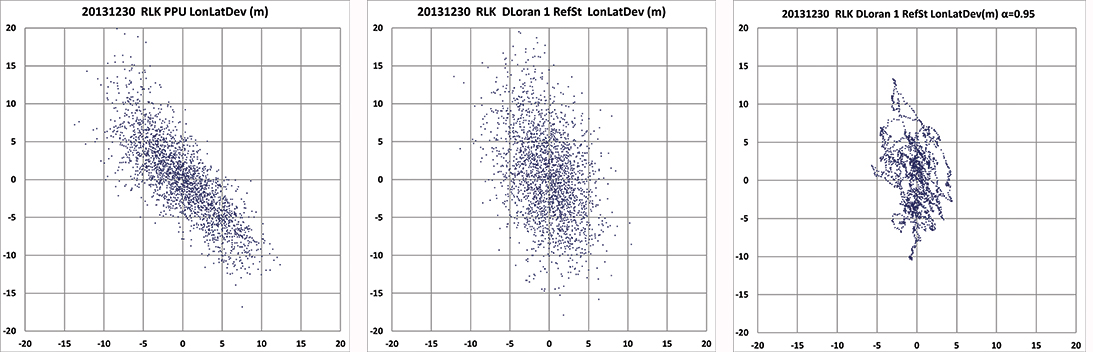
In the UK, many tests have been conducted to measure these ASF shifts and use the Eurofix data link for sending correction data to the user receiver. DLoran data are sent as pseudorange corrections per station. A complete set of DLoran correction data takes about 90 seconds. The UK plans to send correction data from multiple reference stations via a single Eurofix channel. The resulting very large data latency will preclude accuracies any better than 10 meters. The main reason of this conclusion was found by further analysis of measurements of the position of the rover receiver. These positions are shown as a scatter plot in Figure 4.
Figure 4. On the left the position deviation scatter plot at the rover receiver. The middle plot is the result after applying DLoran corrections from a reference station. The right plot of the same DLoran plot after being low-pass filtered indicating the slow moving of the phase center of the Anthorn transmitter. The axes are in meters.
The left-hand plot gives the position deviation of 2,500 independent measurements, where the scattering was thought to be caused by noise on the measurements. The middle plot is the result after being corrected by DLoran data with a 90-second data latency, which shows a somewhat modified form but still quite noisy plot. However, when the DLoran data were low-pass filtered, it appeared that often all separate measurements more or less formed lines, which would not happen with just atmospheric noise. Further, the scattering after filtering did not decrease much, which would happen if the disturbances were due to noise. See the right-hand plot in Figure 4.
This demonstrates that the source of the problem is the slow data rate through the Eurofix channel, in combination with the movements of the phase center of the transmitter antenna at Anthorn. Apparently, the solution had to be found in a much faster data link which could neither be offered by Eurofix (30 bps) nor by the U.S.-proposed OFDM technique with a data rate of approximately 1 kb/s. This unexpected result forced us to drastically change the concept of differential Loran to get much better accuracy results, as requested by the Rotterdam pilots.
Enhanced Differential Loran
The above mentioned difficulties with DLoran have led to a new concept of differential Loran which had to fulfil three important primary improvements. The first is a significant reduction in the latency of the data in the data channel; the second is that a large number of reference stations should be allowed to send correction data to the user without saturating the data channel. Finally, it is necessary to measure ASF data more accurately without being dependent on atomic clocks.
The simple conclusion was that Eurofix could not meet the first two improvements. As Eurofix is an invention of Delft University in the Netherlands, it was somewhat painful for the Dutch to admit that a much faster data link is absolutely needed to achieve a two-fold better differential Loran position accuracy. However, Eurofix is still the prime GNSS backup candidate for distributing accurate UTC over very large parts of Europe. Further, Eurofix has the capability to send short messages, which might be encrypted for secure communication purposes that might then form a terrestrial backup for Galileo PRS.
Finally, the third improvement to generate more accurate ASF data cannot be found on a pseudorange method but has to be established on position bases.
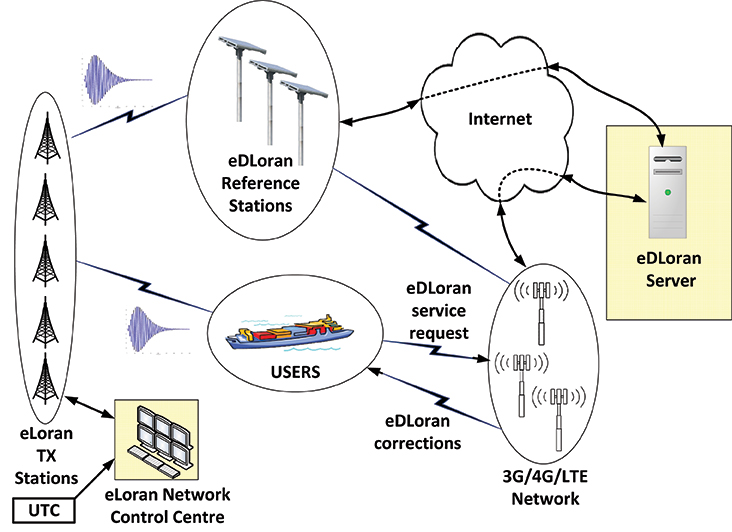
Instead of using the Eurofix channel, eDLoran uses the public Global System for Mobile (GSM) network to send the differential corrections to users. eDLoran receivers therefore contain a simple modem for connection to the GSM network. The eDLoran reference stations are also connected to the Internet, which may be implemented via a cabled access or also via a GSM modem.
Fortunately, today many GSM networks are robust in respect of GPS outages. The eDLoran concept is quite simple and is shown in Figure 5.
Figure 5. Concept of eDLoran. By courtesy of Babcock International Group.
The eDLoran infrastructure is not connected with any Loran transmitter station and operates completely autonomously. An eDLoran reference station is connected to a central eDLoran server by its connection to the Internet.
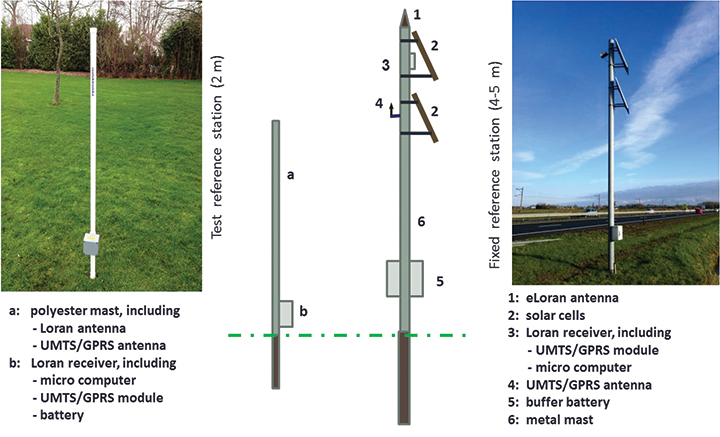
The measured positions of these reference receivers are processed in the eDLoran server, which returns the resulting correction data to the user, also via the Internet. Data latency will be not more than 2 seconds. The rover receiver starts the entire process by sending the raw position to the server, which will then return the optimal ASF database for that particular area. Corrections can be calculated by using data from multiple reference stations. Reference stations for eDLoran are small and consume not more than 10 Watts. Two types of reference stations are under development. A portable simple battery-powered version, not larger than 2 meters, can operate for 8 hours. This version is meant to do interference analysis on selected candidate locations. For a permanent installation, a continuously operating solar-powered unit is also under development. See Figure 6.
Figure 6. Concepts of a mini reference station (left) and a permanent eDLoran reference station.
It has been mentioned that measuring accurately the departure and arrival times of Loran pulses is difficult. It is however needed in order to work out the ASF data on the pseudorange measurement for each Loran station in view. Therefore, a DLoran ASF measurement receiver concept uses Rb clocks and is relatively large and power-hungry. With eDLoran, position offsets due to ASF effects are measured and an eDLoran reference server outputs position- instead of pseudorange-corrections. Measuring positions is much simpler and more accurate and can be done with standard miniature low-power eLoran receivers. No GPS-disciplined Rb clock is needed, and total costs are significantly lower. The gain in accuracy of this simpler ASF measurement receiver together with the very low data latency is one of the reasons that the resulting eDLoran position accuracy is now approximately 5 meters instead of 10 meters with DLoran.
eDLoran Results
We conducted real-life static and dynamic tests to demonstrate the capabilities of this new concept. The static tests were done in post-processing with logged data from Hook of Holland and at Reelektronika, about 40 kilometers to the east. Only standard eLoran receivers, mostly equipped with E-field antennae, were used, and no atomic clocks were applied. At Reelektronika ,we used two 2-meter mini-reference stations, while in Hook of Holland the Loran antenna was mounted on top of the 30-meter lighthouse. Dynamic tests were done on board of the MS Polaris, the new pilot-station vessel of the Dutch Pilots’ Corporation.
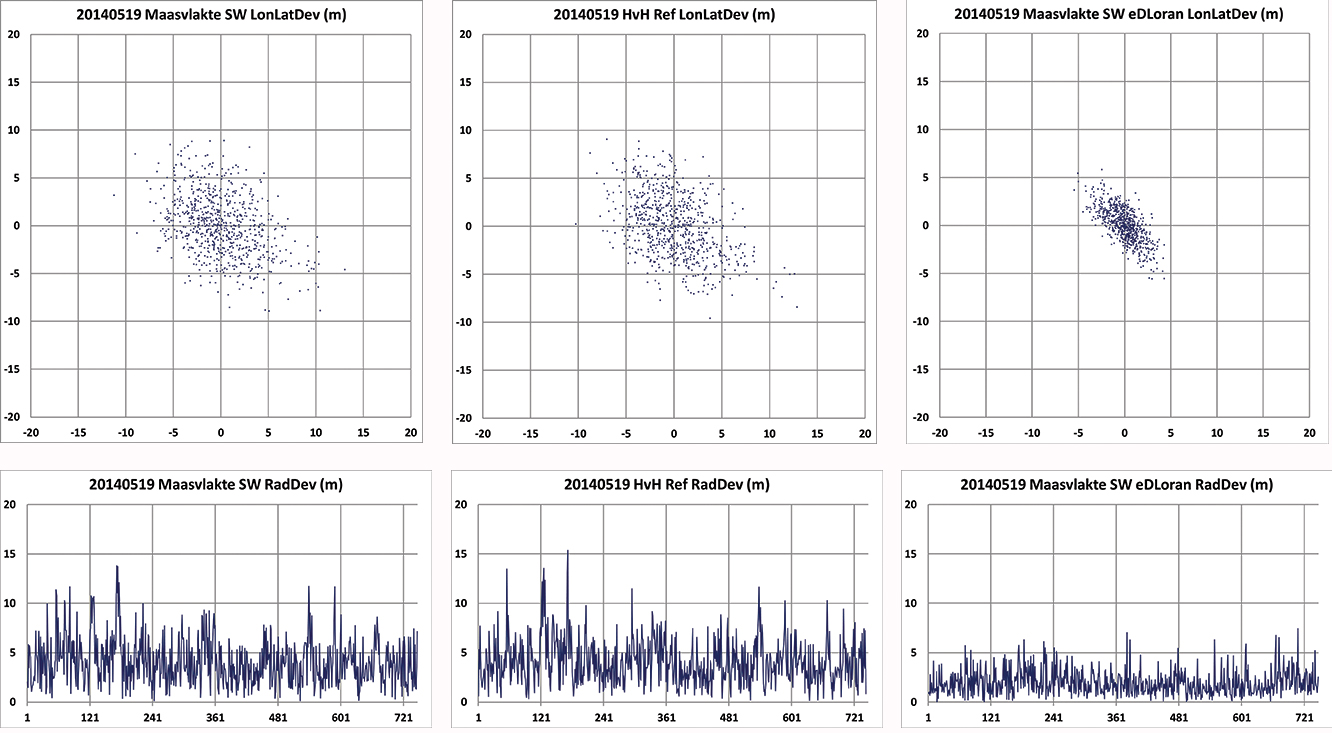
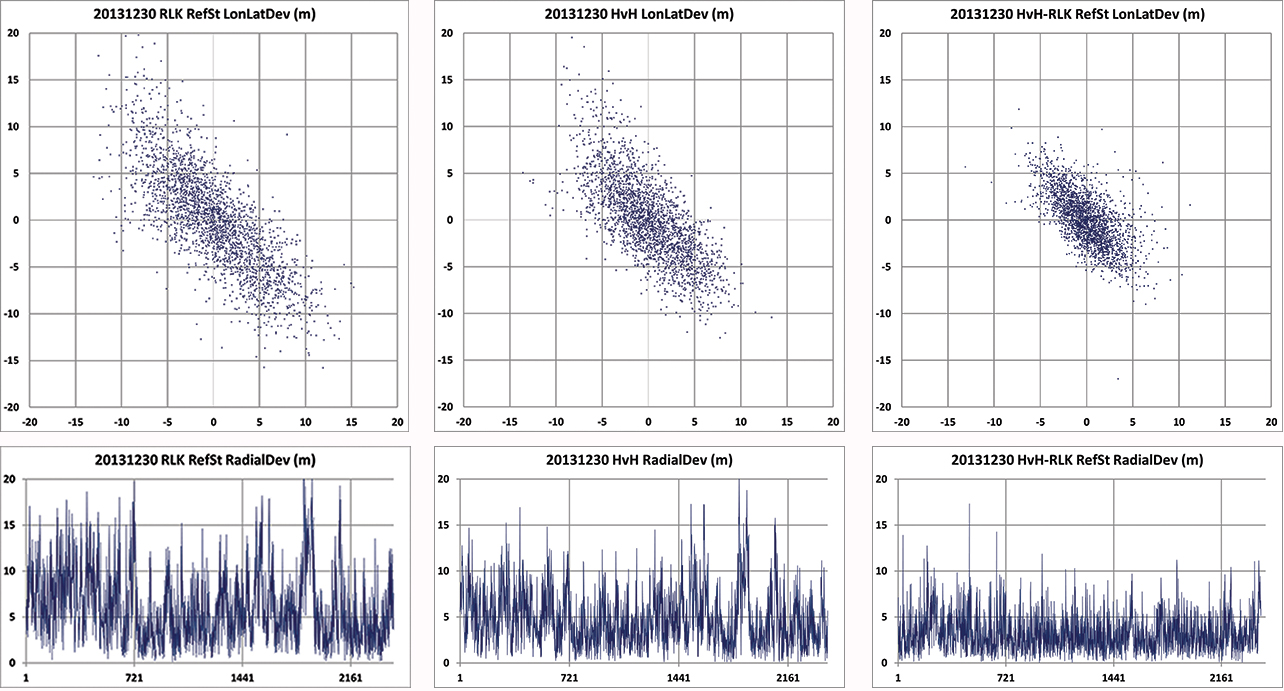
Static Tests. To give a realistic image of the resulting errors of eDLoran, the scatter plots in Figures 7 and 8 are depicted in the position domain. The radial errors are shown in the time domain where the horizontal axis gives the 5-second epochs. The left and the middle plot show the results of the rover and the reference receiver, respectively. The eDLoran plots on the right depict interesting results, as those variations in ASF are largely cancelled while the scattering is smaller than that of the measurements at the rover and the reference receiver, individually. The scattering at the two locations was apparently partly due to low-frequency disturbances, for example because of the moving phase center of the antenna at Anthorn, or instabilities in the time-control loops in the transmitters.
Figure 7. Position scatter plots in the upper row and radial error plots in the lower row of the user receiver on the Maasvlakte and the reference receiver at Hook of Holland. The right-hand column depicts the results for eDLoran. The two sites are separated by about 11 km. The horizontal axis shows the 5-second epochs.Figure 8. Position scatter plots in the upper row and radial error plots in the lower row of the receivers at Reelektronika and Hook of Holland. The right-hand column depicts the results for eDLoran. The two sites are separated by about 40 km. Some eDLoran accuracy degradation around events 250 and 500 may be due to local interference at Reelektronika.
Figure 7 shows the situation where the rover and the reference receiver were separated by 11 kilometers, while Figure 8 depicts the results when the rover receiver was at Reelektronika, more than 40 kilometers from the reference site at Hook of Holland.
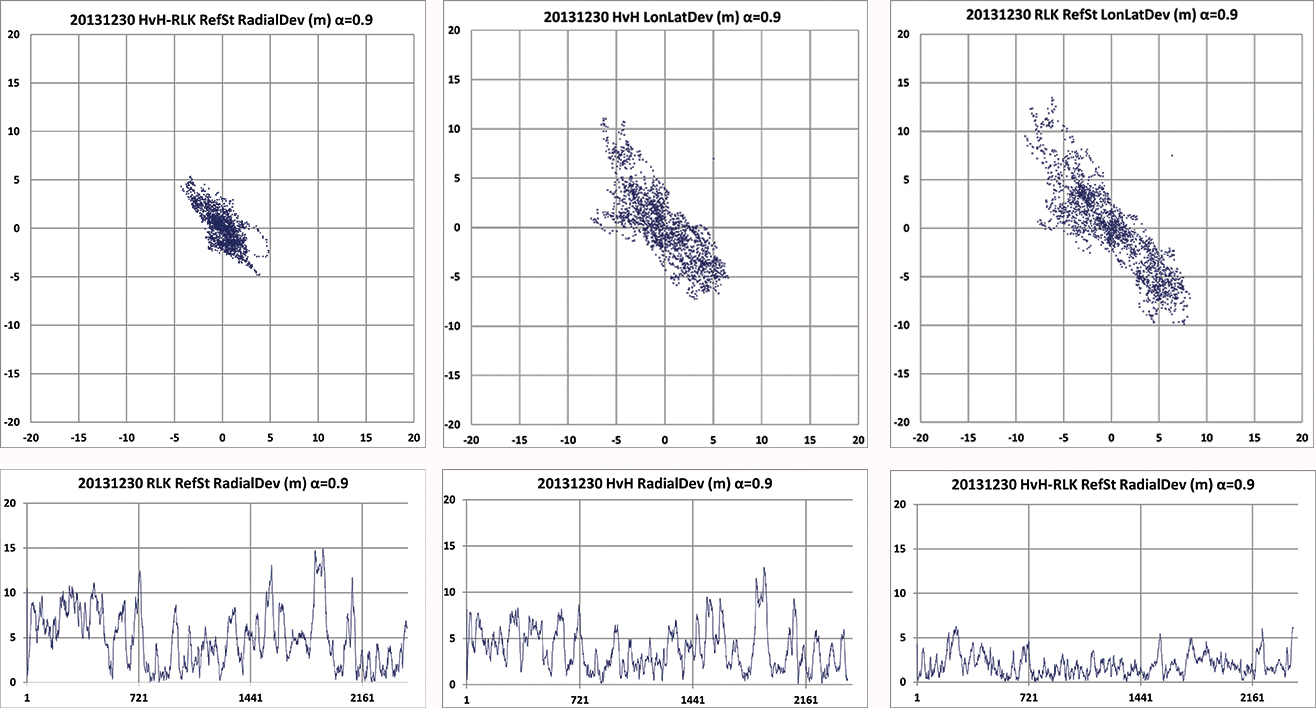
This effect of movement of the phase center of the transmitter antenna is further made visible by applying an alpha-tracker (α = 0.9) on the position data of both receivers, which have an update rate of 5 seconds. The lining-up of dots on some parts of the scatter plots in Figure 9 are believed to be due to swaying of the transmitter antenna. Due to the low-pass filtering, the disturbances now contain fewer high-frequency terms.
Investigating the radial error plots of Figure 9, it is remarkable that the large excursions at event 1880 largely cancelled. The disturbance at event 1880 might be caused by antenna movement at Anthorn, which is nearly perfectly cancelled by eDLoran.
Figure 9. Above plots are based on the same data as in Figure 8 but now after passing through an alpha tracker with α = 0.9. Note the correlation of the radial deviations around events 1800 in both 40 km separated receivers and the strong reduction in scattering.
Investigating the radial error plots of Figure 8 and 9, it is remarkable that the large excursions around epoch 1900 largely cancel, while this is not happening at epoch 250. There, some local interference might have been the cause. The disturbance at event 1900 might be caused by swaying of the Anthorn antenna which is then a common-mode error at both receivers and is therefore strongly reduced in the eDLoran plots.
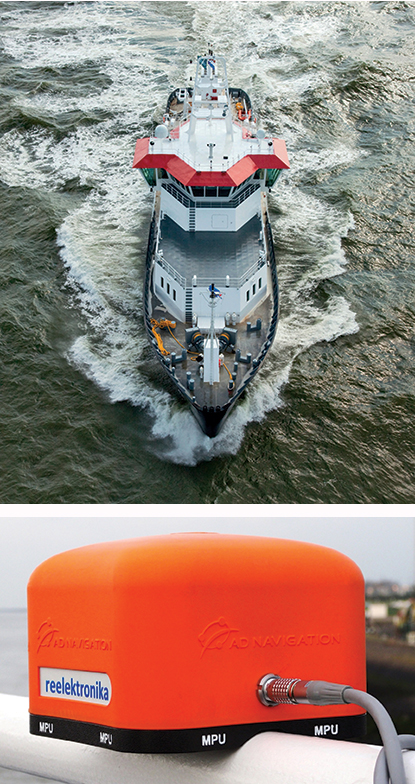
Dynamic Tests. Dynamic testing on board the Polaris at sea (Figure 10) is somewhat more complex to do correctly. The eDLoran receiver was installed about 1 meter above the GPS-RTK reference receiver. In this way, the lever-arm problem of not installing the antennae of the two receivers at the same location was avoided. The next issue was measuring ASF position data, which should happen synchronously with the GPS measurements. Time synchronization can be achieved by using simple GPS receivers at both Loran receivers. Some months later, the eDLoran concept was tested by using the stored AFS data and using a Reelektronika eDLoran receiver as a portable pilot unit (PPU) which looks identical to the GPS-based units the Rotterdam pilots use, manufactured by AD Navigation in Norway.
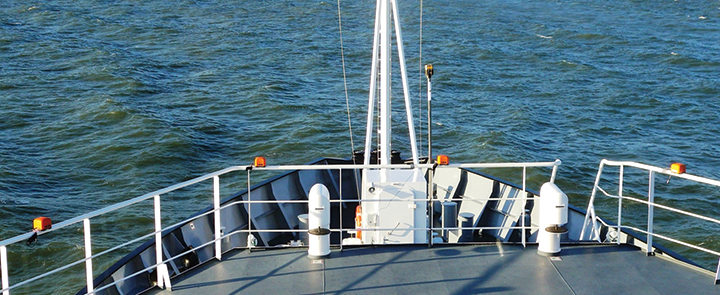
Figure 10. Top right, the Pilot Station Vessel MS Polaris (80 meters) used to test eDLoran (photo copyright Loodswezen). Below is a complete eDLoran receiver with a ‘life-line’ connected to avoid losing the receiver by accident and to allow charging the internal batteries.Figure 11. Five test antennae on the MS Polaris. From left to right the ADNav Master Processing Unit, the ADNav Heading Unit, the ADNav Position Unit with the Reelektronika eDLoran receiver 1 meter above it and, finally, a second Reelektronika eDLoran receiver.
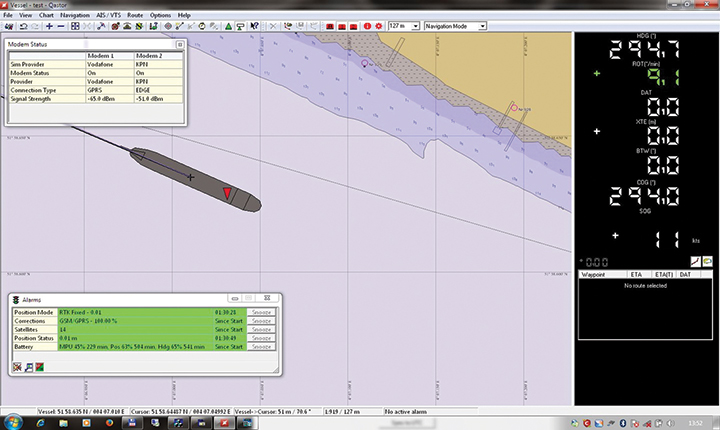
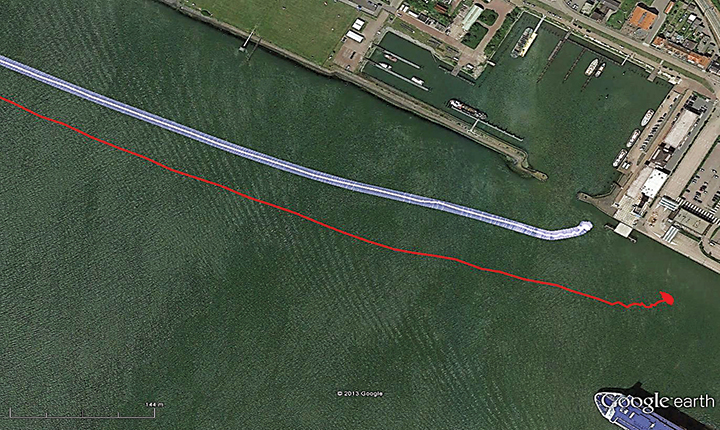
The results have been demonstrated to the harbor authorities in real-time on the laptop of the pilots on which the GPS-RTK and the eDLoran position were simultaneously shown. See Figure 12, where the large gray ship model represents the position and heading derived from GPS-RTK. The width of the ship model is 10 meters. The red triangle gives the eDLoran position; it remains within the borders of the ship symbol. For further demonstration purposes, the logged GPS-RTK data could also be plotted on a Google Earth map (Figure 13). The track was widened to 10 meters, as the accuracy requirements are 5 meters on either side of the track. The raw eLoran track is also shown, as well as the final white eDLoran track of unfiltered raw eDLoran data, which stays well within the 5-meter boundaries.
Figure 12. The large ship symbol (grey) is derived from the GPS-RTK receiver of the Rotterdam pilots. The width of the ship symbol is 10 meters and the speed-over-ground was 11 kts. The red triangle is generated by the eDLoran receiver and remains between the required ± 5 meter limits for eDLoran.Figure 13. The red track is based on raw eLoran data without any corrections. The transparent blue line is made by GPS-RTK and is widened to 10 meters giving the required ± 5 meter limits of eDLoran. The white line is output from the eDLoran receiver which stays within the borders of the 10 meter wide transparent blue line.
During the sea trials, the eDLoran receiver was connected to the eDLoran server on land via a miniature GSM modem to the Internet. All differential data were read via this mobile link. The required data bandwidth is very low, approximately 150 bps per ship (client).
Conclusions
The outcome of this research opens some new and quite surprising possibilities for multiple applications:
eDLoran offers the best possible eLoran accuracy, as it does not suffer from unstable transmitter antennas, sub-optimal timing control of the transmitter station, and differential data latency.
There is no need to replace older Loran-C stations with eLoran transmitters; this potentially would save large amounts of money. Further savings may be obtained by containerizing the transmitter and operating the stations unmanned.
Installing eDLoran reference stations is fast, simple, and very cost-effective.
The Eurofix Loran Data Channel can be freed from a relatively large stream of DLoran data, which leaves the full data bandwidth available for UTC and short-message services over very large areas.
As there is no data channel bandwidth limitation, multiple reference stations can be installed, offering increased reliability and making the system more robust to terrorism and lightning damage.
Single or multiple eDLoran servers can be installed in a protected area. There is hardly a practical limit to the number of differential reference stations to serve.
The server selects the most optimal differential data based on the raw position of the user (client) and the available reference stations.
As there is no need for any Loran data channel, eDLoran can be installed in all locations where Loran or Chayka coverage and access to the Internet are available. Required data bandwidth is approximately 150 bps per user.
Standard eLoran receivers used on controlled trajectories (for example, pilots and ferries) collect position data when accurate DGNSS is available. The collected GNSS and eLoran data can be uploaded to the server to further refine the ASF data base. It is basically a self-learning system.
All eDLoran reference stations monitor the eLoran and GNSS positions to offer alarm services in case of GNSS jamming or spoofing.
Acknowledgments We are very grateful for the near-endless hospitality of the Rotterdam Pilots and especially the crew of the MS Polaris and the MS Markab. Without their help, we would not have obtained the eDLoran results presented here. During the days at sea, we learned how much experience and professionalism is needed to bring those extremely large vessels safely in the harbor of Rotterdam.
We thank Martin Rumens and Dave Kelleher of Babcock International Group for their valued comments and diagrams.
DURK VAN WILLIGEN is a retired professor of electronic systems for navigation at the Delft University of Technology. He is founder and president of Reelektronika B.V., and started the development of Eurofix in 1985. He received the Thurlow Navigation Award of the Institute of Navigation (U.S.) and the Gold Medal of the Royal Institute of Navigation (UK).
RENÉ KELLENBACH graduated from Delft University of Technology in electrical engineering. After joining Reelektronika as a systems engineer, he has been involved in designing hardware and software for radionavigation and radar systems.
CEES DEKKER graduated from the Delft University of Technology in electrical engineering. He worked previously at Philips Research Labs and now assists Reelektronika B.V. with the development of Loran systems and GPS-related projects, and information systems.
WIM VAN BUUREN is a licensed maritime pilot in Rotterdam who took the initiative to develop a backup positioning system for the approaches to Rotterdam. He has been involved in the design and development of the hardware and software of Portable Pilot Units on a national and European level since 2000.
Juniper Systems and Futura Systems have partnered to provide enterprise utility GIS solutions for the electric and utilities industries. This August, Futura Systems will be launching at its user conference a new pole-staking application called GPSStaker.
Staking, or line design, is performed when new locations need to be added to an existing electric line. It involves mapping a new utility pole run, ensuring that the distance between each pole is up to code and geolocated, and then recording the GPS coordinates of where each pole should be placed. GPSStaker was optimized for Juniper Systems’ Archer 2 rugged handheld, and works with Esri ArcMap.
Using GPSStaker, stakers — or field engineers — can GPS-stake a job on the Archer 2 using ArcPad 10. The data is then automatically synced back into a main database.
“The people in the field want lighter hardware and more efficient staking processes,” said Doug Malinowski, CIO of Futura Systems. “With Futura GPSStaker and the Archer 2, we’ve designed a promising solution that combines the accuracy they need with the design quality they want.”
Registration is open for Trimble’s International User Conference, Trimble Dimensions, being held November 3-5 at the Mirage and the Treasure Island Hotels in Las Vegas. The conference addresses innovations in agriculture, construction, civil infrastructure, engineering, government, mapping, natural resources, surveying, telecommunications, transportation, logistics and utilities.
Trimble Dimensions provides insight into how information technology can transform the way professionals work by using integrated workflows to increase productivity, the company said. Participants can hear how industry colleagues use Trimble’s end-to-end technology to transform data into intelligent, usable information. Attendees will see first-hand how new tools, processes and ideas can help make a positive impact on their business.
Throughout the conference, attendees will have a variety of opportunities to network with key industry players, nurture existing business relationships, build partnerships, and discover how to overcome challenges in today’s competitive business environment.
Highlights include more than 400 educational sessions, including both on-site and off-site immersive training, more than 30 specialized tracks to advance career objectives with many sessions qualifying for Professional Development Hour (PDH) hours, and on-site product demonstrations.
Because of overwhelming interest in the Pegasus:Two Mobile Mapping Contest, the Leica Geosystems Mobile Mapping team has announced an extension of the contest deadline. Entrants now have until August 31, 2014, to submit their detailed proposals and project timelines.
“We are very excited about the interest shown in the Pegasus:Two mobile mapping solution and the resulting enquiries into the contest,” says Stuart Woods, project manager at Leica Geosystems. “Extending the contest deadline provides potential entrants with more time to create and prepare their entries. There are many fantastic ideas developing throughout the world and we’re extremely curious to learn about them.”
The winner of this contest, who will receive free use of a Leica Geosystems’ Pegasus:Two mobile mapping system for six months plus $10,000 USD to spend on the project, will be announced on September 8.
Trimble showcased today two concept apps running on the latest tablet platform of Google’s Project Tango program, an initiative to give mobile devices a human-scale understanding of space and motion. The Trimble concept applications, SketchUp Scan and Trimble Through The Wall, demonstrate potential new ways construction professionals could use their Google tablets for greater efficiency and insight on the job in the future.
Trimble’s SketchUp Scan allows Tango users to create as-built SketchUp models of rooms using a simple scanning process.
Using depth sensors on the Tango device, SketchUp Scan enables users to quickly capture a room, apartment or entire floor in 3D and automatically create an editable model. This model can be shared by email or on a variety of social networks, including Google+, Facebook and Twitter. The model also can be uploaded from the Tango device to the 3D Warehouse, Trimble’s platform for posting and sharing 3D models.
“Many 3D applications for smartphones and tablets attempt to capture the full scope of a room, but SketchUp Scan has the unique ability to create an editable 3D SketchUp model,” said Omar-Pierre Soubra, director of Collaboration at Trimble. “Having the ability to edit the 3D model of the space right after the image capture enables users to add features—from windows and doors, to furniture, office equipment or nearly anything else—using millions of 3D models available in the 3D Warehouse.”
Trimble’s Through the Wall application gives building operators the ability to see what’s behind the wall.
Trimble Through The Wall leverages the tracking capabilities of Tango devices to reveal what is located inside walls and other structures. Using data from Computer-Aided Design (CAD) or 3D Building Information Modeling (BIM) software, such as Tekla Structures, Trimble Through The Wall can display and overlay pipes, electrical wires and heating, ventilation and air conditioning (HVAC) infrastructure on top of walls, at their correct location.
“Trimble’s leadership in technologies for building design, construction and renovation—as well as our portfolio of positioning, modeling and visualization software—made it only natural for us to develop a Tango concept application that tracks and displays what is behind a wall,” said Bryn Fosburgh, vice president responsible for Trimble’s Construction Technology Divisions. “Since Tango devices are designed to be aware of their environment and location, they provide an excellent complement to our strategy of making construction more efficient and transparent.”
SketchUp Scan and Trimble Through The Wall are concept applications running on the Project Tango Tablet development kits. These development kits are provided by Google only to professional developers, providing a “sandbox” in which developers can experiment with various concept applications. The final functionality of Trimble’s concept applications are still under design.
Following the first official day of summer, many areas in the United States are approaching their highest temperatures for the year. To give people a better idea of the warmest time of year for their area, the National Climatic Data Center (NCDC) has created a new “Warmest Day of the Year” map for the contiguous United States.
The map is derived from the 1981–2010 U.S. Climate Normals, NCDC’s 30-year averages of climatological variables including the average high temperature for every day. From these values scientists can identify which day of the year, on average, has the highest maximum temperature, referred to here as the “warmest day.”
Although the amount of solar radiation reaching the Earth peaked at the summer solstice on June 21 in the Northern Hemisphere, temperatures for most of the United States tend to keep increasing into July. The temperature increase after the solstice occurs because the rate of heat input from the sun during the day continues to be greater than the cooling at night for several weeks, until temperatures start to descend in late July and early August.
But, this isn’t the case everywhere. The “Warmest Day of the Year” map shows just how variable the climate of the United States can be. For instance, the June values in New Mexico and Arizona reflect the North American Monsoon, a period of increased rainfall affecting the Southwest United States. Because these areas tend to be cloudier and wetter from July through September, the temperature is highest on average in June. Similarly, the persistence of the marine layer along the Pacific Coast leads to cool temperatures in early summer with the warmest days on average later in the season.
Temperature Normals are important indicators that are used in forecasting and monitoring by many U.S. economic sectors. Knowing the probability of high temperatures can help energy companies to prepare for rising electricity demand and farmers to monitor heat-sensitive crops. They are also useful planning tools for the healthcare, construction, and tourism industries. You may want to check the Normals before planning your next event or vacation.
While the map shows warmest days of the year on average throughout the United States, this year’s actual conditions may vary widely based on weather and climate patterns. For prediction of your actual local daily temperature, and to see how it matches up with the Climate Normals, check out a local forecast at Weather.gov.