I’ve been on a roll the past two weeks regarding intelligent transportation after my visit at the 2011 ITS World Conference in Orlando. Please allow me to touch on it once more and then morph into a highly related topic, sensor fusion.
The 2011 European Satellite Navigation Competition announced the winners this week. The Special Topic Prize, the USA Regional Award, and the overall Galileo Master were awarded to MVS, LLC, from San Francisco, California, with its True-3D technology for its augmented reality and new navigation guidance system.
Watch this 30-second Youtube video that shows how the the Virtual Cable application of the True-3D technology is implemented in a car navigation system.
MVS, LLC’s Virtual Cable technology
Courtesy of MVS, LLC. Components not drawn to scale
Following is an eight-second demonstration of how the Virtual Cable technology could be used to assist navigating in the dark.
True-3D and Virtual Cable are creative examples of new software/hardware being developed to take advantage of existing geospatial data to provide an innovative solution. There is a lot of upside to augmented reality over the next few years that will allow people to visualize geospatial data in ways you’ve never seen. I’ve used the example before of being able to visualize underground infrastructure such as utilities (gas, water, electric). Imagine being able to carry a tablet computer in the field, being able to hold the table flush to the ground and see underground infrastructure on the tablet screen.
Given the above, do you think that geospatial software tools or data are the bottleneck in geospatial apps of the future?
I think the bottleneck is data. Tools have always seemed to outpace data because, generally speaking, acquiring data has always been an ongoing labor-intensive activity moreso than software development. For example, think about GPS navigators in automobiles. There are hundreds of manufacturers of GPS navigator devices in the world and hundreds of GPS navigator software product makers in the world (the software that directs you where to turn, etc.), but there are only two major map database suppliers in the world (TomTom/TeleAtlas and Nokia/Navteq). Yes, there other very small competitors in the map database market, but these two dominate the market. Why is that? It’s just a tough task to create, manage and update the massive database of road detail and points of interest that change on an annual, if not monthly, basis.
The geospatial bottleneck is further exposed when one considers indoor navigation (malls, office buildings, universities, etc.). Even though Building Information Management (BIM) has lagged in GIS, the bottleneck hasn’t been the lack of BIM geospatial data but rather the lack of a positioning sensors that allow reasonably accurate positioning indoors. With GPS, we have fairly good positioning with our planes, trains and automobiles (and mobile phones), and that’s driven the development of extensive map databases of outdoor features. That is going to change. There is a serious effort by many companies, and they seem to be making progress.
Just this week, CSR (SiRF) introduced the SiRFusion Platform that is designed to fuse “multiple location technologies to make accurate indoor location and navigation a reality.”
“The SiRFusion platform and SiRFstarV location architecture are the latest development to promote our vision of enhancing the mainstream consumer experience with a variety of location-enabled services and applications indoors and outdoors, seamlessly,” said Kanwar Chadha, Chief Marketing Officer for CSR and founder of SiRF. “With today’s announcements, CSR is demonstrating its leadership in taking location to the next level with our SiRFusion platform and SiRFstarV architecture for mobile devices, as well as with our SiRFprimaII SoC for in-dash and on-dash automotive infotainment products.”
The CSR announcement reads “Instead of relying solely on GPS to determine position, the SiRFstarV architecture gathers real-time information from GPS, Galileo, Glonass and Compass satellites, multiple radio systems, such as Wi-Fi and cellular, and multiple MEMS sensors, like accelerometers, gyros and compasses. It then combines this real-time information with ephemeris data, mapping, cellular base station and Wi-Fi access point location data and other cloud-based aiding information using the SiRFusion platform.”
Another promising technology is one being promoted by Locata Corp from Australia. Touting its technology as “GPS 2.0” in recent advertisements, the Locata technology doesn’t require line of sight to GPS satellites. In fact, it doesn’t require GPS satellites at all. It uses a ground-based constellation of transceivers so users can set up their own constellation of “satellites” in their office building, warehouse, university, or other GPS-unfriendly environment and enjoy centimeter-level accuracy.
Locata Technology is used by Leica Geosystems in GPS unfriendly environments.
By Yuri Urlichich, Valery Subbotin, Grigory Stupak, Vyacheslav Dvorkin, Alexander Povalyaev, Sergey Karutin, and Rudolf Bakitko, Russian Space Systems
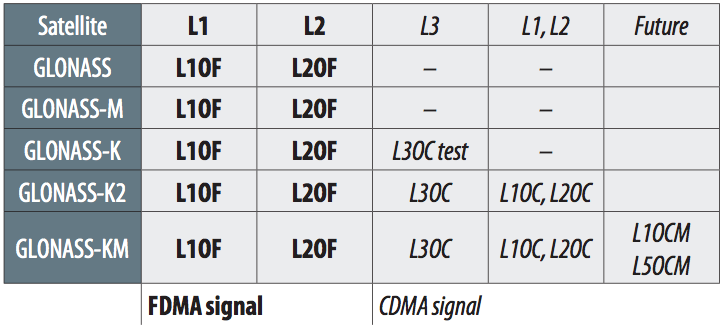
The GLONASS-K satellite, transmitting a CDMA signal in the L3 band, inaugurates a new era of radionavigation signals for both the Russian system and for international GNSS interoperability. As demand for high-precision services through dual- or triple-frequency user equipment increases, GLONASS will come to the forefront. The 2014 GLONASS-K2 satellite will have an FDMA signal in the L1 and L2 bands and CDMA signals in L1, L2, and L3. The overall constellation update will be completed in 2021. Another 2014 launch will fill the Russian SBAS orbit constellation with three geostationary space vehicles.
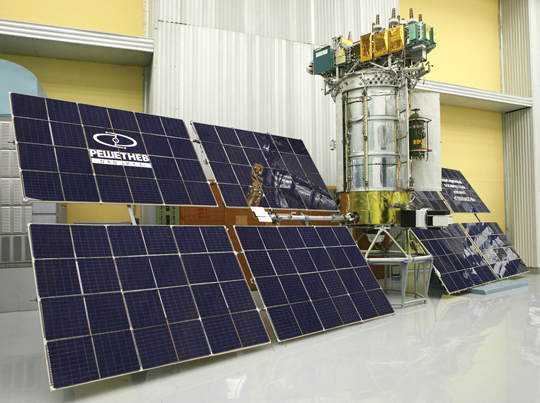
GLONASS-M satellite. (Photos courtesy of Roscosmos and Information Satellite Systems Reshetnev Company)GLONASS-K satellite. (Photos courtesy of Roscosmos and Information Satellite Systems Reshetnev Company).
With the February launch of the first GLONASS-K satellite, and its transmission of a new CDMA signal in the L3 band, a new era of radionavigation signals has begun: international GNSS interoperability. As we have seen rapidly growing demand for high-precision services provided with dual- or triple-frequency user equipment, introduction of new GLONASS signals in the L1 and L2 bands will come next. The first launch of GLONASS-K2 satellite, with FDMA signals in L1 and L2 bands and CDMA signals in L1, L2, and L3, is planned in 2014. A complete update of the full orbiting constellation will conclude in 2021.
One satellite per year of the Luch family will be launched into orbit over the next three years, and by 2014 the System of Differential Correction and Monitoring (SDCM) constellation will be in operation with three geostationary space vehicles.
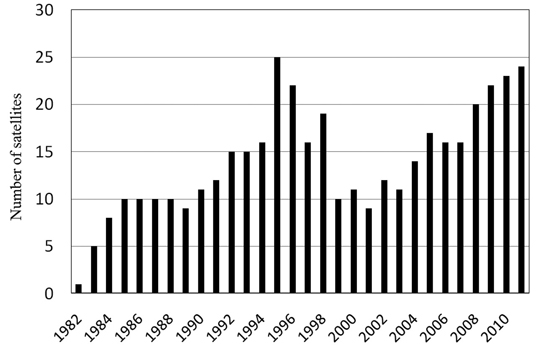
Constellation Status. In spite of the unsuccessful launch of three satellites at the end of 2010, currently GLONASS is fully deployed again with 23 satellites set healthy to the user, and more in orbiting reserve. Figure 1 shows the evolution of the constellation since its first launch in 1982. The number of satellites used for service provision is calculated at the end of each year. In order to avoid dramatic situation in 1996–2000, when satellite numbers fell, the system now carries both an on-orbit and a ground reserve of space vehciles. This will help avoid service and availability gaps that could be created by satellite failure.
Figure 1. GLONASS constellation development.
GLONASS-M. The current constellation consists largely of GLONASS-M satellites, the first generation of GLONASS space vehicles, with characteristics of:
FDMA сivil signals in L1 (1.6 GHz) and L2 (1.25 GHz) bands, with increased transmitting power;
intersatellite link both inside one plane and between planes with ranging and communication capabilities;
relative daily frequency stability of the cesium onboard synchronizer of 5 × 10–14;
increased orientation accuracy of solar panels;
guaranteed active lifetime of seven years.
New satellites can be launched into orbit either as a part of multiple launch consisting of three satellites on the launch vehicle Proton with booster Breeze-M from the Baikonur spaceport, or on the launch vehicle Soyuz with Fregat booster from Plesetsk.
GLONASS-M is the last GLONASS satellite with its payload in a sealed container. This container provides the high-temperature stability for the onboard clocks. The GLONASS-M power-supply system includes nickel-hydrogen batteries and silicon solar arrays of 30 square meters, providing 1,400 W for onboard systems.
GLONASS-K. Currently, on-orbit flight tests of the new GLONASS-K satellite (OPENING PHOTO) are under way. The first satellite in the GLONASS-K family, it has a payload located in open space and an active lifespan of 10 years. The forming and transmitting functions of navigation and inter-satellite signals are united in one module in order to increase synchronization accuracy. Besides broadcasting radionavigation signals in three bands, this satellite carries the transponder of the search-and-rescue system COSPAS-SARSAT. The overall weight of the satellite is less than 1,000 kilograms, and about 30 percent of this is the payload weight. The power-supply system generates about two times more energy than the same GLONASS-M system.
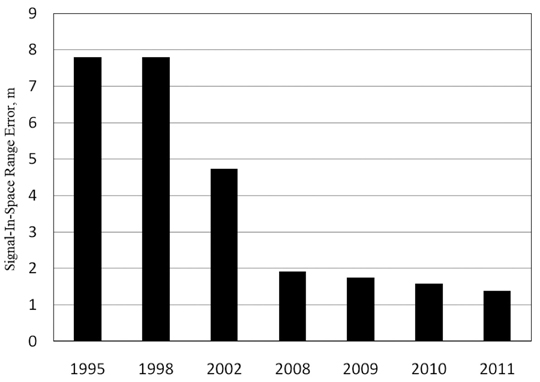
At the same time, ground-control facilities modernization and implementation of new inter-satellite measurement technology has enabled system operators to effectively increase the accuracy of broadcast ephemeris and clocks. Currently the signal-in-space range error (SISRE) equals 1.37 m (Figure 2). Further increases in accuracy will be carried out through the modernization of satellite-control technologies and development of a global network of measuring tools.
Since February 2011, GLONASS-K has been transmitting the first CDMA navigation signal in L3 band coherently with existing L1 and L2 signals. This was a first step in a new navigation signal development strategy. Future steps of GLONASS CDMA navigation signal development will focus on L1 and L2 bands. In order to design user-friendly signals, the following assumptions have been taken into account:
GLONASS coherent FDMA and CDMA navigation signal sets should satisfy a wide range of user requirements, from ordinary navigation to high-precision applications;
Signals should be within the bands allocated for GLONASS by the International Telecommunications Union (ITU);
Low spectral density of signal power in radio astronomical band of 1610.6-1613.8 MHz;
Compatibility with other GNSSs;
Interoperability with other GNSSs.
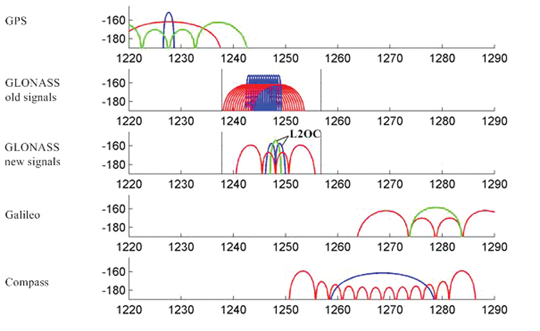
The plans for signal development with GLONASS code division are presented in Table 1.
Table 1. FDMA (in bold type) and CDMA (in slant type) signals in current and future GLONASS satellite generations.
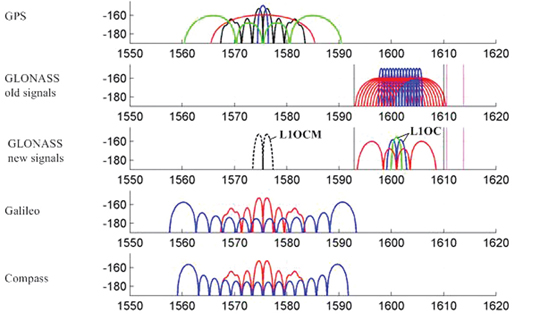
Figures 3–8 show the proposed structures of GLONASS CDMA signals and also the spectrums of these signals in the context of the other GNSS signal spectrums.
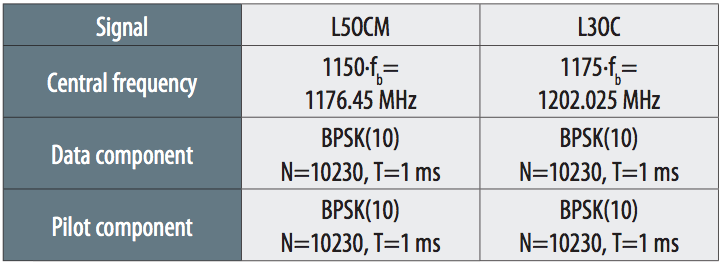
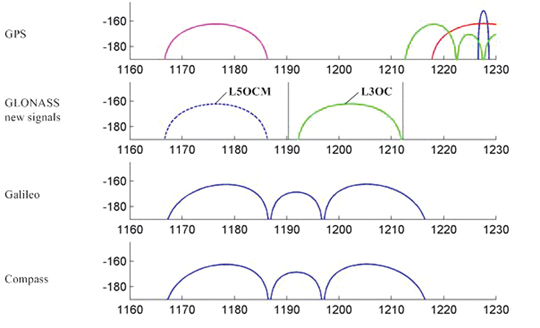
Due to the growing use of GNSS signals in L3/L5 band, the future GLONASS navigation family will include two signals in this band. Table 2 contains some parameters of these new signals in this band.
Table 2.
GLONASS Augmentation Development
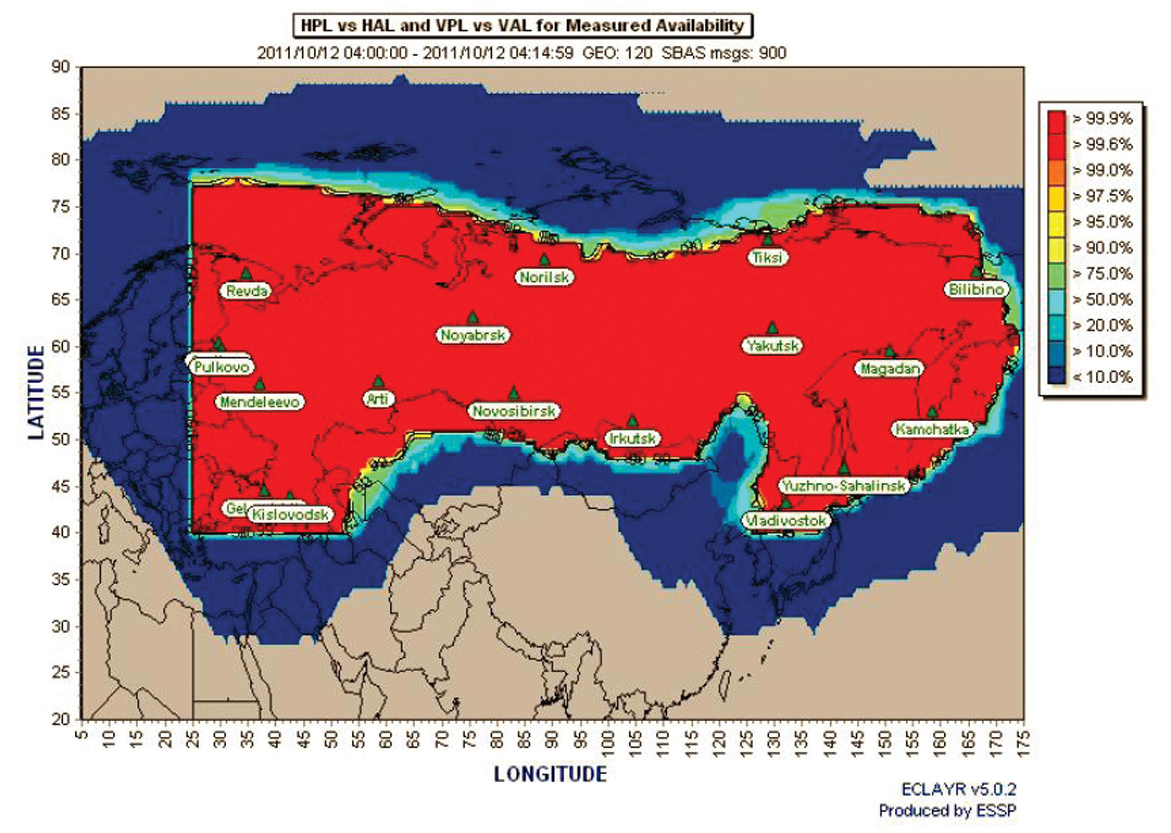
SDCM development is now entering its deployment and completion phase. The network of reference stations is almost completely established. It enables the global integrity monitoring of radio navigation signals of both GLONASS and GPS satellites, gathering raw measurements of pseudorange and carrier phase in L1, L2, and L3/L5 bands. Based on these measurements, the SDCM central processing facility calculates orbits and clock corrections, and formulates SBAS messages. Preliminary results of SDCM service-quality estimation, based on corrections calculated using existing stations network, are shown in Figure 10.
Figure 10. SDCM horizontal protection Level (HPL) versus horizontal alert limit (HAL). Image updated April 16, 2012.
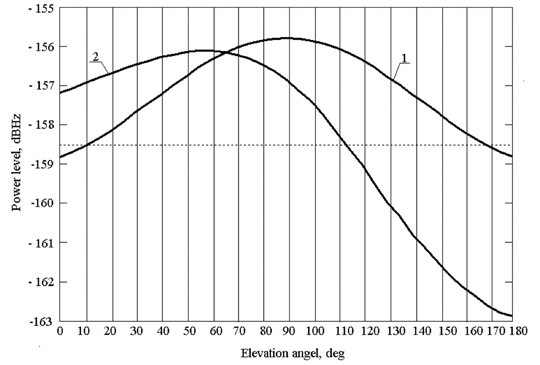
The last quarter of 2011 will see the launch of space vehicle (SV) Luch-5А, carrying an SDCM transponder. Initially, this SV will be put for testing on geostationary orbit at 55 degrees East, and then will be relocated to 16 degrees West. The onboard transponder will broadcast radio signals on 1575.42 MHz. Taking into account that the main SDCM coverage area is in the northern hemisphere, the SV antenna beam will be deviated from the Equator by 7 degrees to the north.
Due to this deviation of the gain pattern from traditional orientation to the Equator, the Earth surface power distribution diagram is changed. Figure 11 presents two variants. The first one is a case in which the transmission antenna is directed on the Equator (curve 1) and the second one is a case when antenna is deviated by 7 degrees to the north from equator (curve 2). In the latter case, we obtain an increase of signal strength to the users for which this SV is under small elevation angles, that is, for the users in the northern areas of the Russian Federation.
Figure 11. SDCM minimum user-received signal levels: (1) antenna pointing to the equator; (2) antenna deviated by 7º to the north.
Further SDCM development is predicated upon the launch of two Luch satellites, in the first half of 2012 and in 2013, respectively. Also in the plans is the design of a new Luch-4 satellite with dual-frequency navigation transponder, for a 2014 launch, completing the satellite-based augmentation system.
Conclusion
GLONASS system replenishment has almost finished, and the system enters a new historical phase. New CDMA navigation signals and deployment of a national SBAS system will provide not only a significant quality improvement of GLONASS navigation services, but also will create the favorable prerequisite for the development of applied navigation technologies in the territory of the Russian Federation, and also in Europe, the Middle East, and the Far East.
Yuri Urlichich is a general director-general designer of Joint Stock Company (JSC) Russian Space Systems, GLONASS general designer, doctor of science, professor, author of more than 150 papers and holder of 20 patents.
Valery Subbotin is a first deputy general director–general designer of JSC Russian Space Systems, and doctor of science. He has been working in the space industry for more than 40 years and has published more than 50 papers.GRigory Stupak is a deputy general director–general designer of JSC Russian Space Systems, deputy general designer of GLONASS, and professor at the Bauman Moscow State Technical University (BMSTU). He has worked in the space industry more than 35 years and has published more than 150 papers.
Vyacheslav Dvorkin is a deputy general designer of JSC Russian Space Systems”and doctor of science. He has been developing GLONASS, GNSS augmentations and user equipment for more than 35 years. He has written 50 papers in the satellite navigation field.
Alexander Povalyaev is a deputy head of division in JSC Russian Space Systems and professor at the Moscow Aviation Institute. He has been developing methods and algorithms for GNSS carrier-phase measurements processing for more than 30 years and has more than 40 papers in satellite navigation field.
Sergey Karutin is deputy head of division in JSC Russian Space Systems and assistant professor at the BMSTU. He has a Ph.D. and has been working on the GLONASS team since 1998, developing GNSS augmentations and user equipment.
Rudolf BAKITKO is a department head in JSC Russian Space Systems and a GLONASS navigation payload designer. Rudolf developed on-board equipment for space vehicles Luna, Mars, Venus, GLONASS, and COSPAS-SARSAT, and has more than 50 papers and 10 patents.
The 21st century today faces and will continue to encounter many new societal challenges, all mutually interdependent: health, environment, agriculture, ageing population, personal security, public and civil protection, safe and efficient transport and mobility, citizen rescue, land management, energy (supply, security, and efficiency), full employment, new consumer services, high-tech industry, business security, connectivity, globalization, intellectual property management and protection.
All these challenges have a common denominator: the economic health of Europe: growth, competitiveness, and job creation. Along these lines, the European Union (EU) created the Europe 2020 strategy for smart, sustainable, and inclusive growth. Its goal is to achieve growth by “developing an economy based on knowledge and innovation, promoting a more resource-efficient, greener, and more competitive economy, fostering a high-employment economy delivering social and territorial cohesion.”
The role of European institutions in the growth process is especially decisive at a time when all organizations struggle to borrow, spend, and invest in the current economic situation. The need to stimulate the economy and to ensure competitiveness and return on investment in Europe is more important than ever. Among the growth-enhancing items identified in the EU2020 strategy, research and development (R&D) and innovation are part of the top priorities: “3 percent of the EU’s gross domestic product (GDP) should be invested in R&D” is one of five top EU targets. The European Commission also put forward the Innovation Union concept initiative “to improve framework conditions and access to finance for research and innovation so as to ensure that innovative ideas can be turned into products and services that create growth and jobs.”
Given EU budgetary restrictions, as stated in the EU2020 strategy, the financial framework must be “devised to maximize impact, ensure efficiency, and EU value-added.” This is why the EU budget must be carefully invested in research and innovation areas that both have strong growth potential and satisfy Europe’s political, societal, and economic interests.
The domain of satellite navigation applications, rapidly becoming a pillar of 21st-century society, offers a splendid opportunity among the most promising ones!
Key GNSS Applications
Transport. Increased safety and efficiency for aviation, maritime and inland waterways, rail, road transport, and more.
Environmental protection. Support to environmental driving, car parking, waste control, low-cost sensors for landscape monitoring, resource monitoring. and land administration through surveying and mapping…
Health. Tracking and tracing of medical goods, assistance to elderly and disabled people.
Mobility. Navigation, road tolling and charging, location-based services, multi-modal transport services…
Security and Safety. Pay-as-you-drive insurance, law enforcement, protection of intellectual property rights, secure asset and personal tracking, unmanned vehicles, integration of GNSS, satellite communications, and global monitoring for environment and security, customs and freight monitoring…
Timing and Networks. Synchronization of smart grids, telecommunications, banking, and digital video broadcast networks…
Public Funding Requirement
EU public funding is necessary for Europe to attain excellence, compete in a global market, and expect future commercial and societal benefits.
GNSS positioning, navigation, and timing technology is fast becoming a mature commodity, but major improvements are still required. Without EU public support, such as the Framework Programs for R&D, GNSS development will continue to follow a purely economic approach from industry, that is, maximizing return on investment rather than seeking to innovate technology. Industries will naturally look to combine commercial off-the-shelf sensors and functions, with minimal effort on R&D, rather than improving GNSS technology’s ability to meet evolving needs.
This approach jeopardizes both European excellence in the GNSS field and the future take-up of European GNSS infrastructure.
Foster Knowledge, Create Jobs. There is a compelling need to foster European knowledge and capability to reach excellence in the GNSS field, in order to maximize competitiveness, growth, and job creation in Europe. The purely commercial approach will continue to place the U.S. GPS as a standard; this constitutes a major risk for Galileo and for the EU economy as a whole, as it would continue to rely on a GNSS service over which it has no control.
Therefore, EU public funding, through such initiatives as framework programs (FPs), competitiveness and innovation programs, and Horizon 2020, is essential to ensure the use of European infrastructures and the generation of benefits for Europe. This will give the means to the EU industry to get a better share of the global GNSS downstream market.
It is a question of business, growth, employment, and return of EU investment in the European GNSS programs. As an example, most non-aviation applications of the European Geostationary Navigation Overlay Service (EGNOS) infrastructure exist solely from the stimulation of FP6 and FP7 projects.
Finally, the cycle of EU public funding — which creates projects that link people not used to working together, to stimulate creativity and foster innovation — also must be underlined. Through these programs, small-to-medium enterprises (SMEs), large companies, academia, and research institutes from EU countries and beyond can meet and work together. To link people and brains and stimulate creativity is a perfect springboard for new ideas and market opportunities.
We emphasize at this point the huge risk of the absence of FP7 GNSS applications R&D budget until 2014 — the dedicated FP7 budget being exhausted due to extensive cuts, leaving only ϵ100 million in the GNSS FP7 budget line, instead of the ϵ350 million granted at the outset. A lack of public support for R&D effort would significantly limit the potential of innovation and growth as well as European ambitions in GNSS.
The European Parliament Resolution of June 7, 2011, on “Transport applications of Global Navigation Satellite Systems: Short- and Medium-term EU Policy” revives hope among European downstream research and innovation actors. Among other things, Parliament calls on the European Commission (EC) “to ensure that the ϵ100 million likely to be underspent in payment appropriation for research within the 7th FP is made available for the development of GNSS applications.”
Applications a Promising Market
GNSS-based positioning/timing technologies and services must be part of the long-term growth priorities of the European Union. As part of the solution to the next generation of challenges, GNSS technology can contribute significantly to all major EU policies.
GNSS applications and services development can bring immediate benefits — creation of new industrial activities and hundreds of thousands of jobs — and enhance daily life and well-being of Europe’s citizens; the core vocation of GNSS applications is fully in line with the Lisbon Treaty.
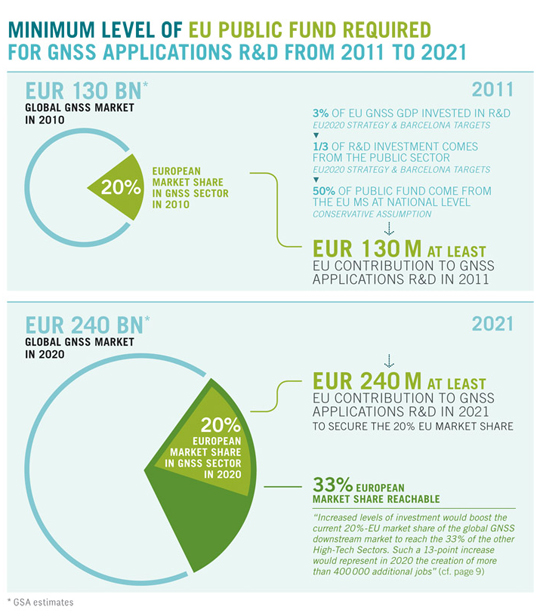
Further, GNSS applications and services constitute one of the most promising sectors for European growth. The global GNSS market amounted to around ϵ130 billion in 2010 and is expected to reach ϵ240 billion by 2020. This corresponds to a sustained growth rate of more than 11 percent per year.
EU public funds invested in GNSS applications R&D would catalyze growth, enabling market development and maximizing the efficiency of EU budget. With only a small part of its budget dedicated to GNSS applications R&D, the EU would see both an important and decisive impact on the GNSS market and a snowball effect, seminating further applications and domains with GNSS technology.
The 2010 FP7 budget for GNSS R&D was ϵ30.5 million. Assuming that EU27 member states made similar contributions at the national level and that two-thirds of GNSS R&D investments come from the private sector, the total EU investment in GNSS applications R&D totalled ϵ180 million in 2010.
Since the EU GDP of GNSS applications and services amounted to around ϵ26 billion in 2010, the rate of GNSS GDP to investment in applications R&D’ corresponds to a factor more than 100. In other words, ϵ1 invested by in GNSS application R&D generates about ϵ100 of revenue.
The Need for Dramatic Increase
As stressed in the EU2020 strategy, “R&D spending in Europe is below 2 percent [of GDP], compared to 2.6 percent in the United States and 3.4 percent in Japan.” The Barcelona EU goals specify that R&D financing should be shared between public (one-third) and private sectors (two-thirds).
In 2011, EU public investment in GNSS applications R&D is expected to be 0.1 percent of EU GNSS GDP — well below the required threshold. If the R&D budget is not restored, this rate will come very close to zero until 2014.
In the Barcelona and Europe 2020 goals, the level of EU contribution to GNSS applications R&D investments can be computed (Figure 1). Ensuring EU benefits would require annual public support to GNSS applications research rising from ϵ100 million in 2011 to ϵ200 million in 2021.
Figure 1. Minimum level of EU public funding required for GNSS applications R&D from 2011 to 2021.
Increased investment would enable Europe to boost its current 20 percent market share to reach the 33 percent share that Europe enjoys in other high-tech sectors. This would mean creation of more than 400,000 new jobs in 2020.
Contrary to the United States, China, and Russia, the EU lacks a large military applications R&D program, which elsewhere helps support industry investments in commercial and civil applications. Given European investments in other sectors and investment of other countries in GNSS application R&D, a level of EU public investment between ϵ100 million and ϵ200 million per year is essential.
Horizon 2020
Galileo Services makes the following recommendations for the EU program Horizon 2020.
GNSS technologies and services.
Support European industry in investing and developing critical technologies, applications, and services based on end-user requirements: security, reliability, robustness, and high performance;
Pursue research to improve GNSS performance, mainly multi-constellation multi-sensor receivers;
Encourage innovative ideas, whatever the domain may be, through very open calls for proposals.
Market penetration and development.
Adequate value-added content (such ashigh-precision or indoor digital maps) to leverage application development;
Market analyses and business cases, with a focus on new uses of GNSS;
Promotion and awareness activities;
Standardization in relevant domains;
A certification process for safety- and security-critical applications;
Demonstrations and pilot projects, focusing on implementation of GNSS solutions tightly integrated in the user workflow, involving all value chain actors;
Use of large European companies — industry locomotives — and SMEs’ innovative capability to penetrate markets and spin off new business opportunities;
International cooperation established by: favoring EU industry interests within bilateral discussions between EU and non-EU countries, involving non-EU partners only if providing opportunities for market penetration beyond EU boundaries or specific skills and/or technology not available in Europe, and setting up adequate intellectual protection rights (IPR) policy.
Other support.
Expectations of significant public-sector funding and regulations will stimulate private GNSS investment. Such tools are widely exploited in America, Russia, and Asia;
Regional and national procurement plans would benefit from coordination at the EU level;
A close dialogue has been established between European institutions and GNSS downstream industry, represented by Galileo Services, in recent years. In this framework, crucial issues such as licensing rules, IPR policy, and international cooperation can be discussed. This initiative must be pursued and even reinforced.
Galileo Services is a non-profit organization founded in 2002 as a major partner for the Galileo program and GNSS application development. Although Galileo is a key area of interest for Galileo Services, the association focuses on all types of PNT systems such as GPS, GLONASS, Galileo, EGNOS, WAAS, and so on. Having merged with OREGIN (the Organization of European GNSS Industry of equipment and services) in 2009, Galileo Services network represents more than 180 member organizations from Europe, North America, and Asia, ranging from SMEs to large companies. Gard Ueland is president of Galileo Services, and Axelle Pomies is its permanent representative.
By Nicolas Couronneau, Peter J. Duffett-Smith, and Alexander Mitelman
Cell-phone users are often more concerned about the speed of positioning than the accuracy, making time-to-first-fix the most important factor in a GNSS mass-market receiver’s perceived performance. However, TTFF is generally difficult to characterize and optimize because of the need to encompass a wide range of environments, including indoors.
One method of characterizing the time-to-first-fix (TTFF) is to measure it directly, using a signal generator and a real receiver. This method avoids the approximations of analytical solutions, but it is usually time consuming and it does not provide much insight into the factors affecting the TTFF since it is gen erally not possible to change the receiver’s architecture. Another approach is to use Monte Carlo simulations and a model of the acquisition process. This approach is more flexible than direct measurement, but again it can take a long time to simulate weak-signal environments.
We have developed a third approach based on analytical methods but regulated by measurements of the signal-to-noise ratio in target environments. Using this approach, one can quickly calculate the probability distribution of the TTFF for different signal strengths and acquisition parameters.
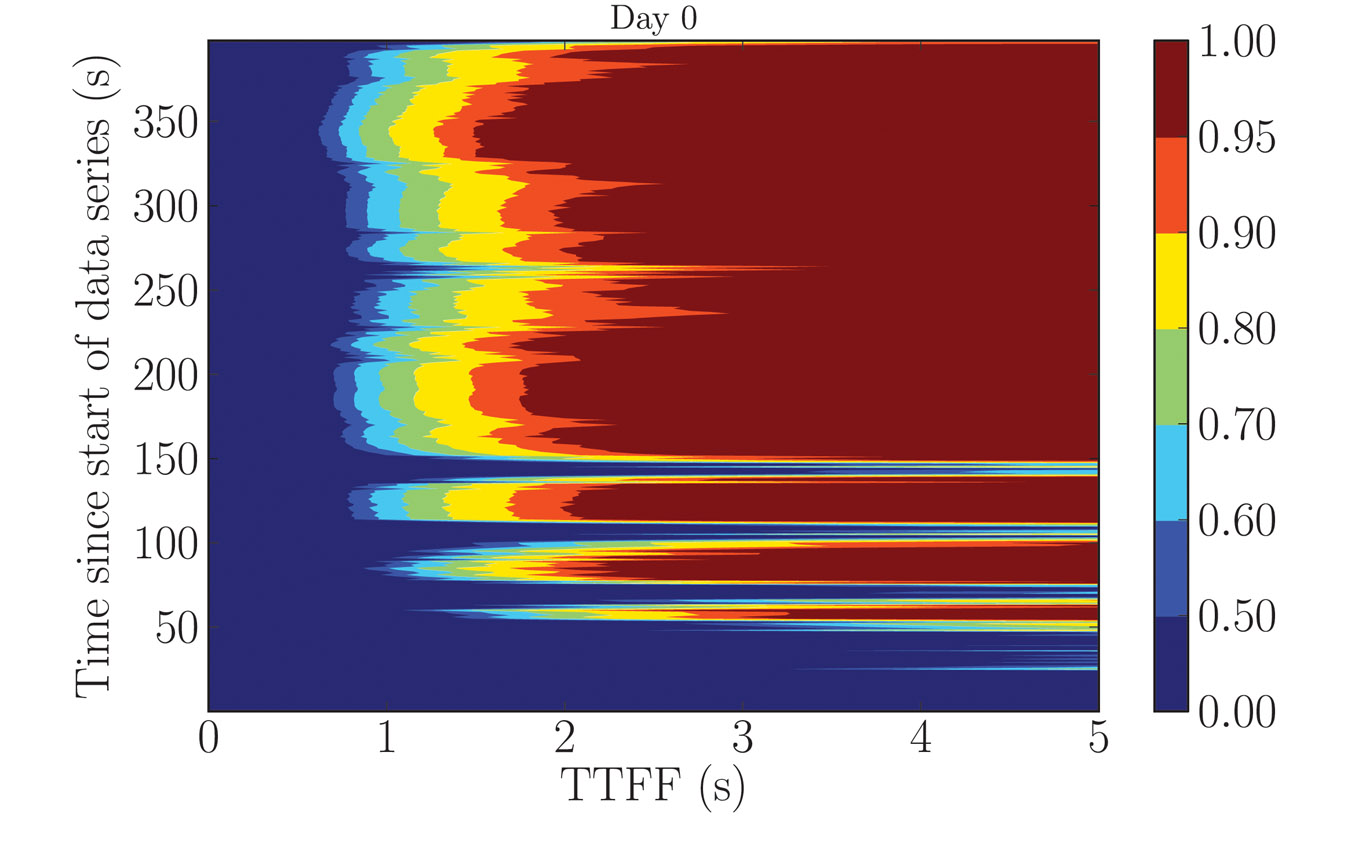
To illustrate this method, we consider a model of an assisted-GPS receiver combined with experimental measurements of the GPS L1 C/A signal taken indoors. The results are presented in Figure 1, where the probability of the TTFF (horizontal axis) is plotted as a function of the time after the beginning of the data series at which the acquisition process started (vertical axis), calculated using a 400-second GPS data series measured indoors. The strength of our approach is that we can quickly calculate the TTFF probability for any given confidence level and it is quite general so that it can be extended to other types of receivers.
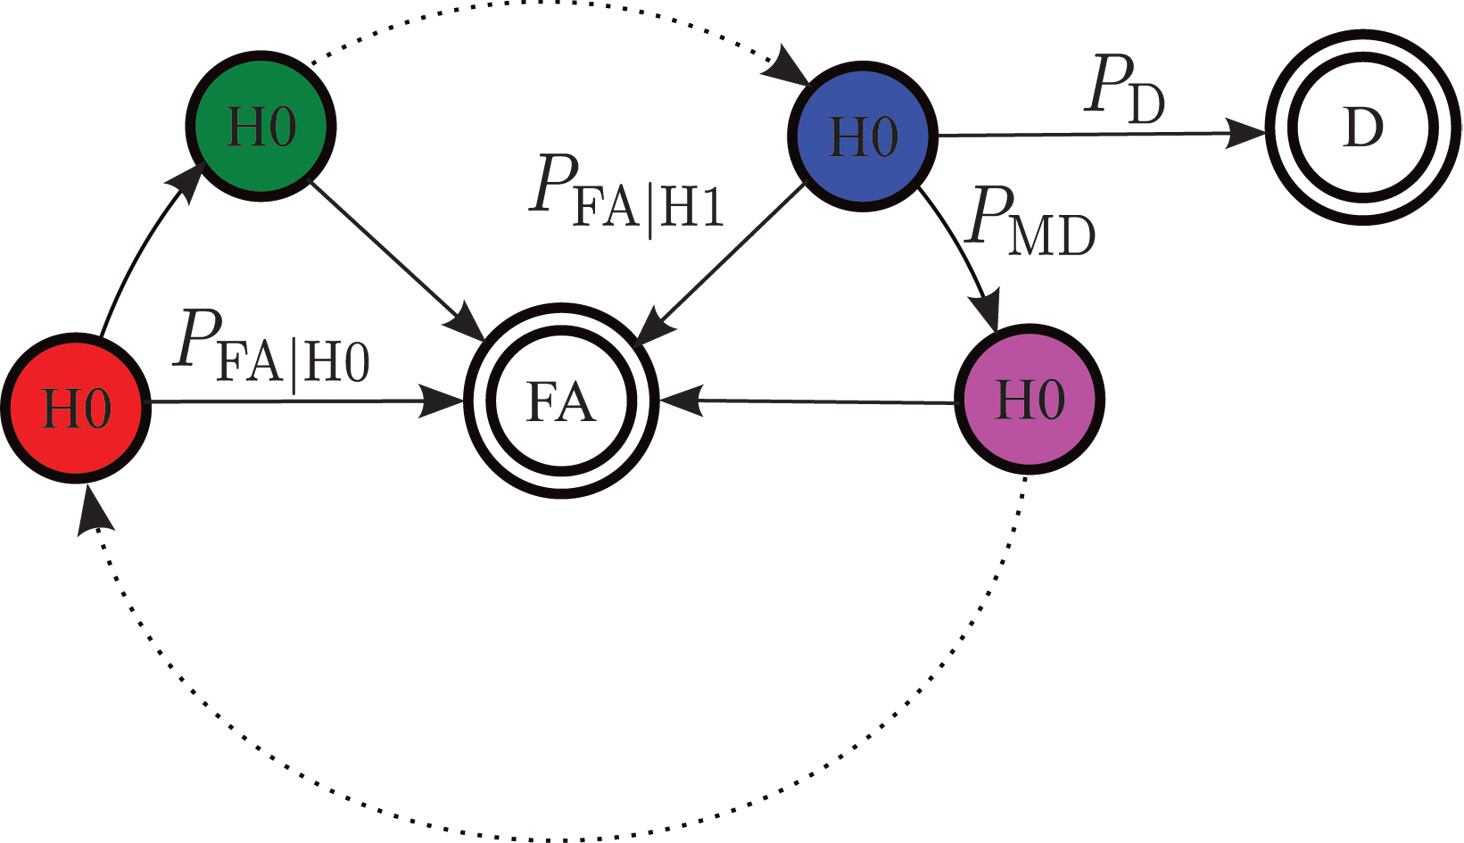
Flow-graph representation of the acquisition process for one channel. FA is the false-alarm state and D the correct detection of the signal from this satellite. H1 and H0 represent respectively states in which the signal is and is not present. PFA|H1 is the probability of false alarm in a window where the signal is present and PFA|H0 the probability of false alarm in a window where the signal is not present. P D is the probability of detection, and PMD the probability of missed detection.Figure 1. The probability of the TTFF (horizontal axis) as a function of the time after the beginning of the data series at which the acquisition process started (vertical axis), calculated using a 400-second GPS data series measured indoors. Note that the colored scale is not linear.
Modeling the Acquisition Process
A GPS receiver must first acquire signals from a sufficient number of satellites before it is able to calculate a position. This search is often the major contributor to the TTFF.
GPS Acquisition Architecture. The acquisition can be represented as the search for a specific, yet unknown, combination of three parameters in a larger search space. These are:
the Gold-code number used to generate the pseudo-random noise (PRN) sequence,
the code phase, and
the carrier frequency offset.
The last of these has contributions from the frequency offset caused by the relative motion of the satellite and receiver (the Doppler effect) and the frequency bias of the receiver’s local oscillator.
In general, signal detection is performed by correlating incoming signals with a local satellite signal replica for every combination of parameters in the search space. The correlated signal is then integrated and a “hit” is declared if the integrated value crosses a predetermined threshold. The time required to test for the presence of a satellite signal for each combination of parameters is called the dwell time. We suppose here that this is approximately equal to the integration time.
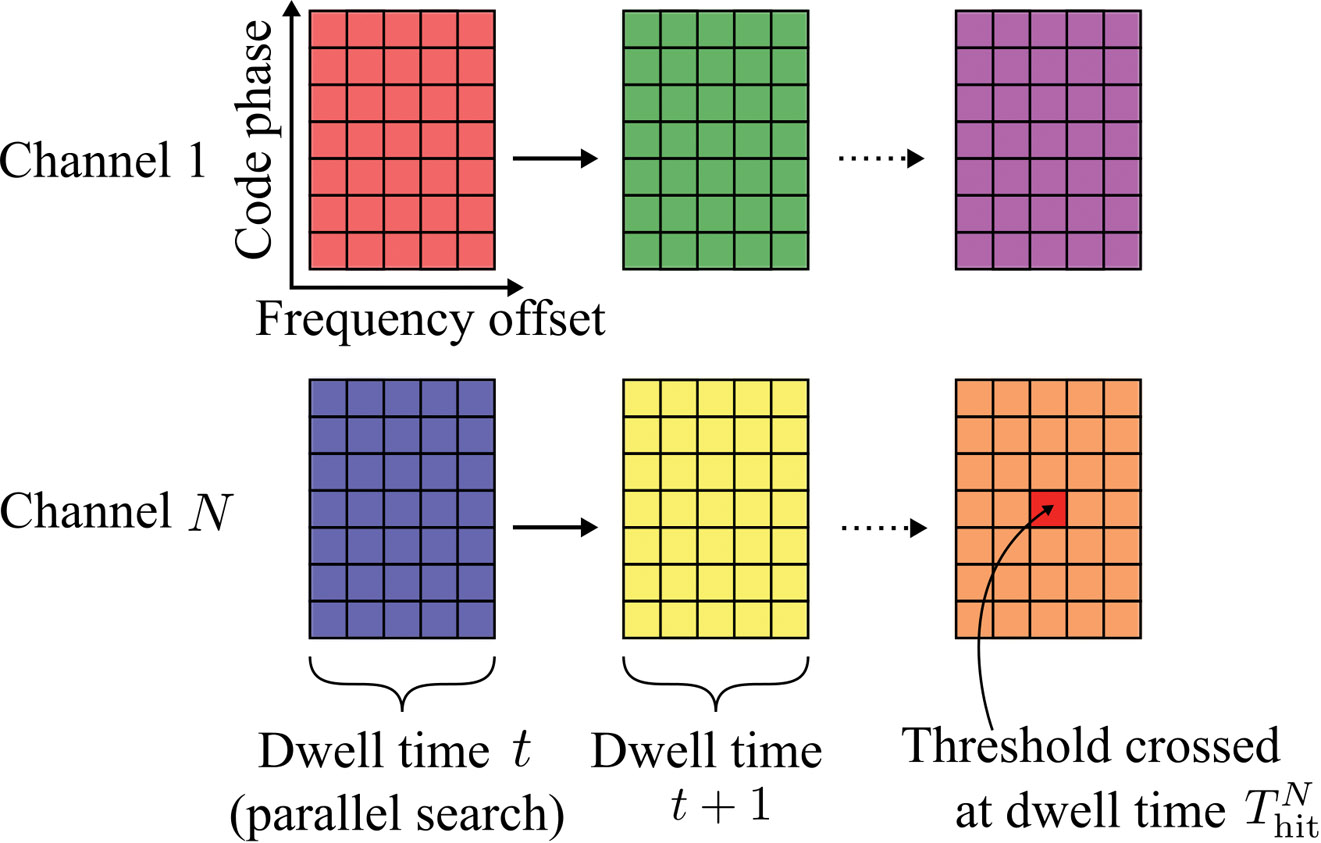
GPS receivers usually include some degree of parallelism. We consider a receiver having N channels, each channel dedicated to searching for signals with a different PRN sequence. Within a channel, the frequency and code-phase search spaces are further divided into several windows. We assume that all the parameter combinations within a window are searched in parallel, that is, within a single dwell time. This model of the acquisition process is outlined graphically in Figure 2.
Figure 2. An illustration of the acquisition process. The large colored rectangles represent the search windows and the inner smaller rectangles represent the different combinations of search parameters.
Parallelism can be implemented in hardware using massively parallel correlators or in software using fast Fourier transform-based techniques. The details of any particular implementation are not relevant here; only the number of channels, the number of windows, and the sizes of the global search spaces are needed.
Acquisition Time Probability Distribution. The flow-graph method provides a graphical representation of the acquisition process. An example is shown in the Opening Figure. Each node represents a state of the acquisition process at the end of a dwell time. The lines joining the nodes represent the transitions of one state to another with the given probabilities. Typical states during acquisition are false alarm, missed detection, correct detection, and correct non-detection.
The flow-graph method has already been applied to the GNSS acquisition problem, in particular for calculating the mean acquisition time of a signal in a GNSS receiver. Here we extend that work by considering the acquisition of all the satellites required for a position fix and, by deriving full probability distributions, we establish a model of an assisted-GNSS receiver.
The opening figure shows the various probabilities of transition that can be calculated from detector statistics.
Flow-graphs rely on the properties of the probability generating function (PGF) of a random variable. A PGF makes it straightforward to calculate the probability distribution of the total duration of a sequence of events of random durations since the PGF of the sum of random variables is simply the product of their PGFs. It is also straightforward to calculate the mean and standard deviation of a random variable directly from its probability-generating function.
Aside from these properties, PGFs are less convenient and less intuitive than probability distribution functions. A generating function does not provide a direct calculation of the probability of an event, unlike a distribution function. For instance, calculating the acquisition time at an arbitrary confidence level (for example, 90 percentile) requires a contour integral over the PGF. Furthermore, some operations are easier to perform on density functions, for example, calculating the probability of simultaneous events.
It can be shown that the probability mass function of a discrete random variable can be approximated from its generating function using a discrete Fourier transform. This property forms the basis of our method: using the fast Fourier transform (FFT), we can quickly calculate the entire acquisition probability distribution associated with the generating function of a flow-graph.
Assisted-GPS Model
We now focus on the specific architecture of an assisted-GPS receiver, such as is commonly found in cellular phones. In this type of receiver, the TTFF can be shortened by performing the acquisition in two steps.
The acquisition starts by searching for any satellite signal in a full search space in which every parameter takes its full range of values. The Doppler frequency of the first satellite acquired can be calculated using assistance data and then removed from the observed frequency offset to give the contribution to the frequency offset caused by the receiver’s clock frequency offset. This is common to all search channels and can be removed from the remaining search spaces.
The second stage of the acquisition is thus performed for the remaining satellites over a reduced search space.
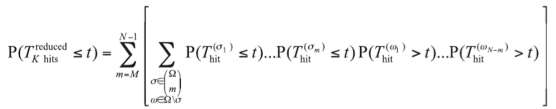
Stage 1 Full Search Space. The first threshold crossing for a single satellite is characterized by the time-to-first-hit (TTFH). Using an FFT, we can calculate the distribution function P(Thitfull ⩽ t) of the time-to-first-hit Thit(k) of the kth channel.
Mathematically, the time to first hit across all N channels, Thitfull, is the minimum of {Thit(k)}, whose distribution function is calculated by:
We assume that we have no means of detecting a false alarm at this stage and so the frequency parameter of the first threshold crossing is used to calculate the receiver’s clock frequency offset. This crossing may, of course, be a false alarm, and we take this into account later.
Stage 2 Reduced Search Space. At the reduced-space stage, the goal is to calculate the probability of having acquired M satellites out of N channels. The value of M depends on the number of pseudorange observables needed to solve the position equation. High-sensitivity assisted receivers that do not have signal tracking loops can only measure fractional pseudoranges together with an uncertain number of integer code periods. Using a coarse position estimate of the receiver, this uncertainty can be resolved, and a 3D position fix obtained, by using M = 5 satellites.
Calculating the detection probabilities at this stage involves some combinatorial arguments. In the following, (Ωm) represents the set of all combinations of m elements from the set Ω. For example, if Ω = {a, b, c}, then (Ω2 ) = {{a,b}, {b,c}, {a,c}}.
The probability of having “hit” at least M signals out of N channels at time t is given by
In this equation, Ω = {1, …, N} represents the set of the receiver’s channels and Thit(k) is the time to first hit of satellite k. Because each satellite is received with a different signal strength, these random variables have different distributions for every satellite.
The probability of having correctly detected at least M satellites before time t, P(TDreduced ⩽ t), is calculated by enumerating all the possible combinations of hit and detection events. The probability of having at least one false alarm before a given time t, P(TFAreduced⩽ t), is simply calculated by taking the difference between the probability of a hit and the probability of detection.
The number of possible combinations grows quickly with the number of channels. For an 8-channel receiver, there are 35 combinations, and for a 24-channel receiver there are 8,855 combinations. If the number of summations is becoming too computationally demanding, one solution is to form sets of signals with similar strength, and perform the combinations over these smaller sets with an appropriate weighting. Within a smaller set, all the signals have the same signal strength and acquisition times have the same probability distributions — a situation that is similar to calculating the order statistics of a random variable, which is not problematic in the case of identical distributions.
TTFF Probability Distribution
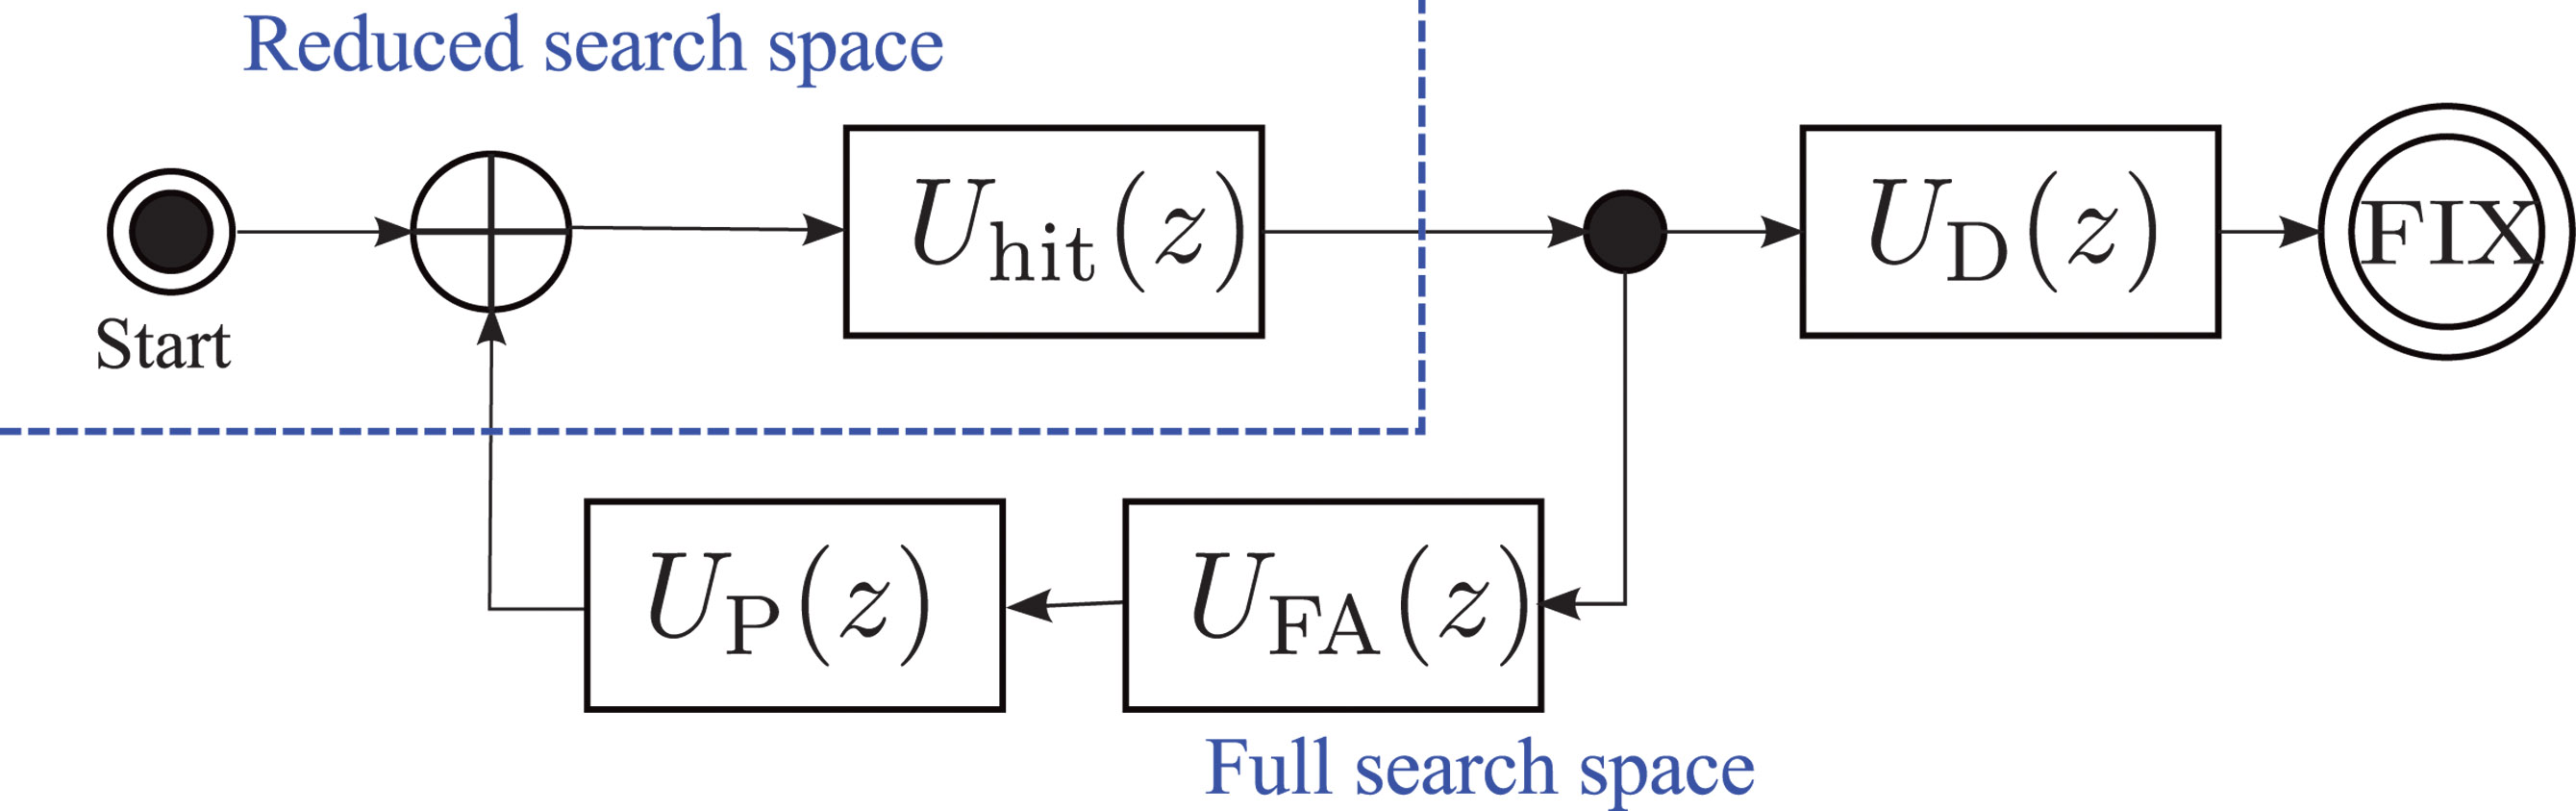
The last step before obtaining an expression for the TTFF distribution is to combine the two stages of the assisted acquisition. The total acquisition time is the sum of the time to first hit in the full-space stage and the time to the correct detection of M satellites in the reduced-space stage. This sum is easily calculated using generating functions, with the corresponding flow-graph represented in Figure 3.
Figure 3. Overall flow-graph of an assisted receiver. Uhit(z), UD(z), UFA(z), and UP(z) are the generating functions of the time to first hit in the full-space stage, the time to detections in the reduced-space stage, the time to a false alarm in the reduced-space stage, and the penalty time to recover from a false alarm, respectively.
Using the inverse of the FFT method presented above, we calculate the generating functions of the time to first hit in the full-space stage, Uhit(z); the time to M detections in the reduced-space stage, UD(z); the time to a false alarm in the reduced-space stage,UFA(z), and the deterministic time penalty to recover from a false alarm,UP(z).
Modeling false-alarms demands special attention. There is little information in the literature about the detection of false alarms in assisted-GPS receivers. One solution could be to detect a large residual error at the output of the positioning algorithm. Here, we take an easy path and simply introduce a penalty time, TPenalty, to represent the (deterministic) time needed to recover from a false alarm. The penalty time should be chosen to represent the behavior of a specific receiver.
For GNSS receivers capable of tracking the signals, the full pseudorange can be recovered after detection of a synchronization word in the navigation message. The duration of the tracking stage is a random variable, since the tracking can start at any position in the navigation message. Although we have not investigated this situation in more detail, we suspect that the tracking stage can be simply modeled by a uniform probability distribution. The length of this distribution depends on the navigation message structure and the amount of navigation data needed by the receiver to obtain a full set of decoded data. A new block can be added to the flow-graph in Figure 3 using the generating function of the uniform distribution, and the TTFF for a standard GNSS receiver can then be calculated.
Experimental Results
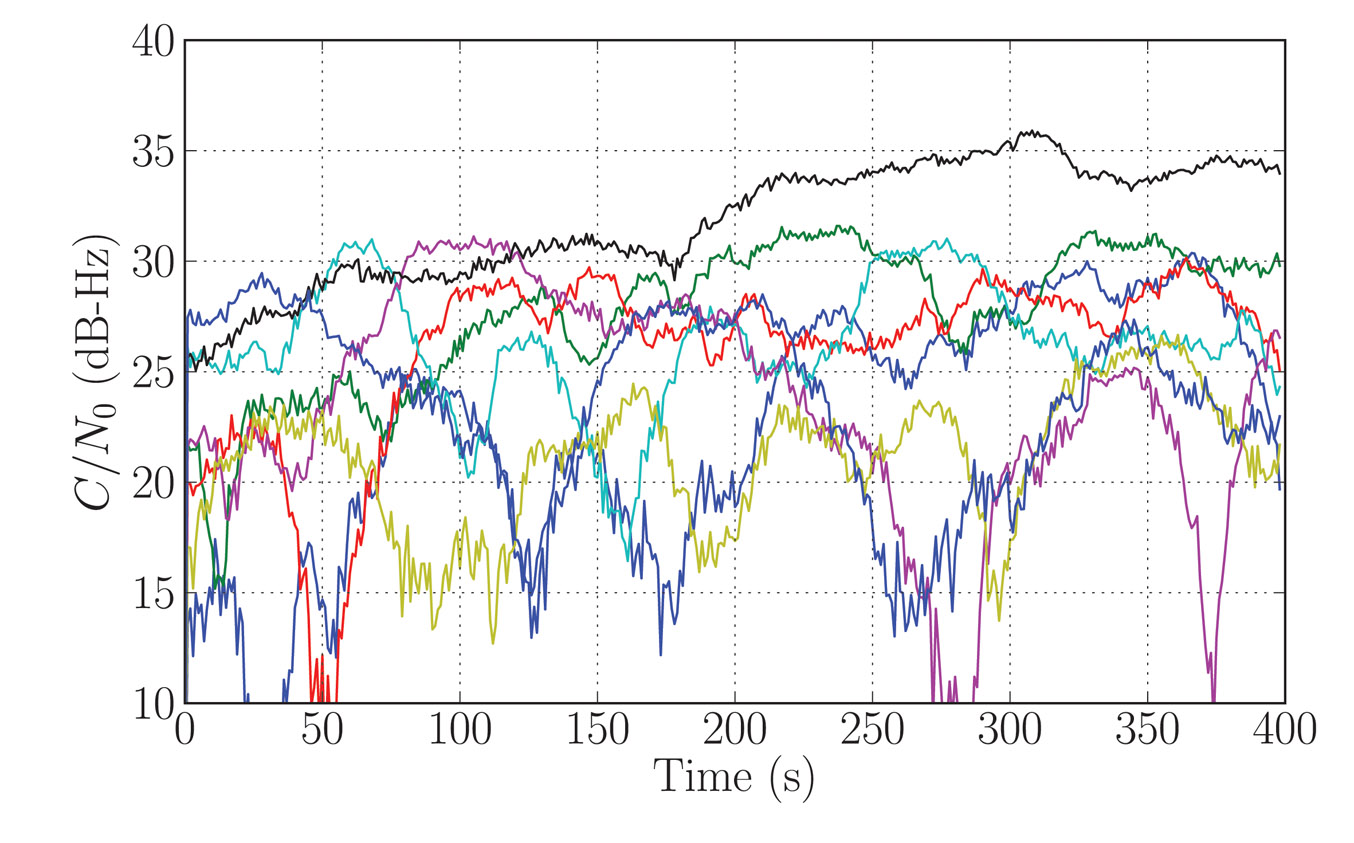
We analyzed the TTFF with the signal strengths measured in an office environment.
A picture of the office is shown in Figure 4. One side of this office has a window, but the sky view is obstructed by a large building a few tens of meters away. There is no direct line of sight to a satellite, although the window may allow some strong reflected signals to get in to the office.
Measurement of Weak Signals. Direct measurement of the strengths of indoor signals can be challenging since the signals are often too weak to be tracked reliably. We used a Nordnav R30 dual-input receiver with one input connected to an outdoor antenna mounted on the roof of the building and having an unobstructed view of the sky. The other input was connected to an antenna in the office. We used the tracking information from the stronger outside signal to track the indoor signal.
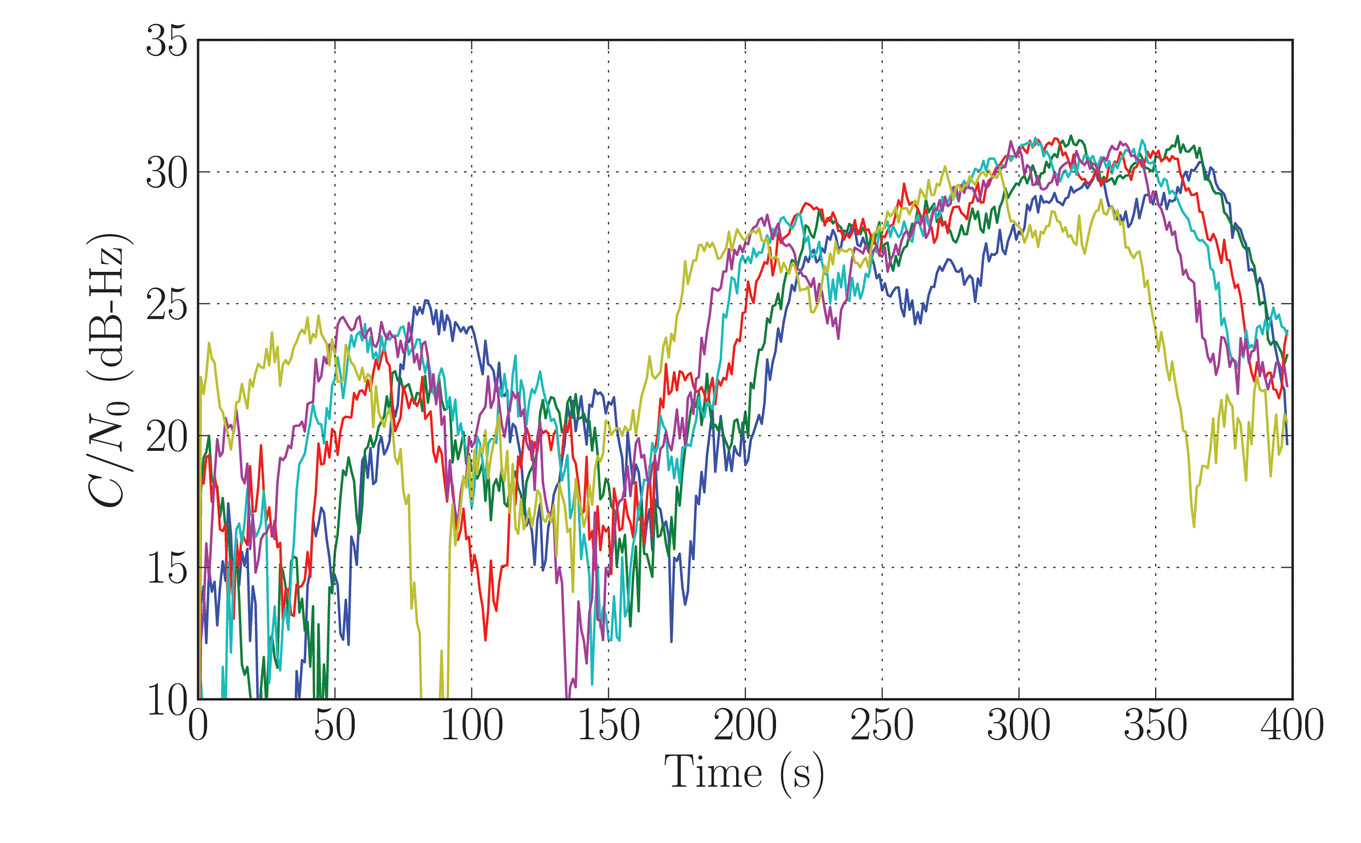
The signal carrier-to-noise density ratio (C/N0) was recorded for 400 seconds, starting every day at the same sidereal time, for six consecutive days.
Figure 5 shows the signal strength for one particular satellite (GPS PRN9). We see that the signal strength follows a similar pattern every day. This is representative of a multipath fading environment: the signal coming from the satellite is scattered in the office, and the resulting signals interfere constructively or destructively, depending on the phase difference between the different paths. The overall signal strength is therefore related to the relative position of the satellite which, for GPS, is about the same every day at a given sidereal time.
The variations of the signal strengths of all the observable satellites show fading patterns which are uncorrelated, as we expect the satellites to be spread across the sky (see Figure 6). It is difficult, if not impossible, to predict the distribution of signal strengths at any specific instant, and so the TTFF varies depending on the instant at which the acquisition process begins.
Figure 5. Indoors signal strength (C/N0) for satellite PRN09. Each colored curve represents the signal strength measured on a different day, starting at the same orbital time.Figure 6. Measured C/N0 for all observed satellites during the first day of recording.
TTFF Indoors. We now apply the signal strength measurements (Figures 5 and 6) to the TTFF calculation method presented above. This allows us to determine the probability of the TTFF as a function of the starting time of the acquisition since the beginning of the data recording.
We chose the detection parameters as follows: the coherent integration time was 1 millisecond, the non-coherent integration time was 300 milliseconds, the threshold was set for a probability of false alarm of 10–6, the time offset of a code phase was between 0 and 1 milliseconds, the penalty time for a false alarm was set to 600 milliseconds, and five satellites were required to solve the position equation. The ephemeris, a coarse position within 150 kilometers of the true position, and a coarse time within 30 seconds of the GPS system time were provided by the assistance data.
The results (see Figure 1) provide some insight into the acquisition process.
We can discern two patterns in the TTFF distribution. During the first 150 seconds of the analysis, that is, if a real receiver had started acquisition during that time, the TTFF showed large variations. This was caused by the multipath. The fading of the signals from the various satellites, although uncorrelated, led to severe degradation of the TTFF when the acquisition was started during a combination of strong fades. In our analysis, we have made the simplifying assumption that the strength of any particular satellite signal remains constant over the acquisition period.
After the first 150 seconds, the TTFF became more nearly constant. On examining the C/N0 time series, it was clear that the reason was the appearance of a signal from the satellite with PRN 27 (black curve in Figure 6) which was consistently stronger than the remaining signals after 120 seconds. This satellite had the highest elevation (more than 60 degrees) and the reception was probably by transmission through the ceiling of the office. In this situation, the phase difference between the reception paths was small, hence there was little fading. This single satellite significantly improved the TTFF, in particular by shortening the time of the first stage of the assisted-acquisition process.
It can be shown that the distribution of the acquisition time of a satellite, at a given starting time, can be approximated by an exponential distribution. This distribution explains the non-linearity of the relationship between the TTFF and the probability of fix, as observed in Figure 1. The non-linear effect becomes important when calculating the TTFF at a given performance level. In our example, the 50-percent probability of fix was about 1.2 seconds. Moving the requirement to 90 percent made it about 2 seconds, and 95 pecent about 2.5 seconds.
Conclusions
In presenting a method of calculating the distribution of the TTFF representative of a mass-market receiver indoors, we have seen how existing techniques can be extended and combined to provide an analytical model for assisted receivers. Power measurements of real signal show how the TTFF can vary depending on the combination of signal strength at the time the acquisition process is started. This suggests that an improved strategy for acquisition in large search spaces might be to start two or more independent acquisition processes, separated by, say, 1 second, in order to benefit from the advantage of one of the signals appearing strongly after a fade.
The lead author gratefully acknowledges support for this research from Cambridge Silicon Radio, CSR plc.
Nicolas Couronneau is a Ph.D. student at the Cavendish Laboratory, University of Cambridge, UK. He graduated as an electrical engineer from Supélec, France. His research interests are in the area of probabilistic methods applied to the acquisition of GNSS signals.
Peter J. DufFett-Smith is reader in experimental radio physics at the Cavendish Laboratory. His Ph.D. was in radio astronomy. He is the founder of Cambridge Positioning Systems Ltd. and, with others, invented the Matrix positioning method and Enhanced-GPS technologies. He holds more than 20 patents, and is a consultant to the GPS Group at Cambridge Silicon Radio.
Alexander Mitelman received his Ph.D. degree from Stanford University in electrical engineering. His research interests include signal-quality monitoring, algorithm and system design, and the development of testing methodologies for GNSS and hybrid systems.
Expecting guidance from FCC regulators by year’s end? LightSquared purports to do so, but a more measured evaluation finds a December decision unlikely.
The current test cycle — hopefully not the final one — just reached its end on November 4 at White Sands Missile Range, under the Air Force’s watchful eye. That testing focused only on “cellular and personal/general navigation” receivers as specified in a September letter from the National Telecommunication and Information Agency. According to unconfirmed reports, this round of testing did not include the JAVAD GNSS precision receiver with a new filter prototype, although LightSquared lobbied strongly to have the potentially bacon-rescuing device included.
Even if allowed, that move would have been highly premature, and ultimately misguided and misguiding. The 33 other high-precision and network GPS receivers that underwent May testing would all have to be retested, with the new filter incorporated somehow in each one, before any meaningful conclusion about technical feasibility could be drawn. Then retrofit cost issues would have to be addressed. Months of work remain before any fair and complete evaluation can occur.
A National PNT Engineering Forum summary of the cellular and personal/general navigation testing at White Sands is expected by November 30. A complete report may not appear until December. An FCC decision that same month, or the next, or the next, would be speedy and premature beyond any precedent that even the trigger-happy commission has yet set for itself.
As a basis for a decision on the waiver, the cellular and personal nav testing is still insufficient. At least one, probably two more rounds of testing — at bare minimum — involving the recent proposed filter fixes and a complete range of high-precision receivers should take place before putting national security, infrastructure, hundreds of thousands of jobs, and hundreds of billions of dollars of public and private-sector investments at risk.
This doesn’t mean everyone not directly involved in testing can chill.
This is a political and very high-stakes financial struggle, not just a series of complex technical issues. Decisions when they are made will reflect political considerations and financial motives as well as technical test results.
Everyone who cares about the outcome should sit down today and write letters or e-mails to their three congresspeople — two senators and one representative — stating strongly and clearly their views and reasons. Even if you have written before. Congress is the only place currently that any form of leverage can be exerted.
We are riding a wave of change, and precariously at that. While keeping our balance, we must continually gauge the water, the wind, our own stamina — and warily watch the great white sharks that are circling.
Charting the Evolution of Signal-in-Space Performance by Data Mining 400,000,000 Navigation Messages
By Liang Heng, Grace Xingxin Gao, Todd Walter, and Per Enge
There are four important requirements of any navigation system: accuracy, availability, continuity, and integrity. In this month’s column we take a look at one particular aspect of GPS integrity: that of the signal in space and find out how trustworthy is the satellite ephemeris and clock information in the broadcast navigation message.
INNOVATION INSIGHTS by Richard Langley
BUT THE GREATEST OF THESE IS INTEGRITY. There are four important requirements of any navigation system: accuracy, availability, continuity, and integrity.
Perhaps the most obvious navigation system requirement, accuracy describes how well a measured value agrees with a reference value, typically the true value. In the case of GPS, we might talk about the accuracy of a range measurement. A receiver actually measures a pseudorange — a biased and noisy measure of the geometric range between the receiver and the satellite. After correcting for satellite ephemeris and satellite clock errors (the primary so-called signal-in-space errors), receiver clock errors, and atmospheric effects, we can get an estimate of the geometric range. How well we account for these errors or biases, will determine the accuracy of the corrected pseudorange measurement and ultimately, the accuracy of a derived position.
A navigation system’s availability refers to its ability to provide the required function and performance within the specified coverage area at the start of an intended operation. In many cases, system availability implies signal availability, which is expressed as the percentage of time that the system’s transmitted signals are accessible for use. In addition to transmitter capability, environmental factors such as signal attenuation or blockage or the presence of interfering signals might affect availability.
Ideally, any navigation system should be continuously available to users. But, because of scheduled maintenance or unpredictable outages, a particular system may be unavailable at a certain time. Continuity, accordingly, is the ability of a navigation system to function without interruption during an intended period of operation. More specifically, it indicates the probability that the system will maintain its specified performance level for the duration of an operation, presuming system availability at the beginning of that process.
The integrity of a navigation system refers to its trustworthiness. A system might be available at the start of an operation, and we might predict its continuity at an advertised accuracy during the operation.
But what if something unexpectedly goes wrong? If some system anomaly results in unacceptable navigation accuracy, the system should detect this and warn the user. Integrity characterizes a navigation system’s ability to provide this timely warning when it fails to meet its stated accuracy. If it does not, we have an integrity failure and the possibility of conveying hazardously misleading information. GPS has built into it various checks and balances to ensure a fairly high level of integrity. However, GPS integrity failures have occasionally occurred.
In this month’s column we take a look at one particular aspect of GPS integrity: that of the signal in space and find out how trustworthy is the satellite ephemeris and clock information in the broadcast navigation message.
The Navstar Global Positioning System is so far the most widely used space-based positioning, navigation, and timing system. GPS works on the principle of trilateration, in which the measured distances from a user receiver to at least four GPS satellites in view, as well as the position and clock data for these satellites, are the prerequisites for the user receiver to fix its exact position. For most GPS Standard Positioning Service (SPS) users, real-time satellite positions and clocks are derived from ephemeris parameters and clock correction terms in navigation messages broadcast by GPS satellites. The GPS Control Segment routinely generates navigation message data on the basis of a prediction model and the measurements at more than a dozen monitor stations. The differences between the broadcast ephemerides/clocks and the truth account for signal-in-space (SIS) errors. SIS errors are usually undetectable and uncorrectable for stand-alone SPS users, and hence directly affect the positioning accuracy and integrity. Nominally, SPS users can assume that each broadcast navigation message is reliable and the user range error (URE) derived from a healthy SIS is at the meter level or even sub-meter level. In practice, unfortunately, SIS anomalies have happened occasionally and UREs of tens of meters or even more have been observed, which can result in an SPS receiver outputting a hazardously misleading position solution. Receiver autonomous integrity monitoring (RAIM) or advanced RAIM is a promising tool to protect stand-alone users from such hazards; however, most RAIM algorithms assume at most one satellite fault at a time. Knowledge about the SIS anomalies in history is very important not only for assessing the GPS SIS integrity performance but also for validating the fundamental assumption of RAIM.
A typical method for calculating SIS UREs is to compare the broadcast ephemerides/clocks with the precise, post-processed ones. Although this method is very effective in assessing the GPS SIS accuracy performance, few attempts have been made to use it to assess the GPS SIS integrity performance because broadcast ephemeris/clock data obtained from a global tracking network sometimes contain errors caused by receivers or data conversion processes and these errors usually result in false SIS anomalies. In this article, we introduce a systematic methodology to cope with this problem and screen out all the potential SIS anomalies in the past decade from when Selective Availability (SA) was turned off.
GPS SIS Integrity
The integrity of a navigation system refers — just as it does to a person — to its honesty, veracity, and trustworthiness. In the case of GPS, this includes the integrity of the ephemeris and clock data in the broadcast navigation messages. We refer to this as signal-in-space integrity.
GPS SIS URE. As indicated by the name, GPS SIS URE is the pseudorange modeling inaccuracy due to operations of the GPS ground control and the space vehicles. Specifically, SIS URE includes satellite ephemeris and clock errors, satellite antenna performance variations, and signal imperfections, but not ionospheric or tropospheric delay, multipath, or any errors due to user receivers. SIS URE is dominated by ephemeris and clock errors because antenna variations and signal imperfections are at a level of millimeters or centimeters.
In broadcast navigation messages, there is a parameter called user range accuracy (URA) that is intended to be a conservative representation of the standard deviation (1-sigma) of the URE at the worst-case location on the Earth. For example, a URA index value of 0 means that the 1-sigma URE is expected to be less than 2.4 meters, and a URA index value of 1 means that the 1-sigma URE is expected to be greater than 2.4 meters but less than 3.4 meters, and so on. In the past several years, most GPS satellites have a URA index value of 0. A nominal URA value, in meters, can be computed as X = 2(1+N/2), where N is the index value, for index values of 6 or less. For 6 < N < 15, X = 2(N-2).
GPS SPS SIS Integrity. In the SPS Performance Standard (PS), as well as the latest version of the Interface Specification (IS-GPS-200E), the GPS SPS SIS URE integrity standard assures that for any healthy SIS, there is an up-to-10−5 probability over any hour of the URE exceeding the not-to-exceed (NTE) tolerance without a timely alert during normal operation. The NTE tolerance is currently defined to be 4.42 times the upper bound (UB) on the URA value broadcast by the satellite. Before September 2008, the NTE tolerance was defined differently, as the maximum of 30 meters and 4.42 times URA UB. The reason for the “magic” number 4.42 here is the Gaussian assumption of the URE, although this assumption may be questionable. (4.42 sigma corresponds to a probability level of 99.999 percent (1 – 10–5)).
In this article, a GPS SPS SIS anomaly is defined as a threat of an SIS integrity failure; that is, a condition during which an SPS SIS marked healthy results in a URE exceeding the NTE tolerance. Because the definition of the NTE tolerance is different before and after September 2008, we consider both of the two NTE tolerances for the sake of completeness and consistency.
Methodology
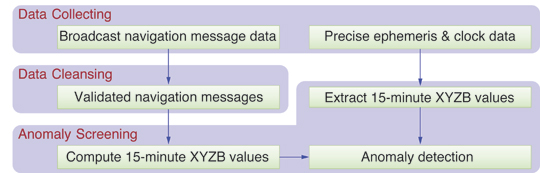
The SIS anomalies are screened out by comparing broadcast ephemerides/clocks with precise ones. As shown in Figure 1, the whole process consists of three steps: data collecting, data cleansing, and anomaly screening.
Figure 1. Framework of the whole process. XYZB values refer to the coordinates of satellite position and satellite clock bias.
In the first step, the navigation message data files are downloaded from the International GNSS Service (IGS). In addition, two different kinds of precise ephemeris/clock data are downloaded from IGS and the National Geospatial-Intelligence Agency (NGA), respectively. The details about these data sources will be discussed in the next section.
Since each GPS satellite can be observed by many IGS stations at any instant, each navigation message is recorded redundantly. In the second step, a data-cleansing algorithm exploits the redundancy to remove the errors caused on the ground. This step distinguishes our work from that of most other researchers because the false anomalies due to corrupted data can be mostly precluded.
The last step is computing worst-case SIS UREs as well as determining potential SIS anomalies. The validated navigation messages prepared in the second step are used to propagate broadcast orbits/clocks at 15-minute intervals that coincide with the precise ones. A potential SIS anomaly is claimed when the navigation message is healthy and in its fit interval with the worst-case SIS URE exceeding the SIS URE NTE tolerance.
Data Sources
We obtained broadcast navigation message data and precise ephemeris and clock data from publicly available sources.
Broadcast Navigation Message Data. Broadcast GPS navigation message data files are available at IGS Internet sites. All the data are archived in Receiver Independent Exchange (RINEX) navigation file format, which includes not only the ephemeris/clock parameters broadcast by the satellites but also some information produced by the ground receivers, such as the pseudorandom noise (PRN) signal number and the transmission time of message (TTOM).
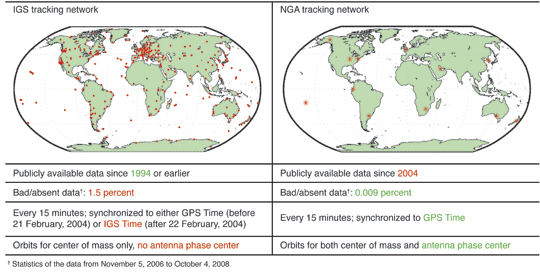
The IGS tracking network is made up of more than 300 volunteer stations all over the world (a map is shown in Table 1) ensuring seamless, redundant data logging. Since broadcast navigation messages are usually updated every two hours, no single station can record all navigation messages. For the ease of users, two IGS archive sites, the Crustal Dynamics Data Information System (CDDIS) and the Scripps Orbit and Permanent Array Center (SOPAC), provide two kinds of ready-to-use daily global combined broadcast navigation message data files, brdcddd0.yyn and autoddd0.yyn, respectively, where ddd is the day of year yy. Unfortunately, these files sometimes contain errors that can cause false anomalies.
Table 1. Comparison of IGS and NGA precise ephemeris/clock data.
Therefore, we devised and implemented a data-cleansing algorithm to generate the daily global combined navigation messages, which are as close as possible to the navigation messages that the satellites actually broadcast, from all available navigation message data files of all IGS stations. The data-cleansing algorithm is based on majority vote, and hence all values in our data are cross validated. Accordingly, we name our daily global combined navigation messages “validated navigation messages,” as shown in Figure 1.
Precise Ephemeris and Clock Data. Precise GPS ephemerides/clocks are generated by some organizations such as IGS and NGA that routinely post-process observation data. Precise ephemerides/clocks are regarded as “truth” because of their centimeter-level accuracy.
Table 1 shows a side-by-side comparison between IGS and NGA precise ephemeris/clock data, in which the green- and red-colored text implies pros and cons, respectively. For NGA data, the only con is that the data have been publicly available only since January 4, 2004. As a result, for the broadcast ephemerides/clocks before this date, IGS precise ephemerides/clocks are the only references. Nevertheless, care must be taken when using IGS precise ephemerides/clocks due to the following three issues.
The first issue with the IGS precise ephemerides/clocks is the relatively high rate of bad/absent data, as shown in the third row of Table 1. For a GPS constellation of 27 healthy satellites, 1.5 percent bad/absent data means no precise ephemerides or clocks for approximately 10 satellite-hours per day. This issue can result in undetected anomalies (false negatives).
The second issue is that, as shown in the fourth row of Table 1, IGS switched to IGS Time for its precise ephemeris/clock data on 22 February, 2004. The IGS clock is not synchronized to GPS Time, and the differences between the two time references may be as large as 3 meters. Fortunately, the time offsets can be extracted from the IGS clock data files. Moreover, a similar problem is that IGS precise ephemerides use a frame aligned to the International Terrestrial Reference Frame (ITRF) whereas broadcast GPS ephemerides are based on the World Geodetic System 1984 (WGS 84). The differences between ITRF and the versions of WGS 84 used since 1994 are on the order of a few centimeters, and hence a transformation is not considered necessary for the purpose of our work.
The last, but not the least important, issue with the IGS precise ephemerides is that the data are provided only for the center of mass (CoM) of the satellite. Since the broadcast ephemerides are based on the satellite antenna phase center (APC), the CoM data must be converted to the APC before being used. Both IGS and NGA provide antenna corrections for every GPS satellite. Although the IGS and the NGA CoM data highly agree with each other, the IGS satellite antenna corrections are quite different from the NGA’s, and the differences in z-offsets can be as large as 1.6 meters for some GPS satellites. The reason for these differences is mainly due to the different methods in producing the antenna corrections: the IGS antenna corrections are based on the statistics from more than 10 years of IGS data, whereas the NGA’s are probably from the calibration measurements on the ground. In order to know whose satellite antenna corrections are better, the broadcast orbits for all GPS satellites in 2009 were computed and compared with three different precise ephemerides: IGS CoM + IGS antenna corrections, IGS CoM + NGA antenna corrections, and NGA APC. Generally, the radial ephemeris error is expected to have a zero mean. However, the combination “IGS CoM + IGS antenna corrections” results in radial ephemeris errors with a non-zero mean for more than half of the GPS satellites. Therefore, the NGA antenna corrections were selected to convert the IGS CoM data to the APC.
Data Cleansing
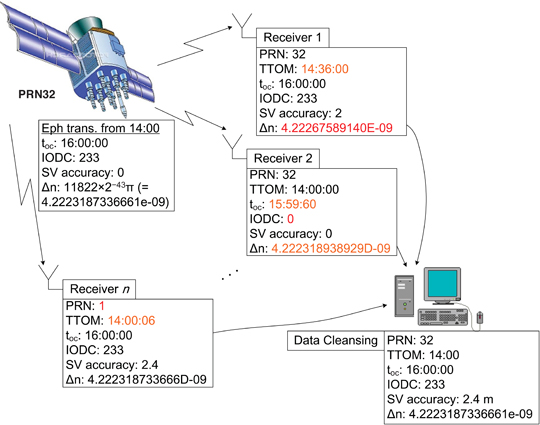
Figure 2 shows a scenario of data cleansing. Owing to accidental bad receiver data and various hardware/software bugs, a small proportion of the navigation data files from the IGS stations have defects such as losses, duplications, inconsistencies, discrepancies, and errors. Therefore, more than just removing duplications, the generation of validated navigation messages is actually composed of two complicated steps.
Figure 2. A scenario of data cleansing: In the figure, the GPS satellite PRN32 started to transmit a new navigation message at 14:00. Receiver 1 had not observed the satellite until 14:36, and hence the TTOM in its record was 14:36. Additionally, Receiver 1 made a one-bit error in ∆n (4.22267589140 × 10⁻⁹ 11823 × 2−43 π). Receiver 2 perhaps had some problems in its software: the IODC was unreported and both the toc and ∆n were written weirdly. Receiver n used an incorrect ranging code, PRN01, to despread and decode the signal of PRN32; fortunately, all the parameters except TTOM were perfectly recorded. Moreover, the three receivers interpreted URA (SV accuracy) differently. A computer equipped with our data cleansing algorithms is used to process all the data from the receivers. The receiver-caused errors are removed and the original navigation message is recovered.
First step. Suppose that we want to generate the validated navigation messages for day n. In the first step, we apply the following operations sequentially to each RINEX navigation data file from day n − 1 to day n + 1:
1) Parse the RINEX navigation file;
2) Recover least significant bit (LSB);
3) Classify URA values;
4) Remove the navigation messages not on day n;
5) Remove duplications;
6) Add all remaining navigation messages into the set O.
The reason why the data files from day n − 1 to day n + 1 are considered is that a few navigation messages around 00:00 can be included in some data files on day n − 1, and a few navigation messages around 23:59 can be included in some data files on day n + 1. The LSB recovery is used here to cope with the discrepant representations of floating-point numbers in RINEX navigation files. The URA classifier is employed to recognize and unify various representations of URA in the files. The duplication removal is applied because some stations write the same navigation messages repeatedly in one data file, which is unfavorable to the vote in the second step.
Second Step. At the end of the first step, we have a set O that includes all the navigation messages on day n. The set O still has duplications because a broadcast navigation message can be reported by many IGS stations. However, as shown in Figure 2, duplications of a broadcast navigation message may come with different errors and are not necessarily identical. Several other examples of such problems can be found in our journal paper listed in Further Reading. Fortunately, most orbital and clock parameters are seldom reported incorrectly, and even when errors happen, few stations agree on the same incorrect value. In our work, these parameters are referred to as robust parameters. On the contrary, some parameters, such as TTOM, PRN, URA and issue of data clock (IODC), are more likely to be erroneous and when errors happen, several stations may make the same mistake. These parameters are referred to as fragile parameters. The cause of the fragility is either the physical nature (for example, TTOM, PRN) or the carelessness in hardware/software implementations (for example, URA, IODC).
Majority vote is applied to all fragile parameters (except TTOM, which is determined by another algorithm described in our journal paper) under the principle that the majority is usually correct. Meanwhile, the robust parameters are utilized to identify the equivalence of two navigation messages — two navigation messages are deemed identical if and only if they agree on all the robust parameters, although their fragile parameters could be different. Therefore, the goal of duplication removal and majority vote is a set P, in which any navigation message must have at least one robust parameter different from any other and has all fragile parameters confirmed by the largest number of stations that report this navigation message.
After the operations above, we have a set P in which there are no duplicated navigation messages in terms of robust parameters and all fragile parameters are as correct as possible. A few navigation messages in P still have errors in their robust parameters. These unwanted navigation messages feature a small number of reporting stations. Finally, the navigation messages confirmed by only a few stations being discarded and the survivors are the validated broadcast navigation messages, stored in files sugldddm.yyn. For further details of our algorithms, see our journal paper.
Anomaly Screening
The validated broadcast navigation messages prepared using the algorithm described in the previous section were employed to propagate broadcast satellite orbits and clocks. For each 15-miniute epoch, t, that coincides with precise ephemerides/clocks, the latest transmitted broadcast ephemeris/clock is chosen to calculate the worst-case SIS URE – the maximum SIS URE that a user on Earth can experience.
Finally, a potential GPS SIS anomaly is claimed when all of the following conditions are fulfilled.
The worst-case SIS URE exceeds the NTE tolerance;
The broadcast navigation message is healthy; that is,
The RINEX field SV health is 0, and
The URA UB ≤ 48 meters;
The broadcast navigation message is in its fit interval; that is, ∆t = t − TTOM ≤ 4 hours;
The precise ephemeris/clock is available and healthy.
Results
A total of 397,044,414 GPS navigation messages collected by an average of 410 IGS stations from June 1, 2000 (one month after turning off SA), to August 31, 2010, have been screened. The NGA APC precise ephemerides/clocks and the IGS CoM precise ephemerides/clocks with the NGA antenna corrections were employed as the truth references. Both old and new NTE tolerances were used for determining anomalies.
Before interpreting the results, it should be noted that there are some limitations due to the data sources and the anomaly-determination criteria. First, false anomalies may be claimed because there may be some errors in the precise ephemerides/clocks or the validated navigation messages. Second, some short-lived anomalies may not show up if they happen to fall into the 15-minute gaps of the precise ephemerides/clocks. Third, some true anomalies may not be detected if the precise ephemerides/clocks are temporarily missing. The third limitation is especially significant for the results before January 3, 2004, because only the IGS precise ephemerides/clocks are available, which feature a high rate of bad/absent data. (For example, the clock anomaly of Space Vehicle Number (SVN) 23/PRN23 that occurred on January 1, 2004 is missed by our process because the IGS precise clocks for PRN23 on that day were absent.) Last but not least, users might not experience some anomalies because a satellite was not trackable at that time, or the users were notified via a Notice Advisory to Navstar Users (NANU). (A satellite may indicate that it is unhealthy through the use of non-standard code or data. The authors’ future work will include using observation data to verify the potential anomalies found in the results presented here.) Therefore, all the SIS anomalies claimed in this article are considered to be potential and under further investigation.
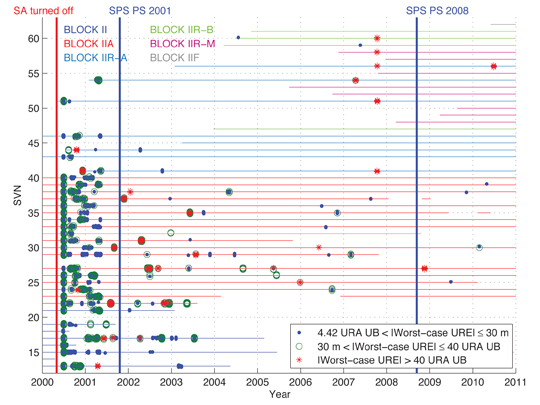
Potential SIS Anomalies. A total of 1,256 potential SIS anomalies were screened out under SPS PS 2008 (or 374 potential SIS anomalies under SPS PS 2001). Figure 3 shows all these anomalies in a Year-SVN plot. It can be seen that during the first year after SA was turned off, SIS anomalies occurred frequently for the whole constellation.
Figure 3. Potential SIS anomalies from June 1, 2000, to August 31, 2010. The horizontal lines depict the periods when the satellites were active (not necessarily healthy). The color of the lines indicates the satellites’ block type, as explained by the top left legend.
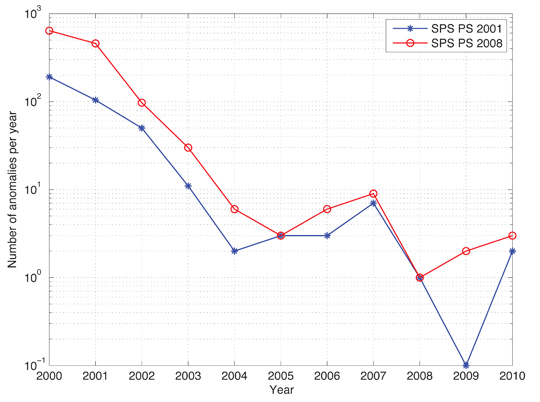
Moreover, 2004 is apparently a watershed: before 2004, anomalies occurred for all GPS satellites (except two satellites launched in 2003, SVN45/PRN21 and SVN56/PRN16) whereas after 2004, anomalies occurred much less frequently and more than 10 satellites have never been anomalous. Figure 4 further confirms the improving GPS SIS integrity performance in the past decade, no matter which SPS PS is considered.
Figure 4. Number of potential SIS anomalies per year. The SIS performance was improved during the past decade. There were 0 anomalies in 2009 according to SPS PS 2001 and this number is represented by 0.1 in the figure.
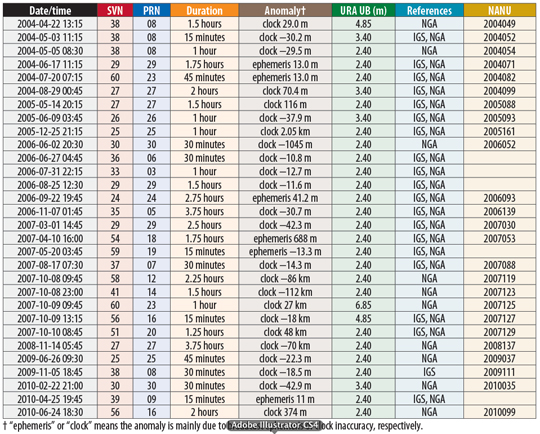
Therefore, it is possible to list all potential SIS anomalies from January 4, 2004, to August 31, 2010, in a compact table: Table 2. Most anomalies in the table have been confirmed by NANUs and other literature. The table reveals an important and exciting piece of information: never have two or more SIS anomalies occurred simultaneously since 2004. Accordingly, in the sense of historical GPS SIS integrity performance, it is valid for RAIM to assume at most one satellite fault at a time.
Table 2. List of potential anomalies from January 4, 2004, to August 31, 2010.
Validated Navigation Messages. For the purpose of comparison and verification, the IGS daily global combined broadcast navigation message data files brdcddd0.yyn and autoddd0.yyn were used to propagate broadcast satellite orbits and clocks as well. The NGA APC precise ephemerides/clocks were employed for the truth references. The SPS PS 2008 NTE tolerance was used for determining anomalies. The other criteria for anomaly screening that are the same as in the previous section were still applied.
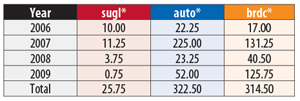
All the potential SIS anomalies for 2006–2009 were found based on the three kinds of daily combined broadcast navigation messages. Table 3 shows a comparison of the total hours of the anomalies per year. It can be seen that brdcddd0.yyn and autoddd0.yyn result in approximately 11 times more false anomalies than true ones. Moreover, all potential anomalies derived from sugldddm.yyn are confirmed by brdcddd0.yyn and autoddd0.yyn, which indicates that our sugldddm.yyn does not introduce any more false anomalies than brdcddd0.yyn and autoddd0.yyn.
Table 3. Total hours of anomalies per year computed from three different kinds of daily global combined broadcast navigation messages.
Conclusion
In this article, the GPS SIS integrity performance in the past decade was assessed by comparing the broadcast ephemerides/clocks with the precise ones. Thirty potential anomalies were found. The fundamental assumption of RAIM is valid based on a review of the GPS SIS integrity performance in the past seven years.
Acknowledgments
The authors gratefully acknowledge the support of the Federal Aviation Administration. This article contains the personal comments and beliefs of the authors, and does not necessarily represent the opinion of any other person or organization.
The authors would like to thank Mr. Tom McHugh, William J. Hughes FAA Technical Center, for his valuable input to the data-cleansing algorithm. This article is based on the paper “GPS Signal-in-Space Integrity Performance Evolution in the Last Decade: Data Mining 400,000,000 Navigation Messages from a Global Network of 400 Receivers” to appear in the Institute of Electrical and Electronics Engineers (IEEE) Transactions on Aerospace and Electronic Systems..
Liang Heng is a Ph.D. candidate under the guidance of Professor Per Enge in the Department of Electrical Engineering at Stanford University.
Grace Xingxin Gao is a research associate in the GPS Research Laboratory of Stanford University.
Todd Walter is a senior research engineer in the Department of Aeronautics and Astronautics at Stanford University.
Per Enge is a professor of Aeronautics and Astronautics at Stanford University, where he is the Kleiner-Perkins, Mayfield, Sequoia Capital Professor in the School of Engineering. He directs the GPS Research Laboratory, which develops satellite navigation systems based on GPS.
FURTHER READING
• Authors’ Research Papers
“GPS Signal-in-Space Integrity Performance Evolution in the Last Decade: Data Mining 400,000,000 Navigation Messages from a Global Network of 400 Receivers” by L. Heng, G.X. Gao, T. Walter, and P. Enge in Transactions on Aerospace and Electronic Systems, the Institute of Electrical and Electronics Engineers, accepted for publication.
“GPS Signal-in-Space Anomalies in the Last Decade: Data Mining of 400,000,000 GPS Navigation messages” by L. Heng, G.X. Gao, T. Walter, and P. Enge in Proceedings of ION GNSS 2010, the 23rd International Technical Meeting of The Satellite Division of the Institute of Navigation, Portland, Oregon, September 21–24, 2010, pp. 3115–3122.
“GPS Ephemeris Error Screening and Results for 2006–2009” by L. Heng, G.X. Gao, T. Walter, and P. Enge in Proceedings of ION ITM 2010, the 2010 International Technical Meeting of the Institute of Navigation, San Diego, California, January 24–26, 2010, pp. 1014–1022.
• Earlier Work on Assessing GPS Broadcast Ephemerides and Clocks
“GPS Orbit and Clock Error Distributions” by C. Cohenour and F. van Graas in Navigation, Vol. 58, No. 1, Spring 2011, pp. 17–28.
“Statistical Characterization of GPS Signal-in-Space Errors” by L. Heng, G.X. Gao, T. Walter, and P. Enge in Proceedings of ION ITM 2011, the 2011 International Technical Meeting of the Institute of Navigation, San Diego, California, January 24–26, 2011, pp. 312–319.
“Broadcast vs. Precise GPS Ephemerides: A Historical Perspective” by D.L.M. Warren and J.F. Raquet in GPS Solutions, Vol. 7, No. 3, 2003, pp. 151–156, doi: 10.1007/s10291-003-0065-3.
“Accuracy and Consistency of Broadcast GPS Ephemeris Data” by D.C. Jefferson and Y.E. Bar-Sever in Proceedings of ION GPS-2000, the 13th International Technical Meeting of the Satellite Division of The Institute of Navigation, Salt Lake City, Utah, September 19–22, 2000, pp. 391–395.
“The GPS Broadcast Orbits: An Accuracy Analysis” by R.B. Langley, H. Jannasch, B. Peeters, and S. Bisnath, presented in Session B2.1-PSD1, New Trends in Space Geodesy at the 33rd COSPAR Scientific Assembly, Warsaw, July 16–23, 2000.
• Signal-in-Space Anomalies
“GNSS: The Present Imperfect” by D. Last in Inside GNSS, Vol. 5, No. 3, May 2010, pp. 60–64.
“Investigation of Upload Anomalies Affecting IIR Satellites in October 2007” by K. Kovach, J. Berg, and V. Lin in Proceedings of ION GNSS 2008, the 21st International Technical Meeting of the Satellite Division of The Institute of Navigation, Savannah, Georgia, September 16–19, 2008, pp. 1679–1687.
“GPS Receiver Responses to Satellite Anomalies” by J.W. Lavrakas and D. Knezha in Proceedings of the 1999 National Technical Meeting of The Institute of Navigation, San Diego, California, January 25–27, 1999, pp. 621–626.
• GPS Integrity and Receiver Autonomous Integrity Monitoring
“Prototyping Advanced RAIM for Vertical Guidance” by J. Blanch, M.J. Choi, T. Walter, P. Enge, and K. Suzuki in Proceedings of ION GNSS 2010, the 23rd International Technical Meeting of the Satellite Division of The Institute of Navigation, Portland, Oregon, September 21–24, 2010, pp. 285–291.
“The Integrity of GPS” by R.B. Langley in GPS World, Vol. 10, No. 3, March 1999, pp. 60–63.
• International GNSS Service Ephemerides and Clocks
“On the Precision and Accuracy of IGS Orbits” by J. Griffiths and J.R. Ray in Journal of Geodesy, Vol. 83, 2009, pp. 277–287, doi: 10.1007/s00190-008-0237-6.
• National Geospatial-Intelligence Agency Ephemerides and Clocks
“NGA’s Role in GPS” by B. Wiley, D. Craig, D. Manning, J. Novak, R. Taylor, and L. Weingarth in Proceedings of ION GNSS 2006, the 19th International Technical Meeting of the Satellite Division of The Institute of Navigation, Fort Worth, Texas, September 26–29, 2006, pp. 2111–2119.
“Generation of a Consistent Absolute Phase-center Correction Model for GPS Receiver and Satellite Antennas” by R. Schmid, P. Steigenberger, G. Gendt, M. Ge, and M. Rothacher in Journal of Geodesy, Vol. 81, No. 12, 2007, pp. 781–798, doi: 10.1007/s00190-007-0148-y.
Telmap announced that Telmap will use INRIX’s real-time, historical and predictive traffic information in its Mobile Location Companion service worldwide.
According to the announcement, the partnership is expected to enhance the navigation experience and increase usage by allowing Telmap users to enjoy best in class routing through better alternative routes that take into consideration real-time traffic and will result in reduced travel time and more accurate estimated time of arrival (ETA). These improvements will be driven by INRIX’s breakthrough traffic analytics that accurately measure the speed of travel and estimate travel times for routes covering both major motorways and secondary roads, which is powered by the largest crowd-sourced traffic community in the world. INRIX’s traffic data coverage combined with the coverage of recently acquired ITIS Holdings offers Telmap users unprecedented coverage in 30 countries.
“Telmap’s goal is to provide its millions of users with an excellent and the quickest possible navigation experience. We evaluated several traffic data providers and INRIX’s excellent aggregation and technological capabilities, extensive coverage, and focus on traffic as their main product, will enable us to present the best traffic available in the world today”, said Motti Kushnir, Telmap Chief Marketing Officer.
“Telmap are a strategically important customer to INRIX,” said Stuart Marks, Senior Vice President of INRIX Europe. “Our efforts to combine the immediacy of community traffic reporting with our existing data will result in the delivery of critical information to the driver in a much more timely manner than available from other services today.”
Telmap reports that INRIX traffic information will be integrated into the Telmap Mobile Location Companion by the end of the year.
The first two satellites for Europe’s Galileo global navigation satellite system were lofted into orbit October 21 by the first Russian Soyuz vehicle ever launched from Europe’s Spaceport in French Guiana in a milestone mission, reports the European Space Agency (ESA).
The launch occurred one day after initially scheduled to resolve a problem with the ground-support fueling system.
The Soyuz VS01 flight, operated by Arianespace, started with liftoff from the new launch complex in French Guiana at 10:30 UTC on October 21. All of the Soyuz stages performed as expected and the Fregat-MT upper stage released the Galileo satellites into their target orbit at 23,222 kilometers altitude, 3 hours 49 minutes after liftoff.
The two Galileo satellites are part of the In-Orbit Validation (IOV) phase that will see the Galileo system’s space, ground, and user segments extensively tested. During initial operations, the satellites will be controlled by a joint ESA and CNES French space agency team in Toulouse, France. Once that week-long phase ends, the satellites will be handed over to the Ober-pfaffenhofen Galileo Control Centre near Munich, operated by the DLR German Aerospace Center, which will be responsible for routine operations. Operating the satellite payloads to provide navigation services will be the task of the Fucino Control Centre, near Rome, operated by Telespazio.
The next two Galileo satellites, completing the IOV quartet, are scheduled for launch in summer 2012. Together, alll four are intended to prove the design of the Galileo system in advance of the other 26 satellites.
These first four satellites, built by a consortium led by EADS Astrium Germany, will form the operational nucleus of the full Galileo satnav constellation. According to ESA, the satellites combine the best atomic clock ever flown for navigation — accurate to one second in three million years — with a powerful transmitter to broadcast precise navigation data worldwide.
Artist’s depiction of a Galileo satellites being ejected from the dispenser.
Second IIF Good Now
The second GPS Block IIF satellite, SVN63/PRN01, launched in mid-July, was finally set healthy on October 14. The delay in bringing the satellite into service was due, in part, to extended testing of the cesium atomic frequency standard (AFS) on the satellite.
GPS IIF satellites carry three AFSs: one cesium and two rubidiums. The performance of the cesium AFS, independently confirmed, was poor. A switch to one of the rubidium AFSs took place on October 5.
U.S. Agencies Speak Out on LightSquared; Others Hide Their Cards
The U.S. House of Representatives Committee on Science, Space, and Technology has released some of the impact statements provided by federal agencies to the National Telecommunications and Information Administration (NTIA). The reports reveal deep concerns about and opposition to the LightSquared proposal, and detail cost estimates and other adverse impacts to government-wide operations should it go forward.
The NTIA itself has refused to make these agency reports public, rebuffing a Freedom of Information Act (FOIA) request by GPS World magazine and, so far, giving the same response to congressional committees on both the House and Senate side.
Missing in Action. The House Committee does not yet have access to all the agency statements; still missing are those from:
the Department of Homeland Security,
the Department of Commerce,
the National Oceanic and Atmospheric Administration,
the National Institutes of Standards and Technology.
The House committee has written to those departments asking for their reports; GPS World has also filed further FOIA requests specifically with those agencies. The Department of Defense impact statement is presumed to be classified.
Seventy-Two Billion. The Federal Aviation Administration (FAA) impact statement is the strongest statement of those provided so far to the House committee. It asserts, among many other findings, that the LightSquared proposal would cost the aviation community at least $72 billion, preclude elimination/reduction of an estimated 794 air-traffic fatalities over the next 10 years, set back planned air-traffic safety and efficiency measures by that same period, affect U.S. leadership in aviation, and damage the international market for U.S. satellite technology.
“FAA cannot conclude that operations using just the lower portion of the spectrum are compatible with civil aircraft receivers without definition of LightSquared’s end-state deployment and further study,” the FAA said. “Proposed LightSquared deployment (both upper and lower channels by 2014) would result in an estimated aviation community cost impact of at least $72 billion and delay NextGen implementation by approximately 10 years.
“Proposed LightSquared operations would severely impact the efficiency and modernization of the safest, most efficient aerospace system in the world.”
Not Feasible. The National Aeronautics and Space Administration stated, in part:
“NASA feels that due to the severity of the operational impacts, to both government and commercial users, it is conclusive that LightSquared’s implementation on the upper 10-MHz is not feasible in the near or long-term.”
Constellation Updates from ION-GNSS
During the Civil GPS Service Interface Committee (CGSIC) meeting held in conjunction with the ION GNSS 2011 conference in September, several presentations were given on the status and future of the global navigation satellite systems. Here are highlights, with updated information from elsewhere:
GPS. As of today, 30 satellites are in operation and set healthy. SVN27/PRN27, a Block IIA satellite launched in 1992, was decommissioned on August 10, 2011. The satellite has been removed from broadcast almanacs but continues to transmit L-band signals, presumably for end-of-life testing.
SVN35 returned to active service, once again, this time as PRN30, on August 16, to replace SVN30/PRN30, which was decommissioned from active service on July 20. SVN35 is being moved to the B1-F slot, previously occupied by SVN30.
There are currently four backup or residual satellites: SVNs 30, 32, 37, and 49. SVN30 is deemed no longer usable and there are plans to dispose of it.
SVN24/PRN24, a Block IIA satellite launched in 1991 and the second oldest active GPS satellite, reportedly experienced a reaction wheel failure on September 30. It has stopped broadcasting L-band signals.
GLONASS. Currently, 23 GLONASS satellites transmit usable L-band signals; 22 are set healthy. The first GLONASS-K1 satellite is still undergoing flight tests and is set unhealthy. According to Sergey Revnivykh, deputy director general, Central Research Institute of Machine Building of the Russian Federal Space Agency, the satellite will likely not be set healthy for users in the near future, not even for just the legacy FDMA signals. It will be considered a backup satellite that could be pressed into service if necessary. This decision was taken based on the fact that five GLONASS-M satellites are scheduled to launch this fall — indeed, one did so on October 2 — and they should be adequate to maintain a healthy 24-satellite constellation for some time. The current GLONASS signal specification cannot handle more than 24 operational satellites.
QZSS. The Japanese press reported that a government ministerial council consisting of the entire cabinet and headed by Prime Minister Yoshihiko Noda has taken the decision to expand the Quasi-Zenith Satellite System to seven satellites and will seek 4.1 billion yen (about $53 million) in the fiscal 2012 national budget to start the process. According to Hiroshi Nishiguchi of the Japan GPS Council, QZSS has a top priority in the budget.
The future QZSS constellation structure is still under design. Nishiguchi stated that the constellation could involve a mixture of inclined geosynchronous orbit (IGSO) and geostationary Earth orbit (GEO) satellites. For a seven-satellite constellation, options include three IGSOs + four GEOs, or four IGSOs + three GEOs, or five IGSOs + two GEOs. He said that hopefully the funding and the future constellation structure will be known by the end of the year.
Beidou-2/Compass. A special Compass workshop (see also the October issue of GPS World) stated that there are nine Compass satellites “in service.” But that may not be correct. While nine Beidou-2 or Compass satellites have been launched, Beidou G2, the first GEO to be launched, appears to be uncontrollable and is in a librating orbit. Some reports, perhaps overly optimistic, claim this satellite is undergoing “in-orbit maintenance.”
The last IGSO satellite to be launched, Beidou IGSO4, may not be in service yet. One workshop presenter indicated that the currently used constellation consists of three GEOs and three IGSO satellites. It seems that the medium Earth orbit (MEO) satellite, Beidou M1, is not considered useful for actual applications at the present time. It was also stated that this satellite is undergoing “in-orbit maintenance.”’
Two more Beidou-2/Compass satellites are to be launched in 2011 and five satellites are to be launched in 2012 to bring the number of operational satellites to 14 by the end of 2012: five GEOs, five IGSOs, and four MEOs. This is a sufficient number of satellites to provide the planned regional Phase II service. A 30-satellite global service, expected by 2020, will reportedly use three GEOs, three IGSOs, and 24 MEOs.
Beidou-2/Compass will also offer a 1-meter level differential service.
A Beidou-2/Compass Interface Control Document (ICD) is to be published this month. As of press time for this magazine, it had not yet appeared.
GPS World’s eighth annual Leadership Dinner took place during ION-GNSS in Portland, and was sponsored by Litton Consulting Group, Sigtem Technology, and JAVAD GNSS. Excerpts from some of the speakers’ remarks appear here, as well as photos from the “You Bet Your System” after-dinner game, the first GNSS Sweepstakes, a group exercise in probabilistic and equestrian studies.
■ Col. Robert Hessin, National Coordination Office for Space-Based PNT.
From my perspective, we have not communicated well enough at a national level a vision for the future of spectrum management and customer access to emerging wireless technologies. The bottom line is, had we planned in 2001 to go deliberately down this path with MSS spectrum, I’m confident we would have found a way to co-exist by 2014.
■ Col. Bernard Gruber, GPS Directorate.
The NPEF test conducted in April was robust and comprehensive, involving over 100 receivers from 24 organizations, spanning military, government, aviation, precision agriculture, automotive, and general use communities. The results demonstrated empirically that the LightSquared terrestrial signals in their original deployment plan interfered with all types of receivers tested. The military results were consistent with results obtained by commercial GPS industry organizations such as Trimble, Garmin, and John Deere through their own independently conducted tests.
We stand ready to work with the NTIA and LightSquared to complete additional testing on the newly proposed deployment plan and receiver filter designs. We are conducting additional tests of cellular and general navigation devices on the LightSquared “Lower 10” MHz terrestrial and handset signals. We are also prepared to test filters proposed as mitigations for high-precision GPS receivers when they become available. As General Shelton stated in his recent congressional testimony, AFSPC remains open to ideas on mitigation strategies that will ensure continued GPS service to billions of users worldwide.
■ Günter Heinrichs, IFEN GmbH.
We in Europe follow very closely — and not without worry — the situation with regard to LightSquared difficulties. It would be very shortsighted for us to say that this problem will not concern us in Europe. Because all of us eventually sit in the same boat. Galileo signals will also be affected by the LightSquared problem — and not only in the USA. Due to the worldwide scarce frequency resources, the times are past that one can look at an application for a certain frequency spectrum in isolation. Decision-makers must sharpen their awareness of the effects their decisions will have on the surroundings, worldwide. In the future, avoidance or minimization of such problems can only be managed by unity and increased coordination of the different responsible stakeholders. We live in a globalized world — this must be taken into account at all future decisions. An early cooperation and coordination between all parties involved at all levels will be essential — also across border.
■ Jim Litton, Litton Consulting.
I want to speak of my pride in our industry, which is confronted with a manmade threat from forces that have support from politically and financially powerful special interests. My former colleagues in NavCom and John Deere have been highly instrumental in this effort. In this crisis, with its unreasonable time-line demands, the industry has pulled together, and competitors have worked with each other to meet the threat with evidence-based, scientifically sound testing and analysis as opposed to the obfuscation, historical distortion, backdoor influence, and fact-denial seemingly characteristic of the ethics of hedge-fund operators. Even some in our industry who are ambivalent about the trade-offs between the integrity of legacy systems and opportunity for new sales have acted with propriety, openness, and respect for the truth. Millions have been spent, and program schedules delayed, to respond in this manner.
■ Greg Turetzky, CSR.
The basics of the problem are that the current rules in the FCC do not provide sufficient protection for GPS. Lightsquared is not the first group to go to the FCC and propose a change to the plan that meets the rules, but still degrades GPS performance. Remember UWB? If we don’t want to have to keep raising our hand and saying, “I know it follows the rules, but we are special,” we should work to change the rules. I would like to see our industry get together and propose any changes that are needed to the FCC. Let’s not forget that this is an international problem. As Tony Pratt reminded me, we could also take this to the ITU. The rules were created to protect one communication system from another. The rules we need would protect a below-the-noise navigation system from a high-power communication system.
■ Javad Ashjaee, JAVAD GNSS.
Spectrum is getting congested, and we cannot assume the luxury that we had can continue any longer. We should not be selfish and expect all others to stay away from us because their smell bothers us! Every GNSS receiver should put in a good filter so that others can coexist near us.
LightSquared is a very nice complement to GNSS. It can provide a nice communication channel for our RTK. If military receivers cannot tolerate LightSquared, how can they survive electronic warfare? If an enemy puts LightSquared-like transmitters in the theater of operation, our military equipment gets affected? Military units with P-code are more sensitive than JAVAD receivers that use encrypted P-code? Starting today, everything JAVAD GNSS ships will be LightSquared-hardened, or eligible for free upgrade later.
Mike Swiek (U.S. GPS Industry Council) and Stuart Riley (Trimble).
You Bet Your System
Over dessert and coffee, 150 VIP dinner guests played the ponies: six races, with horses from five GNSS racing stables.
Track stewards Ismael Colomina (Institut de Geomàtica) and Allison Kealy (University of Melbourne) get instructions and prepare to sell tickets.
Mike Shaw (Lockheed Martin) appreciates Jane Wilde’s (European PNT Industry Council) all-in bet.
Tom Hunter (JAVAD GNSS) sees his horse lose by a nose.
Sherman Lo (Stanford), Logan Scott (consultant), and Alan Grant (UK General Lighthouse Authorities) peruse the racing card: “We devised a betting strategy that left us flat broke.”
Compass delegates Yuanxi Yang (China National Administration of GNSS and Applications) and colleague Jing Tang enjoyed the evening — and now plan a GNSS racing event in China — with Fang Sheng (Raytheon).
Gard Ueland (Kongsberg Seatex and Galileo Services) holds a winning ticket, flanked by Grace Gao (Stanford) and Gordon Dale (NovAtel).
Eric Gakstatter counts his winnings as Allison Kealy and Alan Cameron frantically make payouts to Antje Tucci (IFEN GmbH), Rick Hamilton (CGSIC), and Dorota Brzezinska (Ohio State University).
Track stewards Sasha Mitelman (consultant), Fabio Dovis (Politecnico di Torino), and Michael Glutting (JAVAD GNSS).
Mitch Narins (FAA) puts his last dollar down on a bet with Di Qiu (Sigtem).
Col. Bernie Gruber (GPS Directorate) and Ron Hatch (NavCom) celebrate their onscreen winner; trackmaster Sam Pullen (Stanford) at the controls on right.
Following my column last week about technology changing the future of automobile travel, resulting in safer travel, I received an e-mail from a software safety engineer. I’m sure some of you, or maybe many, share his view.
Pardon my cynicism, Erik:
But as a software safety engineer and one who has experienced the “tunnel vision” that arises when driving a car containing all the high-tech gadgetry modern autos have to offer, and…… having a boss that experienced a “runaway” Mercedes due to a computer failure (fortunately nobody was hurt), and…. having followed the Air France Airbus 340 that crashed in the Atlantic Ocean due to a confused computer, pardon me if I don’t share your enthusiasm. Yes, we all love high-tech gadgets but, personally, most people I know don’t want to have to read a 200-page book to figure out how to operate them and can never remember how to operate the lesser used features after a short hiatus. What you are talking about is probably going to be operating in background with little operator intervention, but I get weary [sic] of safety features controlled by software that cannot be disabled by the operator, and we are moving more in that direction. The other thing that bugs me is this Trans Core Gadget for infrastructure-less tolling. I’m all for easier toll paying but, these folks who invent things that ultimately allow big brother (state, local, federal governments) to poke their noses into my business (to see how fast I go and where I go and, ultimately, use that information to conjure up more “safety” laws telling me how, when, where to drive and, confiscating my money when I don’t drive the way the control freaks and politicians want) REALLY IRRITATE ME! Please thank Trans Core for developing yet another Orwellian black box, and ask them if they could possibly develop something useful that does NOT promote more government intrusion into our lives next time!
True, I do ooze a bit of enthusiasm when seeing how technology can make our lives more efficient. That’s how I roll. But, I do see the points that he makes. I think it’s important to note that on the vehicle-to-vehicle (V2V) communications demonstration that I took part in, it was all about situational awareness without taking any control from the driver. For example. if there is a vehicle in your blind spot, an indicator will illuminate if you activate your turn signal to change lanes in that direction. In another example, if you’re approaching an intersection and the V2V communications senses a vehicle approaching the intersection at such a speed that it’s unable to stop safely, an alarm will sound that gives you a warning. In still another example, one vehicle had an LCD panel on the dashboard that showed potential accidents. Take a look at the Youtube video I shot from the back seat of a car equipped with V2V communications at the ITS World 2011 conference in Orlando, Florida. It’s all about warning the driver of a potential collision, not taking control of the vehicle.
~8:13 minute video I shot from the back seat of a test car (outfitted with V2V communications) driven by a professional driver. You can see the indicator on the side mirrior when there’s a vehicle in the blind spot. You can also make out (sort of) the graphic LCD on the center-top of the dashboard showing the location of vehicles around ours.
Regarding the smart car I wrote about last week that automatically comes to you when you press a button on the remote, that’s more futuristic. Of course, when you start talking about unmanned vehicles moving around, it better be a fool-proof system with back-ups upon back-ups. But with high-speed laser range-finders and other sensors, it’s possible to have multiple back-ups. I agree, however, that this technology must mature a lot before it is implemented.
Some other photos of the intelligent vehicle demonstration at the Disney World Speedway.
The demonstrations were conducted using professional drivers
Big Brother
Ah, yes, I guess I’m a bit more of an optimist. I’m willing to give a little to big brother to reap the benefits of spending less time at the toll booth. That’s just me. I’m of the same opinion when it comes to consumer LBS (location-based services) applications on my smart phone. There’s definitely a risk to using them, but for me there’s enough significant upside that it’s worth the risk. I’m not giving away access to my bank account, but I’m willing to risk giving up my location to my “personal network” in order to benefit from it.
I wrote quite a bit about location privacy quite a few months ago. You may want to take a look at the one I wrote entitled Location Privacy is Heating Up.
When I first heard of IFEN, it was a competitor on the EGNOS and Galileo programs that NovAtel was trying to get into. Each ITT (Intention To Tender) that our team in Calgary bid on, we were to be weighed against what IFEN or Septentrio had proposed.
NovAtel did eventually capture its first study contract, and has now gone on to play a significant role on both programs, while a number of European GNSS start-ups have gone on to become contenders on the worldwide GNSS market.
This article focuses on IFEN — a company that may be not well known in North America. Sure, its representatives show up at ION and the company usually has one of those very large booths, which is sometimes shared by German provincial sponsors. But who are these guys and where did they come from? Well, its obvious that they come from Germany, in Bavaria, somewhere near Munich, but how come they have such a GNSS presence and where does all that technology come from?
IFEN in my mind was always associated in the past with Günter Hein and the University of Munich — its academic association was actually with the Institute of Geodesy and Navigation University FAF (Federal Armed Forces) Munich, and Günter was indeed one of the founding members of the company. Now time has moved on, and Günter has left for European Space Agency (ESA), EGNOS, and other things, but IFEN still flourishes with a team of around 40 people, 90 percent of whom are scientist/engineer types — the company has added around 30 people over the last eight years.
IFEN’s business model is based on continuing participation in ESA/European Community (EC) projects, with commercial products currently contributing only around 20 percent of its revenues. As any company working to make a living in the GNSS industry can attest, it takes a huge amount of effort to get products to market, and what seems like as much effort to ensure successful sales and continuing customer support. On the world stage it takes a lot to be a successful GNSS product supplier, and IFEN appears to have broken through into the commercial GNSS world market.
IFEN GPS/Galileo/GLONASS simulators have been successfully fielded around the world by some very substantial organizations, including the recent purchase by Space Applications Centre (SAC) of India, who will use IFEN’s multi-constellation, multi-frequency RF navigation constellation simulator for development and testing of the Indian Regional Navigation Satellite System (IRNSS). IRNSS is being developed as an L5/S-band constellation, so IFEN’s simulator will provide initial L5 capability, with a later option to add S-band. It’s expected that the SAC engineering group will likely use the simulator in connection with IRNSS satellite payload development.
So what makes up the majority of IFEN’s business? Since 1999 IFEN has played a growing role in the study, development, fielding, and testing of EGNOS, followed closely by its involvement in Galileo in 2000.
A large number of projects have been undertaken, ranging from pure research on algorithms and receivers, through to system and receiver prototyping and fielding of operational system elements. A cornerstone at IFEN was the invention of “memory codes” for Galileo, which are now part of the Galileo E1 and E6 signals.
We’re all basically familiar with the large GATE outdoor signal test range near Sultzberg, right? But it’s probably not well known that work has been underway since 2002, and significant system proving has now culminated in the formal, third-party certification of GATE for use as a Galileo open-air test laboratory — GATE can also perform receiver integrity testing (RAIM) for safety of life (SOL) applications. This means that any receiver manufacturer can now benefit from access to realistic Galileo Signal-in Space transmissions in an actual representative outdoor setting. After simulation testing in the lab, this IFEN-managed facility can provide manufacturers with a real stress-test for Galileo receivers.
A little imagination may be required for ionospheric effects modeling, but this is now a qualified facility with all the anticipated Galileo services (OS, SOL, CS, and PRS) available even before we have improved IOV satellite coverage — the successful Soyuz launch of the first two IOV satellites from Kourou, French Guiana, has happened just as I write this story.
The roots of IFEN lie in the EGNOS “Independent Check-Set” algorithms and prototype development, starting with EGNOS Version 1 in 1998 through to the current operational Safety of Life certified EGNOS Version 2, and leading up to the next-generation EGNOS Version 3. IFEN was the very first company in Europe to have developed ground-based integrity monitoring algorithms and software prototypes. The Independent Check-Set is core software at the heart of EGNOS that monitors critical EGNOS system parameters and provides out-of-tolerance alarms if integrity should be compromised. Significant development, prototyping, and evolution of algorithms over many years have lead to incorporation in the certified, operational EGNOS Version 2 system. Significant work is still ongoing in defining and prototyping of the next-generation multi-constellation capable EGNOS Version 3 SBAS system.
In parallel with work on EGNOS, IFEN continues to work within four of the six Galileo IOV segments. IFEN has provided substantial contributions to:
System Segment: related to integrity, SIS verification, and development of the Galileo UERE Monitoring Facility (UMF).
Space Segment: providing test receivers for the Galileo IOV payload test system.
Ground Mission Segment: providing algorithms and prototyping for Galileo integrity.
Operations: providing the verification receiver for Galileo IOV “In-Orbit-Tests.”
These are projects in which IFEN worked with most of the Galileo prime contractors, under projects sponsored by those contractors, and also with the European Union, DLR (German Aerospace Center), ESA, and the EC.
So following the European model, a small German start-up was able to rub elbows with most of the major key players in Europe, and over time has been able to develop an arsenal of GNSS technology. Project management skills, leading technology, international marketing experience, and of course commercial products have all successfully emerged from this European incubation process.
When Europe did its homework before turning on the investment taps to fund EGNOS and Galileo, the strategy leading to a sovereign satellite navigation system not only involved ensuring that Galileo was independently controlled by Europe, but that a European GNSS industry would also develop and supply that system. And in the process a European GNSS industry would be developed which would compete on the global stage to share in the global revenues that companies in the GNSS industry has previously enjoyed outside Europe.
Sure, there have been many stumbles and delays, as Brussels tried initially to make this less costly and painful for its member states through a Public Private Partnership that didn’t work out — some people would even say that this money spent by the bureaucrats was totally wasted and could have gotten the system up and running almost a decade earlier. And revenues would have flowed back into European treasuries much sooner as products and services generated jobs and government taxes. But hey, we’re finally seeing that happen as companies like IFEN get some real traction in the global GNSS marketplace.