Category: Applications

  • Surveyors: Always in the ‘middle’ of something…

    Surveyors: Always in the ‘middle’ of something…

    Image: U.S. Census Bureau
    Image: U.S. Census Bureau

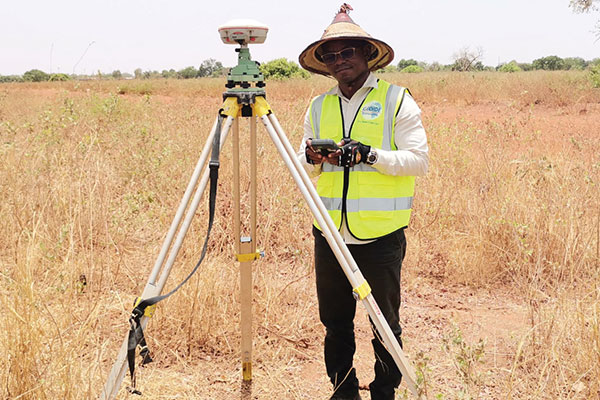
    The surveying profession is intrinsically involved with many functions of today’s communities and environment. When we take a closer look at the roles we play, the surveyor is usually found in the middle. Here are a few examples.

    • For new developments and infrastructure, surveying takes place after a client decides to begin a project. Site data must be collected, drafted and presented to the client, engineers and architects for design.
    • Upon completion of the engineering design, the surveyor provides layout services for the construction company to build the structure.
    • Once the improvements are completed, the surveyor provides surveys as well as record drawings for confirmation of construction to satisfy government agencies and financial backers.
    • In a property dispute, the surveyor becomes the center of attention — our professional opinion determines the correct location of the subject boundary.

    This responsibility also extends to the geospatial sectors within the surveying profession. Data collection is a critical step to creating and maintaining efficient geographic information system (GIS) databases that correctly depict existing infrastructure and parcel boundary layers. With the surveyor at the center of many of these duties and tasks, no wonder that we sometimes feel we have a bullseye on our backs.


    Knowing how to compute the center is an important aspect of the surveyor’s duty.


    However, the word center takes on a different connotation when it comes to data and objects. Properly identifying the center of specific sets of data or objects is important when working with construction information and geospatial data. Properly measuring and marking the center of an installation has its challenges, so knowing how to compute the center is an important aspect of the surveyor’s duty.

    Why is the center of an object important?

    Every object that is definable in a two-dimensional space has a physical center. Whether the object is a regular or irregular polygon in plane geometry, there are various methods for determining its center.

    Figure: Tim Burch
    Figure: Tim Burch

    These figures are easy to understand and simple to solve. More complex figures require more calculations, including coordinate geometry.

    Figure: Tim Burch
    Figure: Tim Burch

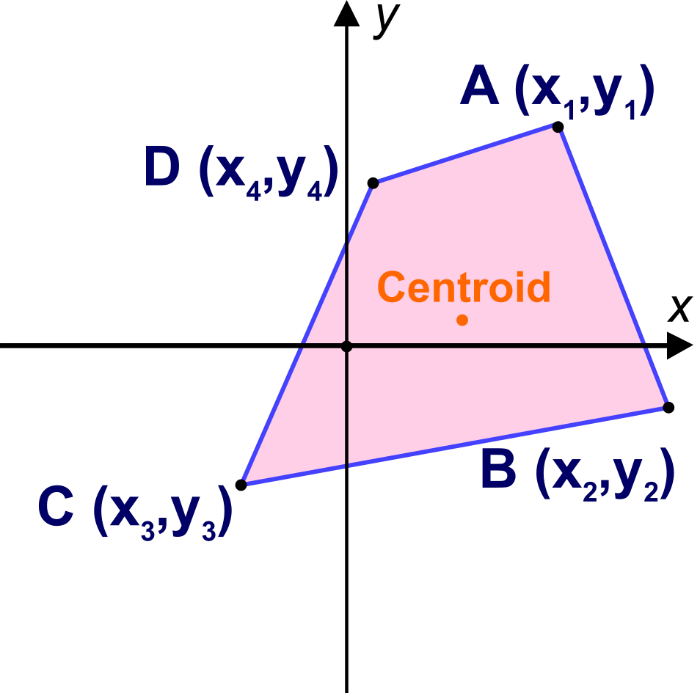
    These examples of regular and irregular polygons have something in common: all are based upon two-dimensional space, which is flat. But what happens if we need to determine the center of a shape that does not fall on a 2D surface? What if the data being reviewed for a center resides on a spherical surface and contains diverging axes?

    As surveyors, we break our work down to smaller coordinate systems to work around the fact that our data resides on a spherical surface, but some datasets require the information to remain as latitude and longitude. One dataset is population counts, otherwise known as the census.

    The U.S. Census and the ‘center of population’

    The U.S. Census Bureau has been at work since early colonial times. This excerpt from the bureau website explains its purpose and foundation.

    The U.S. Constitution requires only that the decennial census be a population count. Since the first census in 1790, however, the need for useful information about the United States’ population and economy became increasingly evident.

    The decennial census steadily expanded throughout the nineteenth century. By the turn of the century, the demographic, agricultural, and economic segments of the decennial census collected information on hundreds of topics. The work of processing these data kept the temporary Census Office open for almost all the decades following the 1880 and 1890 censuses.

    Recognizing the growing complexity of the decennial census, Congress enacted legislation creating a permanent Census Office within the Department of the Interior on March 6, 1902. On July 1, 1902, the U.S. Census Bureau officially “opened its doors” under the leadership of William Rush Merriam.

    Counting the citizens of the United States was one thing, but mapping them was another. Once the final count was completed and mapped, the information was used to determine a unique location: the center of population. Here is more from the Census Bureau on the calculation basis:

    The concept of the center of population as used by the U.S. Census Bureau is that of a balance point. The center of population is the point at which an imaginary, weightless, rigid, and flat (no elevation effects) surface representation of the 50 states (or 48 conterminous states for calculations made prior to 1960) and the District of Columbia would balance if weights of identical size were placed on it so that each weight represented the location of one person.

    More specifically, this calculation is called the mean center of population.

    This sounds like an easy exercise for a room of mathematicians and mappers, right? On the contrary, my fellow geospatialists!

    How do they determine the center of population?

    Computing the center of population for the United States would be much easier if we existed on a two-dimensional plane, as previously discussed. Since we don’t, however, it requires a much more difficult method of calculation to get us closer to a real-world solution:

    To avoid unduly complex factors in the computations, the mathematical formulae used were those that would be precise for a true sphere. On such a sphere, the north-south distances between parallels of latitude are identical and distances in degrees may be used as units of distance. On the other hand, distances between meridians on longitude lines are not constant but decrease from the equator toward the poles. However, if the length of one degree along the equator is used as the unit of measurement, then the length in degrees of an east-west line at any other latitude can be adjusted to the measurement standard by multiplying by the cosine of the latitude.

    The center of population computed by the Census Bureau is the point whose latitude (𝜙) and longitude (λ) satisfy the equations:

    population equation

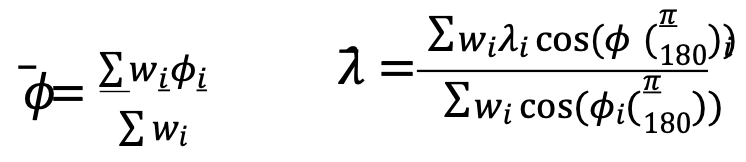
    where 𝜙𝑖, 𝜆𝑖 and 𝑤𝑖 are the latitude, longitude and population attached to the basic small units of area used in the computation.

    Stated in less mathematical form, the latitude of the center of population was determined by multiplying the population of each unit of area by the latitude of its population center, then adding all these products and dividing this total by the total population of the United States. The result is the latitude of the population center.

    East-west distances were measured, or computed, in substantially the same manner, but with the inclusion of a correction for latitude. For these distances, a degree of longitude at the equator was the unit of measurement. East-west distances along the equator could be measured in degrees, but any east-west degree distance north of the equator — where all the United States is located — had to be adjusted to recognize the convergence of meridians toward the poles. This adjustment required that each east-west distance, stated in degrees of longitude, be multiplied by the cosine of the latitude. This mathematical relationship is precise for a sphere and a very close approximation for the earth.

    The computation required that the longitude of each of the thousands of selected points be multiplied by the cosine of the latitude of the point and by the population associated with the point. These products were added and divided by the sum of the products for the same thousands of points, each of which was obtained by multiplying the cosine of the latitude of a point by the appropriate population figure. The result was the longitude of the center of population.

    (Courtesy of the Geography Division, U.S. Census Bureau, published November 2021)

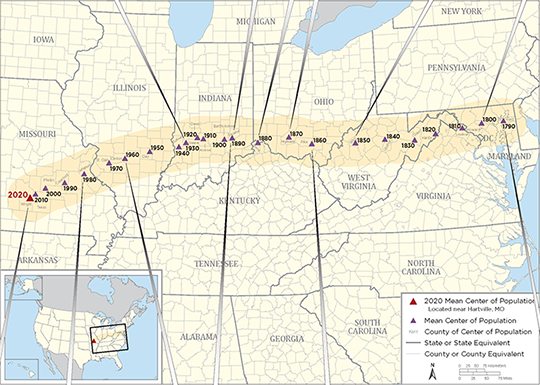
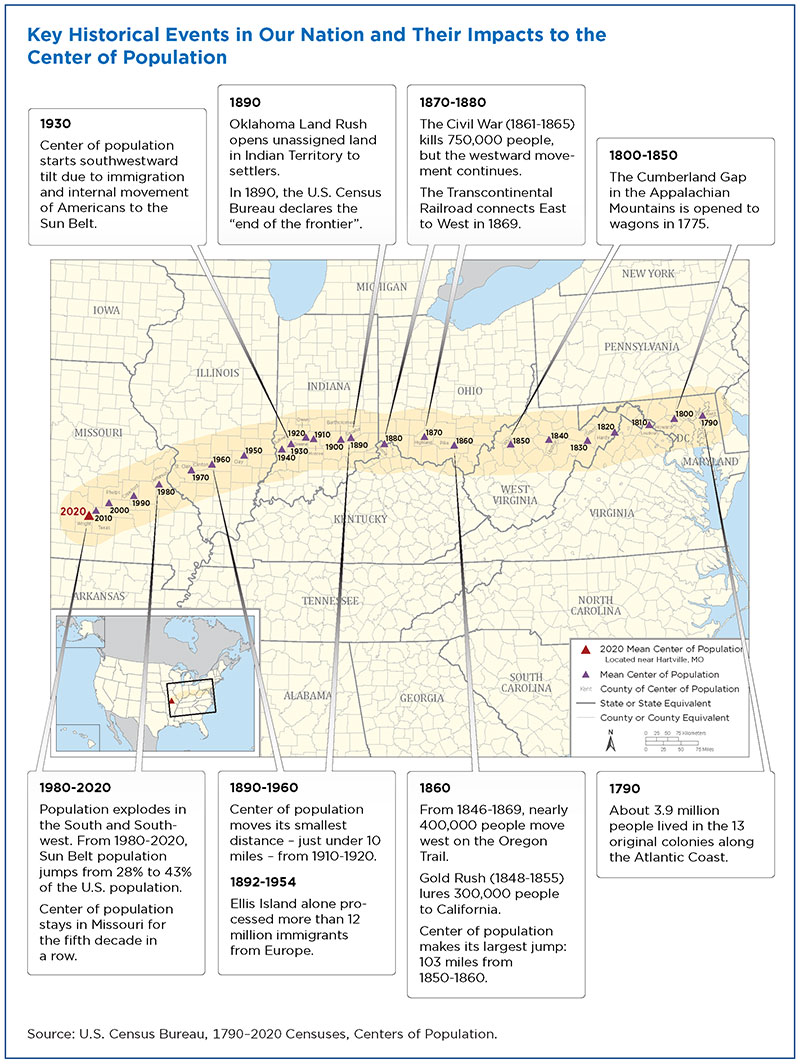
    Here is a graphic from the U.S. Census identifying significant historical events along with the westward movement of the center of population:

    Image: U.S. Census Bureau
    Image: U.S. Census Bureau

    Here are the locations with corresponding latitude/longitude for the centers from 1790 to 2020:

    Mean Center of Population of the United States, 1790–2020
    Census year North latitude West longitude Approximate location
    United States
    2020 37.415725 92.346525 Wright County, MO, 14.6 miles northeast of Hartville.
    2010 37.517534 92.173096 Texas County, MO, 2.7 miles northeast of Plato.
    2000 37.69699 91.80957 Phelps County, MO, 2.8 miles east of Edgar Springs.
    1990 37.87222 91.21528 Crawford County, MO, 9.7 miles southeast of Steelville.
    1980 38.13694 90.57389 Jefferson County, MO, 1/4 mile west of DeSoto.
    1970 38.46306 89.70611 St. Clair County, IL, 5 miles east-southeast of Mascoutah.
    1960 38.59944 89.20972 Clinton County, IL, 6-1/2 miles northwest of Centralia.
    1950 38.80417 88.36889 Clay County, IL, 3 miles northeast of Louisville.
    Conterminous United States
    1950 38.83917 88.15917 Richland County, IL, 8 miles north-northwest of Olney.
    1940 38.94833 87.37639 Sullivan County, IN, 2 miles southeast by east of Carlisle.
    1930 39.06250 87.13500 Greene County, IN, 3 miles northeast of Linton.
    1920 39.17250 86.72083 Owen County, IN, 8 miles south-southeast of Spencer.
    1910 39.17000 86.53889 Monroe County, IN, in the city of Bloomington.
    1900 39.16000 85.81500 Bartholomew County, IN, 6 miles southeast of Columbus.
    1890 39.19889 85.54806 Decatur County, IN, 20 miles east of Columbus.
    1880 39.06889 84.66111 Boone County, KY, 8 miles west by south of Cincinnati, OH.
    1870 39.20000 83.59500 Highland County, OH, 48 miles east by north of Cincinnati.
    1860 39.00667 82.81333 Pike County, OH, 20 miles south by east of Chillicothe.
    1850 38.98333 81.31667 Wirt County, WV, 23 miles southeast of Parkersburg.
    1840 39.03333 80.30000 Upshur County, WV, 16 miles south of Clarksburg. Upshur County was formed from parts of Barbour, Lewis, and Randolph Counties in 1851.
    1830 38.96500 79.28167 Grant County, WV, 19 miles west-southwest of Morefield. Grant County was formed from part of Hardy County in 1866.
    1820 39.09500 78.55000 Hardy County, WV, 16 miles east of Moorefield.
    1810 39.19167 77.62000 Loudoun County, VA, 40 miles northwest by west of Washington, DC.
    1800 39.26833 76.94167 Howard County, MD, 18 miles west of Baltimore. Howard County was formed from part of Anne Arundel County in 1851.
    1790 39.27500 76.18667 Kent County, MD, 23 miles east of Baltimore.

    Data: U.S. Census Bureau

    Not to be confused with the geographic center…

    The geographic center of area is the point at which the surface of the United States would balance if it were a plane of uniform weight per unit of area. That point, approximately 44.967° north latitude and 103.767° west longitude, is located west of Castle Rock in Butte County, South Dakota, as it has been since Alaska and Hawaii became states.

    The geographic center of the conterminous United States (48 states and the District of Columbia) is located near Lebanon in Smith County, Kansas, at approximately 39.833º north latitude and 98.583º west longitude.

    The center of population as geospatial data

    The plotting of the center of population makes for an interesting study of westward expansion in early U.S. history. Once the contiguous 48 states were founded, plotting the center shifts to regional changes . The truly interesting part of these calculations and plotting for the past several centuries falls into an area of expertise called geospatial data.

    While some liberties were taken early on using large, populated areas as one data point, we now can count literally every person and their geospatial location. However, it needs to be recognized that early efforts to count our population and track its center every 10 years meets the criteria for being called geospatial data. They just didn’t yet know what that meant.

    Speaking of surveyors…

    Here are several events and initiatives happening this month, an important month for surveyors.

    logo-natl surveyors week

    2022 National Surveyors Week

    National Surveyors Week was established by the National Society of Professional Surveyors as an annual event to bring public recognition to the surveying profession and the vital services surveyors provide to the advancement and betterment of human welfare.

    During this week, thousands of professional surveyors throughout the country will take part in local activities designed to introduce a new generation to the profession and highlight the use of technology in their day-to-day work.

    Activities for National Survey Week (or anytime!)

    1. Have a Survey Day at your local mall.
    2. Sponsor a Trig-Star Test: www.trig-star.com.
    3. Conduct a Scouts Merit Badge event.
    4. Obtain a proclamation from your state or local government.
    5. Organize geocaching or benchmark hunting: Geocaching.com.
    6. Try surveying mark recon: SurveyMarkHunting.pdf.
    7. Help with the National Geodetic Survey’s GPS on Benchmarks Campaign: GPS on BMs

    For more ideas on how to get involved, visit National Surveyors Week 2022.

    Photo:


    2022 Global Surveyors’ Day

    Global Surveyors’ Day 2022 will be held Monday, March 21. This annual event is a way to globally recognize groundbreakers, pioneers, individuals and the industry that has shaped our history and continues to be of great value to our communities.

    2022 Global Surveyor of the Year

    Image: NSPS
    Image: NSPS

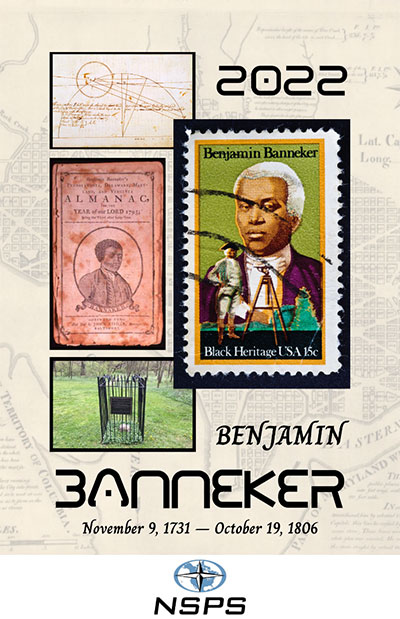
    As part of the Global Survey Day and National Surveyors Week, every year on March 21 a professional surveying association is tasked with choosing a Global Surveyor of the Year. For 2022, the National Society of Professional Surveyors has been selected to choose a person with a historical surveying background for this prestigious honor. After thorough consideration, NSPS has chosen Benjamin Banneker (1731–1806) for 2022 Global Surveyor of the Year.

    The selection was brought before the NSPS Board of Directors during our Spring 2021 meeting and passed by a majority vote. While Banneker’s career as a surveyor was limited in time and experience, his additional contributions to math, science, astronomy and publication of a groundbreaking almanac have earned him a significant place in American history.

    We also selected Banneker because of his ability to overcome the adversity of being a free Black man in early colonial America. Through much self-teaching, he was able to excel at the contributions previously listed in a period when Blacks were not accepted for their educational abilities.

    The selection committee chose Banneker over the three presidents who are famously chiseled on Mount Rushmore and Henry David Thoreau, an author who also surveyed to fund his writing career. The committee felt that Banneker’s contributions not just to the surveying profession made him deserving of this honor, but considered his total body of work created when Black men were not generally accepted as capable human beings. Our world needs more people like Benjamin Banneker and would be a better place because of them.

    No time like the present to promote our geospatial professions

    Surveying and geospatial careers are more important than ever, so examples like the center of population help depict applications that us these skills. Please consider promoting our wonderful professions during these events and throughout the year. The profession you promote may provide an opportunity to bring new faces and ideas to our ranks very soon.

  • Swift Navigation and Taoglas partner on precision GNSS solutions

    Swift Navigation and Taoglas partner on precision GNSS solutions

    Partnership to bring integrated precision GNSS solutions to automotive and industrial customers

    Swift Navigation, a San Francisco-based GNSS firm, and Taoglas, a provider of internet of things (IoT) solutions, have announced a strategic partnership to integrate their technologies to deliver pre-tested, low-risk, high-precision GNSS solutions to a broad customer base.

    The Taoglas EDGE RTK Starter Kit has high-precision GNSS with U.S. 4G/3G cellular connectivity. (Photo: Taoglas)
    The Taoglas EDGE RTK Starter Kit has high-precision GNSS with U.S. 4G/3G cellular connectivity. (Photo: Taoglas)

    The partnership will provide positioning solutions for automotive, micromobility, delivery, robotic and industrial customers. Specifically, the Taoglas EDGE Locate IoT platform and EDGE RTK Starter Kit now come pre-integrated with Swift’s Skylark precise positioning service.

    Bringing pre-integrated, high-accuracy positioning products to these industries in an easy-to-implement solution will greatly improve the accuracy of the positioning data delivered, the companies state.

    Together, Swift and Taoglas deliver high-precision GNSS solutions to customers around the globe by utilizing Taoglas’ IoT platforms and Swift’s Skylark seamless, cloud-based corrections — available in advanced SSR (state space representation) or industry-standard formats. The pre-integration allows customers to bypass module-level validation, integration and engineering efforts with an out-of-the-box solution.

    “Swift Navigation is excited to begin this partnership with Taoglas and align our visions of making accurate positioning easily accessible across industries,” said Swift CEO Timothy Harris. “We look forward to offering our products as an integrated solution to make it easier for customers across the globe to benefit from affordable and accurate positioning.”

    “We are delighted to be partnering with Swift Navigation to enable companies to overcome the challenges of delivering their high-precision positioning-based IoT solutions.,” said Ronan Quinlan, co-founder and joint CEO of Taoglas. “Our worldwide team of design, development, test and manufacturing engineers is dedicated to delivering IoT software and hardware solutions on time, the first time, for leading technology enterprises.”

    Additional products will soon be available from Swift, Taoglas and their channel partners. Customers have the ability to pre-order now by contacting [email protected] or [email protected].

  • Taoglas launches small 9-in-1 GNSS+5G antenna at MWC

    Taoglas launches small 9-in-1 GNSS+5G antenna at MWC

    The MA990 Guardian GNSS antenna. (Photo: Taoglas)
    The MA990 Guardian GNSS antenna. (Photo: Taoglas)

    Taoglas announced its smallest 9-in-1 combination antenna with dual-band GNSS and high-performance 5G/4G, the Taoglas MA990 Guardian.

    Taoglas made the announcement at Mobile World Congress (MWC) Barcelona 2022, which takes place  Feb. 28–March 3; Taoglas is exhibiting at booth #5E32.

    The Taoglas MA990 Guardian antenna is a small 9-in-1 combination antenna with dual-band GNSS (L1/L2) and globally supported cellular (5G/4G). It has been designed to support emerging market demand for modules that cover specific 5G/4G bands.

    For example, two of its eight cellular MIMO antennas cover from 600 to 6,000 MHz, while another two are optimized for 3,000 to 6,000 MHz to cover high-band 5G and C-band/CBRS applications. The product is designed to operate on all carrier networks globally and is future-proofed to work with latest 5G routers in the market.

    Housed in a low-profile, robust, IP67-rated waterproof, adhesive-mount external enclosure, the MA990 is designed for space-constrained, mission-critical applications, including asset and vehicle tracking, first- responder vehicles and high-definition video sources such as surveillance cameras.

    The Taoglas MA990 also is highly customizable, including for any variation of antennas below 9-in-1 and the addition of Wi-Fi/single-band GNSS.

  • ComNav Technology: Surveying in urban conditions

    ComNav Technology: Surveying in urban conditions

    A surveyor in Burkina-Faso surveys the site of a new hospital for infectious diseases. (Photo: ComNav)
    Surveyors used ComNav equipment to construct a hospital in Burkina Faso. (Photo: ComNav)

    Line of sight to GNSS satellites is sometimes obscured by buildings and trees, which also cause multipath, as does nearby water. These conditions require an RTK receiver with multipath mitigation. Often, surveying must occur on property corners or on uneven ground, where it is hard to place surveying equipment. For these reasons, reliability and accuracy are essential, especially in harsh environments. Ground control points require 1-2mm accuracy and topo surveys 1-2cm accuracy. Surveying for AEC also requires software that processes digital files.

    ComNav has focused on GNSS core technology innovation and applications for 10 years. The Quantum III technology includes algorithms to suppress multipath and supports all GNSS constellations, allowing the users to acquire and keep RTK centimeter accuracy even in harsh environments. The built-in tilt IMU will help where the exact location to be surveyed is hard to reach. For example, the T300 Plus and N Series GNSS receivers support a maximum pole tilt of 60° and keep the compensation accuracy within 2.5cm, making the field work more efficient, convenient and reliable.

    With the Survey Master software’s stake-out points, users can import DXF or DWG files directly and the software can stake out the point, line and surface in CAD.

    In April 2021, the government of Burkina Faso used ComNav GNSS T300Plus to provide ground control points survey for the construction of a hospital.

    The land security and topographic surveying were completed within only six days, less than half the time that had been scheduled for those tasks. This greatly expedited the construction of the hospital and helped with the fight against infectious diseases, including COVID-19.  

  • Building with precision: Surveying for architecture, engineering & construction

    Building with precision: Surveying for architecture, engineering & construction

    In recent years, the architecture, engineering and construction (AEC) industry has benefited greatly from growing GNSS accuracy, smaller laser scanners, UAVs, and more efficient management, collaboration and visualization software. We asked five companies operating in this space to address three questions:

    • What are the key challenges of surveying for the AEC industry today, compared with traditional boundary surveying and other types of surveying?
    • Which of your products are particularly relevant for this kind of surveying?
    • What was a recent AEC surveying success story?

    In the following articles, five companies briefly describe their experience with the AEC industry:

    JAVAD GNSS: A surveyor’s perspective by Shawn Billings

    Nearmap North America: AEC firms use aerial mapping to share in infrastructure funding by Tony Agresta

    Leica Geosystems: The surveyor as a data manager by Richard Ostridge & Shane O’Regan

    CHC Navigation: The rise of digital-twin models Francois Martin

    ComNav Technology: Surveying in urban conditions by Jania Zhu

    Featured Photo: CHCNav

  • CHC Navigation: The rise of digital-twin models

    CHC Navigation: The rise of digital-twin models

    Photo: CHC Navigation
    Photo: CHC Navigation

    Increasing urbanization is creating pressure to manage housing, utilities and infrastructure holistically. Hence the concept of digital twins. Digital twins enable the integrated operation and maintenance of any geospatial asset to meet the increased demand for efficient and intelligent transportation systems, the green expansion of urban areas and sustainable infrastructure.

    Traditional GNSS or optical measurement instruments no longer suffice to capture all the necessary information in a timely manner and with the right levels of detail. Integrating technological advances — GNSS, inertial systems, lidar sensors and 360° spherical imagery — into a single mobile-mapping system has greatly increased the ability to produce complete 3D models with high accuracy and precision. Mobile mapping also directly reduces workload, lowers project costs, simplifies data use, and provides reality-based design.

    Mobile mapping surveys have been proven to be four to 10 times faster and three to seven times less expensive than traditional methods, delivering the required results up to three times faster. Integrated, multi-platform mobile-mapping solutions bridge the gap between the real world and the digital world for greater interoperability and accessibility of data in near real-time.

    The high-accuracy and cross-platform design of CHC Navigation’s AlphaUni 900 lidar system provides an innovative solution for 3D spatio-temporal data acquisition, which is necessary for the digital transformation of the AEC industry.

    Smart Cities

    After developing for more than a decade, digital-twin technology is now a complex and comprehensive technical system to support the construction of new smart cities. It is an advanced model for the continuous innovation of urban development and a future form of modernization combining the virtual and real worlds. The creation of digital-twin cities brings to the forefront high-level topographic tools capable of providing comprehensive, multi-dimensional, large-scale, high-resolution data sets.

    To illustrate typical digital-city projects, CHC Navigation conducted a proof-of-concept demonstration in the Jinshan District of Shanghai, which covers an area of about 600 square kilometers. This area has rich terrain features and characteristics typical of large modern cities, such as tall buildings, power lines, rivers and vegetation.

    Versatile and easy-to-use platforms are essential for the democratization of lidar systems. Capturing 3D data with a single-platform lidar system can leave some areas blank in the point-cloud data. The AlphaUni900 lidar solution, with its multi-platform capability, can easily capture complete data from a UAV, car, backpack or unmanned surface vessel (USV) and provide a sophisticated and comprehensive 3D model. The AlphaUni 900 integrates seamlessly with real buildings, provides exterior and interior mapping, and dramatically changes the way high-precision data is collected.

    The derived 3D models can be easily merged and correlated with social or economic spatial data, for example from building-integrated internet of things (IoT) and cloud computing data. As a result, complex operations can be optimized in real time, potential problems can be anticipated, and planned maintenance can be implemented to ensure the sustainability of urbanization projects over their entire lifespan, all in a fully connected model.

    Affordable, user-friendly solutions for capturing and processing airborne lidar data and imagery have triggered a strong adoption of UAV technology in the AEC industry. For CHC Navigation, 2021 was marked by the huge success of the AlphaAir 450, a breakthrough in 3D UAV mapping technology. With its ease of use, high accuracy and affordability, the AA450 expands the scope of lidar surveying to non-professional users in geospatial reality-capture applications and to those who have never been able to afford such technology before.

  • Leica Geosystems: The surveyor as a data manager

    Leica Geosystems: The surveyor as a data manager

    Photo: Leica Geosystems
    Photo: Leica Geosystems

    While some tasks for AEC surveying are similar to other types of surveying — such as original ground surveying, creating site control and live monitoring — the biggest differences and challenges arise in data management, timeframes, communication and deliverables.

    In AEC surveying, the project timeline is the primary factor driving everything, creating a different kind of pressure on the surveyor. As data experts and problem solvers, surveyors for AEC must quickly adapt to construction progress, as their survey knowledge can be needed on site at any point.

    Information transfer challenges also exist — such as clearly communicating data to non-surveyors who perform measurement tasks — along with creating unique deliverables across construction stages. These include 3D terrain models with real-world coordinates for architects; fit-for-purpose computer-aided design and Industry Foundation Class models for machine operators and mechanical, electrical and plumbing installers or off-site fabricators; and progress reports for project owners.

    Several AEC firms have opted to create their own inhouse survey teams. This allows greater control over the consistency and clarity in communication and deliverables, because they focus exclusively on surveying for AEC and are therefore familiar with its specific challenges.

    The main challenge for the surveyor in AEC is sifting through and processing the data, assessing quality, understanding relevance, producing results and crafting deliverables to meet the clients’ needs.

    An integrated total solution is important for AEC surveyors who must decide not only which technology to use, but how to process data from different technologies together. Our products fit within this integrated solution concept.

    Leica Geosystems‘ automated total stations, multistations and GNSS blend innovation and traditional technology, such as the Leica GS18 I with tilt and visual positioning, enabling surveyors to measure more, faster.

    For mass data collection, the Leica RTC360 3D laser scanner operates at two million points per second and contains visual inertial system (VIS) technology simplifying the registration process. The Leica BLK series combines intelligence and accessibility, including the BLK360 imaging laser scanner, the handheld BLK2GO, and the latest autonomous technology of the BLK2FLY and BLKARC.

    Finally, our software connects surveyors to their sensors and data in the field with Leica Captivate and Leica Cyclone Field 360 and to the office with Leica Infinity and Leica Cyclone, extending to existing CAD software with the Leica CloudWorx suite of CAD plug-ins.

    Bringing an Aqua Park to Life

    One memorable success story was the use of our products for AEC survey tasks during construction of Germany’s biggest aqua park, Rulantica. The survey work was led by Saladin Keller of Keller planen + bauen. The project involved the creation and construction of a Nordic-themed water world featuring 25 attractions, including water slides, a wave pool and a lazy river.

    Alongside all the typical surveying for AEC tasks — establishing site control, staking out pipes, and planning and staking the entire traffic infrastructure — Keller had the challenge of measuring and positioning the complex internal geometry. These tasks required skilled surveyors and a variety of survey tools, such as total stations, GNSS rovers, laser scanners and powerful processing software.

    Operating within the AEC environment also meant that communication and flexibility were key to the success of the project. Keller needed to provide the right data to different trades and handle urgent maintenance requests requiring surveying skill, such as rebuilding parts and adjusting utilities.

  • AEC firms use aerial mapping to share in infrastructure funding

    AEC firms use aerial mapping to share in infrastructure funding

    Nearmap aerial imagery is used as a basis for survey linework. Photo: Nearmap
    Nearmap aerial imagery is used as a basis for survey linework. Photo: Nearmap

    With Congressional approval of $17 billion in infrastructure funding, the largest single allocation ever, the scramble to win contracts is about to get red hot and AEC firms are gearing up. In this very competitive game, top engineering firms are relying on their experience, technology, business acumen and ability to execute.

    Advances in aerial mapping play a key role in how AEC firms pursue these contracts. Savvy firms have been using this technology for years. Rather than rely on lower resolution satellite imagery or local drone imagery, they use wide-area-coverage aerial maps to clearly display the detail needed to plan and execute.

    Over the past decade, maps made using aerial photogrammetry have played an important role in the AEC space. Using high-performance cameras, fleets of planes capture hundreds of square miles per plane per day, provided that the weather is clear. The imagery is processed and made available to engineering companies within days of capture, allowing them to see very clear imagery.

    AEC organizations use different forms of aerial maps to evaluate sites, improve their survey designs, and build and maintain infrastructure (roads, highways, bridges, tunnels, overpasses, rail, airports, housing, commercial building development, water resources, parks, pavement and more). Imagine you’re a state or local government that needs to build a bridge, or a developer who wants to contract with an engineering and construction firm to build affordable housing. Why travel to perform time-consuming site evaluations when you can meet with engineering teams in your office and review hundreds of potential sites instantly using current aerial photos that show change over time?

    The engineering teams point out elevation changes, the presence and height of vegetation, neighboring communities, bodies of water, ponding and more. They easily navigate from one location to another as you discuss where the entrance to the community could be, how the road network might be configured, and the proximity to retail, schools and healthcare. Within minutes you measure risk, understand the landscape, make decisions, and begin to estimate the project costs. Your teams collaborate, discuss the pros and cons, measure distances and navigate across the terrain virtually.

    Aerial mapping provides a competitive advantage for AEC companies to win their fair share of the infrastructure bill. It also gives governments and developers the confidence they need to make the right decisions. Typically, this involves looking at sites from all angles. The classic form of aerial mapping used by engineers is a top-down perspective. Increasingly, these organizations have used oblique imagery captured at an angled perspective, which shows height.

    Artificial Intelligence and Aerial Photography

    Starting a few years ago, 3D imagery and digital surface models began to allow engineers to navigate through the imagery and query it based on elevation. More recently, aerial mapping has leveraged artificial intelligence (AI) to classify properties and the landscape. Do you need to see nearby construction sites? AI applied to aerial photography can do that automatically. This rich set of data includes attributes such as tree overhang, roof condition, roof material, building footprints, vegetation height, surface material, swimming pools and even solar panels.

    The blend of all these imagery types and AI into a single solution makes everything discoverable. Users can search by address, city, location or point of interest. They can visualize the imagery along with lat/long coordinates and quickly switch from top-down views to obliques to 3D. As they learn more about the landscape, they begin to turn on AI attributes, gaining deeper insights.

    Sometimes, the analyses go even further. Engineering organizations export the imagery to tools of their choice from such companies as Autodesk, Esri or Bentley Systems, use field-collected ground control points to ensure that it is survey grade, then use it as a base layer for their designs. They even create marketing presentations and video content to help them win the business. Current high-resolution aerial maps have become a cornerstone of how these organizations operate.

    This approach provides unique advantages for engineering firms. For example, they can combine geospatial and construction datasets in a common operating environment to reduce complexity, streamline communication, ensure that all stakeholders are up to date, and check their progress toward meeting contractual obligations.

    Planners have current, contextual designs and models to make accurate decisions about planning and development activities. They can view asset locations and conditions to facilitate maintenance and upgrades, leverage aerial maps inside other platforms to improve work orders and reduce field visits, and ensure regulatory compliance.

    Whether it’s improving highway safety, constructing ferry terminals, improving transportation systems, developing land or building a network of recreational trails, aerial imagery provides engineering and construction companies with a competitive advantage to win new business, improve client satisfaction and meet growth targets. With $17 billion on the line, sophisticated firms are finding a way to secure their fair share of the pie.

  • JAVAD GNSS: A Surveyor’s Perspective

    JAVAD GNSS: A Surveyor’s Perspective

    Shawn billingS, RPLS, reinvests some of his profits in surveying gear, like this JAVAD GNSS unit. (Photo: Rebecca Billings)
    Shawn Billings, RPLS, reinvests some of his profits in surveying gear, like this JAVAD GNSS unit. (Photo: Rebecca Billings)

    By Shawn Billings  
    RPLS, Proprietor, Pendulum Surveying and Dealer

    The AEC industry relies on surveyors to be a bridge between the existing landscape and the design landscape. Surveyors have been providing virtual reality for centuries, albeit in a mostly analog way, until very recently.

    Imagine that a school board needs a new school. It describes the need to an architectural or civil engineering company, which develops a conceptualized plan. Next, it is time to figure out how to adapt this rough concept to the real world. Will the school fit within the boundaries of its district’s property? How will it access public rights-of-way? Can the current roads accommodate the traffic it will bring? How will the school access utilities? How will the building impact existing stormwater drainage? How do various data collected by others (such as geotechnical and wetlands delineation) fit into the site plan?

    The data collected by the surveyor inform the designer, usually in the form of a map — historically on paper, but now in digital form. Most designers want the key features extracted rather than a dense point cloud, so it is important for surveyors to be able to understand what those key features are.

    AEC surveying differs from boundary surveying in several ways. First, it usually requires consideration of a 3D world, not only two dimensions. Secondly, it will usually involve many thousands of points, not a few tens of points as is usually the case in boundary surveying. Third, AEC surveying will typically involve many more stakeholders. Fourth, the liability in AEC surveying will usually (but not always) be greater because of the significant costs involved.

    AEC surveying can be challenging because the timeframes are typically tight, with numerous professionals involved. Surveyors will often have to wait on others one day, only to be rushed the next day once the ball moves into their court. However, the tools available to us today allow us to collect data much more quickly than we ever could before.

    Today, I can carry almost everything I need to survey in a compact car—my Javad GNSS real-time kinematic (RTK) system, my robotic total station, my handheld electronic distance measuring device, my laptop computer, my smartphone (which provides internet access), my digital camera, my lidar and my photogrammetric drone, as well as the accessories needed for each device. All these devices have become more portable, more powerful, and less expensive. The gains in efficiency have reduced fieldwork by more than half over the past couple of decades, requiring fewer people and generally providing much better quality data.

    Today, it is rare for a surveyor to provide paper deliverables to designers. Almost all prefer digital files, usually vector data in DWG or DGN format along with surfaces in XML format.

    Recently, I have worked on several small commercial building projects. The requirements were the same for each. The initial survey includes (among other things):

    • a title boundary survey
    • the location of existing utilities and structures
    • contours at one-foot intervals
    • the delineation of the floodplain, if present on the site
    • the location of streets and other public access.
    • Once the initial survey is complete, I often set control for machine control, which heavy machinery uses to perform grading without requiring stakes. Once grading is complete, I often stake out building locations and sometimes paving.

    Challenges have included working with city planners who do not always have the same sense of urgency as the project developers and designers.

    Perhaps the greatest lesson I have learned is the importance of being efficient without being in a hurry, which breeds mistakes, such as missing important details or breaching a safety protocol and causing a serious injury.

    I also have learned that while technology can increase profits, it is important to reinvest some of them into improving my work product. This way, I enjoy a better return on my investment, but I also enjoy a better deliverable for my clients.

  • Launchpad: Mapping software, MEMS accelerometers

    Launchpad: Mapping software, MEMS accelerometers

    A roundup of recent products in the GNSS and inertial positioning industry from the February 2022 issue of GPS World magazine.


    OEM

    GNSS Receiver

    For tracking, telematics

    Photo: u-blox
    Photo: u-blox

    The LENA-R8 GNSS receiver is based on the u-blox M10 platform. The compact module balances cost and performance with a single antenna and primarily targets customer deployments in the Europe, Middle East, Africa, Asia, and South America regions. Designed for tracking and telematics, the module series was designed to minimize material costs and data charges. The LENA-R8 supports a broad range of frequency bands with 2G fallback, providing maximum roaming coverage for global tracking applications using a single stock keeping unit (SKU).

    U-blox, u-blox.com

    Helical Antenna

    For UAVs and other applications

    Photo: Tallysman
    Photo: Tallysman

    The low-profile triple-band HC997EXF embedded helical GNSS antenna features eXtended Filtering (XF). It is designed for precise positioning, covering the GPS/QZSS-L1/L2/L5, GLONASS-G1/G2/G3, Galileo-E1/E5a/E5b, BeiDou-B1/B2/B2a, and NavIC-L5 frequency bands. It also covers regional satellite-based augmentation systems (WAAS, EGNOS, MSAS, GAGAN) and L-band correction services. It is packaged in a light (11 g), compact form factor (60 x 25 mm). Its precision-tuned, high-accuracy helical element provides an excellent axial ratio and operates without a ground plane, making it suitable for lightweight unmanned aerial vehicle (UAV) navigation and a wide variety of precision applications.

    Tallysman Wireless, tallysman.com

    A-PNT Card

    High precision for defense

    Photo: Spectranetix
    Photo: Spectranetix

    The SX-124 ruggedized 3U OpenVPX high-performance positioning, navigation and timing (PNT) card can provide timing and positioning information in a GPS-denied environment through sensor fusion. It is designed for highly integrated systems with a requirement for the U.S. Army’s C5ISR Modular Open Suite of Standards (CMOSS) and alignment with the Open Group Sensor Open Systems Architecture (SOSA) technical standard. The SX-124 can accept external sources or use its onboard GNSS receivers as reference inputs for timing and positioning data. The positioning data can be fused with internal and external inertial measurement units.

    Spectranetix, spectranetix.com

    MEMS Accelerometers

    Radiation tested for space

    Photo: Silicon Designs
    Photo: Silicon Designs

    The Model 1527 series is a family of miniature, radiation-tested, tactical-grade micro-electromechanical (MEMS) accelerometers. Offered in three full-scale acceleration ranges — ±10 g, ±25 g and ±50 g — the series is designed to support a variety of critical space electronics testing requirements, including those of spacecraft, satellites and CubeSats. Their small bias and scale-factor temperature coefficients, excellent in-run bias stability and zero cross-coupling make the Model 1527 series particularly well-suited for spacecraft electronics testing applications requiring low power consumption (+5 VDC, 6.5 mA), low noise, long-term measurement stability in –55° C to +125° C environments, and performance reliability under intermittent radiation exposures.

    Silicon Designs, silicondesigns.com

    Automotive Receiver

    Guidance for advanced driver assistance systems

    Photo: STMicroelectronics
    Photo: STMicroelectronics

    The STA8135GA automotive-qualified GNSS receiver is designed to deliver the high-quality position data needed by advanced driving systems. Part of the Teseo V family, the STA8135GA integrates a triple-band positioning measurement engine. It also provides standard multi-band position-velocity-time (PVT) and dead reckoning. The multi-constellation receiver delivers raw information for the host system to run any precise-positioning algorithm, such as PPP/RTK (precise point positioning/real-time kinematic). The receiver can track satellites in the GPS, GLONASS, BeiDou, Galileo, QZSS and NAVIC/IRNSS constellations.

    STMicroelectronics, st.com


    Surveying & Mapping

    Software Upgrade

    Improvements support photos, 2.5D data capture

    Photo: 1Spatial
    Photo: 1Spatial

    Survey application 1Edit now has increased support for photos and 2.5D data. 1Edit 3.1 allows users to attach feature photos, including automated geotagging, which enables surveyors to visualize assets and fine tune observations. Also included are new validation functions and improved handling for heights (2.5D data), typically useful for detailed asset and land-management surveys. Enhanced styling, including bitmap fills and dashed lines, make it easier to identify and classify different asset types during surveys. Additional control of editable layers and fields provides protection for non-editable data and protects the data quality. Significant improvements to rendering of thematic mapping enhances the speed and fluidity of the intuitive user interface.

    1Spatial, 1spatial.com

    Mapping Software

    Map-making functionality improved

    Photo: Golden Software
    Photo: Golden Software

    The latest version of Surfer surface mapping software has improved map-making functionality and data exporting capabilities. Surfer is used by more than 100,000 people worldwide, many involved in oil and gas exploration, environmental consulting, mining, engineering and geospatial projects. It provides fast and powerful contouring algorithms, enabling users to model data sets, apply an array of advanced analytics tools, and graphically communicate the results. Frames now have outlines and background fill colors to make them easier to read when placed on top of maps and attribute data can now be exported as numeric data.

    Golden Software, goldensoftware.com

    RTK/PPP Device

    Multi-sensor fusion on a single board

    Photo: ANavS
    Photo: ANavS

    The Multi-Sensor (MS-) RTK/PPP device is a turnkey system easily integrated into surveying applications. The module includes up to three multi-frequency, multi-GNSS (GPS + Galileo + Glonass + BeiDou) receivers, a MEMS IMU, a barometer, a CAN interface for reception of vehicle data (wheel odometry and steering angle), and an LTE module for reception of RTK/PPP corrections. ANavS sensor fusion performs tight coupling of all sensor data with an Extended Kalman Filter (EKF). Various interfaces can connect additional sensors (such as camera or lidar) or output position information.

    ANavS, anavs.com

    Auto Mapping

    Increases lane-level accuracy

    Photo: Asensing
    Photo: Asensing

    The HD-MapBox integrates high-precision map data based on high-precision positioning. Fusing data from a GNSS receiver, IMU, ADAS camera, vehicle dynamics and HD maps, the HD-MapBox can achieve a lateral error of less than 8 inches (0.2 meters) and a longitudinal error of less than 6.5 feet (2 meters) with a 95% confidence interval, providing an accurate reference for highway pilots and automated valet parking. Even if both GNSS and lane line detection are not available, the HD-MapBox can still enable vehicles to keep inside the lane for at least a quarter mile (400 meters).

    Asensing, asensing.com

    Positioning System

    Adds location data inside buildings

    Photo: Esri
    Photo: Esri

    Esri ArcGIS IPS is an indoor positioning system that adds a blue dot to indoor maps, enabling users to locate their current position inside a building in the same way GPS enables outdoor location indicators. It uses an alternative technology to enable real-time positioning and navigation inside buildings. It also provides live location sharing and tracking, location data capture and analytical insights. ArcGIS IPS is available for users of ArcGIS Indoors, an indoor mapping system for smart building management, and ArcGIS Runtime SDKs, which enable the indoor positioning capability in custom-built apps.

    Esri, esri.com

  • GNSS + sensors have transformed surveying

    GNSS + sensors have transformed surveying

    Photo: payamona / iStock / Getty Images Plus / Getty Images
    Photo: payamona / iStock / Getty Images Plus / Getty Images
    Matteo Luccio
    Matteo Luccio

    In this issue’s cover, a man with a backpack lidar unit, a GNSS receiver and a tablet computer is surveying in a complex and challenging urban setting. That same lidar unit also can be mounted on a UAV. One of the contributors to this month’s cover story describes the role of aerial photogrammetry in the architecture, engineering and construction (AEC) industry. Satellite navigation, remote sensing, mapping software, a great variety of platforms, and ever more powerful handheld computers — those are the key ingredients in today’s ecosystem of geospatial technologies. The current generation of surveying equipment has more than halved fieldwork in the past two decades while greatly improving the quality of the data collected.

    The AEC industry relies on surveyors to be “a bridge between the existing landscape and the design landscape,” said another contributor to our cover story. Unlike traditional boundary surveying, he explained, surveying for AEC requires consideration of a detailed 3D world. It also involves many more stakeholders and much greater liability.

    The tight integration of GNSS, inertial systems, lidar sensors and 360° spherical imagery into mobile mapping systems makes 3D modeling possible and traditional GNSS or optical measurement instruments obsolete. However, while inertial systems are invaluable to bridge brief gaps in the availability and reliability of GNSS signals, they are far from the panacea they are sometimes claimed to be, as Brad Parkinson reminds us in an interview with Dana Goward, also in this issue.

    Surveying for AEC requires at least centimeter accuracy. The challenges of surveying in urban settings include urban canyons that occult signals and create multipath, traffic and multiple layers of underground, ground-level and above-ground infrastructure.

    Beyond the construction phase, 3D survey data is increasingly used to create digital twins of buildings, which facilitate their operation and maintenance throughout their life cycle and help lower their carbon footprint. Once they have completed an initial survey, surveyors often set control to be used for machine control — the theme of our cover story in next month’s issue.

    In this issue we also:

    • Inaugurate a “letters to the editor” section to make more room for debate in the GNSS/PNT community on the critical issues it faces.

    • Report on a Jet Propulsion Laboratory study of the impact on the ionosphere of the enormous volcanic eruption in Tonga and the beginnings of a GNSS-based early warning system for natural hazards.

    • Continue our series of articles on GNSS constellations, with an update from Japan’s QZSS constellation.

    • Feature three studies: one on real-time simulator testing using an NMEA data stream, one on the first transmission of L1C/B signals by QZSS, and one on self-driving cars in major metropolitan areas.

    All these advances, however, are threatened when GPS is threatened. Earlier in the month, three members of our editorial advisory board comment on the recent threat to GPS satellites by the Russian government.

    Matteo Luccio | Editor-in-Chief
    [email protected]

  • Northrop Grumman to equip Marines with next-gen targeting devices

    Northrop Grumman to equip Marines with next-gen targeting devices

    Image: Northrop Grumman
    Image: Northrop Grumman

    The U.S. Marine Corps has selected Northrop Grumman to provide the Next Generation Handheld Targeting System (NGHTS), a compact device that provides precision targeting and is capable of operation in GPS-denied environments.

    The laser-based device will give marines an enhanced capability to identify and designate targets from extended ranges.

    “NGHTS will significantly enhance the ability of marines to identify ground targets under a wide range of conditions,” said Bob Gough, vice president, navigation, targeting and survivability, Northrop Grumman. “Connected to military networks, NGHTS can provide superior situational awareness and accurate coordinates for the delivery of effects from beyond the line of sight.”

    Northrop Grumman’s NGHTS is capable of performing rapid target acquisition, laser terminal guidance operation and laser spot imaging functions. Its high-definition infrared sensors provide accuracy and grid capability over extended ranges. Additional features include a high-definition color display and day/night celestial compasses.