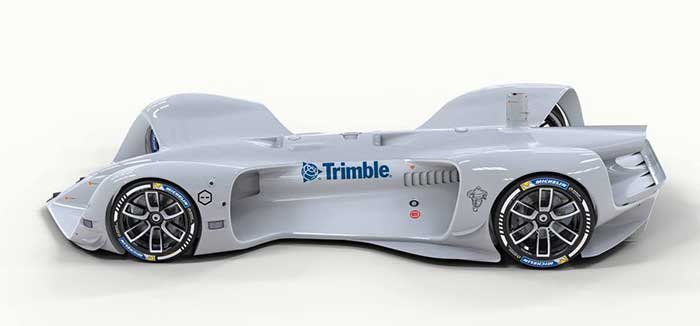
Trimble has partnered with Roborace, an autonomous racing series with electric-powered vehicles. As part of the alliance, Roborace will use Trimble’s Applanix POS LVX GNSS-inertial systems in its next-generation autonomous race cars for season one of the championship, which begins in September 2021.
As part of the technology and marketing alliance, Trimble will serve as the Official GNSS-Inertial Positioning Technology Partner and enable Roborace’s engineering team to leverage Trimble resources such as technology, services and expertise that it provides across a wide variety of industries and applications, Roborace said. Trimble also will utilize Roborace’s media platform in its global marketing initiatives.
Image: Roborace
“We are thrilled to be working with Roborace, the world’s first extreme competition of racing teams developing self-driving artificial intelligence for autonomous driving systems,” said Louis Nastro, director of land products at Applanix. “Trimble systems, software and solutions for positioning and orientation are designed for pinpoint accuracy, efficiency and ease of use, and are perfectly suited for autonomous vehicle applications such as Roborace.”
Roborace also looks forward to the partnership.
“At Roborace we are always looking for the best technology to incorporate into our cars and we’re thrilled to announce this alliance,” said Chip Pankow, chief championship officer at Roborace. “Trimble is a leader in the field and the small size and accuracy of the POS LVX is a perfect solution for us. These GNSS-inertial systems will be utilized in all vehicles participating in the Roborace championship.”
Roborace was created to accelerate autonomous software development by pushing the technology to its limits in a range of controlled environments. It also aims to educate and inform the world about autonomous driving. In 2019, the series held six events that drove more than 36 million multi-channel video views.
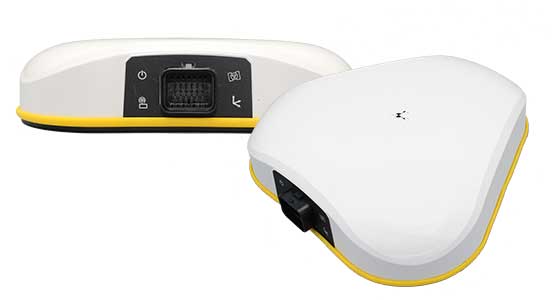
Designed to operate under the most difficult GNSS conditions found in urban and suburban environments, Trimble’s Applanix POS LV enables accurate positioning for road geometry, pavement inspection, GIS database and asset management, road surveying, vehicle dynamics and autonomous vehicle systems. POS LVX is a configuration of POS LV housed in a robust, rugged enclosure and easily incorporated into small vehicles, autonomous platforms and tight spaces of all types, Trimble said.
2,300-acre Shell Deer Park Refinery provides complex testbed for aerial inspections and incident response
Photo: SimonSkafar/E+/Getty Images
DJI is partnering with Shell Oil Company to create, test and deploy DJI drone technology at its Deer Park Manufacturing Complex to improve efficiency and worker safety during industrial inspections and emergency incident response.
The Shell Deer Park drone team adopted DJI drones in 2016 to reduce the need to work at height while improving safety and cutting the cost of inspections in the process. As a Solution Development Partner, Shell will work with DJI to develop and test advanced drone solutions, like the DJI Matrice 300 RTK, that allow workers to automate required inspections of critical infrastructure like flare tips and floating roof tanks whose condition and activity are difficult to assess from ground level.
“As one of the world’s largest energy companies, Shell has provided us with valuable insight into the unique challenges of conducting aerial inspections at one of its largest facilities where infrastructure exceeds the height of 250 feet off the ground,” said Cynthia Huang, until recently the director of business development at DJI. “Through our collaboration, DJI will receive valuable first-hand insight into the complexities of deploying drone technology at a world-class refinery, and co-develop new product features like AI Spot-Check that will allow Shell and other innovative energy companies to use drones to safely and easily conduct required inspections of critical infrastructure.”
“Shell Deer Park is excited to become a Solution Development Partner with DJI as we continue to adopt drone technology,” said Shell Deer Park’s Chief Drone Pilot John McClain. “Through this partnership, Shell Deer Park will have access to some of the most advanced drone technology from DJI to help elevate workplace safety and improve efficiency across our operations in the world’s largest industry.”
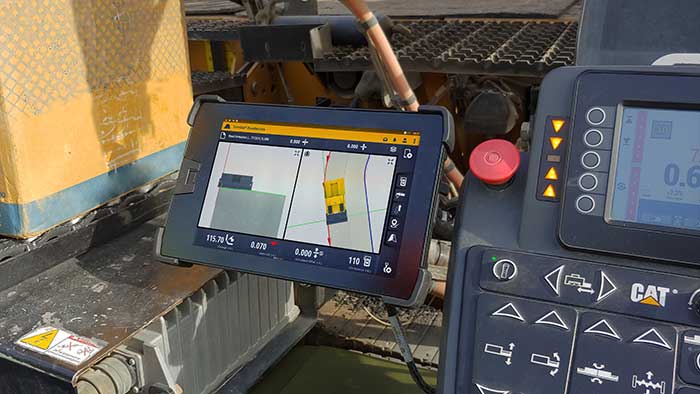
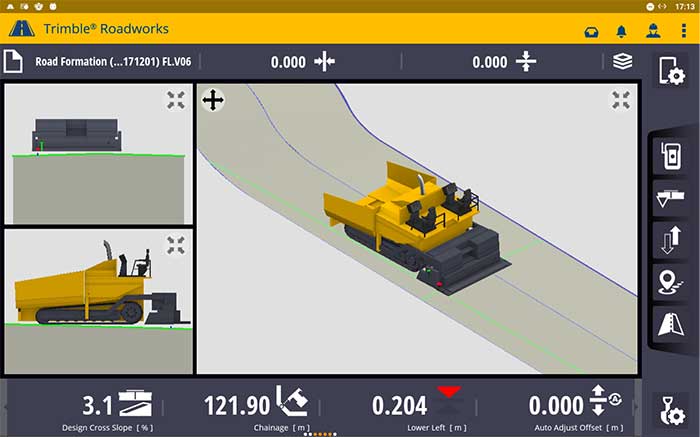
According to the company, Trimble Roadworks is an accurate, automatic 3D screen control system that can improve paving productivity and rideability by directly referencing the design rather than a surface or stringline to minimize asphalt usage, reduce waste and overruns, and finish projects on time and under budget.
The Android-based application runs on the 10-inch touch screen Trimble TD520 display. Operators can personalize the interface to match their workflows, and configurable views make it easier to see the right perspective for maximum productivity, the company said.
The software uses components from Trimble Earthworks, which Trimble says increases the portability of the hardware. Users also can download other third-party applications that provide the operator with additional useful tools inside the cab.
Screenshot: Trimble
“Trimble Roadworks is easy to learn and more accessible for many different types of contractors because it leverages the intuitive Trimble machine control interface and applies it to asphalt pavers,” said Kevin Garcia, general manager for Trimble Civil Construction Specialty Solutions. “This platform also makes it possible to include Trimble’s industry-leading paving technology as part of a connected site ecosystem of solutions, which is valuable for complex infrastructure projects.”
In addition, using a Trimble SNM941 Connected Site Gateway, Trimble Roadworks allows the transfer of 3D designs from the office to the machine via the cloud so that the operator is always using the latest design.
Trimble Roadworks 3D Paving Control Platform for Asphalt Pavers is now available globally through the worldwide SITECH distribution channel.
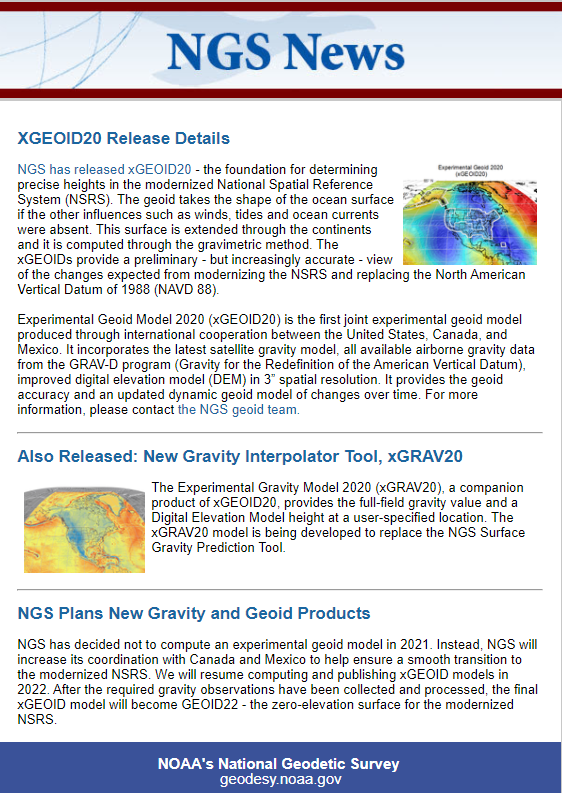
My last column highlighted an ArcGIS web application that incorporates various datasets and data layers to assist surveyors planning vertical control surveys. On Jan, 29, the National Geodetic Survey (NGS) released the latest experimental geoid model, xGeoid20, and a new gravity interpolation tool (see box below, “NGS Releases Annual e& Gravity Interpolation Tools”).
This newsletter will highlight some attributes of these two new products. First, why am I writing about another experimental geoid model. I discussed xGeoid18 in my December 2018 column and xGeoid16 in my June 2017 column. What’s important here is that this will be the last experimental geoid model until 2022, and the dynamic geoid model has also been updated this year in the form of xDGEOID20.
xDGEOID20 is produced by NGS within the Geoid Monitoring Sƒervice (GeMS) and is part of the new NAPGD2022. Therefore, users only have a few more years to understand the differences between the hybrid geoid model that is being used today to estimate GNSS-derived orthometric heights and the gravimetric geoid model which will be used to estimate North American-Pacific Geopotential Datum of 2022 (NAPGD2022) GNSS-derived orthometric heights.
NGS also announced a new gravity tool, denoted as “The Experimental Gravity Model 2020 (xGRAV20).” xGRAV20 is designed to provide a full-field gravity value and a digital elevation model height at a-specified location. The xGRAV20 model will be important to users that are computing leveling-derived orthometric heights consistent with NAPGD2022.
It is important to note that the xGEOIDs provide a preliminary but increasingly-accurate view of the changes expected from the upcoming NAPGD2022. Also, the xGEOID20 geoid model is the first combination of the geoid models computed by scientists at NGS and Canadian Geodetic Survey (CGS). One unique element to xGEOID20 is that the differences between the A and the B model are due to the contribution of the GRAV-D airborne gravity and differences in methodology.
The National Geodetic Survey (NGS) has published annual experimental geoid (xGEOID) models since 2014. Each of these experimental geoids demonstrate the improvements provided by the addition of airborne gravity data (GRAV-D data) and by the refinement of geoid computation methods.
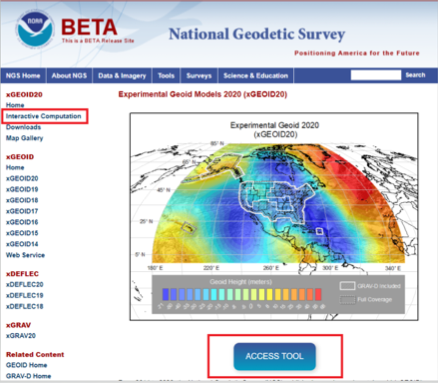
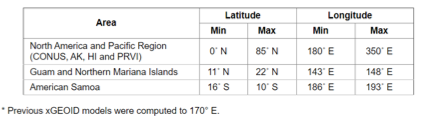
As the image above indicates, the xGEOID20 is available over a very large area. The box below lists the latitude and longitude boundaries of the areas where xGeoid20 is available.
Areas Where xGeoid20 Model Is Available. (Image: NGS)
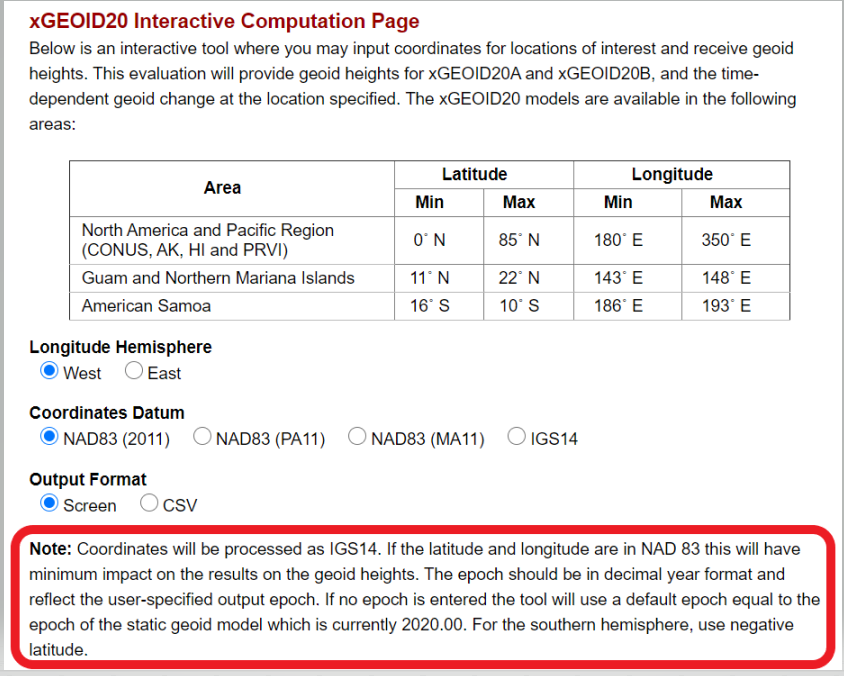
To use the xGeoid20 Interactive Computation Page, the user can click on the “ACCESS TOOL” button below the map or the Interactive Computation button on the left side of the webpage (see the image above, “Experimental Geoid Models 2020 (xGEOID20)”). I’d like to highlight a statement that NGS added as a note on the computation page:
Coordinates will be processed as IGS14.
The epoch should be in decimal year format and reflect the user-specified output epoch. If no epoch is entered, the tool will use a default epoch equal to the epoch of the static geoid model, which is currently 2020.00.
The user needs to know that the epoch is used to compute the xDGEOID20 value. I will demonstrate how this works later in this column.
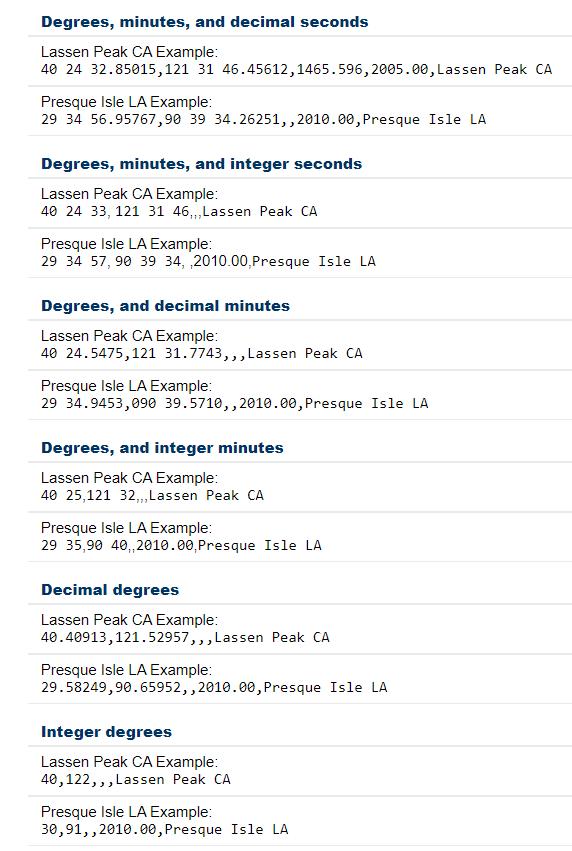
As in past xGeoid interactive computations web applications, the user can submit data in various formats. The box titled “Input Formats Permitted for xGeoid20 Webtool” provides a list of the permitted formats. It should be noted that inputting an ellipsoidal height, epoch and name are optional. However, the default epoch is 2020.00, so if you want a different epoch, you need to enter the date. Also. the program will only compute an orthometric height if the user provides an ellipsoidal height.
Input Formats Permitted for xGeoid20 Webtool. (Image: NGS)
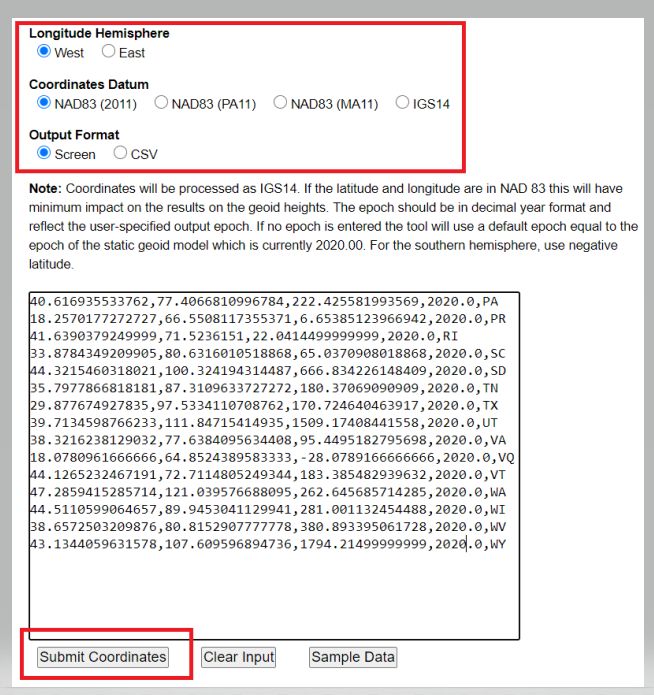
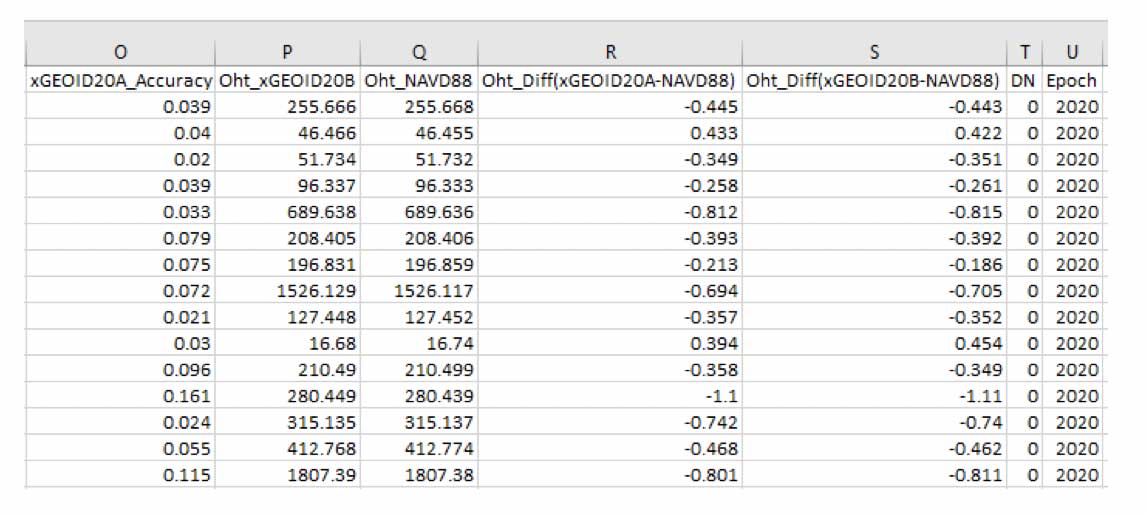
Users have the option of getting the output from the xGeoid20 tool on their computer screen or in the CSV format. The box below is an example of inputting data using the screen option. Once you enter your data, the user clicks on the submit button.
Example of Input Format for Screen Option. (Image: NGS)
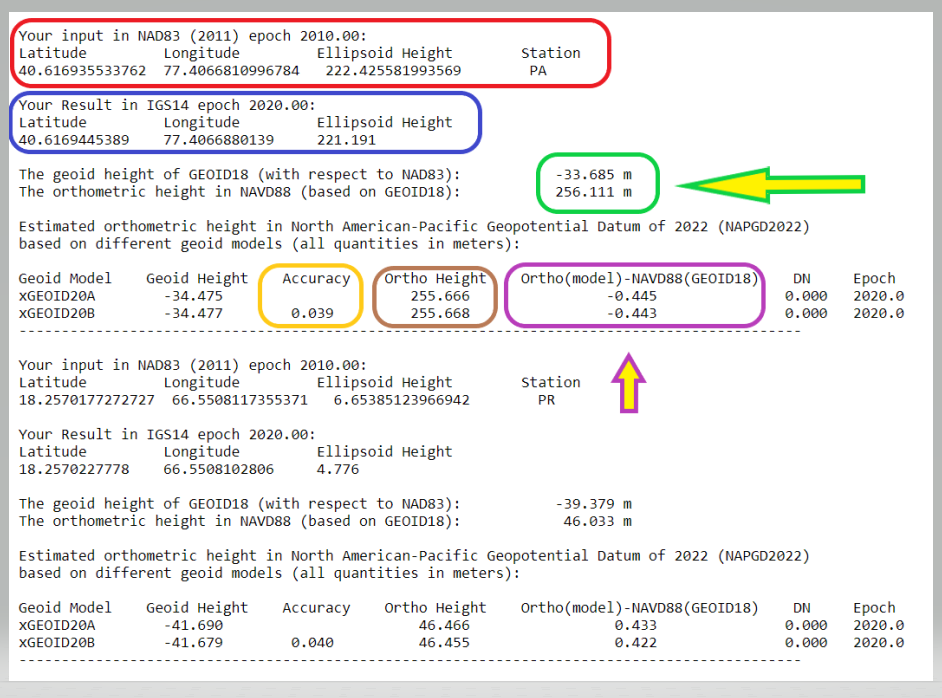
The next image shows an example of the output using the screen option. I have highlighted a few numbers that I’d like to address.
Your input in NAD83 (2011) epoch 2010.00 (red). I entered my coordinates as NAD 83 (2011), and it assumed that these coordinates are epoch 2010.0.
Your Result in IGS14 epoch 2020.00 (blue). The routine provides your output coordinates in IGS14, epoch 2020.00. This is the epoch of the static geoid model.
The geoid height of GEOID18 (with respect to NAD83) and the orthometric height in NAVD88 (based on GEOID18) (green). This NAVD 88 value is for comparison purposes only. It is using GEOID18 and provides an estimate of the differences between the future NAPGD2022 and the current NAVD 88. The orthometric height is computed using the following formula: NAD 83 (2011) ellipsoid height (epoch 2010.0} minus GEOID18.
Ortho Height (brown). This is the estimation of the orthometric height using the following formula: IGS14 ellipsoid height (epoch 2020.0} minus xGEOID20A (or B).
Ortho(model)-NAVD88(GEOID18) (purple). These differences are the estimates of the differences between the future NAPGD2022 and the current NAVD 88. It provides the differences for both the xGeoid20A and xGeoid20B model. I look at the B model because it used the GRAV-D data in the development of the model.
Accuracy (yellow). This is the estimated 95% confidence interval for geoid height.
Example of Output Format from Screen Option
xGEOID20 Interactive Computation Output
Note: The GRS80 ellipsoid is used for both NAD83 and IGS14.
N: The geoid height at epoch t0 = 2020.0, which is geocentric and relative to the GRS80 reference ellipsoid.
Accuracy: Estimated 95% confidence interval for geoid height.
DN: The time-dependent geoid change computed between user inputted epoch (t) and t0. To obtain the dynamic geoid height at user inputted epoch (t), add N + DN.
Either Model A or Model B N values may be used for this depending on user preference.
Example of Output Format from Screen Option. (Image: NGS)
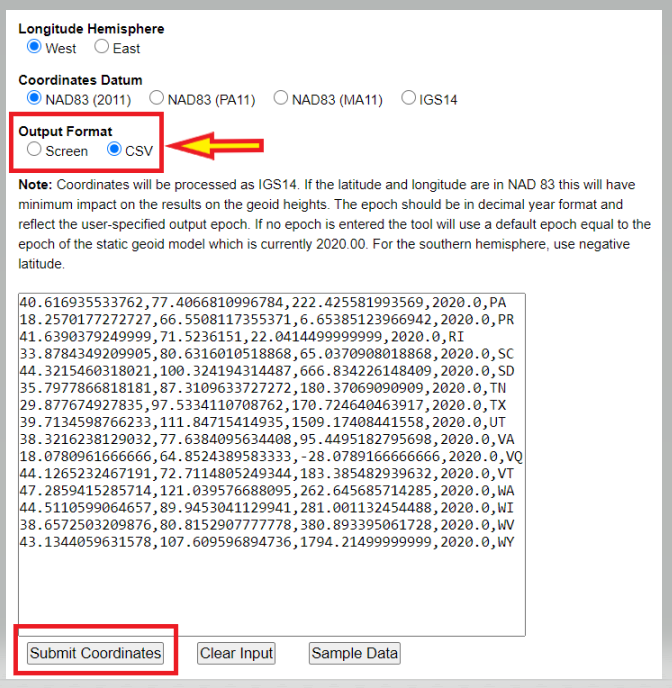
The box below shows an example of inputting data using the CSV option.
Example of Output Format from CSV Option
Note: The GRS80 ellipsoid is used for both NAD83 and IGS14.
N: the geoid height at epoch t0 = 2020.0, which is geocentric and relative to the GRS80 reference ellipsoid.
Accuracy: Estimated 95% confidence interval for geoid height.
DN: the time-dependent geoid change computed between user inputted epoch (t) and t0. To obtain the dynamic geoid height at user inputted epoch (t), add N + DN. Either Model A or Model B N values may be used for this depending on user preference.
Example of Input Format for CSV Option. (Image: NGS)
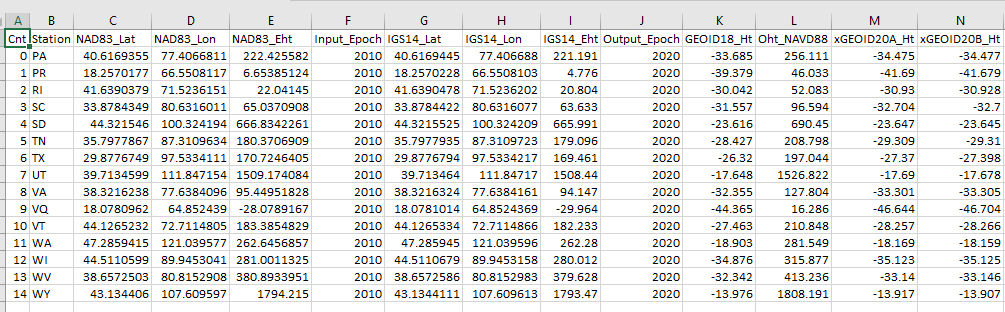
The printed output from the CSV option looks very confusing, but it can be imported into an excel spreadsheet. The headings and values are all separated by a comma so everything falls into the appropriate columns after importing the data (see image below.)
Example of CSV Output Format Imported into Excel. (Screenshot: David Zilkoski)Example of CSV Output Format Imported into Excel. (Screenshot: David Zilkoski)
I stated in the xGeoid20 write up that the dynamic geoid model has also been updated this year in the form of xDGEOID20. This model is produced by NGS within the Geoid Monitoring Service (GeMS) and is part of the new NAPGD2022. For a thorough discussion on GeMS and the time-dependent geoid, view the webinar from NGS’ presentation library. See the box titled “GeMS Webinar by Kevin Ahlgren.”
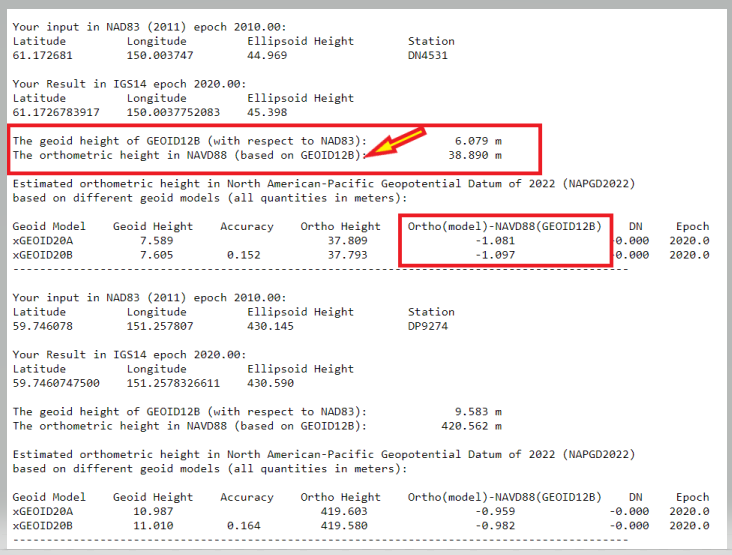
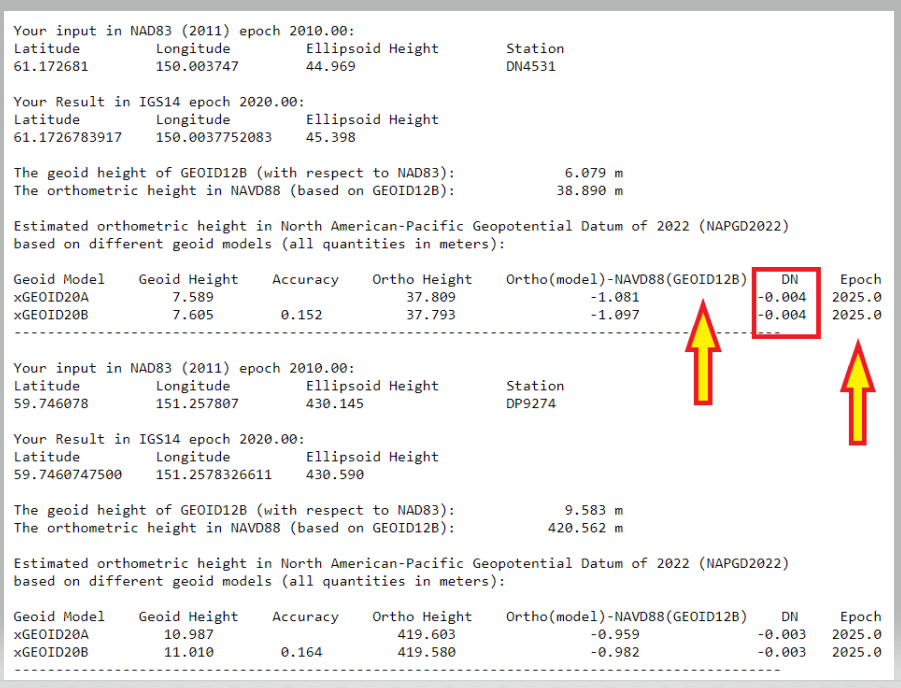
Also, one of my previous columns described NGS’ GeMS program. The images titled “Examples of the Time-Dependent Geoid Change in Alaska EPOCH 2020.0” and “Examples of the Time-Dependent Geoid Change in Alaska EPOCH 2025.0” show the change in geoid value from Epoch 2020 to Epoch 2025 for two stations in Alaska.
Examples of the Time-Dependent Geoid Change in Alaska EPOCH 2020.0. (Image: NGS)Examples of the Time-Dependent Geoid Change in Alaska, EPOCH 2025.0. (Image: NGS)
First, looking at the box titled “Examples of the Time-Dependent Geoid Change in Alaska EPOCH 2020.0,” the change between NAPGD2022 and NAVD 88 is approximately 1 meter. Users should note that the GEOID12B is used to establish the NAVD 88 height. Alaska was not included in GEOID18. Comparing the two Alaska labeled boxes, the xDGEOID2022 change between 2020.0 and 2025.0 is –4 mm. I will address this topic in more detail in future newsletters.
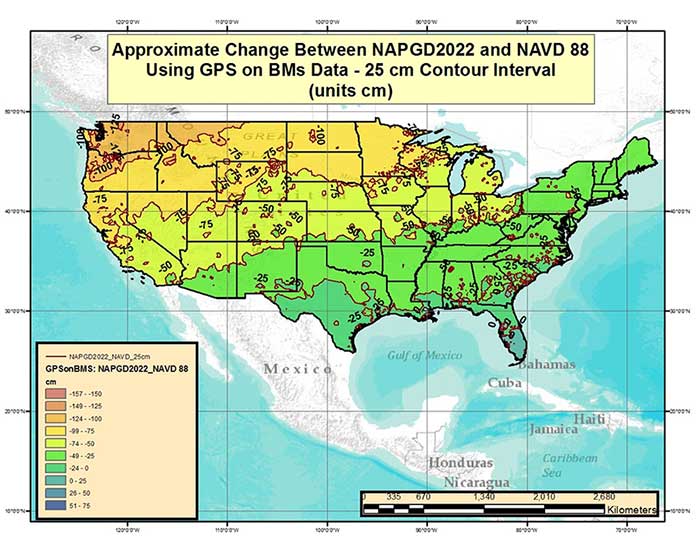
As stated by NGS news announcement, “The xGEOID models provide a preliminary but increasingly-accurate view of the changes expected from the upcoming North American-Pacific Geopotential Datum of 2022 (NAPGD2022).” NGS has produced many figures that describe the bias and trend between the future NADGP2022 and NAVD 88. In my June 2017 column I provided a plot that depicted the difference between NAPGD2022 and NAVD 88 based on the GPS on Bench Mark dataset. See the image below.
Figure from June 2017 Survey Scene column. Approximate Change Between NAPGD2022 and NAVD 88 Using GPS on BMs Data (units = cm). (Image: NGS)
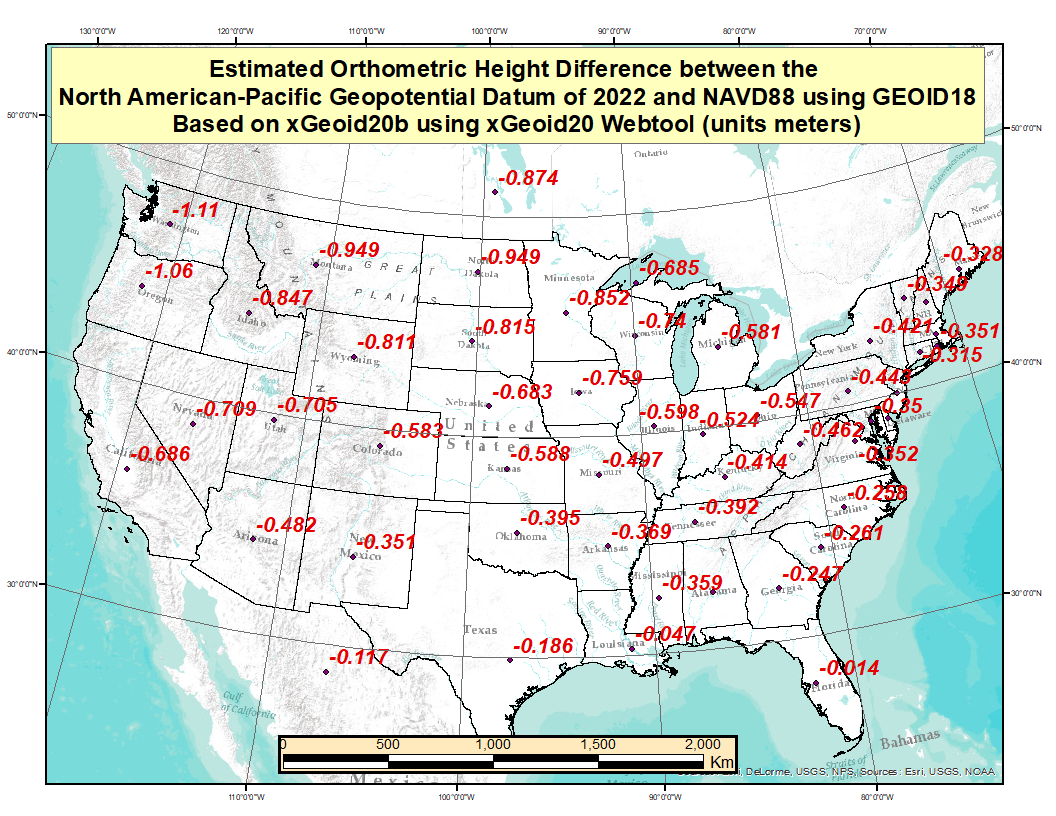
These figures provide a broad picture of the change but to better understand the changes across the Nation, I used the GPS on Bench Mark dataset, that was involved in the creation of Geoid18 model, to compute an average latitude, longitude, and ellipsoid height for every State. Obviously, this is a fictitious mark but it provides an idea of the average change based on marks that have both a GNSS-derived ellipsoid and a leveling-derived orthometric height. The plot titled “Difference Between the Future NAPGD2022 and NAVD 88” depicts the average difference for each state based on the GPS on Bench Mark data file. These differences were generated using the xGeoid20B values from the output of the xGeoid20 website.
Difference Between the Future NAPGD2022 and NAVD 88. (Image: NGS)
I would encourage everyone to select a couple of marks and compute the differences to understand the change in their particular region. I was the NAVD 88 Project Manager and I informed users of the potential changes between the NGVD 29 and NAVD 88 for about a decade, and I still had surveyors tell me that they didn’t know it was coming. Please take a few minutes to read NGS’ write up on xGEOID20, estimate the differences in your area of interest, and spread the word to your colleagues, friends, and clients.
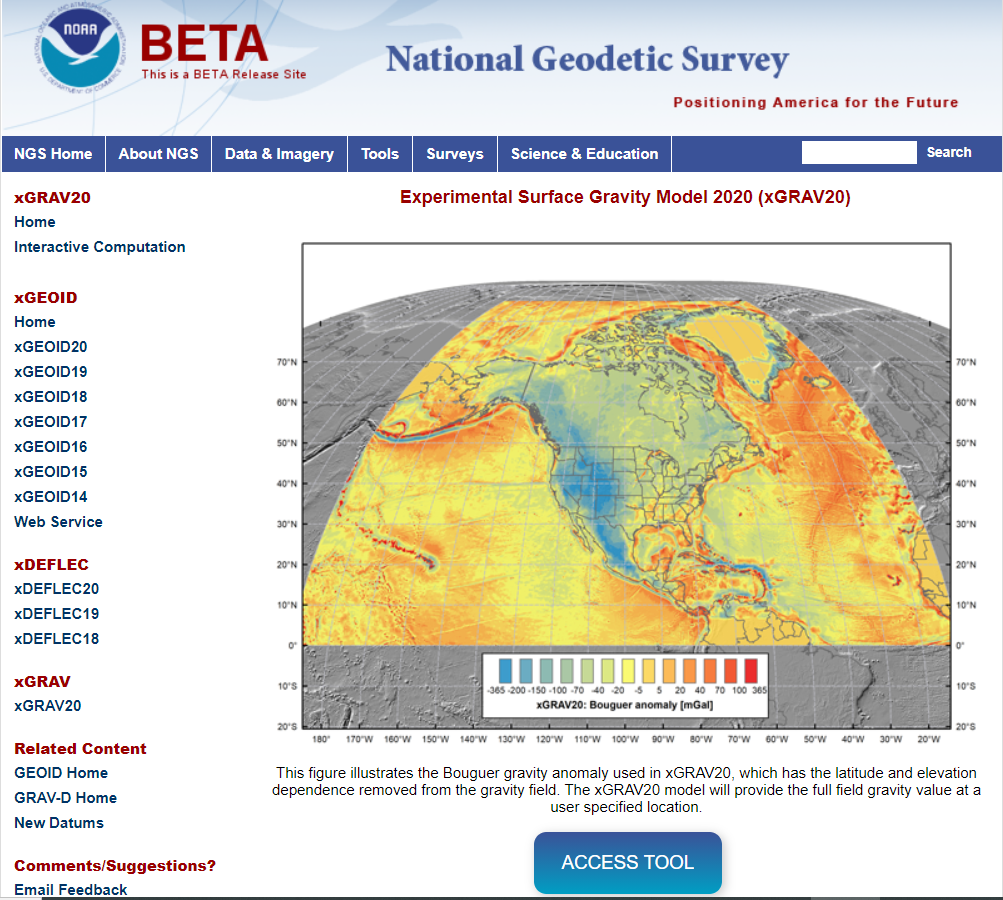
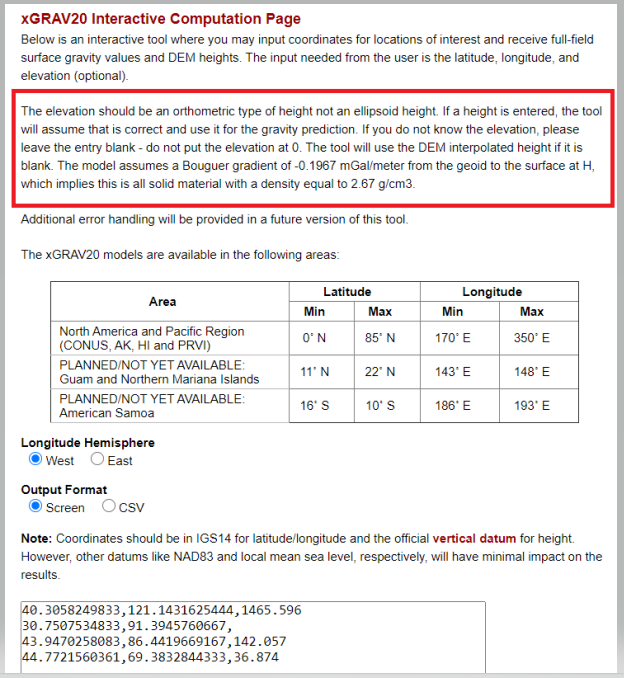
The last item that I’d like to highlight is that NGS has released a beta version of a surface gravity model consistent with xGEOID20. See the box titled “Experimental Surface Gravity Model 2020 (xGRAV20).” Users can access the beta webtool here.
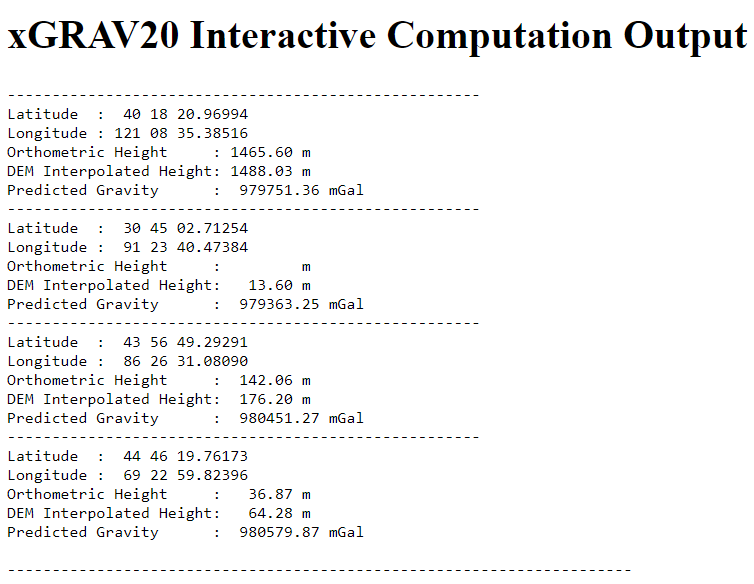
The box below provides the output using the tools sample data.
Output from Screen Output Format from xGRAV20 Tool. (Image: NGS)
This gravity tool will be important when users want to incorporate leveling-derived orthometric heights into NAPGD2022. We will address this tool in more detail in future newsletters. I want to emphasis that these two web tools are beta sites. As a beta site, users should verify all information from the site. I encourage everyone to access the tool and check out a few of their favorite marks, and then send an email to NGS informing them of what you like, what you would like to change, and what you would like to see added to the tool.
NGS is releasing this tool as a beta product to get feedback from users. They are interested in your feedback concerning its function and usability as well as how users would like to interact with NGS web tools in the future. Email NGS at [email protected].
In conclusion, I want to leave you with a thought about change. When I give presentations and seminars, I usually include a slide that probably expresses the thoughts of many individuals.
My brother once told me:
“If you geodesists did it correctly the first time you wouldn’t have to keep performing adjustments and changing the values. Just do it right the first time.”
He’s a doctor and said he must do it right the first time.
My response to my brother and to everyone else is the following:
If you want to improve you have to be willing to change, and if you want to continue to meet future positioning requirements you need to continually change.
Winston Churchill said it better “To improve is to change; to be perfect is to change often.”
Fusing Automotive Radar and OBD-II Speed Measurements with Fuzzy Logic
SYN·ER·GY/ˈsinərjē/ noun: the interaction or cooperation of two or more organizations, substances, or other agents to produce a combined effect greater than the sum of their separate effects; from the Greek, “working together.” That is how the Oxford Dictionary defines this useful property that we often apply to business activities and other human interactions. But it can just as well describe the basis of an apparatus such as a navigation system that consists of several devices working together to produce a safer and more accurate result.
We all know that GPS or any GNSS for that matter doesn’t work everywhere all the time. For example, in built-up areas, signals can be blocked and reflected by buildings leading to positioning errors or complete outages. That is why it is quite common nowadays to combine a GNSS receiver together with an inertial measurement unit or IMU (often in the same package) to produce a more reliable solution for continuous navigation. But IMUs drift and so during an extended GNSS outage, the fidelity of the position reported by the GNSS plus IMU system will degrade with time. And so additional sensors must be added to the mix to improve the reliability of the navigation system. LiDAR, cameras, altimeters and so on have all been used severally or individually to augment the basic GNSS plus IMU combination. Self-driving cars, for example, use multiple sensors to provide safe navigation under specific conditions. Such specialized systems are quite expensive and so we might ask: Can the basic combination of GNSS and an IMU (or some of its components) be augmented by measurements already available in most vehicles or provided easily and inexpensively by equipment add-ons?
Yes. One measurement that helps is the forward speed of the vehicle. This is available from the vehicle’s on-board diagnostics computer system that tracks and regulates a car’s performance. Car manufacturers have adopted a standard for reporting data, the latest version of which is OBD-II. It is easy to interface to the OBD-II connector in a vehicle and extract the speed measurements – the same measurements displayed by the vehicle’s speedometer. Another potential source of speed measurements is the radar in most modern vehicles used for adaptive cruise control. That measurement is hard to acquire and has other limitations. But the idea to use radar as an input to a navigation system is a good one and easily obtained and installed radar units can be used instead.
But how do you optimally combine all of these sensor readings to produce reliable navigation? In the Innovation article this month, we take a look at how fuzzy logic can be used to get a reliable speed estimate, how that can be combined with accelerometer and gyroscope measurements to get position, velocity and attitude of a vehicle and, lastly, how that can be combined with GPS-derived position and velocity in an extended Kalman filter to produce an integrated navigation solution. Now that’s synergy.
Abosekeen
Standard land vehicles and self-driving cars have acquired precise navigation solutions to improve safety and assist drivers. GNSS is used as the primary source of the navigation solution for such applications. However, when driving in environments such as urban canyons, tunnels, or under bridges, GNSS signal reception deteriorates. Worse, it may suffer from a full outage. Because of this, we need a supplemental or backup system, such as an inertial navigation system (INS). The INS provides a complete navigation solution, and it is not affected by signal deterioration or jamming. GNSS/INS integration can achieve better accuracy than GNSS alone. However, such efficiency cannot be maintained during extended GNSS outages, especially with low-cost and commercial-grade inertial sensors for the INS. This drawback principally occurs because the INS solution suffers from accumulated error growth over time. This error causes path or trajectory drift, which becomes significant in the long term.
The fusion between an INS and a GNSS-based system provides a more robust solution than each system alone. In particular, INS/GNSS integration requires both systems to provide the vehicle with an accurate solution. However, when the vehicle is in challenging environments, the GNSS receiver cannot successfully update the integration filter, leaving the INS as the only source for the solution. When a GNSS outage is prolonged in some extreme situations, the solution quality deteriorates rapidly from INS drift. In particular, when using a micro-electromechanical system (MEMS) based inertial measurement unit (IMU), the drift rate significantly increases.
Several approaches have been introduced to overcome such drawbacks. Our reduced inertial sensor system (RISS) concept can be a replacement for the INS in land vehicle and ground robot applications. RISS can provide a complete navigation solution with fewer sensors than a standard INS. It is easily implemented for common land or self-driving vehicle navigation because it uses the vehicle’s on-board diagnostics standard II (OBD-II) device to determine the vehicle’s forward speed. INS requires two integration steps for positioning, but using the OBD-II speed measurements in the RISS mechanization requires only one.This reduction reduces the drift rate because it limits error accumulation from the integration process.
RISS depends mainly on OBD-II speed measurements to provide the land vehicle forward velocity. Unfortunately, these speed measurements are vehicle-specification dependent. Furthermore, these speed measurements are vulnerable to several types of error sources that can be categorized as deterministic (systematic) and non-deterministic (non-systematic). Deterministic errors come from wheel-diameter changes due to variations in temperature, pressure, tread wear, speed, unequal wheel diameters between the different wheels, inefficient wheelbase (track width), limited resolution and sample rate of the wheel encoders. Non-deterministic error sources include wheel slips, uneven road surfaces and skidding. Both groups of error sources negatively affect the velocity, traveled distance and heading estimations using the speed measurements from the OBD-II device.
Accordingly, we have made several RISS modifications to enhance performance, such as integration with a GPS receiver by enhancing the system design matrix for the integration filter. Moreover, an azimuth measurement update from magnetometers was added to the RISS/GPS integrated navigation system to provide azimuth updates during GPS outage periods, so the system can ensure more reliable positioning accuracy in challenging GNSS environments. Furthermore, we introduced a radar-based RISS to overcome OBD-II speed measurement errors. With this system, we demonstrated the superiority of using a frequency modulated continuous wave (FMCW) radar as a speed source instead of the one based on the OBD-II device. Automotive adaptive cruise control (ACC) mainly uses the Doppler measuring technique to measure the target’s (the vehicle ahead’s) relative distance and velocity. The primary radar unit’s radiation pattern is supposed to be a narrow beam to avoid other moving objects. Unfortunately, clutter affects forward-looking radar-collected data. Besides, extracting the onboard vehicle’s speed is difficult primarily because of the radar installation position.
We improved the use of ACC by modeling the linear and non-linear error components with Fast Orthogonal Search as a non-linear system identifier. This provided a more precise solution during outages extending from 60 seconds to 10 minutes. Furthermore, vehicle positioning using ACC was enhanced by extracting the primary and target vehicles’ relative distances under specific rules in urban canyons. These results encouraged us to introduce a fusion between the RISS and ACC, developing a more robust navigation system that relies on more than one sensor type.
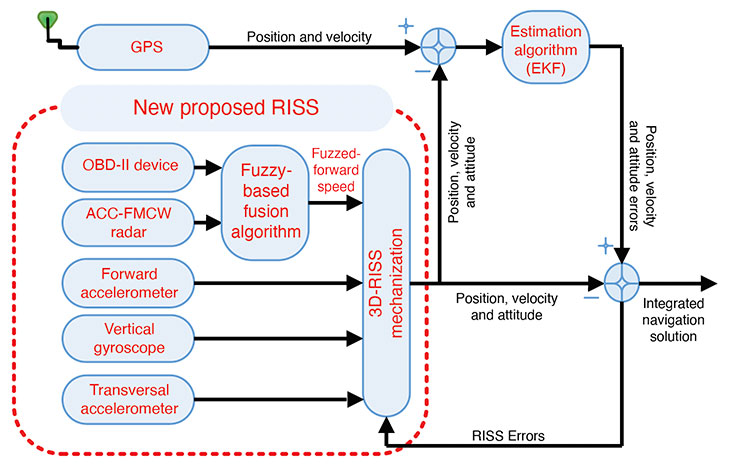
In this article, we propose a smart fusion technique to produce more accurate velocity information from both the Doppler radar and the OBD-II speed measurements. Our new RISS mechanization for land vehicle navigation uses the fused speed from the radar and the OBD-II device with a vertical gyroscope and two transversal accelerometers.
3D-RISS MECHANIZATION
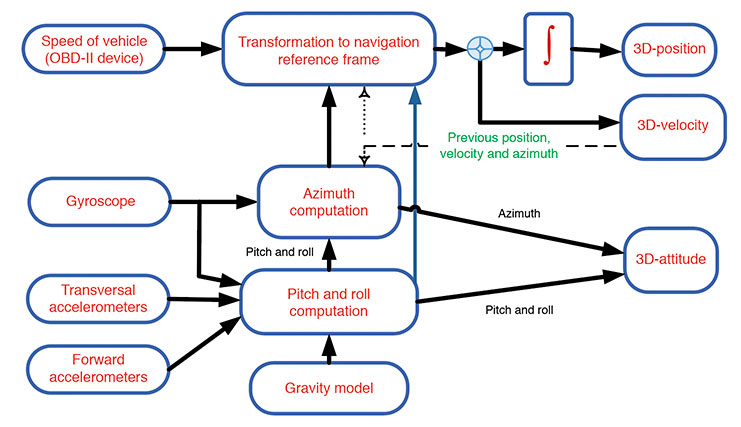
Our approach relies on a RISS incorporating a single-axis gyroscope, accelerometers, and speed measurements. Two accelerometers are used to estimate the pitch and roll angles instead of using two additional gyroscopes. Speed from the OBD-II device and heading information from the gyroscope aligned with the vehicle’s vertical axis enables the calculation of velocity, as shown in FIGURE 1. Calculating pitch and roll from accelerometers rather than gyroscopes retains RISS’s low cost while avoiding the gyroscope’s underpinning integration of velocity and position errors. When pitch and roll are calculated from accelerometers, the first integration of the gyroscope to obtain pitch and roll is eliminated, and thus the error in pitch and roll is not proportional to time integration.
FIGURE 1. Block diagram of speed measurements from the OBD-II device and RISS mechanization. (Image: Authors)
ACC-RADAR-BASED RISS
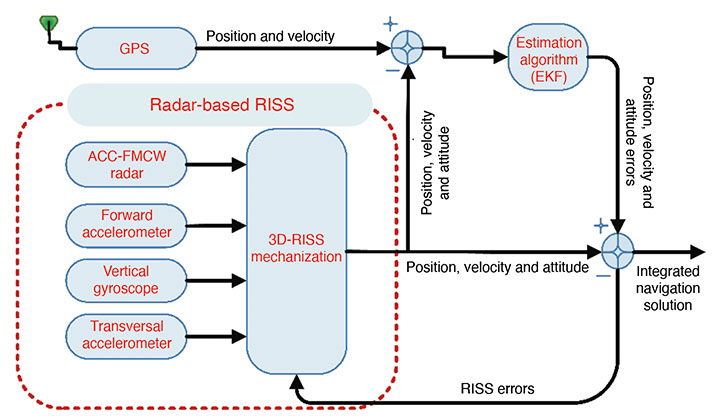
The radar-based RISS mechanization can provide a complete navigation solution (including 3D position, velocity and attitude) using a reduced number of sensors compared to the classic INS. It consists of longitudinal and transversal accelerometers, one vertical gyroscope and one radar unit (see FIGURE 2). In this mechanization, the OBD-II-device-related measurements are replaced by those extracted from the FMCW radar.
Data fusion is the process of combining data from multiple sensors and related information to achieve more specific inferences than can be achieved by using a single, independent sensor. Fusion processes are often categorized into three modes — low, intermediate and high-level fusion:
Data level combines several sources of the same type of raw preprocessed data to produce a new data set expected to be more informative and useful than the inputs.
Feature level combines features such as edges, lines, corners, textures or positions into a feature map used for the segmentation of images, detection of objects, and so on.
Decision level combines decisions from several expert modes. Methods of decision fusion are voting, fuzzy logic and statistical methods.
Various approaches for multi-sensor data fusion including weighted average, Bayesian estimators, adaptive observers, algebraic functions, fuzzy logic, neural network, soft computing, non-linear system fusion, and Kalman. Drawbacks of these methods include:
the necessity of adding new sensors to the system.
use of linear estimation models that need previous knowledge of signal statistics.
the presence of more than one faulty signal — an essential limitation of the performance.
the need to understand the behavior of the system to generate governing rules.
We used a data-clustering approach, which divides the data from a particular set into subsets (clusters) based on similarity. It could be defined as a reorganizing process for the dataset.
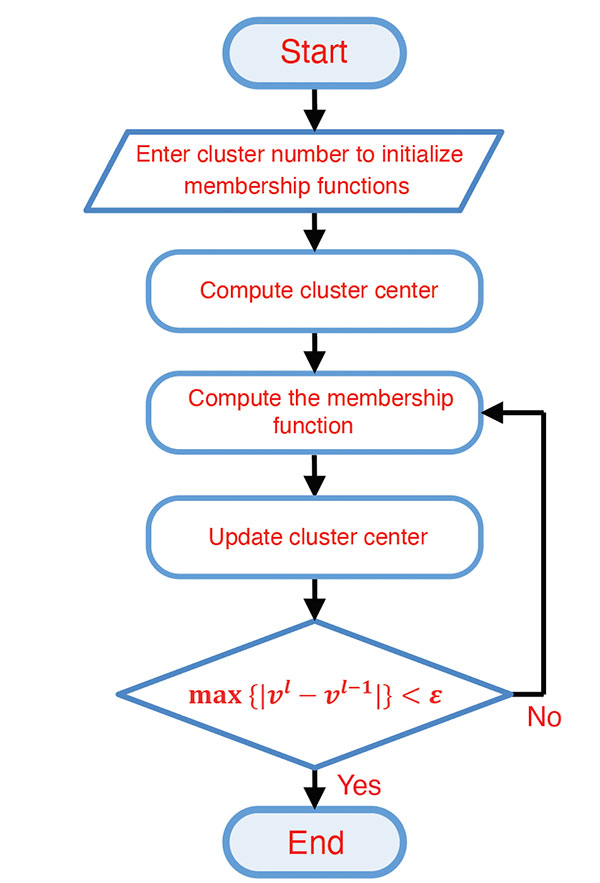
Fuzzy C-means (FCM) Algorithm. The FCM clustering algorithm represents the “fuzzify” step in the fuzzy system and is based on the minimization of an objective function called the C-means functional. The FCM algorithm (FIGURE 3) computes the standard Euclidean distance norm, which induces hyperspherical clusters. Hence it can only detect clusters with the same shape and orientation because the common choice of the norm-inducing matrix is the identity matrix. Three parameters in this algorithm have to be determined at the beginning: the number of clusters, the weighting parameter representing the system’s fuzziness, and the ending threshold, respectively.
FIGURE 3. FCM flowchart. (Image: Authors)
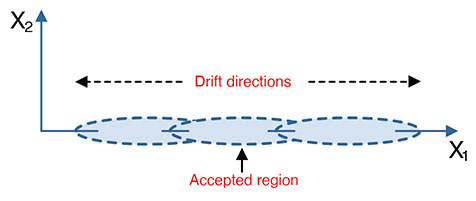
Cluster Number Selection. The FCM algorithm required predefining the number of clusters (Figure 3). This number can be entered randomly, taking iterations and time to converge to the best number, or be calculated. Many methods could be used, such as the validation parameters but only in an offline mode, or by using the data distribution itself and calculating the probability density function (PDF) by first calculating the data’s kernel and then calculating the PDF. This process can be done using the smooth kernel density estimator (SKDE), which is a powerful real-time approach. The main idea is that the measurements values drift in two directions around the acceptable region of measurements (see FIGURE 4). The number of clusters has to be determined in every instance of measurement. From the same figure, the partitions may be three if the drift was in two directions from the accepted region or may be two partitions if the drift at any instance were to the left or to the right direction (one direction drift).
FIGURE 4. Measured data partioning. (Image: Authors)
Subsequently, the number of clusters is determined according to the following two rules, based on the kernel estimator’s maximum peak location: If the maximum peak of the SKDE is left- or right-skewed, then the number of partitions is two; if the maximum peak of the SKDE is centered, then there are three.
METHODOLOGY
The methodology of the implementation of our approach is divided into two parts. The first part utilizes the FCM explained in the previous sections to produce a fused vehicle forward speed from the radar and the OBD-II device. The second part uses the fused speed in the INS mechanization instead of using one sensor only. Further, the mechanization output is integrated with the GPS receiver to establish a more accurate navigation system.
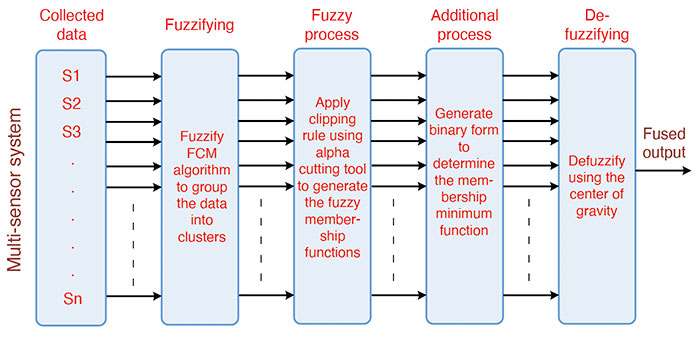
Sensor Fusion using Fuzzy Clustering. The data-fusion technique using the fuzzy clustering algorithm (FIGURE 5) consists of five main parts:
collecting data from the environment by using multiple sensors.
grouping the collected data by using the FCM algorithm in cluster form (“fuzzification”).
applying the fuzzy clipping rule using a cutting tool (fuzzy process).
making use of the clipping-rule properties to perform the fusion mechanism (additional process).
using the mean of the minimum to estimate the fusion output (“de-fuzzification”).
FIGURE 5. Sensor data fusion mechanization. (Image: Authors)
The first part is concerned with setting the sensors for measuring a particular phenomenon from the environment. The second part is to “fuzzify” these measured data, using the FCM to separate the sensors’ data to a certain number of clusters with membership matrix and cluster centers. The fuzzy process deals with the output clusters and membership functions through a fuzzy process called the fuzzy clipping rule. This rule divides the membership function into two regions: the upper region of the cutting threshold, which is clipped and is useless in the fuzzy environment, and the lower region from the cutting threshold, which is the useful region in the fuzzy environment.
Additional processes are applied to benefit from the previous stage — the existence of two regions, one useful, and the other not. This process aims to distinguish between the membership’s functions of the clusters. This could be achieved by generating a binary code that represents the membership function of the clusters. This binary code is generated by comparing the membership function with the threshold value. After the clustering process, each cluster membership function is represented as a binary code. The creation of this code depends upon the membership functions for the clusters and a variable threshold level.
The defuzzification part aims to extract the suitable value and in the same units as those of the measurements. This part produces the fusion output. This output comes from the minimum binary code, which denotes the selected suitable cluster membership function. This cluster contains the optimum solution. This solution or the fusion process output is determined by the centroid of the selected membership function.
Fusion-Radar-RISS/GNSS Integrated Navigation System. In this part of our technique, the fusion algorithm’s output is used in producing a full navigation solution as a control input of the RISS mechanization. This solution is subsequently integrated with the GPS receiver in a loosely coupled scheme using an extended Kalman filter (EKF). The overall proposed integrated navigation system is shown in FIGURE 6.
We carried out the experimental work to verify the proposed navigation system’s effectiveness by traveling real road trajectories. The testbed equipment was mounted inside and outside the test van.
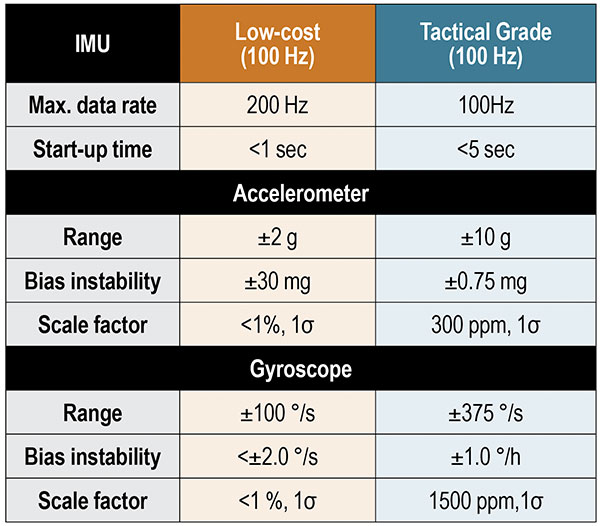
The interior testbed coincides with the van axes. It was rigidly and firmly fixed in the rear seat location using a standard seat chassis. For inertial sensors, we used both a low-cost MEMS IMU and a tactical-grade IMU. The specifications of these units are shown in TABLE 1.
TABLE 1. Performance characteristics of IMUs.
We used a dual-frequency GPS receiver with an output rate of 1 Hz. The tactical-grade IMU includes three fiber-optic gyroscopes and three MEMS accelerometers. The tactical-grade IMU and the GPS receiver were integrated using an off-the-shelf assembly developed by the manufacturer to provide a fully integrated, tightly coupled GNSS/IMU system that delivers a highly accurate 3D navigation solution. This tightly coupled integrated system from the manufacturer is used as a reference to compare the performance and the effectiveness of our proposed methods.
The FMCW radar development kit from the manufacturer was mounted on the front bumper. The unit’s working frequency is 24.5 GHz with a maximum frequency span of 1.5 GHz, a maximum update rate of 10 Hz, a maximum detectable speed of 215 kilometers/hour, and a 3 dB-beamwidth angle of 8.5°. The chirp frequency spans were adjusted to be 0.125 GHz. The maximum coverage range was 30 meters, and the minimum was 0.5 meters.
RESULTS AND DISCUSSION
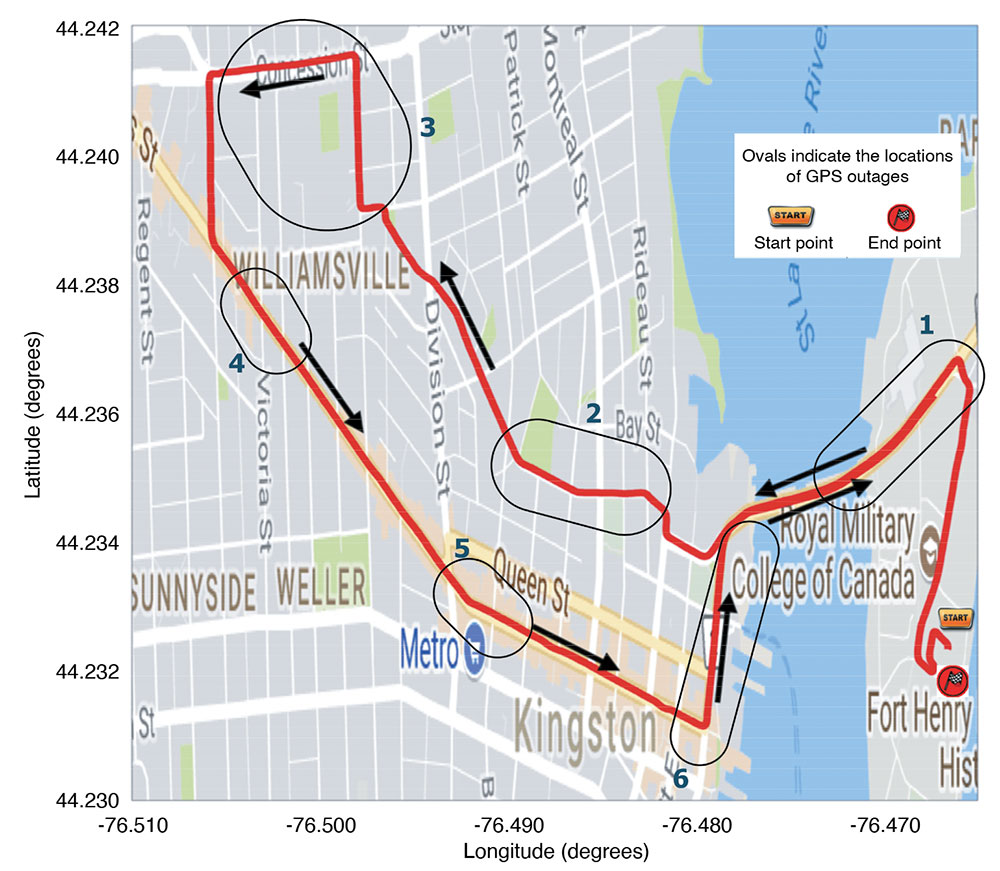
We conducted a road test with the proposed approach in the downtown area of Kingston, Ontario, Canada, in August 2017.
The trajectory followed is shown in FIGURE 7 projected on a Google map with the approximate locations of the outages. The reference is plotted in red, and the black arrows mark the direction of motion.
FIGURE 7. Road test trajectory with ovals indicating the approximate locations of GPS outages. (Image: Author)
Performance Evaluation. The proposed system performance was tested over six simulated outages. The outages have been selected to contain several dynamics such as turns, consecutive turns, stopping, crossing intersections, and straight driving. Furthermore, the outages occurred at different speed levels. The proposed system performance was compared to the traditional RISS/GPS and Radar/RISS/GPS integrated navigation system. The comparison criteria are 2D-position root-mean-square error (RMSE) and the maximum errors.
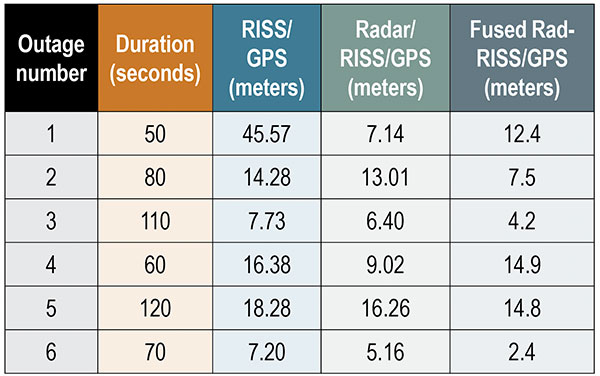
We compared our results using the radar-only versus OBD-II device test. TABLE 2 shows the RMSE of the 2D-position from the three systems in meters. Notice that the proposed system’s performance is better than the other two systems during four of the six outages. This result was achieved using the smart fusion technique to fuse the FMCW radar and the OBD-II speed measurements. Accordingly, the obtained speed is positively affecting the overall system performance.
TABLE 2. 2D-Position RMS-error for the low-cost INS unit during outages.
The average 2D-position RMSE reached 18.24 meters when using the OBD-II speed measurements only and 9.5 meters when using the radar only. On the other hand, the RMSE reached 9.4 meters when using the fusion between the two systems. The improvement percentage was 48.4% when applying the proposed integrated navigation system and 47.8% when using the radar-based system. The results show that the proposed system outperformed the other systems in outages 2, 3, 5 and 6 but did not do better than the radar-based system in outages 1 and 4. We highlight three outages.
The first outage had two left turns after a stop sign over a slippery road. This outage lasted for only 50 seconds, but the system’s behavior was due to wrong measurements combined with a complicated driving scenario when using the traditional RISS/GPS. On the other hand, the radar-based RISS/GPS produces a better solution because of having better velocity measurements in the mechanization, which provides the navigation filter with a better navigation solution. The proposed system limits the drift to around 16.7 meters, while the traditional system had a 68.7-meter drift in its solution.
The proposed system based on the fusion between both speed sensors — OBD-II and radar — could not compete with the radar because of the enormous gap between the two sensors and the lack of extra sensors. Despite that, the system produced a solution with 2D-RMSE of 22 meters, which is also better than the traditional RISS based on the OBD-II device and close to the results from fusing the radar. This problem can be solved by using an extra radar unit, typically installed with an ACC system. The system usually uses six radar units, two in the front and four at the vehicle’s corners.
The second outage duration was 80 seconds and contained two consecutive turns, right then left. The radar-based system reduced the solution drift from 28.13 to 23.58 meters. In contrast to the previous outage, the proposed system reduced the 2D-position maximum error to 14.2 meters. The proposed system’s result is superior to the radar-based system, which performed better in the previous outage because the OBD-II and radar measurements gap is not as large as the previous outage. The dynamics, the average speed and the road surface differ from the first outage.
The third outage was chosen to be a slight turn and mostly straight driving with an average speed of 60 kilometers/hour. This outage lasted for 110 seconds, and the proposed system holds the solution error growth down to 8.9 meters. The traditional system had a higher error growth rate and held it to 20.6 meters, and the radar-based system error reached 14.92 meters. This outage contained fewer dynamics when compared to other outages. Moreover, the slippage and false counting by the OBD-II device was not as considerable as in the first outage.
CONCLUSIONS AND FUTURE WORK
The performance of using a multi-sensor data-fusion technique based on fuzzy clustering successfully fuses the data measured by both the radar and the OBD-II device to produce a more robust forward speed of a moving land vehicle. The proposed system performance tested during six simulated GPS outages containing various dynamics significantly improved the overall navigation system, especially when the GPS signals were blocked. Finally, the fusion between multiple sensors leads to better performance if there are enough sensors or a fault-detection system to prevent the faulty sensor from biasing the fusion results. Moreover, the results demonstrate the superiority of the proposed fused radar RISS/GPS over each system alone.
As an extension to work reported here, we plan to apply our approach with an extra number of sensors to avoid the kind of drift that happened in outage number one. In addition, we suggest that a sensor fault-detection smart algorithm be added to the system to detect and control faulty sensors.
ACKNOWLEDGMENT
This article is based on the paper “Enhanced Land Vehicle Navigation by Fusing Automotive Radar and Speedometer Data” presented at ION GNSS+ 2020 Virtual, the 33rd International Technical Meeting of the Satellite Division of The Institute of Navigation, Sept. 21–25, 2020.
MANUFACTURERS
Our testbed used a Crossbow (now Moog Crossbow, www.moog.com) MEMS-grade XBOW IMU300CC IMU and a NovAtel/Hexagon (www.novatel.com) IMU-CPT tactical-grade IMU. We also used a SPAN-OEM4 or SPAN-SE NovAtel/Hexagon dual-frequency GNSS receiver. The radar development kit used is a Sivers IMA (now Sivers Semiconductors, sivers-semiconductors.com) RK1001K/00.
ASHRAF ABOSEKEEN is a lecturer in the Department of Avionics Engineering, Military Technical College, Cairo, Egypt. He received a B.Sc. and M.Sc. in electrical engineering from the Military Technical College in 2004 and 2012, respectively. He received his Ph.D. from the Department of Electrical and Computer Engineering, Queen’s University, Kingston, Ontario, Canada, in 2018.
UMAR IQBAL is an assistant clinical professor in the Department of Electrical and Computer Engineering, Mississippi State University. He completed his Ph.D. in electrical and computer engineering at Queen’s University in 2012.
ABOELMAGB NORELDIN is a professor in the Department of Electrical and Computer Engineering, Royal Military College of Canada, Kingston, Ontario with a cross-appointment at both the School of Computing and the Department of Electrical and Computer Engineering, Queen’s University.
Orolia, through its Orolia Defense & Security business, announced in November 2020 the launch of M-code military GPS receivers in its line of positioning, navigation and timing (PNT) solutions.
The line includes M-code-enabled mobile mission timing and synchronization platforms, such as the SecureSync IDM resilient time and frequency reference solution, the first time server approved by the Defense Information Systems Agency (DISA), and the Versa mobile PNT platform to meet rugged size, weight, power and cost (SWaP-C) requirements.
M-code is a military signal used in the L1 and L2 GPS bands. It is required by congressional mandate for U.S. Department of Defense (DOD) military operations.
M-code is designed to enhance PNT capabilities and improved resistance to existing and emerging threats to GPS, such as jamming and spoofing. Operational benefits of M-code include:
a higher power signal that offers improved resistance to jamming and interference
advanced security features to prevent unauthorized access or exploitation
improved message formats and signal modulation techniques for faster and more accurate performance.
Orolia has long supported the DOD’s need for selective availability anti-spoofing module (SAASM)-enabled PNT equipment, explained Hironori Sasaki, president of Orolia Defense & Security. “This announcement emphasizes our move toward M-code and the availability of M-code in our products,” Sasaki said. “Our focus has always been on staying in sync with the DOD and providing the latest and greatest technologies.”
Orolia now supports M-code in all its user products and offers two capabilities: simulation and M-code-enabled end-user devices. “They will each have a different approval process for export,” Sasaki said. “We follow DOD guidance on getting that capability out there.”
SecureSync, which is SAASM-enabled, has been deployed with DOD for many years, so Orolia has “a very good install base” of these devices, according to Sasaki. “We are providing a very easy and seamless upgrade path to go from SAASM to M-code in that platform.” The company’s Versa platform consists of the VersaSync and the VersaPNT, both small form-factor PNT devices designed for rugged application in military vehicles or military aircraft.
DOD has given Orolia approval to advertise the fact that it has these capabilities in its products. “We are expecting shipments to start in early 2021,” said Sasaki. “So, we are well on our way in development, implementation and productization.”
“We have been focusing on providing products that have a modular architecture, both in software and hardware,” Sasaki added. “We are embracing this approach of open architecture and continue to support the DOD in providing different layers of sensing and PNT protection in a way that can be incorporated into future DOD systems.
“We have already demonstrated our ability to deliver PNT solutions in various form factors, so I think we are in a good position to continue pushing forward with that open architecture approach,” Sasaki said.
James D. Litton, GPS pioneer and founder of NavCom Technology Inc., died over the weekend at his home in California with his family at his side. He was 89 years old.
Litton was an early contributor to the development of GPS user equipment. He also played a pivotal role in the GPS-driven transformation of global agriculture that has greatly benefited humanity.
Litton was the director of engineering at Magnavox Research Labs when researchers were working on using CDMA for range measurements, a precursor to the GPS system. He also worked on the original proposal for GPS Phase I.
Later, as general manager of Magnavox’s Marine and Survey Systems Division, he helped develop new and advanced commercial navigation and survey receivers for both the Navy’s TRANSIT system and the Air Force’s GPS.
His team developed the first microprocessor-based commercial satellite navigation receivers and the first commercial GPS survey software. This led to Magnavox eventually having more than a 90 percent share of the survey receiver market.
The firm eventually held more than two dozen patents for improvements in GPS technology.
In 1992, Litton left Magnavox to start a consulting business. Two years later, with Ron Hatch, K.T. Woo and Jalal Alisobhani, he founded NavCom Technology Inc. With Litton as CEO, NavCom became a significant player in the GPS marketplace. Among its achievements was development — under contract — of a single-frequency WAAS-capable GPS aircraft navigation receiver.
NavCom also began a relationship with Deere & Company, supporting more efficient and productive agriculture. This relationship was so successful that Deere purchased NavCom in 1999. Litton continued to lead the company and serve as part of Deere’s senior management team for eight more years.
In recognition of his many achievements to the field, Jim Litton was presented the Institute of Navigation’s Hays Award in 2006.
Among his many contributions, his impact on global agriculture might well have been his greatest, according to Brad Parkinson, the original chief architect for GPS.
“His work transformed agriculture into a data-driven, technological industry that was incredibly more efficient,” Parkinson said. “The cost savings and increases in productivity have impacted billions around the world.”
Jim’s family has created a memorial fund at Doctors Without Borders for those wishing to make a donation in honor of his life and many good works. Click here.
Findings show accuracy of new sensors is improved by greater than an order of magnitude over current offerings.
Honeywell, with funding from the U.S. Defense Advanced Research Projects Agency (DARPA), is creating the next generation of inertial sensor technology that will one day be used in both commercial and defense navigation applications.
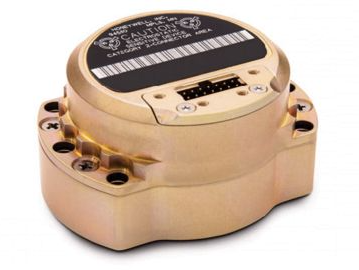
The HG1930 IMU. (Photo: Honeywell)
Findings gathered in Honeywell labs have shown the new sensors to be greater than an order of magnitude more accurate than Honeywell’s HG1930 inertial measurement unit (IMU) product, a tactical-grade product with more than 150,000 units currently in use.
An IMU uses gyroscopes, accelerometers and electronics to give precise rotation and acceleration data to enable a vehicle system to calculate where it is, what direction it is going and at what speed, even when GPS signals aren’t available.
There are various types of IMUs on the market, and some — like the next-generation version currently under development — use sensors based on micro-electromechanical systems (MEMS) technology to precisely measure motion.
“Typically, MEMS inertial sensors have been on the lower end of the performance scale, but this latest milestone shows we are changing that paradigm,” said Jenni Strabley, director of offering management for Inertial Sensors, Honeywell Aerospace. “With this next-generation MEMS technology, we’re increasing performance without having to significantly change the size or weight of the IMU. This is a game-changer for the navigation industry, where customers need highly accurate solutions but cannot afford to compromise on weight or size.”
Over the past few years, Honeywell has been working with DARPA to develop the next generation of high-precision navigation-grade IMU technology, under the Precise Robust Inertial Guidance for Munitions: Thermally Stabilized Inertial Guidance for Munitions program.
The new MEMS sensors will use different sensor designs and electronics to enable higher performance. They will serve a broad range of applications in autonomous land and air vehicles for both military and commercial customers, including future urban air mobility aircraft.
“Now that we have demonstrated that MEMS is capable of reaching these incredibly precise performance levels, it is the perfect time to start talking with potential users about how this technology could help their applications,” Strabley said. “We believe this new technology will have a variety of applications, such as onboard future vehicles that will fly in urban environments where lightweight, extremely precise navigation is critical to safer operations. Additionally, there are other applications that haven’t been invented yet but may be enabled by these types of technology innovations.”
Commercial sales of an IMU containing these next-generation sensors are still several years away, but one of the first products using this new technology is expected to be more than 50 times more accurate while roughly the same size as Honeywell’s IMU.
Honeywell has long been a pioneer in MEMS-based IMUs, including the HG1930. Honeywell’s lineage in navigation dates to the 1920s and since then Honeywell has developed and manufactured high-performance navigation solutions found on many aircraft and other vehicles worldwide.
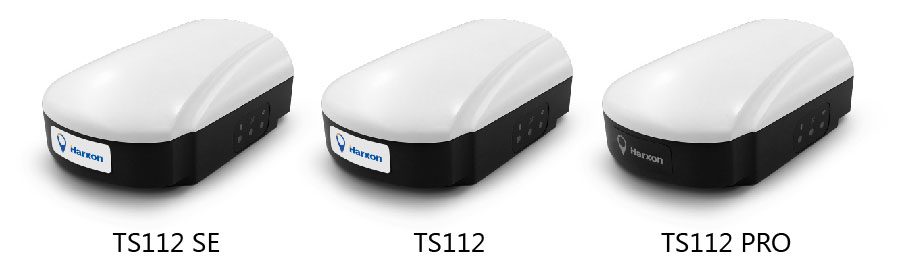
Harxon has introduced its TS112 family of smart antennas for demanding applications such as agricultural machine autosteering systems that require high positioning-accuracy. Harxon made the introduction in a virtual meeting on Jan. 13 from Shenzhen.
The TS112 family features Harxon’s latest GNSS positioning technology and offers scalable positioning solutions with increased GNSS availability, reliability and accuracy.
Each of the three models embed Harxon X-Survey four-in-one technology. The high-gain and wide beamwidth multi-constellation GNSS antenna integrates 4G, Bluetooth and Wi-Fi in one compact unit. They feature multi-point feeding technology, ensuring high phase-center stability and real-time kinematic (RTK) centimeter-level positioning accuracy.
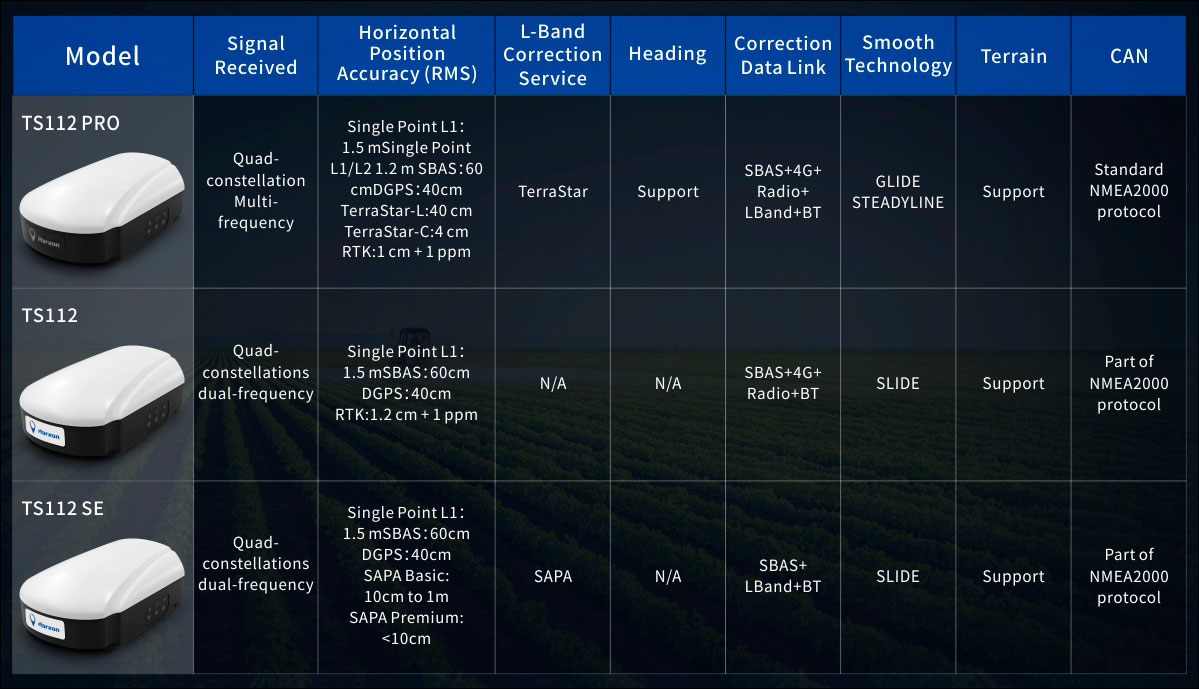
TS112 Smart Antenna Family Specifications. (Chart: Harxon)
The TS112SE, as the most affordable solution of the three, provides flexible positioning solutions via standalone positioning or dual-frequency precise point positioning (PPP) with accuracy from sub-meter to centimeter level while using Sapcorda’s SAPA (Safe and Precise Augmentation Service). Its comprehensive support and L-band augmentation service ensure solid satellite tracking without signal outage even in difficult terrains or problematic environmental conditions.
SAPA works as a reliable alternative economical positioning option with wide service coverage in the application environment that has poor LTE network coverage.
The TS112 integrates a high-precision GNSS module with multi-band GNSS receiver and Harxon’s four-in-one multifunctional GNSS antenna in a compact housing. It supports dual-frequency multi-constellations for consistent and robust satellite signal tracking and delivers RTK-level positioning accuracy for precision agriculture equipment and machine control. It offers a 4G and UHF radio modem for flexible correction transmission as well as wireless Bluetooth technology for easy connectivity in the field.
The TS112 PRO employs a future-ready Hexagon OEM GNSS module, offering precise positioning and advanced interference mitigation for space constrained applications and challenging environments.
With centimeter-level positioning utilizing TerraStar satellite-delivered correction services, Harxon’s TS112 PRO ensures globally available, high performance positioning without the need for network infrastructure. Harxon’s TS112 PRO also support NTRIP service, so in application environments where using a base station is not feasible, the NTRIP differential corrections could be transmitted to a rover using 4G networks and enable users reaching ultimate centimeter level positioning accuracy.
The TS112 PRO also features Hexagon’s Glide smooth positioning that offers superior pass-to-pass accuracy down to 20 centimeters for applications where relative positioning is critical.
All models in the TS112 family support Harxon Slide technology to provide smooth positioning and exceptional linear accuracy so that the guiding system can continue to guide during satellite signal outages or in challenging environments.
The newly released family also support Harxon terrain compensation algorithm that is capable of correcting deviations that caused by vehicle’s roll and pitch while working on uneven grounds or slopes. It helps users increase operational efficiency and saving cost in the field.
Adopting ruggedized and IP67 standard housing, the TS112 family equip NMEA0183 and NMEA2000 CAN ports, RS-232 serial ports for easy connectivity.
An ESA-supported project is testing autonomous vehicles on an intelligent road in Lapland, Finland.
Known as Snowbox, this 10-km stretch of forest-lined roadway on Finland’s E8 highway has been specially equipped for autonomous driving tests, ESA said. Containing cameras, “laser radar” lidar, ultra-wideband antennas and reflective panels, the road itself is underpinned by power and fibre optic lines, and embedded with pressure sensors to record road surface conditions and the speed and type of vehicles driving along it.
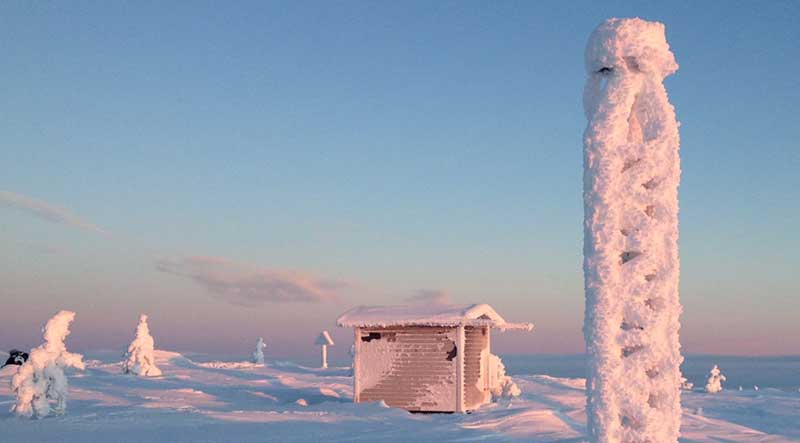
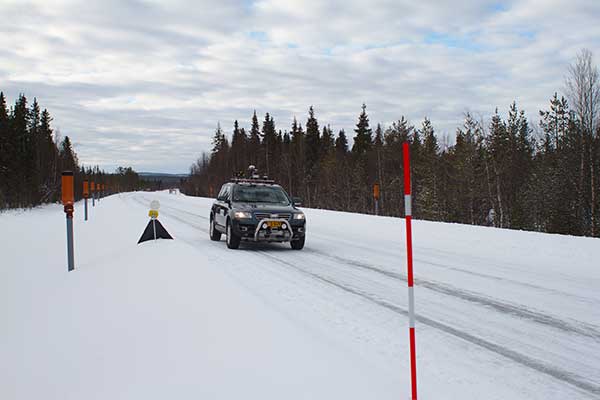
Known as Snowbox, this 10-km stretch of forest-lined roadway on Finland’s E8 highway has been specially equipped for autonomous driving tests, including FinnRef GNSS reference stations, as seen here. (Photo: ESA)
“If autonomous vehicles can drive well here, they can drive almost anywhere,” said Sarang Thombre of the Finnish Geospatial Research Institute, who’s managing the Arctic-PNT project. “Our project aimed at ensuring in particular that the precise positioning required by autonomous systems was available here, to establish this test site is indeed somewhere that driverless vehicle manufacturers should employ for testing. We carried out experiments with a robotic car over two successive seasons to show that the necessary precise positioning, down to 20 cm, is indeed accessible.”
Snowbox is also linked to the FinnRef network of satellite navigation reference stations, to deliver corrections for precise satnav positioning. By performing positioning measurements continuously at fixed locations, these reference stations serve as a standard, allowing the identification of measurement errors to boost positioning accuracy on a localized basis, ESA added.
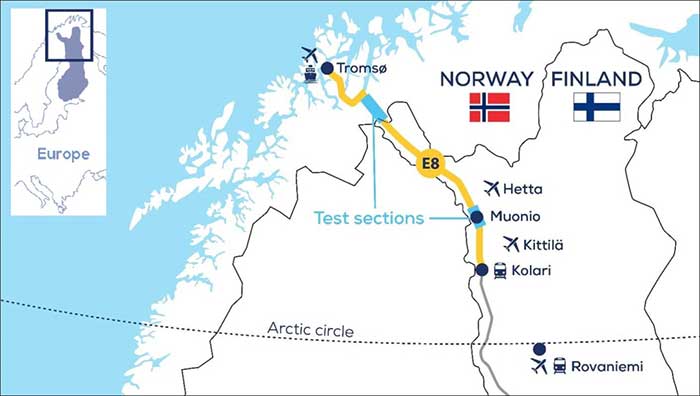
Snowbox map. (Photo: ESA)
“The Arctic is a difficult environment for autonomous driving in general,” Thombre said. “Signal disturbance due to the ionosphere, the electrically charged layer of the atmosphere, degrade satellite navigation performance. This effect is more pronounced in the Arctic region. And satnav augmentation systems also face challenges.
“Because their signals are broadcast from geostationary satellites, they are only viewable here at an elevation of up to 10 degrees above the horizon. And mobile coverage — useful for providing correction data from reference networks — is also inconsistent.
“In addition, possibility of mists and fog, snowstorms and rainfall make it difficult for cameras and lidar, while ice and snow on the road means wheel speed sensors may slip. And temperatures that can plunge down to below -30°C can impede the performance of electronics.”
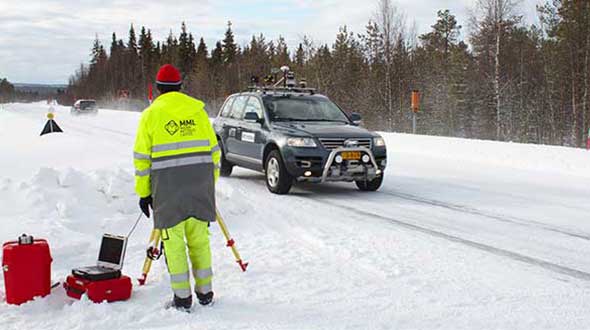
The Arctic-PNT team’s testing was based around a robotic car crammed with sensors and recording equipment. Called Martti, the vehicle was supplied by Finland’s VTT Technical Research Centre.
Snowbox test roadway. (Photo: ESA)
“While Martti is capable of autonomous driving, we drove it manually,” Thombre said. “We were using it to capture all the data we needed. We started off using solely satellite navigation – including Europe’s Galileo and EGNOS – progressively adding more and more augmentation data, including in-car sensors, and corrections from the FinnRef stations, to reach the all-important precise positioning threshold of 20 cm.
“To access the FinnRef corrections from the car systems we tested out various mobile sim cards. Adding to the challenge, we crossed an international border, because part of the E8 highway is instrumented on the Norwegian side as well — called Borealis.”
The Snowbox infrastructure was established along the E8 because, while it is a remote roadway it is also economically important, with trucks heading south from Arctic fisheries.
The Arctic-PNT test campaigns, starting from 2018, gave a positive bill of health to the Snowbox, which is available for experiment campaigns. The campaigns were supported through ESA’s strategic initiatives for the Arctic region.
Feature image: The Arctic-PNT team’s testing was based around a robotic car crammed with sensors and recording equipment. Called Martti, the vehicle was supplied by Finland’s VTT Technical Research Centre. (Photo: ESA)
Trimble has introduced the Trimble AX940 and AX940i high-precision GNSS smart antennas, designed for a broad range of high-precision applications such as precision agriculture, milling machines in construction, forestry harvesting equipment, autonomous vehicles, port automation and mobile mapping.
With multi-frequency, multi-constellation support for GPS, Galileo, GLONASS, BeiDou, QZSS and NavIC, the smart antennas can deliver reliable centimeter-level accuracy in a variety of environments. In addition, the Trimble AX940 and AX940i provide reliable, high-accuracy positioning without the constraints of a local base station or cell modem by using Trimble RTX correction services.
Built-in inertial sensors on the AX940i allow a tight integration with GNSS observations in the RTK/RTX positioning and orientation engine, providing continuous high-rate low-latency output to guidance and control systems.
“The new AX family of smart antennas delivers the latest GNSS and inertial technology in an easy-to-integrate and rugged form factor,” said Thomas Utzmeier, general manager for Trimble OEM GNSS. “Reliable, robust and compact, the smart antennas are an ideal option for OEMs and system integrators to easily and quickly add high-accuracy positioning to their applications.”
The Trimble AX940 and AX940i provide flexible interfaces with high-speed data transfer and configuration; simplified integrations reduce development times; and an intuitive 3D graphical web page allows easy input of the lever arm for easier set up.
The full-featured smart antennas are equipped with 336 channels for multi-constellation support; Trimble RTX and OmniSTAR support; flexible RS232, USB, CAN and Ethernet interfaces; and advanced RF spectrum monitoring. The AX940i also includes Wi-Fi and Bluetooth connectivity for wireless interface and control.
Using the latest Trimble Maxwell 7 Technology, the AX940 and AX940i are designed with flexible signal management that enables the use of all available GNSS constellations and signals.
The Trimble AX940 and AX940i smart antennas are expected to be available in the first quarter of 2021 through Trimble’s OEM GNSS Sales Channel.
After years of testing and hype, not a lot of companies can say there are real applications for autonomous technology. However, at this year’s virtual CES 2021 trade show, both Caterpillar and John Deere, two companies known for their tractors and heavy equipment, showcased autonomous machines that are being used worldwide in farming and mining projects.
Photo: Caterpillar
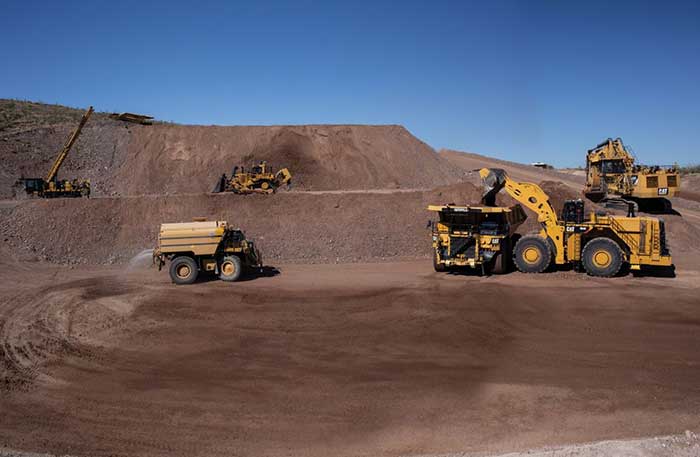
Deerfield, Ill.-based Caterpillar, a first-time exhibitor at CES this year, said it has been involved in autonomy and use of GPS for more than two decades. “We were an early adopter of GPS when there were few satellites in the sky,” said Denise Johnson, company group president, resource industries. “We have 350 autonomous trucks operating 24-7 on three continents.”
The company’s autonomous vehicles, in addition to other technology, are being used around the clock in the Kearl Oil Sands project in Alberta, Canada.
“We are using autonomy primarily in mining operations in harsh environments. These [vehicles] are operating 24-7, with no loss time incidents,” said Bill Dears, Caterpillar worldwide sales and marketing manager. “We also track people underground with cameras and radar.”
In addition to production enhancement, safety is a factor in mining operations because of operator fatigue — something that is precluded by autonomous mining equipment, Dears said.
Agriculture uses variety of sensors, including GNSS
To Moline, Ill.-based John Deere, exhibiting at the trade show for the third time, agriculture is a high-tech industry that uses GPS, self-driving tractors, artificial intelligence and a multitude of sensors. The company rolled out its first self-driving tractors nearly 20 years ago, said Jahmy Hindman, John Deere CTO.
Photo: John Deere
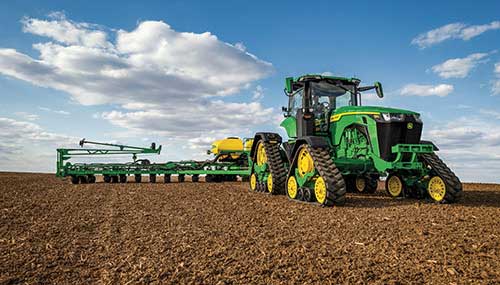
The company won the CES Innovation Award for one of its tractor and combine product lines. “Both our planter and tractor have GPS and antennas to know where to drive and where exactly fertilizer [is to be placed],” Hindman said. “These tractors are self-propelled, with accuracy augmented with [real-time kinematic] sub-inch accuracy for the planters in a field.”
Among other requirements, Hindman said that tractors have to drive in a straight line, plant the required amount seeds and position them at the right depth. “When a tractor drives in a very straight line, the burden is off of the farmer. The yields increase—this is the way we see the progression of automation,” he said. “We are excited about 5G and its lower latency and high bandwidth. It opens up a lot of opportunity.”
Organizers roll out Indy Autonomous Challenge race car
At the virtual CES, representatives from the Indy Autonomous Challenge unveiled the Dallara IL-15 race car that will be used in a head-to-head race around the famous Indianapolis Motor Speedway on Oct. 23.
The Indy Autonomous Challenge, organized by Energy Systems Network and Indianapolis Motor Speedway, pits 500 university students, developing autonomous vehicle technology, against each other for a $1.5 million prize.
Logo: Indy Autonomous Challenge
Organizers say the speeds are estimated to be as much as 200 mph around the 2.5-mile track, for 20 laps, which enables researchers to evaluate how autonomous vehicle technology works in extreme conditions. They say that the goal of the race is to advance the implementation of autonomous vehicles and advanced driver-assistance systems (ADAS), much like the 2005 Defense Advanced Research Projects Agency (DARPA) Grand Challenge.
The race track has been the scene of much innovation throughout the years, said Doug Boles, Indianapolis Motor Speedway president. “Firestone tests tire technology there and that data transfers to our cars. One of the first conversations we had with Roger Penske [after Penske Entertainment bought the speedway] was about the autonomous challenge,” he said.
IAC sponsors include ADLINK, Ansys, Aptiv, AutonomouStuff, Bridgestone, CU-ICAR, Dallara, Indiana Economic Development Corp., Microsoft, New Eagle, PWR, RTI, Schaeffler and Valvoline.
Mobileye plans to test autonomous fleets in four cities
Intel subsidiary Mobileye plans to launch autonomous vehicle fleet testing in Detroit, Paris, Shanghai and Toyko. The announcement, made at CES by CEO Amnon Shashua, said that the company also plans to test in New York City, pending regulatory approval.
The company also plans to use in-house-built lidar sensors, while continuing to champion its camera-based testing. “We are using crowd-sourced data through the Cloud to build high-definition maps at scale,” Shashua said. “Thousands of product vehicles are sending us data.”
Shashua addressed a moderator’s question that cameras alone cannot be the technology of choice for autonomous vehicles. “The camera first is crucial from a technology and business point of view. We have to find out what is acceptable failure for Level 4 autonomy. Camera-only is ideal, but pushing the envelope for driver-assistance systems,” he said. “Consumer AV will take place in the 2025 timeframe. [Eventually], we can build lidar and radar to the same performance levels as camera systems. Lidar and radar can be added later for redundancy, but only for Level 4.”
Shashua said getting to Level 4 could take a decade, but that would be unsustainable unless there are government-funded projects to keep companies afloat. “By 2025, a subsystem will be good enough for consumers. Regulation is critical and sometimes it’s difficult to leap to a consumer level,” he said.
Not everyone believes what Mobileye is testing constitutes “driverless” status. To Alain Kornhauser Princeton University professor and transportation program director, who was head of the university’s team during the 2005 DARPA Challenge, not many companies are capable of full driverless capability.
“Unfortunately, I still see all of this as simply ‘eye candy’ to sell something that actually has no intention of delivering what it is implying. I still claim that the business case is zero, doesn’t exist, for personally-owned autonomous vehicles,” Kornhauser said in his Smart Driving Cars weekly newsletter. “Mobileye is nowhere close to being able to operate safely on most roads, let alone all roads. Thus, the consumer market has zero opportunity to scale.”
Kornhauser said that driverless testing is being conducted only in one place, Phoenix, by Waymo. “Neither Tesla nor Mobileye are driverless anywhere. They both require on-board human driver supervision,” he said. “That’s why they are only self-driving [tests].”
In other CES news:
GM CEO Mary Barra unveiled a single-seat electric vertical takeoff and landing (eVTOL) concept aircraft. The aircraft will be developed for future use as an air taxi. Barra briefly mentioned that the company’s Super Cruise self-driving technology will be integrated into 22 car models in a few years. The company also rolled out an electric vehicle for deliveries that can travel 250 miles on a charge and a motorized pallet for deliveries that can be tracked.
Photo: Mercedes-Benz
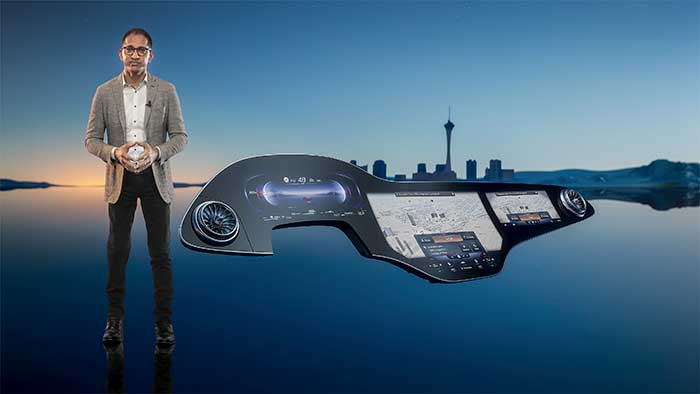
The Mercedes-Benz’ MBUX Hyperscreen, rolled out at CES, evaluates map data, surroundings and provides information about landmarks along a route, said Sajjad Khan, company CTO and member of the board of management. The new map feature, called Mercedes Travel Knowledge, allows a passenger or driver to ask a question as they drive by a landmark (“hey, Mercedes, what can you tell me about this building?”). The MBUX Hyperscreen is available in the new S-Class cars.
HERE Technologies introduced a mapping-as-a-service platform at CES. The platform is targeted to businesses wanting to create custom map datasets for advanced analytics and services, the company said. Some use cases include industrial yard mapping, leveraging probe data from private vehicle fleets in order to create or update a map.• A virtual CES is hard to get used to. After more than 20 years of covering the massive trade show in person, covering press conferences and conducting interviews online was sometimes a challenge. Sometimes the press conferences did not have question-and-answer sessions, or canned answers given to executives by public relations people. This doesn’t happen much during an in-person interview. In addition, trying to chat with “booth” personnel online was cumbersome and often those requests for information were ignored.