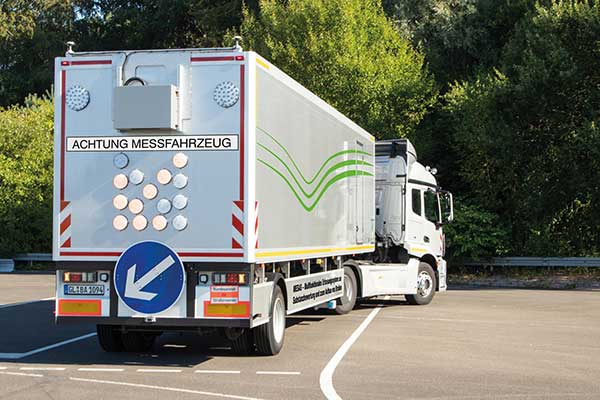
Germany’s Federal Highway Research Institute (BASt) is using a specialized semi-truck to analyze and map road surfaces. The research vehicle uses GNSS, scanner and camera equipment to record the condition of road surfaces and the substance of the asphalt surface, providing the basis for optimum maintenance planning.
The truck is part of the BASt’s MESAS program, which began in 2018. The unique measuring vehicle is a multi-functional assessment tool for fast-moving substance detection, such as for structural evaluation and design of pavements.
For the MESAS program, innovative measurement technology was installed on a single-axle semi-trailer, with all measurement systems synchronized and georeferenced using a GNSS system.
The MESAS measuring vehicle is 14.5 meters long and weighs 22 tons. At speeds of up to 80 km/h, MESAS records road condition parameters with high precision. (Photo: BASt)
The vehicle includes:
the Pavement Profile Scanner PPS-Plus from Fraunhofer IPM
a laser-based Traffic Speed Deflectometer (TSD) that measures short-term reversible deformations of the road surface
a georadar that detects layer thicknesses and inhomogeneity of the road superstructure
ambient cameras that provide images for interpreting the georadar measurements
During test runs, the vehicle system successfully measured more than 11,000 kilometers of the country’s trunk-road network. Now it begins regular operation.
“MESAS is a globally innovative measuring system,” said Dirk Jansen, department head, BASt. “Here we have a really powerful tool at our disposal with which we can make an innovative and significant contribution to the further development of conservation planning.”
Millimeter precision. The Pavement Profile Scanner PPS-Plus records the transverse evenness of the road surface with high precision. The scanner, the size of a shoe box, is mounted on measuring vehicles and scans the road surface with an eye-safe laser beam over a width of about 4 meters. The distance to the road surface is determined with sub-millimeter accuracy using phase-shift technology.
The laser scans the surface with the aid of a rotating polygon mirror perpendicular to the forward movement of the vehicle and generates 800 profiles per second. Each profile consists of up to 900 measuring points, depending on the selected measuring frequency. In this way, the PPS generates a detailed 3D height profile of the road surface.
At traveling speeds of 80 km/h, the measuring point distance in the longitudinal direction is approximately 28 millimeters; in the transverse direction it is 4.5 millimeters. It also provides photorealistic grey-scale images of the road surface that show millimeter-thin structures, such as small repairs and patches.
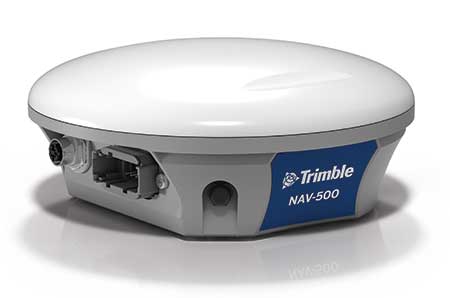
Trimble has introduced the GFX-350 display and NAV-500 guidance controller, providing a cost-effective option for farmers seeking to adopt the latest precision agriculture technology for their daily operations.
The GFX-500 display. (Photo: Trimble)
The GFX-350 Android-based touchscreen is a cost-effective way to introduce auto-steering and application control to the farm. The 7-inch (18-centimeter) screen is easy to read and can be used to control most field operations with a few taps.
The display is compatible with both the NAV-500 and the NAV-900 guidance controllers, satisfying different user accuracy needs. The simple and intuitive Precision-IQ operating system speeds up field work and makes equipment configuration a breeze. Once vehicles, fields, implements and materials are set up during the first use, they are saved and can be re-used with a couple of clicks.
The NAV-500 controller. (Photo: Trimble)
In addition, the GFX-350 display is fully ISOBUS compatible, offering plug-and-play capability for ISO-enabled implements with native task controller and universal terminal functionality. The display also features onboard Wi-Fi and Bluetooth connectivity, allowing seamless sharing of data between the office and the field via optional Trimble Connected Farm solutions. General record keeping and proof of placement reporting has never been easier.
The NAV-500 guidance controller features a low-profile rugged housing capable of receiving signals from five different GNSS satellite constellations — GPS, Galileo, GLONASS, BeiDou and QZSS. This precision solution offers sub-meter repeatable accuracy and full-farm coverage ideal for tillage, broad-acre seeding, spraying and harvest operations.
By using Trimble’s ViewPoint RTX satellite-delivered correction service with the NAV-500, operators can consistently achieve 15 centimeter pass-to-pass accuracy. Paired with either the new GFX-350 display or larger 10-inch (25.4-centimeter) GFX-750 display, the NAV-500 can provide roll-corrected manual guidance or can automatically control steering with the EZ-Steer assisted steering system and EZ-Pilot® Pro steering system.
“Connectivity and interoperability are very important to the future of agriculture and Trimble has made these features a cornerstone of our product portfolio,” said Abe Hughes, general manager of Trimble’s Agriculture Division. “Customers can select from a range of hardware and software options to meet their specific needs and budget. And the true beauty of this flexible product integration is that it can grow with the farmer’s operation. Upgrades can be as simple as moving to a higher precision correction signal or using existing mounts to install a larger and more capable receiver or display. Ease of installation and operation are key with the GFX-350, which can reduce barriers to entry for farmers new to precision agriculture.”
The GFX-350 display and NAV-500 guidance controller are designed for clean and simple installation that can typically be completed in half a day, getting farming equipment back in the field faster. The display uses a quick release RAM mount for easy transfer between vehicles, and typically requires only two cables to be attached, reducing clutter in the cab.
Trimble’s GFX-350 display and NAV-500 guidance controller are expected to be available for order in the fourth quarter 2019 from the Trimble dealer and Vantage distribution networks.
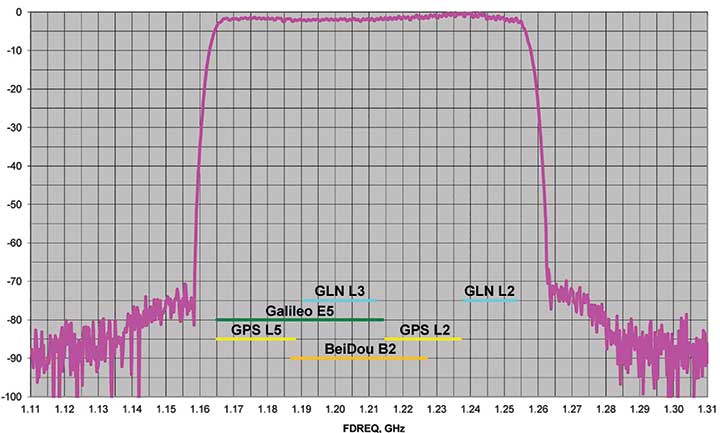
J-Shield is a robust filter on Javad GNSS antennas that blocks out-of-band interference (Figure 1). In particular, J-Shield blocks signals that are near the GNSS bands, including the proposed Ligado Networks (formerly LightSquared) broadband signals, explained Javad Ashjaee, founder and CEO of Javad GNSS.
FIGURE 1. Protection characteristics: The J-Shield filters have a sharp 10-dB/KHz skirt, which provides up to 100-dB of protection. (Image: JAVAD GNSS)
The anti-jam digital filters protect against in-band interference such as the harmonics of nearby TV and radio stations, or against illegitimate in-band transmissions. The anti-jam filters can be combined in pairs for complex signal processing and can simultaneously suppress several interference signals.
“The filters make the near band spectrums available for other uses,” Ashjaee said. “They protect GNSS bands now and in the future.”
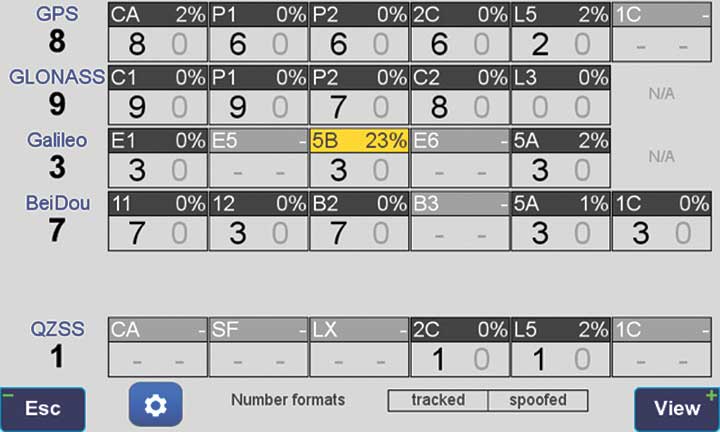
In-Band Noise Measurement. The receiver measures the level of interference as a percentage of noise above the normal condition. Figure 2 shows the condition in a clean environment, where eight GPS satellites were visible, according to the almanac. In all, eight C/A, six P1, six P2, six L2C and two L5 GPS signals were tracked. The noise level was 2% on C/A and L5 and 0% on P1, P2, and L2C.
FIGURE 2. Clean environment. (Image: JAVAD GNSS)
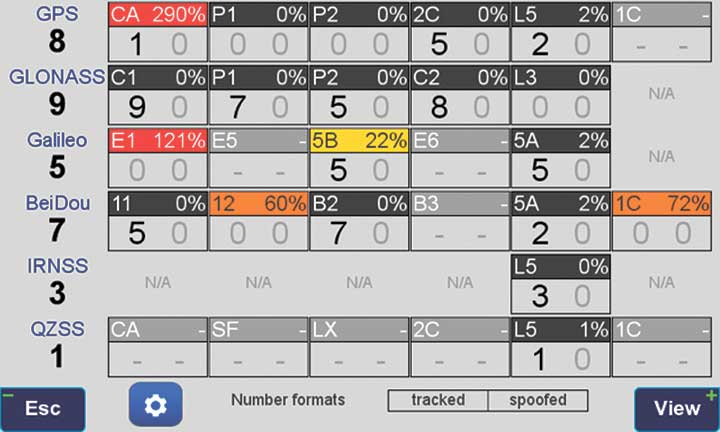
Figure 3 shows 290% noise in the GPS C/A signal and 121% noise in Galileo E1. Only one of the eight GPS C/A code and none of five Galileo E1 signals could be tracked because of the high level of interference.
FIGURE 3. High interference levels. (Image: JAVAD GNSS)
Spectrum Analyzer
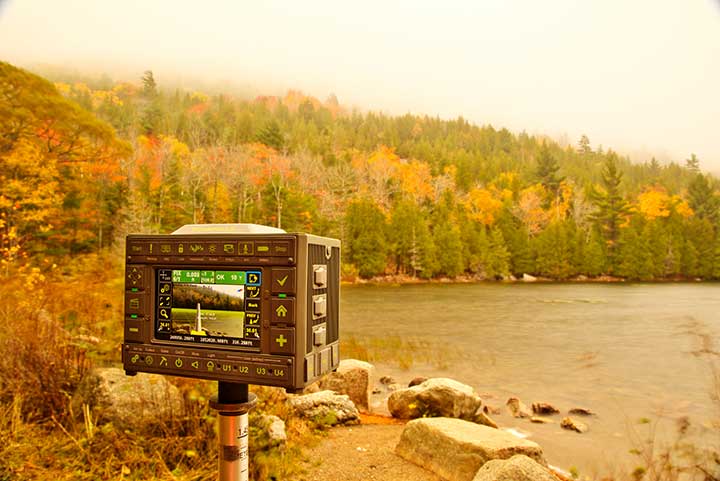
Filters in the GNSS antenna provide one way to protect GNSS signals from interference. Another is the receiver chip itself. For instance, the Javad GNSS Triumph chip includes an integrated spectrum analyzer — a more efficient solution than using a commercial spectrum analyzer to continuously monitor and evaluate the environment, Ashjaee explained.
The spectrum analyzer monitors the spectrum inside the chip. It has an effective bandwidth of 1 KHz, and can be programmed to automatically record the spectrum (and other information) periodically or according to pre-set conditions. Each spectrum shows the power and shape of any interfering signals and jammers.
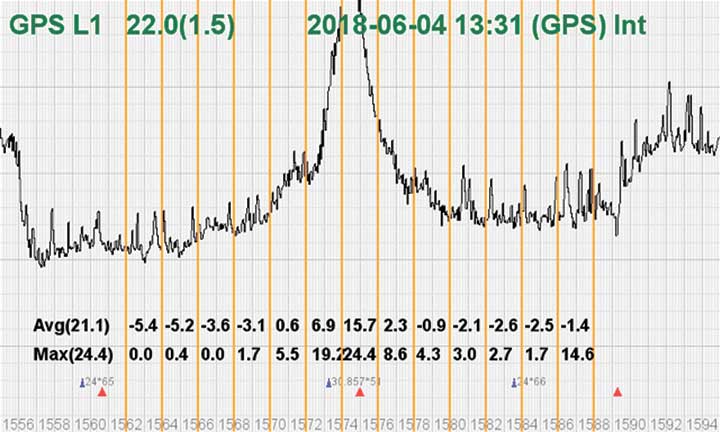
Figure 4 shows the shape of the GPS L1 band spectrum when the band is jammed, as indicated by the huge peak in the center where the C/A code is. The number on the bottom left is the height of the peak. The height of the spectrum is 21.1 dB; compared to a calm spectrum of 11.2 dB, this spectrum indicates a jamming impact of about 10 dB.
FIGURE 4. The L1 band is jammed, as shown by the peak. (Image: JAVAD GNSS)
Automatic Gain Control. In addition to monitoring the spectrum, the Triumph chip also keeps a record of automatic gain control (AGC) — another indicator of unwanted external signals. The AGC monitors the environment and adjusts the gain to keep the voltage at a certain level. The change in AGC is an indicator of interference.
Spoofers
“Spoofers are quite different from jammers,” Ashjaee said. “They don’t disturb the environment and the spectrum shape. They broadcast a GNSS-like signal to fool the GNSS receivers to calculate wrong positions. We detect spoofers by digital signal processing.”
With 864 channels and about 130,000 fast-acquisition channels in the Triumph 2 chip, it has the resources to assign more than one channel to each satellite to find all of the signals transmitted with the same GNSS PRN code — including spoofed signals.
“If we detect more than one reasonable and consistent correlation peak for any PRN code, we know that we are being spoofed and can identify the spoofer signals,” Ashjaee said. The chip isolates and ignores the wrong peak.
“Usually more than 100 signals are available at any given time. We need only four good signals to compute position,” Ashjaee said. “We reject infected signals, and then among all the available GPS, GLONASS, Galileo, BeiDou, IRNSS and QZSS signals, we use the healthy ones. It is extremely unlikely that we can be spoofed without our knowledge. We can immediately recognize spoofing and take corrective actions. In the rare case that all signals are affected, we inform the user and guide them to use a compass and altimeter to get out of the jammed area.”
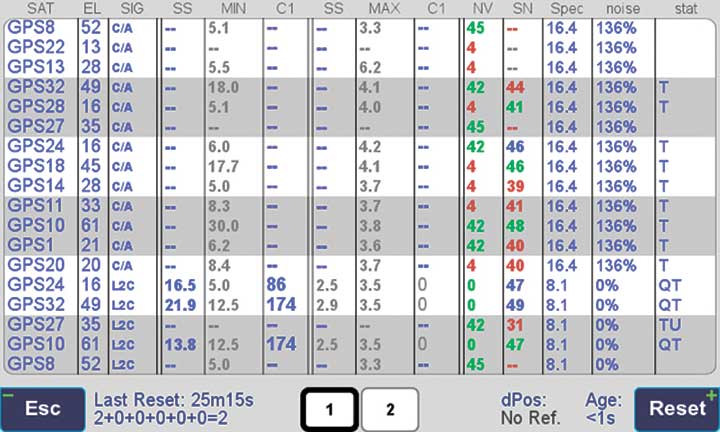
Figure 5 is a screenshot from the company’s Triumph-LS survey receiver, showing the details of each signal tracked. The first six lines in this screenshot show the spoofed signals that were detected as soon as they appeared (number “1” in the C1 column). Percentages show the amount of interference above the normal level.
In the last column, T indicates the signal was tracked by the main channels, Q by the fast-acquisition channels, and U indicates the signal was used in position calculations.
Figure 5. Signal Details: The Triumph-LS receiver provides users with a wealth of information on each signal received, including spoofed signals.
Indicators for Healthy Signals
In addition to the spectrum shape and AGC, these other indicators show the health of GNSS signals:
Number of signals tracked.
Divergence of SNR from its expected value.
Level of additional power and its RMS.
Divergence of AGC from its normal value and its RMS.
Extra noise.
Number of signals spoofed.
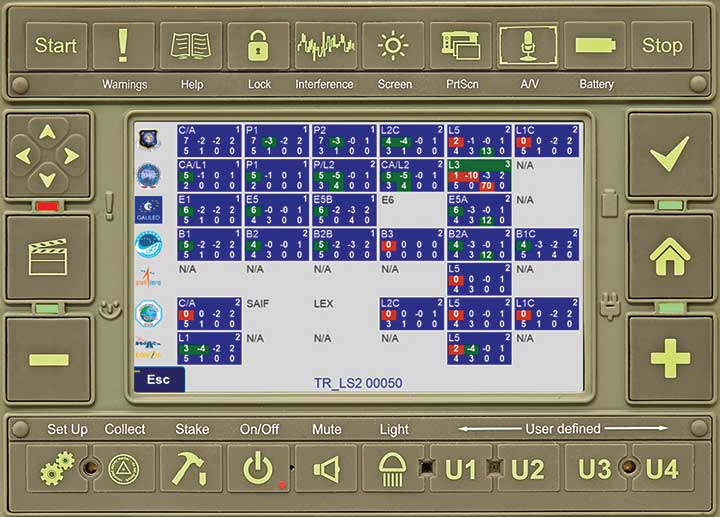
As an aid to users, the company’s Triumph-LS receiver can display the status of all GNSS signals received. Figure 6 shows this compact view, with normalized values of the above indicators (0 means good and 9 means poor).
Figure 6. Signal Status. Information on all GNSS signals received as shown by the Triumph-LS. (Image: JAVAD GNSS)
Users of the Triumph-LS can click on any of the signal buttons to see the actual and normalized values of the indicators for that signal. Action buttons provide quick access to View Satellites, View Spoofing, View Spectrum and Take Spectrum. Jamming and spoofing protection is an option on all Javad GNSS products and OEM boards.
GPS signals are by far the single most widely used and most accurate source of navigation, positioning and timing (PNT), and this capability is deeply integrated into every aspect of our society. In particular, the timing service provided by GPS, while virtually unknown to the general public, is essential for a variety of digital operations — from performing financial transactions to operating cell phone networks to running the internet.
Of course, GPS — originally developed to guide nuclear submarines — is now vital to most military missions, and the system’s vulnerabilities are a source of great concern.
GPS has been remarkably reliable over the past quarter century. Solar flares are rare, multipath can be largely mitigated, and obstructed line-of-sight to the satellites is an acute problem only in certain environments, such as urban canyons.
The most serious intentional threats to GPS are spoofing and jamming. Jamming is more widespread — it is more easily accomplished intentionally and it also occurs unintentionally. In the defense sphere, intentional jamming is a regular occurrence. It is expected as a routine aspect of electronic warfare operations to disrupt and deceive, typically just before the shooting begins. Unintentional jamming includes recently re-emerging concern about potential interference by ultra-wideband devices.
Experts at NovAtel, Collins Aerospace, L3Harris Technologies and Honeywell address the challenges posed by jamming and the relative effectiveness of various anti-jamming approaches.
NovAtel
Tackling Jamming on Multiple Levels
Disruption by jamming of GPS’s PNT data “is occurring with a growing regularity,” said Dean Kemp, Defense Segment manager at NovAtel, part of Hexagon’s Positioning Intelligence division. The problem will only increase, given our reliance on GNSS and increasing demand for precision. In the military sphere, electronic warfare in Syria, as well as jamming in Ukraine, Korea, and Finland, “have shown that modern, high-power equipment is routinely being used to disrupt the military.”
In the civilian sphere, interference is a growing issue because of cheap and effective jammers available via the internet. People use these so-called personal privacy devices to defeat vehicle tracking devices for purposes ranging from avoiding supervision all the way to hijacking vehicles.
GNSS signals are vulnerable because the received power is so small that receivers can be disabled with an incident power in the picowatt (10-12 W) range. “Jammers come in many different forms,” Kemp said, “from low-power civil devices to complex and powerful military-grade electronic warfare systems that can disable civilian receivers from a few hundred meters to hundreds of kilometers.”
Situational Awareness. Users can fail to recognize that their GPS is being jammed, Kemp said. Beyond defending against possible jamming scenarios, it is also necessary to “identify, find, and characterize the source of interference and to provide this information to the user so that it can be used appropriately.” In the defense field, this is known as situational awareness.
Emerging jamming threats, Kemp explained, can be understood within the context of cyber and information warfare using the Cyber Electromagnetic Activities (CEMA) layered approach. It recognizes a cognitive layer — a human decision based on PNT data; a virtual layer, in which PNT data are used to inform or support networked systems; and a physical layer, the hardware used to provide and protect PNT data.
Therefore, effective anti-jamming requires that:
users understand the system’s vulnerabilities and identify when they are being jammed, so that they can resort to traditional means for positioning and navigation (but not timing)
PNT data be protected and verified before being trusted
on the physical level, there be a multi-layered and heterogeneous approach that provides assured PNT information in the presence of jamming and spoofing without quantifiable loss of accuracy.
By combining these considerations at each layer, “they form a unified view on capability,” Kemp said.
Spoofing with Pokémon. Jamming threats are evolving, employed by both civilian and state actors. Worse, these threats are augmented by spoofing. While spoofing is harder to achieve than jamming, it is potentially more concerning. “Spoofing the receiver by rebroadcasting the GNSS signals or by generating them from a simulator has become a regular occurrence,” Kemp said.
Spoofing came to public attention in 2016 when enterprising programmers designed location-deception apps to hack the Pokémon Go mobile game. Instances have since been reported worldwide. Because early spoofing demonstrations were conducted against simple GPS L1 C/A-code receivers, it was initially hoped that spoofing could be defeated by using dual- or multi-frequency receivers.
However, it has been demonstrated that multi-frequency receivers using commercially available components can also be spoofed, “at least when the receiver is using multiple frequencies of GPS,” Kemp noted. “Adding further GNSS signals will help, but the best defensive measure is to employ, if authorized, an encrypted military signal.”
Coverage Improvement Factor. Typically, the effectiveness of an anti-jam system is assessed on the basis of the jamming to signal ratio (J/S) figure in decibels, which depends on variables such as the receiver’s front-end RF bandwidth, the signal type being tracked (C/A versus P(Y) code), the signal tracking threshold of the receiver, the receiver platform dynamics, the choice of receiver oscillator, the interference type and antenna characteristics.
Difference in how manufacturers calculate J/S led to the invention of the coverage improvement factor (CIF), adopted by the GPS Joint Project Office. “CIF gives a single number that describes the effectiveness of an anti-jam system for a particular jammer scenario, given that space vehicle positions vary by elevation and azimuth,” Kemp said.
However, the use of CIF to assess the anti-jam performance is a highly technical process and the results are usually classified. He discussed current approaches to anti-jamming.
Multi-element, controlled reception pattern antennas (CRPA), which pass the good signal to the receiver while nulling out the interference, are the first line of defense. “The system can dynamically change the gain pattern of the antenna so that as the platform and jammers move, the gain pattern adapts so that nulling continues effectively.”
The use of multiple constellations and frequencies can be an effective tactic to mitigate interference, “but relies on the jammer not covering the bands of interest.”
“Obtaining actionable data on interference is almost as important as mitigation,” because it enables users to modify plans. However, “interference effects can be difficult to diagnose and complicated to track down.”
Monitoring automatic gain control can indicate jamming.
“Coupling a GNSS receiver with a robust inertial measurement unit (IMU) will provide a higher level of protection for GNSS signals due to the IMU providing reliable position, velocity and attitude even through short periods when satellite signals are blocked or unavailable.” However, IMUs are liable to drift, resulting in degraded performance.
There are many approaches to designing anti-jam systems. They must be balanced against user requirements, which vary significantly. “A layered approach is the best form of defense against jamming and spoofing,” Kemp said, starting with protecting the incoming GPS signal. “One of the highest levels of protection is from an anti-jam antenna system paired with a GNSS receiver that is tightly coupled with an IMU.”
Finally, given that jamming attacks are now to be expected on the battlefield, it is critical to train users on the best response.
Collins Aerospace
Artist’s concept: Collins Aerospace
A Potent Triumvirate of Tools
While sources of deliberate jamming are on the rise, the vast adoption of GPS means that “even the non-deliberate sources of jamming will have an asymmetric impact on end users,” said Sai Kalyanaraman, Ph.D. and Technical Fellow at Collins Aerospace. Challenges posed by jamming depend on the receiver, mission and performance needs, while the source of unintentional jamming could be “something as simple as a TV antenna that is transmitting harmonics into the GNSS band.”
Kalyanaraman outlined viable approaches to interference mitigation and anti-jamming:
Integration with inertial navigation systems (INS) can provide the platform’s attitude, which is required for beam forming. This, in turn, is required for some of the CRPA GNSS Anti-jam signal processing modes. It can also alert the user of jamming when the INS position diverges dramatically from that provided by the GPS receiver.
Use of multiple frequencies is a form of robust design against interference.
For authorized users, M-code will provide additional limited capabilities against jammers.
Integration of GNSS with other PNT sensors to help address GNSS-denied environments.
GNSS signals have the advantage that the true signal is well under the noise floor; therefore, “as long as you can characterize the noise floor adequately from the receiver design/installation perspective, anything that shows up above the noise floor typically does not belong in that slice of the spectrum,” Kalyanaraman said. Combining a CRPA, a platform orientation sensor (like an INS), and a GPS/GNSS receiver, “you have a fairly potent triumvirate of tools that you can use to help mitigate the impacts of jamming and potentially spoofing.”
Collins produces multiple variants of its digital integrated GPS anti-jam receivers (DIGAR). “Depending on which variety you choose, you can essentially have a receive apparatus that can perform basic nulling all the way up to beam-forming and direction finding and help provide resiliency against high jamming signal levels and other threats that emulate a GNSS-like signal in space,” Kalyanaraman said.
L3Harris
L3Harris develops gun-hardened anti-jam solutions for the M1156 Precision Guidance Kit Modernization program. The kit turns 155-mm artillery shells into smart weapons. Here, soldiers test the kit for accuracy. (Credit: U.S. Army/Spc. Robert Porter)
Field Tests Verify PNT Reliability
Dealing with deliberate and unintentional interference with GPS requires agreeing on the level of enhancements required, reducing the time and cost needed to integrate them into systems of systems, and “centralizing PNT generation and distribution functions on a platform to reduce user equipment redundancies and increase the leverage of future PNT enhancements,” said Dave Duggan, president of the Precision Engagement Sector at L3Harris Technologies.
The increase in interference “creates a cascading negative effect to PNT client mission systems,” Duggan said, including the systems of systems for sensing, maneuver and fires [military-speak for the use of weapon systems].” The capability of anti-jam countermeasures “scales across a range of performance, size, weight, power and cost points and can be tailored to a given threat space, improving the performance of even legacy user equipment.”
Spoofing, which inhibits receivers from forming a solution or, worse, tricks them into passing misleading PNT solutions to other systems, is a bigger challenge than jamming because it can result in aborted missions and loss of life and usually requires new receivers, Duggan said.
Duggan defines a reliable anti-jam/anti-spoof capability as one that “provides a PNT solution with a high level of confidence in its accuracy, authenticity and integrity for their applications and anticipated threat environments — all at a reasonable cost/performance point.” Confidence in the solution requires “extensive analysis, threat modeling, simulation and testing of the anti-jam/anti-spoof capability.” For this reason, “L3Harris has worked extensively in developing simulation and testing environments of the highest fidelity and continues to participate in numerous live field test events to establish that foundation.”
L3Harris develops and produces digital anti-jam antenna electronics for U.S. and allied end use.
Honeywell
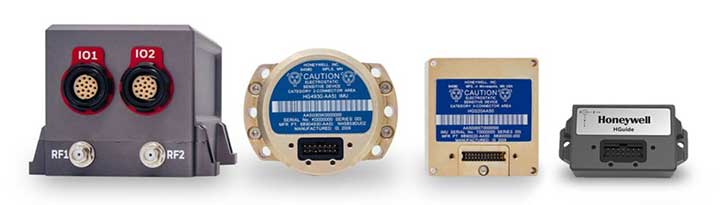
Honewell’s HGuide micro-electro-mechanical system (MEMS) inertial measurement units (IMUs) and INS are designed to be integrated with GNSS receivers. (Photo: Honeywell)
Integrating GNSS with Inertial
Heightened awareness of intentional and inadvertent jamming threats has less to do with new types of threats and more to do with the increased importance of precise PNT coupled with more frequent instances of jamming, according to Chris Lund, senior director, HGuide Navigation and Sensors at Honeywell Aerospace.
“As applications become more reliant on highly accurate and reliable position and timing information provided by navigation systems, the consequences associated with the data not being available or not being correct quickly escalate,” Lund said.
The best way to measure the impact of a jamming threat and the capabilities of countermeasures is “to determine in actual real-world use cases whether the desired application outcome can still successfully be achieved,” Lund said.
The most promising approach to anti-jamming is integration of GNSS receivers with inertial navigation systems (INS) and other PNT systems. “Given the complementary aspects of many of the available approaches in the anti-jamming toolkit, it’s often best to leverage however many tools are available and needed to allow the application to achieve its desired outcome,” Lund said.
By Tony Murfin GPS World Professional OEM Contributing Editor
In today’s world where local conflicts can spill over into many other places, it’s become common to encounter GPS signal jamming. Even in locations that defense forces might have considered “backwater” in terms of technology, enemies can apparently launch attack drones, jam adjacent countries, and generally render GPS, if not GNSS, useless for navigation.
The U.S. military came up with anti-jam technology to counter foreseen jamming scenarios several decades ago, but the initial seven-element controlled radiation pattern antenna (CRPA) designs were bulky and required multiple RF antenna cable connections to large, remote receiver processor units. These units not only processed the signals to derive position, but also eliminated jammer and satellite signals in the direction from which the jamming signal was received (null processing). Most of these early units were large and power hungry, so their application was limited to larger aircraft and ships.
Anti-jam technology has gradually evolved over time. Component integration and miniaturization has enabled CRPA performance to be self-contained within the antenna enclosure. At least one design has now migrated the null-processing into the same enclosure as the CRPA antenna, and is sold on a commercial basis to several military forces around the world. The device outputs a single composite RF signal that has been cleaned of any detected jamming signals for use by both commercial and military remote receivers alike.
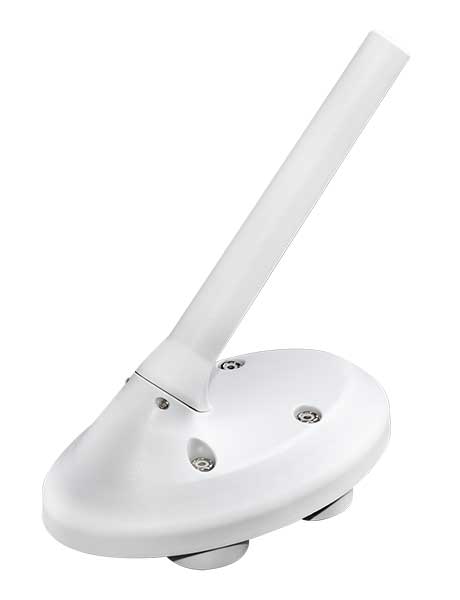
Now Quantum Reversal (QR) — a new company based in Calgary, Alberta, Canada — has come up with a novel design that processes the CRPA signal in the RF domain, eliminating the need for extensive null-processing electronics. Without these signal-processing electronics, power requirements are reduced from about 15–30 watts to around 1 watt, the size is smaller (4 inches in diameter versus the nominal 6–8 inches in diameter), and cost is significantly lower. These reductions might allow this new anti-jam technology to move into small unmanned aerial vehicle (UAV) applications, timing networks, and reference monitoring networks where continuous uninterrupted GPS/GNSS service is mandatory.
This antenna is designed to enable continuous navigation using GPS or GNSS signals in the presence of unintentional low- to medium-power interference signals. It should be able to reduce the power of an unintentional interference or jamming signal by 35–45 dB, depending on whether it contains three or four CRPA antenna elements.
Increasing the number of antenna elements of the QR design improves the null depth (on average 8–10 dB per antenna element) at the expense of increased circuit complexity, power consumption and antenna size. An average null depth of –70 dB may be possible with a seven-element CRPA antenna. (Image: Quantum Reversal)
TDKC has proven capabilities in microelectronics trust and assurance, space domain awareness, and advanced visualization for enhanced situational awareness. PreTalen’s core competencies are the related practices of cyber warfare, navigational warfare, and positioning, navigation and timing (PNT) techniques and technologies in support of defense and offensive operations to counter adversaries.
Both companies are headquartered in Dayton, Ohio.
The acquisitions more than double the number of Centauri employees in the region to more than 300, supporting customers across the space, cyber and intelligence markets.
In addition, to bringing TDKC and PreTalen’s capabilities to bear for Centauri’s broader customer base, Centauri is building additional research and development labs, and secure facilities in the Dayton region to expand innovation and cutting-edge solutions for Centauri’s customers.
“Both TDKC and PreTalen have exceptional talent and share a common culture of innovation in pioneering new capabilities for the warfighter” said Dave Dzaran, CEO of Centauri. “With TDKC, we are building world-class capability to help ensure trusted microelectronics in the supply chains for the defense and intelligence communities. Their expertise in space domain awareness brings additional AI and machine learning technology to further strengthen Centauri’s existing space-related mission capabilities focused on the next generation of solutions that will serve this rapidly-evolving domain.”
“Similarly to TDKC, PreTalen’s unique skill sets relating to all aspects of the PNT architecture serve as a true differentiator on their programs,” said Dennis Kelly, president and COO of Centauri. “PreTalen has built a critical mass of the most innovative employees in both PNT and cyber, and we are excited to facilitate collaboration not only with our Dayton operations but also across the rest of our company.”
Greg Gerten, CEO of PreTalen, and Dan Schiavone and Eric Loomis, founders of TDKC, as well as both of their leadership teams, including Bruce Hart, will become a part of Centauri’s growing operations in the region.
This investment in the Dayton region comes on the heels of Centauri’s hiring of Col. Elena Oberg, former vice commander of the Air Force Research Laboratory, headquartered just outside Dayton at Wright-Patterson Air Force Base.
With the addition of TDKC and PreTalen, Centauri now has more than $475 million of annual revenues and 1,650 employees, approximately 20% of which support customers located in the Dayton market.
“I speak for all of PreTalen when I say that we are extremely excited to be joining forces with Centauri,” Gerten said. “Our team is eager to apply our core capabilities to the space and Intelligence communities, and we look forward to replicating our past success for an ever-increasing number of customers. Furthermore, Centauri’s focus on innovation meshes well with what we’ve spent 12 years building here at PreTalen, and I’m thrilled to continue our journey with their support.”
The precision farming market is set to grow from its current market value of more than $4 billion to more than $12 billion by 2025, as reported in the latest study by Global Market Insights, Inc.
The market growth is attributed to the rising adoption of smart agricultural practices to increase productivity. The use of Big Data along with information and communication technologies will provide farmers with more accurate insights into the existing crop conditions.
Another factor contributing to the precision farming market growth is the popularity of drones and IoT for greater production capabilities and analytics. The IoT plays a substantial role in increasing productivity and providing insights about the recent trends of crops. The technology provides an interconnected and multidimensional view of farming activities and offers actionable insights about the environment.
The government agencies worldwide are making efforts to spur innovations in the agriculture sector. For instance, in 2017, the Dutch government invested USD 1.5 million in the agriculture sector to allow the use of satellite technology to collect crop data for precision farming.
In the component market, the hardware segment is expected to hold a major market share of over 70% in 2025 due to the rising usage of several hardware devices such as drones, sensors, GPS systems, and smartphones for capturing aerial data. In precision farming, these devices enable farmers and researchers to monitor and optimize their crops and assist in conserving resources such as soil and water in a better manner.
In the precision farming services market, the managed services segment is expected to exhibit a growth rate of over 27% from 2019 to 2025. The market growth is attributed to the rising applications of IoT and cloud computing in precision farming solutions.
The agriculture decision support systems are being increasingly hosted on cloud platforms to take advantage of the IoT through internet-connected devices. For enabling improved security and availability, the demand for managed services has to increase to efficiently handle the complexity of running hardware and maintaining different types of middleware.
Geomapping technologies are expected to hold a share of over 20% of the precision farming market in 2025. The technology proves to be immensely beneficial in agriculture as it offers a cost-effective alternative for localized and wide-scale monitoring of the crop output.
With the evolution of the technology, 3D geo-mapping techniques have emerged in the market that are particularly useful for the timely detection of existing inefficiencies in the fields, allowing farmers to take immediate corrective measures.
The irrigation management application segment is projected to grow at a CAGR of over 15% between 2019 and 2025. Using precision farming technologies, the site-specific management of irrigation activities can significantly improve the overall water management.
Farmers can monitor and control their irrigation pivots from any location using precision irrigation solutions. These solutions enable accurate and uniform water delivery to crops throughout their lifecycle.
The Asia Pacific precision farming market will witness a growth rate of over 20% during the forecast period. The factors augmenting the market growth are increasing the awareness about the precision farming technologies and several initiatives taken by the government to improve sustainable agriculture.
For instance, in June 2017, the state government of Haryana in India adopted climate-smart agricultural practices to transform the agricultural systems. This also enabled the regulatory bodies to achieve three objectives such as adapting to climate changes, achieving agricultural productivity, and reducing greenhouse gas emissions.
The rising adoption of drones and UAVs for capturing crop-related data is also leading to precision farming market growth. For example, in March 2019, the Agriculture Ministry of Japan promoted the use of drones in the agriculture sector. This will help in increasing productivity and improving crop health by closely monitoring the crop condition.
The companies in the precision farming market are entering into strategic partnerships and acquiring companies to gain more market share. For instance, in September 2018, Topcon Agriculture entered into a licensing agreement with Raven Industries. Under the agreement, Topcon Agriculture’s Slingshot Application Programming Interface (API) was used in Raven’s software platforms.
The software-to-software interface help users to share data between software systems. Some companies are concentrating on new product developments to enhance the capabilities of their existing offerings and to expand their product line up.
uAvionix has received U.S. Federal Aviation Administration (FAA) approval for the Vehicle Tracking Unit (VTU-20) Automatic Dependent Surveillance – Broadcast (ADS-B) transmitter for airport surface management.
uAvionix is a designer and manufacturer of communications, navigation and surveillance (CNS) equipment for unmanned and manned aircraft.
Adhering to the performance and design assurance specifications of FAA-E-3032, the externally mounted VTU-20 ensures integration and interoperability with Airport Surface Detection Equipment, Model X (ASDE-X), Airport Surface Surveillance Capability (ASSC) and ADS-B receiver surveillance solutions for airport
surface control and situational awareness.
The VTU-20 can be permanently or magnetically mounted to all airside vehicles, including utility, emergency, snow-removal and maintenance equipment. Each vehicle is clearly and uniquely identified, providing an essential addition to any surface movement guidance and control system.
The VTU-20 implements FAA-approved Squitter Transmission Maps to automatically enable transmission on airport movement areas and disable transmission in low-risk areas or outside airport airside operations.
“Ground vehicle incursions into critical safety and movement areas is on the rise. With this achievement, uAvionix continues to promote safety and common situational awareness not only in the airspace but also on the airport surface,” states Christian Ramsey, uAvionix president.
This recent uAvionix achievement will be made available through an exclusive relationship with L3Harris Technologies, Inc., a leader in surveillance and air traffic management known for the Symphony product line of airport operations and environmental compliance solutions — to promote and sell the VTU-20 in the United States.
University teams will go head-to-head in a two-year autonomous race car competition to test new software and other self-driving technologies at Indianapolis Motor Speedway.
The competition, called the Indy Autonomous Challenge, culminates in a high-speed autonomous vehicle race, scheduled for Oct. 23, 2021, on the speedway’s famed 2.5-mile oval track that is home to the annual Indianapolis 500.
The competition was inspired by the 2005 Defense Advanced Research Projects Agency (DARPA) Grand Challenge, which pitted university teams against each other and spurred commercial development of autonomous vehicles.
“The idea for the Indy Autonomous Challenge originated with DARPA’s winning team captain, [Stanford University’s] Sebastian Thrun. Sebastian joined us at the 2018 Indy 500, where he reflected on the inspiration and excitement that came from participating in the DARPA challenge, and how a high-speed automated vehicle race at the Indianapolis Motor Speedway had the potential to be on par with that experience with today’s teams,” said Matt Peak, Energy Systems Network director of mobility.
Like the DARPA competition, the Indy Autonomous Challenge focuses on university participation. “I can’t speak for DARPA, but our focus on universities is deliberate,” Peak said. “It was advised by not only Thrun, but other original DARPA competitors such as [Aurora CEO] Chris Urmson, all of whom commented on how participation by universities — their students, faculty, departments, alumni — was a key to DARPA’s success.”
The autonomous racing software developed through the competition could assist in developing commercial self-driving vehicles and enhance existing advanced driver-assistance systems (ADAS). Some of the cornerstone technologies include GNSS and digital maps, which provide the accurate location for fully autonomous vehicles.
As was the case with the original DARPA challenge, spurring new innovations and socially beneficial products and services is a goal of the competition, Peak said. “In our case, we see inspiring teams’ creation of software that can solve for edge cases — those problems or situations that occur only at an extreme operating parameter, such as avoiding unanticipated obstacles at high speeds while maintaining vehicular control,” he said. “This applies not only for highly automated vehicles, but also for vehicles equipped with ADAS that aim to help human drivers avoid obstacles altogether. The notion is, if our university innovators can enable cars to outmaneuver others at 200 mph, they certainly can help enable you to avoid that piece of lumber that fell off the pickup in front of you on the 65-mph highway.”
Peak said that a perfect place to demonstrate these technologies is the famous speedway, which for 100 years has tested automotive technology in a demanding environment. “Tackling automation at 200 mph in a race car is a bit more alluring than with a 20-mph people mover,” he said.
In addition to ESN and Indianapolis Motor Speedway, other challenge partners include race-car manufacturer Dallara Automobili and the Clemson University International Center for Automotive Research (CU-ICAR).
$1.45 Million in Prize Money
During the final race at the speedway, teams will compete for $1 million as the first-place prize. Second- and third-place finishers receive $250,000 and $50,000, respectively.
The five-round competition starts with the submission of a white paper to demonstrate vehicle automation with a video of an existing vehicle or participation in Purdue University’s self-driving go-kart competition at the speedway.
During the initial rounds, teams will use sponsor ANSYS’ driving simulator to develop autonomous vehicle software. ANSYS, which will provide $150,000 in prizes to top finishers of a third-round race, will co-host a hackathon to let teams work with the simulator, the company said. The fourth round allows teams to test their vehicles at the speedway in advance of the final race.
So far, five universities have registered:
Korea Advanced Institute of Science & Technology (KAIST)
Texas A&M Transportation Institute (TTI)
University of Florida
University of Illinois
University of Virginia.
Not Everyone Has Championed Autonomous Vehicles…
The new competition is commencing during a time when media reports show that the once-hot autonomous vehicle industry has vocal critics. Recently, Apple pioneer Steve Wozniak, who once headed a GPS-based fleet company called Wheels of Zeus, said he didn’t expect to see a fully autonomous vehicle operating on the streets in his lifetime.
In addition, a few automakers have reined in autonomous vehicle development or have scaled back their technology expectations in recent months.
“Not at all surprising. The traditional OEMs were never going to be disrupters that put driverless mobility-as-a-service cars out there. It isn’t their business model, and it won’t be,” said Alain Kornhauser, Princeton University professor and transportation program director, who was head of the university’s team during the DARPA Challenge, in his Smart Driving Cars weekly newsletter. “Self-driving, I dare say Level 2, is and has always been their sweet spot — it sells cars. Now watch these same companies throw monkey wrenches into those driverless mobility machines to protect their conventional business model.”
Peak says the recent negative press on autonomous vehicles is what happens when any new technology is rolled out. “For any new technology, such as automation, we’re going to see euphoric coverage (automation will solve all of our problems) and pessimistic coverage (automation will never arrive and, if it does, it will make things worse),” he said. “It’s a cycle, it swings back and forth, and we happen to be touching upon the latter, pessimistic end of that cycle.”
Taking a moderate and realistic position about the technology is what the Indy Autonomous Challenge is striving to do, Peak said. “Automated vehicle technologies have a role to play, both in helping humans drive better, and eventually in enabling new markets, such as first/last mile transit solutions. The technologies are light years ahead of where they were a decade ago, and low-level automated technologies are already making a difference and saving lives in today’s vehicles,” he said. “We have a bit of a ways to go before the full potential of automation will be realized, and the Indy Autonomous Challenge will help us address the concerns brought about by the media and others to reach this end goal much sooner than we otherwise would.”
The National Geodetic Survey (NGS) has published a technical report that describes options for how NGS can implement a time-dependent geopotential datum and thus a time-dependent geoid model. My last column described the latest version of NGS’ VERTCON model. As mentioned in the column, NGS is developing these models and tools to support the implementation of the North American-Pacific Geopotential Datum of 2022 (NAPGD2022).
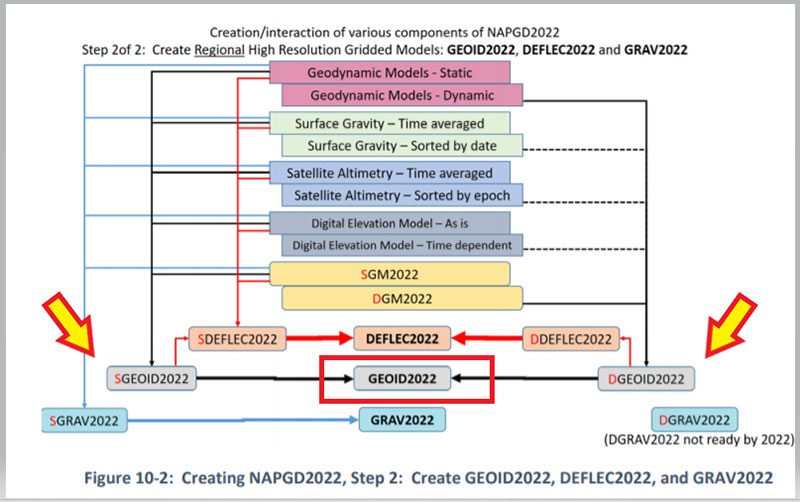
NAPGD2022 is going to be a time-dependent geopotential datum. In other words, the reference geopotential will change over time and therefore the geoid height value will change over time. NAPGD2022 was described in detail in NGS’ publication “Blueprint for 2022, Part 2: Geopotential Coordinates,” and my December 2017 column. Blueprint for 2022, Part 2 states that a gridded geoid model GEOID2022 will be created and it will contain two components:
The first component will be time independent, denoted as the Static Geoid model of 2022 (SGEOID2022).
The second component will be a time-dependent geoid undulation model, encompassing permanent geoid changes greater than or equal to 1 millimeter per year, denoted as Dynamic Geoid model of 2022 (DGEOID2022).
NGS will publish a GEOID2022 value that will be based on both SGEOID2022 and DGEOID2022. As stated in the document, GEOID2022 will be the official zero-height surface for orthometric heights within NAPGD2022, and thus within the NSRS. The box titled “Excerpt from Blueprint for 2022, Part 2, Figure 10-2” is a diagram that describes the process of creating the regional high resolution gridded GEOID2022 model. I have highlighted the GEOID2022 model and its two components, SGEOID2022 and DGEOID2022.
Excerpt from Blueprint for 2022, Part 2, Figure 10-2
Image: National Geodetic Survey
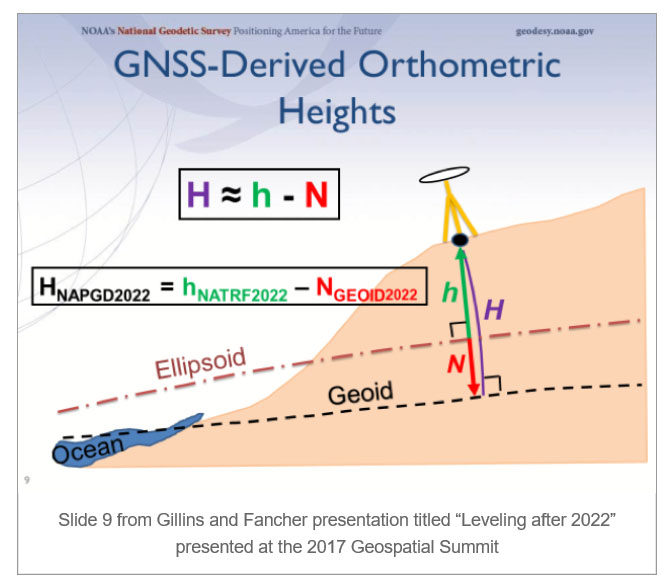
First, it’s important to note the role of the geoid in estimating GNSS-derived orthometric heights. As described in a previous column, GNSS-derived Orthometric Heights are computed using the following formula: orthometric height (H) = ellipsoid height (h) minus geoid height (N). See the box titled “NAPGD2022 GNSS-Derived Orthometric Height.”
NAPGD2022 GNSS-Derived Orthometric Height
Source: Slide 9 from Gillins and Fancher presentation titled “Leveling after 2022” presented at the 2017 Geospatial Summit
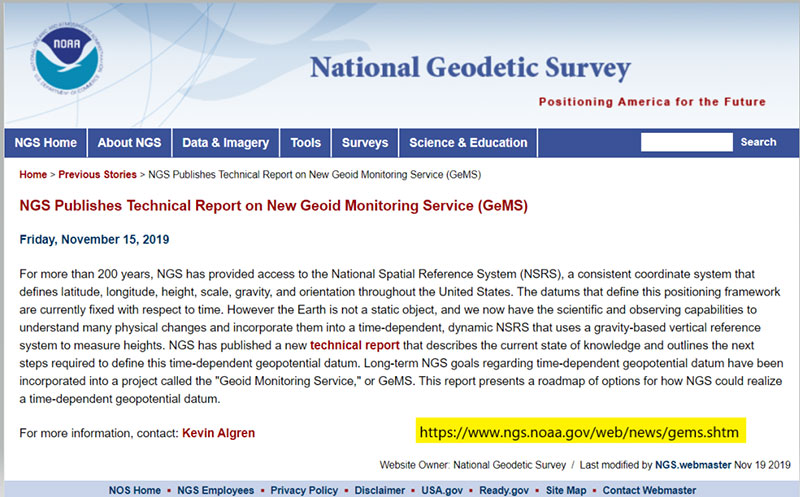
So, what does it take to compute a time-dependent geoid model and what is NGS’ plan to accomplish this project The technical report titled “ A Preliminary Investigation of the NGS’s Geoid Monitoring Service (GeMS)” describes options for how NGS can implement a time-dependent geopotential datum and thus a time-dependent geoid model (See box titled “NGS Publishes Report on GeMS”). The report contains too much information for a single column. This column will highlight some of the sections of the report. The document does contain a lot of technical information and I would encourage everyone to download the document.
The technical report describes the current state of knowledge and outlines next steps required to define a time-dependent geopotential datum for the Nation. NGS created a project called “The Geoid Monitoring Service,” or simply GeMS, to accomplish their long-term goal of establishing a time-dependent geopotential model.
The report addressed the following five topics:
A foundational introduction to the various types of geophysical phenomena that are causing both size and shape change to the geoid,
Geodetic observing techniques that are presently available to monitor geoid change,
An objective evaluation of NGS’s current ability to incorporate these techniques into a long-term monitoring service like GeMS,
Known barriers to accomplishing such a project, and
Potential observing techniques that might become available in the next 10-20 years, but are not currently mature enough for operational use.
The document presents a roadmap of options for how NGS could realize a time-dependent geopotential datum, and how NGS can support the dynamic datum into the future with independent validation surveys and datasets.
The report discusses the available geoid monitoring techniques that NGS has to support modeling the changes in the geoid. There are three existing NGS program areas and associated technical expertise that could be utilized in an operational GeMS:
NGS’s Gravity Program,
the NOAA CORS Network, and
GPS/geodetic leveling campaigns.
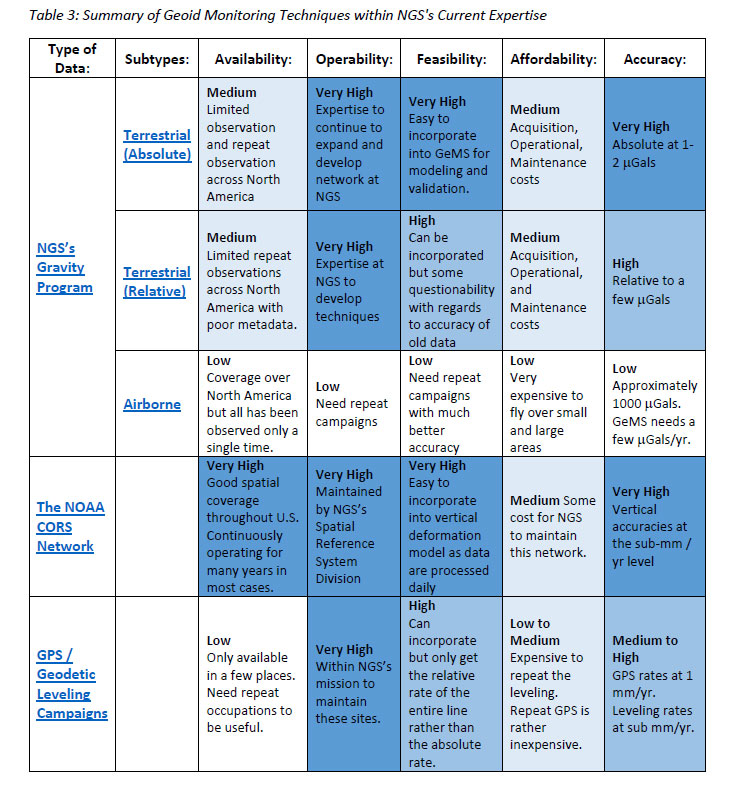
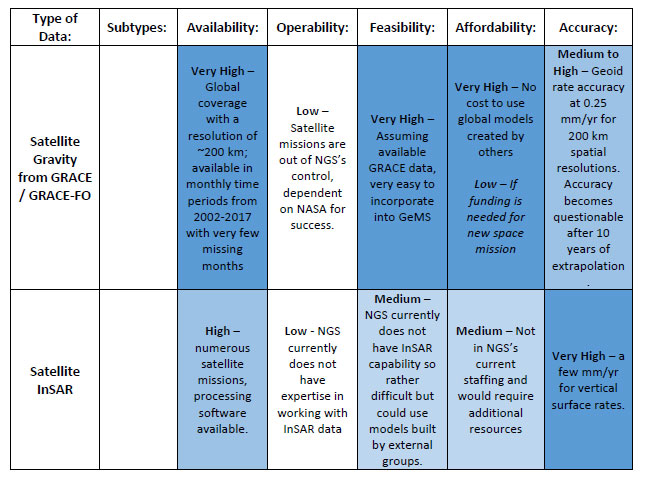
It is noted that individuals these techniques cannot provide 100% of what GeMS requires but combining various programs would be sufficient. The report does a great job of describing these three program areas. The box titled “Summary of Geoid Monitoring Techniques within NGS’ Current Expertise” is Table 3 from the Technical Report. The table list the affordability and accuracy attributes for each of the program areas. NGS’ Gravity Program provides high quality gravity data to internal and external stakeholders. The program provides gravity data required for NGS’s geoid modeling.
Summary of Geoid Monitoring Techniques within NGS’ Current Expertise
Source: National Geodetic Survey
The report provides a good overview of the expertise and instrumentation of NGS’ Gravity Program. The table titled “Summary of NGS’ Terrestrial Gravity Instruments” is a compilation of information on historical methods and instrumentation from the technical report.
Summary of NGS’ Terrestrial Gravity Instruments
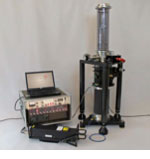
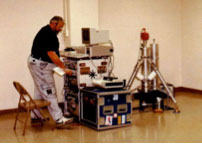
FG5 Absolute Gravimeter. The FG5(X) absolute gravimeter is manufactured by Micro-g LaCoste Inc. in Lafayette, Colorado. It is currently the highest-accuracy, commercially-available absolute gravity meter, with an accuracy of about ±2 μGals. NGS owns and operates instrument number FG5X-102. (Source: National Geodetic Survey)
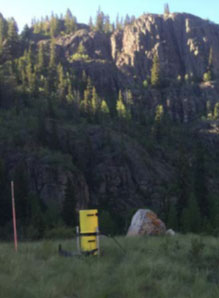
A10 Absolute Gravimeter. A field deployable version of the laboratory FG5 absolute gravimeter, was developed by Micro-g LaCoste in the early 2000’s. This instrument, now known as the A10, operates on principals nearly identical to the FG5 free fall gravimeter. However, the laser used in the A10 system is not a primary standard due to the low power and fragile nature of the Iodine based laser, and does need to be calibrated routinely. (Source: National Geodetic Survey)
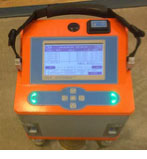
Scintrex CG-6 Relative Gravimeter. The Scintrex CG-6 relative gravimeter is the newest generation of the CG line of quartz sensor relative gravity meters. The CG-6 (like its predecessors the CG-3 and CG-5) operates on the same fundamental theory as the LaCoste and Romberg G and D relative gravimeters, but uses a quartz sensor spring instead of a metal sensor. The primary advantage of a quartz sensor is its insensitivity to instrument shock or vibration that can cause offsets in the gravity measurements. (Source: National Geodetic Survey)
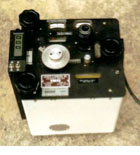
LaCoste and Romberg Relative Gravimeter. LaCoste and Romberg (L&R) relative land, air/sea, borehole, and tidal gravimeters have been manufactured by LaCoste and Romberg Gravity Meters, Inc. since 1959. The company later merged into Micro-g LaCoste, Inc., and the LaCoste land gravimeters were discontinued. Unlike the Scintrex gravimeters, these rely on metal zero-length-springs. (Source: National Geodetic Survey)
Superconducting Cryogenic Gravimeter. A superconducting cryogenic gravimeter is designed to be continuously monitor relative changes in the local gravity over time. It main applications include precise tidal analysis, ground water monitoring, and geodynamics. The precision of an SG is still unmatched by any other instrument at better than 0.1 μGals at short time scales. (Source: National Geodetic Survey)
gPhoneX Gravity Meter. The gPhoneX, manufactured by Micro-g LaCoste, is a low (linear) drift, metal spring-based gravimeter. Like the SG, it is designed to measure relative changes in gravity over time, at a fixed location. While not as precise as the SG at short time scales; at periods of longer than a few hours, the noise characteristics of the two instruments are quite similar. The advantages of a gPhoneX compared to a SG for long term monitoring include lower cost, lower power consumption, increased portability, and lack of a requirement for maintaining superconducting temperatures. (Source: National Geodetic Survey)
JILAg Absolute Gravimeter. The AFGL, JILA/IGPP and JILAg series of absolute gravimeters are the out-of-production predecessors to the FG5 gravity meter. These instruments were developed by James Faller and colleagues beginning in the mid-1970s, and were crucial for defining and providing the basis for the IGSN71, NGSGN, and other scientific projects. Agency (now NGA), the University of California at San Diego (IGPP), and NGS. (Source: National Geodetic Survey)
The document highlights something about the United States gravity data that most users don’t think about. That is, gravity values are referenced to a gravity network just like NGS’ published orthometric heights are referenced to the NAVD 88. In the mid-1950s, a coordinated effort was initiated by the International Association of Geodesy (IAG) to make gravimeter ties throughout collaborating parts of the world to support establishment of an International gravity datum.
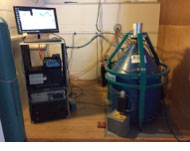
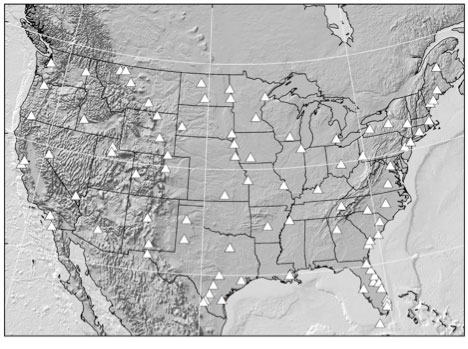
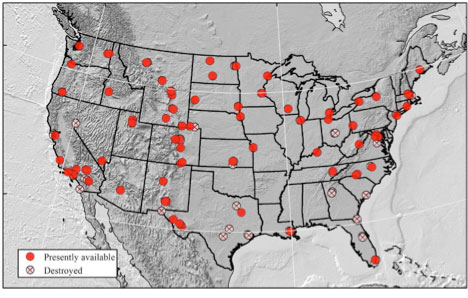
It incorporated intercontinental, north-south, calibration lines and long-distance ties established by airplane. The majority of USA relative gravimeter work was done from 1965 – 1967, resulting in the network shown in the box titled “International Gravity Station Net of 1971 (IGSN71) in CONUS.” The report states that the calculations were completed by Urho A. Uotila of The Ohio State University around 1970.
The gravity network was constrained by a network of ballistic absolute gravimeters. Five of the eight absolute gravimeter sites were in CONUS. It was a world-wide, simultaneous adjustment and published as The International Gravity Standardization Net 1971 (I.G.S.N. 71). A
s of December 2019, the IGSN71 remains the official international gravity datum. Many of these stations have been destroyed over the decades, in particular those at passenger airport terminals.
International Gravity Station Net of 1971 (IGSN71) in CONUS
Figure 14: IGSN71 Gravity Stations. (Source: National Geodetic Survey)
In the mid-1970s, NGS was involved in two major readjustment projects, replacement of NAD27 with NAD 83 and the replacement of NGVD 29 with NAVD 88. At the same time, the NGS gravity group were evaluating the gravity data in NGS database and the gravity stations involved in the IGSN71. During the period 1975 and 1979, NGS and NGA (formally DMA) performed relative gravity surveys around CONUS to evaluate the stations.
A report by Robert Moose titled “The National Geodetic Survey Gravity Network” published by NGS in 1986 documents the results of the surveys. This network is denoted as the National Geodetic Survey Gravity Network (NGSGN) and depicted in the box titled “National Geodetic Survey Gravity Network (NGSGN) in CONUS.” The NGSGN was constrained by 8 absolute gravimeter stations and consisted of 232 stations. Differences between NGSGN values and IGSN71 values were computed to evaluate or detect change in gravity values.
The box titled “Gravity Differences between NGSGN and IGSN71 Common Stations” depict these differences. The report states “In summary, the gravity differences between NGSGN and IGSN are generally small and many of the larger differences may be due to vertical motion.
National Geodetic Survey Gravity Network (NGSGN) in CONUS
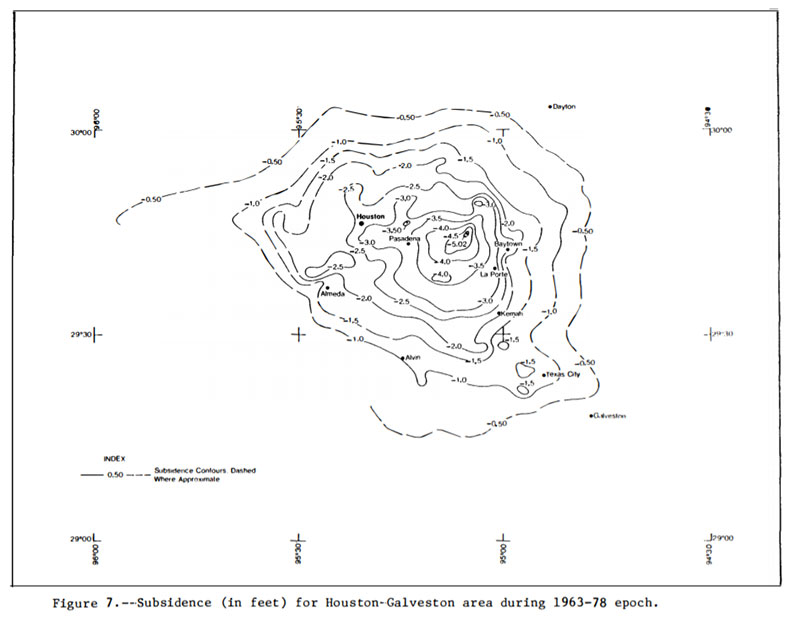
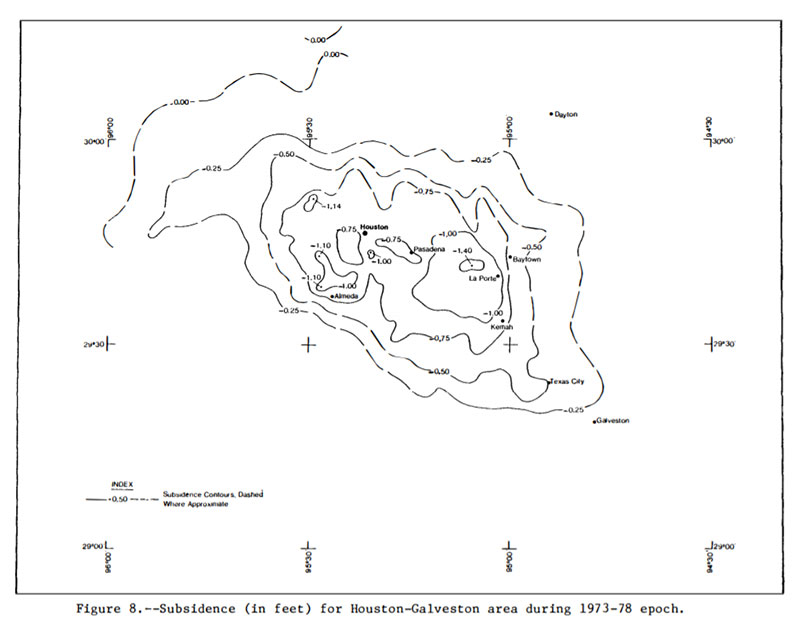
Figure 16: Difference between NGSGN and IGSN71 AG values [mgal] (Source: National Geodetic Survey)The basic rule of thumb for estimating land movement using gravity changes is: 1 meter of change equals 0.3086 mgals (1 cm of change equals 0.003086 mgals). It should be noted that a positive difference in gravity in the figure indicated apparent subsidence. As stated by the 1986 report by Moose, the large difference in Houston-Galveston region is most likely due to subsidence.
A report documenting the apparent movement in the Houston-Galveston region was published by NGS in 1980. The boxes titled “ Estimate of Subsidence in Houston-Galveston Area During 1963-78 Epoch” and “Estimate of Subsidence in Houston-Galveston Area During 1973-78 Epoch” provide estimates of the movement in the region that include the same epoch of the two gravity networks. These two plots agree with the summary statement in the 1986 report.
Estimate of Subsidence in Houston-Galveston Area During 1963-78 Epoch
NOTE: 30 cm approximately equals to 1 foot (Source: National Geodetic Survey)
What does all this mean to the geoid? Accurate and current gravity data are critical to the development of an accurate geoid model that includes estimating changes in the geoid model over time.
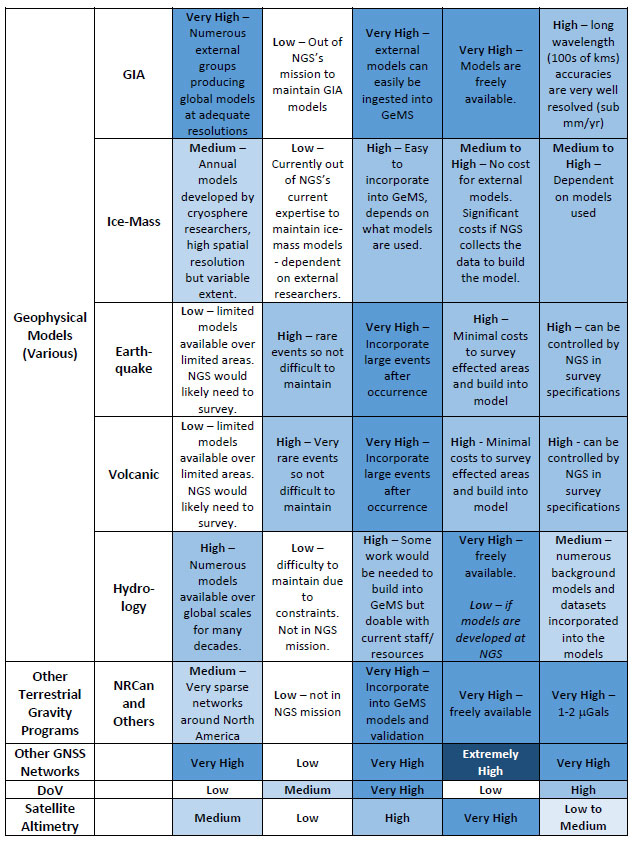
The technical report on NGS’ Geoid Monitoring Service (GeMS) describes geodetic and geophysical techniques that are currently known to NGS and show promise for GeMS (see the box titled “Summary of Known Geoid Monitoring Techniques that are currently outside of NGS’s Expertise). It should be noted that all of these techniques rely on a non-NGS entity to create a product (such as a model or dataset) that NGS can utilize in their products and services. This is nothing new; NGS leverages partnerships for other products such as the GOCO05S satellite gravity model produced by an ESA consortium led by the Technical University of Munich. This model is used by the NGS geoid team in static geoid modeling.
Summary of Known Geoid Monitoring Techniques that are currently outside of NGS’s Expertise
(Source: Table 7 from Technical Report NOS NGS 69)
Continuation of Summary of Known Geoid Monitoring Techniques that are currently outside of NGS’s Expertise
(Source: Table 7 from Technical Report NOS NGS 69)
As apparent by all of the types of data required to monitor the geoid, NGS has a challenging task to establish a Geoid Monitoring Service. Why is it important to invest resources to monitor the geoid? Analyzes of temporal satellite gravity missions provide changes in gravity values that can be use to create changes in the geoid. The GRACE (Gravity and Climate Experiment) satellite mission was designed to provide the temporal gravity field variations throughout its mission (duration 2002 – 2017). There are analysis centers that produce models using the GRACE data – University of Texas at Austin Center for Space Research (UTCSR), NASA Jet Propulsion Laboratory (JPLEM), and GFZ German Research Center for Geosciences (GFZOP). Release 6 denoted as RL06 is the most current GRACE data from these groups.
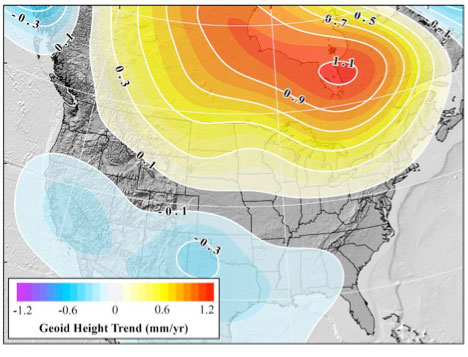
The data can be used to illustrate the magnitudes and resolutions that GRACE models provide to the seculargeoid rates for CONUS and Alaska. The boxes titled “GRACE Trend over CONUS from UTCSR RL06” and “GRACE Trend over Alaska from UTCSR RL06” are plots from Technical Report NOS NGS 69 that show these secular geoid trends from UTCSR-RL06. The plots indicate very small changes in the geoid but they are significant if the goal is to monitor the geoid model to the mm/year level.
GRACE Trend over CONUS from UTCSR RL06
Figure 27: GRACE Trend over CONUS from UTCSR RL06 Model [mm/yr] (Source: Figure 27 from Technical Report NOS NGS 69)
GRACE Trend over Alaska from UTCSR RL06
Figure 28: GRACE Trend over Alaska from UTCSR RL06 GRACE Model [mm/yr] (Source: Figure 28 from Technical Report NOS NGS 69)Another product available from various processing centers are surface mass concentrations (mascons) as observed by the GRACE satellites. Once again, these mascons can be used to generate a secular geoid rate. The boxes titled “Geoid rate over CONUS based on the GSFC mascon model” and “Geoid rate over Alaska from GSFC mascon model” are plots from Technical Report NOS NGS 69 that provide the secular geoid rate based on the NASA GSFC mascon model. Once again, the plots indicate very small changes in the geoid but there is a systematic change to the geoid based on the analysis of the data from the GRACE mission.
Geoid rate over CONUS based on the GSFC mascon model
Figure 32 From Technical Report NOS NGS 69: Geoid rate over CONUS based on the GSFC mascon model [mm/yr] (Source: Figure 32 From Technical Report NOS NGS 69)
Geoid rate over Alaska from GSFC mascon model
Figure 33 From Technical Report NOS NGS 69: Geoid rate over Alaska from GSFC mascon model [mm/yr] (Source: Figure 33 From Technical Report NOS NGS 69)The report stated that when considering monitoring the geoid, the greatest change to the geoid from glacial isostatic adjustment (GIA) processes is centered in northern Canada, but there is “still a significant geoid height trend in the Northern Plains, Great Lakes, and Northeast regions of CONUS.”
It was noted that if GIA processes are not considered, a 1 cm error in the geoid undulation would occur within 18 years. NADGPD2022 orthometric heights are going to be established using a NATRF2022 ellipsoid height and a GEOID2022 geoid height. This is why the geoid needs a time-dependent component.
This column highlighted NGS new Geoid Monitoring Service (GeMS); and, that NGS’ will be publishing a gridded geoid model GEOID2022 that will contain two components:
The first component will be time independent, denoted as the Static Geoid model of 2022 (SGEOID2022) and
The second component will be a time-dependent geoid undulation model, denoted as Dynamic Geoid model of 2022 (DGEOID2022).
NGS will publish a GEOID2022 value that will be based on both SGEOID2022 and DGEOID2022. The column provided examples of how GRACE data can be used to illustrate the magnitudes of secular geoid rates for CONUS and Alaska.
Trimble has acquired Cansel Survey Equipment’s Can-Net and AllTerra New Zealand’s iBase networks. The acquisitions significantly increase the global footprint of Trimble-owned Virtual Reference Station (VRS) networks by adding key geographies in North America and New Zealand.
Subscription-based VRS correction services are now accessible to more customers around the world who rely on high-accuracy corrections to increase productivity and reduce operational costs. The correction services are designed for professionals in agriculture, geospatial and construction as well as emerging high-accuracy applications, such as on-road positioning for passenger vehicles. Financial terms were not disclosed.
The Can-Net and iBase acquisitions add over 1.1 million square kilometers (over 425,000 square miles) to Trimble’s correction services coverage that has grown robustly over the past eight years, contributing to Trimble’s shift toward software, services and subscription business emphasis.
Can-Net Network. The Can-Net network comprises multiple VRS networks and single-base solutions offering GNSS corrections across Canada. The acquisition provides Trimble with the largest VRS footprint in Canada, covering more than one million square kilometers (386,000 square miles).
Subscribers primarily work in the agriculture, survey and construction industries. In addition, the Can-Net network enables Trimble corrections technology to be used by automotive stakeholders deploying ADAS systems along the Trans-Canadian Highway.
iBase Network. The iBase network expands Trimble’s VRS footprint across both the north and south islands of New Zealand, totaling more than 100,000 square kilometers (39,000 square miles).
“The high-accuracy precision provided by VRS technology is a powerful tool in driving operational and financial efficiency for industries that require easy access to positioning services,” said Patricia Boothe, vice president of Trimble’s Advanced Positioning Division. “We are aggressively expanding the accessibility of VRS corrections around the globe. Our vision is to make high-accuracy positioning available to the broadest base of commercial users worldwide for applications in agriculture, construction, automotive, autonomy and others where precise positioning is a critical part of the solution. Trimble will continue to invest in technology and infrastructure to push the boundaries of performance and accessibility for our portfolio of services.”
Trimble networks are supported by a global network operations team made up of GNSS system engineers, geodesy experts and IT professionals. The team monitors the networks 24/7 from operation centers located on three continents, ensuring consistent and reliable service uptime and performance integrity.
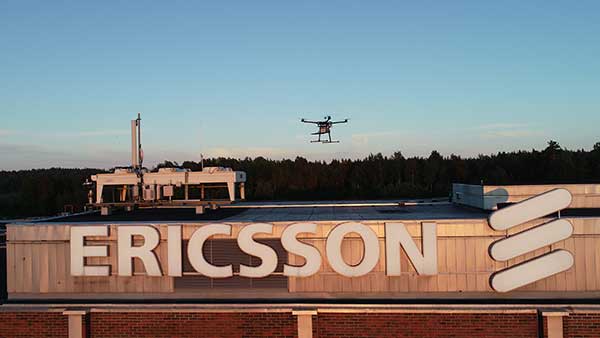
Test and measurement specialist Rohde & Schwarz has supplied mobile network testing tools used in drone-based network coverage, performance and operation tests managed by Ericsson, a global leader in network infrastructure.
Testing mobile coverage. A project team based in Jorvas, Finland, and led by Ericsson’s 5G Readiness Program RAN Technical Lead Richard Wirén, has developed— together with Centria University of Applied Sciences — a novel system for testing cellular mobile network coverage.
The new system uses mobile network-testing scanners and smartphones from Rohde & Schwarz mounted on a drone that can be programmed to execute automatic tests with considerable flexibility, for example for precise route selection and drone speed control.
This solution is especially valuable for industrial use cases. It also has the advantages over traditional walk and drive tests by providing unprecedented repeatability and positional accuracy with the ability to verify beamforming and map coverage in 3D.
Drone-mounted scanner. The R&S TSMA6 network scanner is mounted on a drone and is able to simultaneously verify important LTE and 5G NR coverage metrics such as reference signal received power (RSRP) and signal-to-interference-plus-noise ratio (SINR) in accordance with 3GPP standards.
When combined with the R&S QualiPoc Android smartphone-based optimizer, IP trace, application quality of service (QoS) metrics such as serving cell parameters are possible. The solution currently uses LTE user equipment (UE) but will soon be further developed to include 5G UEs such as the Samsung S10 5G.
The drone can be programmed to follow an exact three-dimensional route.
Repeatable tests. More than 20 successful measurement flights conducted so far have shown the solution procedure and results to be extremely repeatable. The drone flights were of various duration, altitudes and routes, depending on the test case.
Control, authentication and air traffic control are considerable challenges to the development of robust drone-based solutions. In this new system they are conducted over cellular networks, eliminating the requirement for line-of-sight connection between the drone and its pilot.
The unique procedure enables unprecedented 3D accessibility, positional accuracy and repeatability of the testing.
It also opens up new possibilities to ensure end-user QoS for demanding 5G use cases such as industry 4.0, automotive and public safety, Rohde & Scwarz said.
5G New Radio. The deployment of 5G New Radio (NR) brings new applications of cellular networks for subscribers, government and industry. It also makes the verification of the correct coverage, performance and operation of networks more critical, increasing the demand for accuracy and accessibility in traditional field network tests.
“For 5G to realize its promise, field verification of operation and quality is essential, and this development is a pioneering way to ensure our customers receive the network performance they require,” said Richard Wirén, 5G Readiness Program RAN Technical Lead from Ericsson. “We are delighted to utilize test solutions from Rohde & Schwarz that have proven themselves very reliable and are excited that we now have access to solutions based on commercially available 5G NR UEs such as the Samsung S10 5G.”
“We are delighted to combine our industry-leading mobile network testing know-how with Ericsson’s long tradition of network innovations to ensure the delivery of end-user Quality of Experience as 5G NR becomes a reality,” said Hanspeter Bobst, vice president of mobile network testing for Rohde & Schwarz.
Ericsson and Rohde & Schwarz are collaborating with Tampere University and Centria University of Applied Sciences, and the project forms part of the Business Finland 5G FORCE program.
Future developments will focus on testing critical 5G applications such as public safety and machine-type communications for Industry 4.0, extending the frequency to extremely high frequencies of the mmWave bands and testing in an urban environment.





![Figure 16: Difference between NGSGN and IGSN71 AG values [mgal] (Source: National Geodetic Survey)](https://stage.globalpositioningnews.com/wp-content/uploads/zilkoski-december-2019-column-image-14.jpg)
![Figure 28: GRACE Trend over Alaska from UTCSR RL06 GRACE Model [mm/yr] (Source: Figure 28 from Technical Report NOS NGS 69)](https://stage.globalpositioningnews.com/wp-content/uploads/zilkoski-december-2019-column-image-20.jpg)
![Figure 32 From Technical Report NOS NGS 69: Geoid rate over CONUS based on the GSFC mascon model [mm/yr] (Source: Figure 32 From Technical Report NOS NGS 69)](https://stage.globalpositioningnews.com/wp-content/uploads/zilkoski-december-2019-column-image-21.jpg)
![Figure 33 From Technical Report NOS NGS 69: Geoid rate over Alaska from GSFC mascon model [mm/yr] (Source: Figure 33 From Technical Report NOS NGS 69)](https://stage.globalpositioningnews.com/wp-content/uploads/zilkoski-december-2019-column-image-22.jpg)