In my 20-plus years of involvement in the GPS/GNSS industry, nothing has come close to the LightSquared debate for technical and political complexity, nor for potential effects on nearly every high-precision GPS/GNSS user in the United States. The industry’s destiny is somewhat controlled by a federal agency that is not very knowledgeable about how, when, and where GPS is used — although I’m sure they’ve learned a lot in the last 14 months.
While receiver manufacturers have a firm grip on the technical complications of what LightSquared proposed, they have jockeyed for market position, as information released to the public is filtered through their marketing heads. Finally, media coverage is all over the place, from “LightSquared is doomed” to “this will happen.”
On January 13, as we all know, the U.S. deputy secretaries for defense and transportation wrote, on letterhead of the Space-Based Positioning Navigation & Timing National Executive Committee (PNT EXCOM), to the head of the National Telecommunications Information Administration (NTIA), declaring that “there appear to be no practical solutions or mitigations that would permit the LightSquared broadband service, as proposed, to operate in the next few months or years without significantly interfering with GPS.”
On February 14, the NTIA director wrote to the Federal Communications Commission (FCC) chairman in a similar vein with nearly the same language. That same day, the FCC stated its intent to “not lift the prohibition on LightSquared,” and to “vacate the Conditional Waiver Order, and suspend indefinitely LighSquared’s Ancillary Terrestrial Component authority.”
It just so happens that LightSquared cannot accomodate military GPS users nor aviation GPS users. Those of you who use high-precision GPS can thank your lucky stars that the military and aviation folks are standing in your corner. Otherwise, as I warned back in May of last year, high-precision users would have been thrown under the onrushing bus of national broadband.
In testimony to a House of Respresentatives subcommittee meeting on GPS and aviation in early February, the Transportation deputy secretary revealed that the Federal Aviation Administration (FAA) spent more than $2 million of taxpayer dollars with two different independent labs to conclude that LightSquared proposals were not compatible with several GPS-dependent air safety-of-flight systems.
Don’t expect the Department of Defense (DoD) ever to provide similar testimony. The Pentagon played its veto card off-air and out of the public eye.
LightSquared has continued to complain about GPS receivers “looking into our spectrum” as the reason for the interference GPS receivers are suffering. If you missed Richard Keegan’s December 2011 article in GPS World, you should take a look. He succinctly addresses this issue, as I did in my November 2011 Survey Scene column.
As LightSquared has clearly lost the engineering argument, it has taken a very creative approach in an attempt to convince the FCC that this isn’t an engineering problem, but rather all about the FCC rules. LightSquared petitioned the FCC to confirm that “GPS devices are not entitled to protection from interference.”
Crazy statement? If you think so, see if you recall reading this statement on equipment such as GPS receivers. It is on almost every electronic device that relies on radio signals.
“This device complies with Part 15 of the FCC Rules. Operation is subject to the following two conditions:
“(1) This device may not cause harmful interference, and (2) this device must accept any interference received, including interference that may cause undesired operation.”
What if LightSquared can convince the FCC that GPS receivers do, indeed, fall within the confines of Part 15 of the FCC rules and aren’t entitled to interference protection? That’s what the company is trying to do, and that’s why this fight ain’t quite done.
Don’t underestimate the power of the White House pushing the National Broadband Plan, or of commercial interests — of which there are myriad — seeking to turn a buck on the hunger, whether real or only perceived, for limitless broadband. Even the transportation depsec allowed in his testimony as how “in the Obama administration, we believe deeply in what LightSquared is attempting to do, which is to make the Internet more accessible to more people all across the country. This is an urgent national priority.”
Communications for My RTK
Some people in the GPS industry who believe that the LightSquared service will do wonders for RTK operations, somehow replacing the communications methods we currently use (UHF/VHF, 900MHz, GSM/GPRS, CDMA, Wifi/Mifi, etc.). I disagree.
LightSquared was relying on Sprint’s infrastructure (~31,000 towers) for its terrestrial operations, supplementing them with ~3,400 LightSquared towers at some point. I’ve used Sprint’s mobile phone service for about 12 years and I used Sprint’s data card service for several years (not any longer). I pretty much know that Sprint is good for metro areas and poor for rural areas. Like other wireless providers (AT&T, Verizon, T-Mobile, etc.), Sprint is strong in some geographic areas, and weak in others. Since LightSquared is focused on serving people (densely populated areas) rather than geographic areas (e.g., farmlands), their terrestrial service is not going to be even close to being nationwide. LightSquared’s solution for areas not covered by their terrestrial service is to use satellite communications for Internet connectivity.
If you think you would enjoy ubiquitous coverage with satellite communications for your RTK operations, consider OmniSTAR’s service, which is in the same spectrum as what LightSquared proposed. OmniSTAR works great when there’s a clear view of the sky to one of OmniSTAR’s satellites (ironically, operated by LightSquared) such as in the agriculture industry. But I’ve used it a bit and — just like GPS — it doesn’t work in buildings, in vehicles, under trees, or in other obstructed-sky locations.
Can you imagine using a LightSquared mobile phone that doesn’t work in buildings, in cars, or under trees? You wouldn’t. Anyone who’s ever used RTK knows that spotty base/rover communications is the quickest way to spoil an RTK party. With GPS/GLONASS receivers allowing us to use RTK in places where we’ve rarely ventured before, the limitation wouldn’t be the number of navigation satellites in view, but rather if the LightSquared satellite was in view.
For those of you who heard that LightSquared might have been a good idea in order to make wireless mobile Internet access more affordable, I seriously doubt that statement as well. Documents in a huge Freedom of Information Act release by the FCC reveal what LightSquared was planning to charge its wholesale customers (not retail) when they were out of range of the terrestrial system and forced to use LightSquared’s satellite for wireless broadband. The wholesale cost of their satellite broadband service was to be $10 per megabyte (not gigabyte), an astonishingly high price for a company that’s been touting affordable, nationwide wireless broadband Internet service.
Upgrade Costs
A cool $2.4 billion was the official estimate given for aviation industry upgrades, should LightSquared have gone forward. I think that’s conservative because I doubt it covers the infrastructure upgrade cost (WAAS, GBAS, and so on) or the cost of NextGen program delays.
How about something closer to home? I queried the administrator of a statewide RTK network of 103 GNSS reference stations, and used his estimates to extrapolate national costs in that regard: 7,000 CORS receivers across the United States. They look like this: optimistic scenario, $64 million; likely,$92 million; worst-case scenario, $120 million.
Keep in mind that this is only the high-precision GPS/GNSS infrastructure in the United States. There are still hundreds of thousands of high-precision GPS/GNSS receivers owned by users across the country that would have to be upgraded. For many GPS receivers (think handheld), there will be no upgrade solution, so the manufacturer might offer trade-in credit for a new GPS receiver.
After spending time to understand the actual costs of accomodating LightSquared, one state legislator who initially voiced his support for LightSquared said “we can’t afford it.”
New Beginnings
Included in the NTIA report was a recommendation that, with time, GPS receivers could be redesigned in order to accomodate LightSquared’s 10L signal.
NTIA also reported that during the January 13 EXCOM meeting, it was agreed that “federal agencies will move forward this year to develop and establish new GPS spectrum interference standards that will help inform future proposals for non-space commercial uses in the bands adjacent to the GPS signals and ensure that any such proposals are implemented without affecting existing and evolving uses of space-based PNT services vital to economic, public safety, scientific, and national security needs.”
In summary, GPS/GNSS receiver designs will change in the coming years and move towards more efficient use of spectrum. To me, a critical statement in the NTIA letter to the FCC is “without affecting existing and evolving” — meaning that not only should GPS be considered, but also GPS-like systems from other countries such as Russia’s GLONASS, Europe’s Galileo, and other developing satellite navigation systems and applications.
ERIC GAKSTATTER is contributing editor for survey of GPS World, and editor of Geospatial Solutions.
The Federal Communications Commission (FCC) Office of Engineering and Technology will host a workshop on spectrum efficiency and receivers on Monday, March 12, and Tuesday, March 13, in the Commission Meeting Room at FCC Headquarters in Washington, D.C. The meeting is part of the FCC’s efforts to enhance the use of spectrum for mobile broadband — including LightSquared — and is being held in conjunction with the Wireless Telecommunications Bureau and the Office of Strategic Planning.
The role of receivers in enabling access to spectrum for new services implicates federal stakeholders, as well as the private sector, the FCC said in its announcement of the meeting. “Receiver performance issues have often arisen as a conflict between legacy stakeholders and new entrants where deployment of new technologies and services threatens to adversely impact an incumbent or place restrictions on the new entrant. Past examples include interference issues between new cellular radio systems and public safety radio systems, satellite digital radio systems and proposed terrestrial data services, unlicensed Wi-Fi systems and FAA weather radar systems, and ancillary terrestrial service on mobile satellite spectrum and GPS.
“The resolution of such matters has historically required a public process involving regulators, stakeholders and other parties. Because such discussions sometime begin upon the introduction of a new service or technology, full deployment of such new services could be hindered. New approaches to spectrum management focusing on spectrum efficiency and receiver performance may enable more assured deployment of new services and reduce the necessity for the involvement of regulators.”
The two-day workshop will discuss the characteristics of receivers and how their performance can affect the efficient use of spectrum and opportunities for the creation of new services, the FCC said. Key topics will include current practices for receiver design, case studies involving interference due to receiver characteristics, and approaches for promoting interference avoidance and efficient use of spectrum, given the current receiver base and potential future deployments. The workshop will include perspectives from licensees, equipment manufacturers, component providers, and other interested parties.
For more information, contact Michael Ha, Office of Engineering and Technology at (202) 418-2099 or by email: [email protected].
Accessibility Information. To request information in accessible formats (computer diskettes, large print, audio recording, and Braille), send an email to [email protected] or call the FCC’s Consumer and Governmental Affairs Bureau at (202) 418-0530 (voice), (202) 418-0432 (TTY). The public notice can also be downloaded in Word and Portable Document Format (PDF) a FCC.gov.
Eric Gakstatter, Survey Scene and GIS editor, along with Gavin Schrock (Administrator, Washington State Reference Network) and Laurence Socci (ACSM/NSPS Government Affairs Consultant) will be guests on America’s Web Radio on Monday, February 27, at 11 a.m. Eastern Time to discuss the latest developments in the LightSquared/GPS interference debate as well as other GPS/GNSS issues.
The one-hour program is hosted and moderated by American Congress on Surveying and Mapping’s (ACSM) executive director Curt Sumner.
You can listen to the radio broadcast by visiting America’s Web Radio website. The show will also be recorded and available on the ACSM and GPS World websites for download.
ACSM, with its largest Member Organization being the National Society of Professional Surveyors (NSPS), was founded in June 1941 and is incorporated as a non-profit educational organization whose goal is to advance the sciences of surveying and mapping and related fields, in furtherance of the welfare of those who use and make maps. ACSM also encourages the development of educational programs and supports publications that represent the professional and technical interests of surveying and mapping. The society is comprised of four independently incorporated Member Organizations which include more than 5000 surveyors, cartographers, geodesist, and other spatial data information related professionals from private industry, government, and academia throughout the world. Each member Organization serves the specific interests of their respective members, while working collectively to achieve the overall goals of ACSM.
The more than year-long battle between wireless start-up LightSquared and the GPS industry peaked earlier this week when the National Telecommunications and Information Administration (NTIA), tasked by the Federal Communications Commission (FCC) to study the potential interference problem between LightSquared’s mobile wireless proposal and GPS receivers, issued a statement and report with the following conclusion:
“The federal agencies and LightSquared have invested significant time and resources to identify and analyze proposed solutions to address the impact of LightSquared’s planned network implementations. Based on the testing and analyses conducted to date, as well as numerous discussions with LightSquared, it is clear that LightSquared’s proposed implementation plans, including operations in the lower 10MHz would impact both general/personal navigation and certified aviation GPS receivers. We conclude at this time that there are no mitigation strategies that both solve the interference issues and provide LightSquared with an adequate commercial network deployment.”
The FCC subsequently issued a statement including the following paragraph:
“NTIA, the federal agency that coordinates spectrum uses for the military and other federal government entities, has now concluded that there is no practical way to mitigate potential interference at this time. Consequently, the Commission will not lift the prohibition on LightSquared. The International Bureau of the Commission is proposing to (1) vacate the Conditional Waiver Order, and (2) suspend indefinitely LightSquared’s Ancillary Terrestrial Component authority to an extent consistent with the NTIA letter. A Public Notice seeking comment on NTIA’s conclusions and on these proposals will be released tomorrow.”
As promised, the FCC subsequently opened a Public Notice seeking comments based on NTIA’s report and conclusions. View the Public Notice here. Public comments close on March 1, 2012. If you have invested in GPS technology, you should enter your comments to protect your investment.
Submitting your comments to the FCC only takes five minutes. You don’t need to write an essay. Just state that you support the NTIA’s conclusion.
You can compose your comments in a text editor like Notepad, then save the file and attach it. Once you go to the FCC comment submission website, it will make sense. If you have any problems, email me.
Go to the FCC comment submission website by clicking here.
Type in the following information:
Proceeding Number: 11-109
Name of Filer: Enter your name
Address Line 1: Enter your address
City: Enter your city
State: Enter your state
Zip: Enter your zipe code
Attach your comments
That’s it. Five minutes and you’re done.
You might have heard about another Public Notice that the FCC issued regarding LightSquared. It is in response to LightSquared’s petition to rule that GPS receivers are not entitled to interference protection. I wrote about it last week. You can read my article here. At that time, I was planning to submit my comments, but that was before the NTIA released its report and conclusions this week. I wouldn’t suggest you not enter a comment to the earlier Public Notice, but certainly I’d focus on entering comments on the latest Public Notice in support of NTIA’s report and recommendations.
For those of you who heard that LightSquared might have been a good idea in order to make wireless mobile Internet access more affordable, I have serious doubts about that statement. Here’s why…
Borrowing from my article last week, LightSquared is relying on Sprint’s infrastructure (~31,000 towers) for its terrestrial operations, and supplementing them with ~3,400 LightSquared towers at some point. I’ve used Sprint’s mobile phone service for about 12 years, and I used Sprint’s data card service for several years (not any longer). I pretty much know that Sprint is good for metro areas and poor for rural areas. Like other wireless providers (AT&T, Verizon, T-Mobile, etc.), Sprint is strong in some geographic areas, and weak in others. Since LightSquared is focused on serving people (densely populated areas) rather than geographic areas (e.g., farmlands), their terrestrial service is not going to be even close to being nationwide. LightSquared’s solution for areas not covered by their terrestrial service is to use satellite communications for internet connectivity. If you want to know more about this, read Tim Farrar’s blog on the subject, which includes a map of LightSquared’s terrestrial coverage. I’ve asked LightSquared for the most current deployment map, but received no response. I’ve been unable to find it even in their FCC filings (maybe you can), but I have to believe that if it was something to be proud of, they would be showing it to everyone.
Furthermore, in a huge FOIA (Freedom of Information Act) document release last week by the FCC, documents reveal what LightSquared was planning to charge their wholesale customers (not retail) when customers were out of range of their terrestrial system and forced to use LightSquared’s satellite for wireless broadband. The wholesale cost of their satellite broadband service was to be $10 per megabyte (not gigabyte), an astonishingly high price for a company that’s been touting affordable, nationwide wireless broadband Internet service. If you want to read for yourself, click here. You can read about LightSquared’s objections to the FOIA document release here.
LightSquared bankruptcy looming?
Of course, after the NTIA issued its report and conclusions this week, there were many rumors that LightSquared would soon declare bankruptcy. In response, LightSquared financier Phil Falcone told Reuters “It is clearly not on our table” and that “There are other ways around this.”
Other rumors include a proposed spectrum swap that GPS World reported two weeks ago. Although it’s tough to rule out anything, this would be quite a stretch, especially for the spectrum mentioned in the GPSWorld article (1515-1525 MHz) since it’s still close enough to LightSquared’s 10L signal (1526-1536 MHz) that failed to pass the NTIA’s interference testing that it would likely require another round of GPS interference testing. Furthermore, one of the NTIA’s sticking points was the potential interference from LightSquared’s mobile devices, which operate (uplink) in the 1626.5-1660.5 Mhz range, so that would need to be addressed as well.
The beginning of a new era of GPS/GNSS technology.
Included in the NTIA report was a recommendation that, with time, GPS receivers could be redesigned in order to accomodate LightSquared’s 10L signal.
NTIA also reported that during the January 13 Excom (Position, Navigation, Timing Executive Committee) meeting, it was agreed that “federal agencies will move forward this year to develop and establish new GPS spectrum interference standards that will help inform future proposals for non-space commercial uses in the bands adjacent to the GPS signals and ensure that any such proposals are implemented without affecting existing and evolving uses of space-based PNT services vital to economic, public safety, scientific, and national security needs.”
In summary, GPS/GNSS receiver designs will change in the coming years and move towards more efficient use of spectrum. To me, a critical statement in the NTIA letter to the FCC is “without affecting existing and evolving,” meaning that not only should GPS be considered but also GPS-like systems from other countries such as Russia’s GLONASS, Europe’s Galileo, and other evolving satellite navigation systems and applications.
For the latest news, join me next Monday on the ACSM Radio Hour (Monday, February 20)
The LightSquared situation is still very fluid. There seems to be a new twist almost daily.
This past Monday, I was a guest on ACSM’s (American Congress on Surveying and Mapping) Radio Hour with Gavin Schrock and Laurence Socci, hosted by ACSM’s Curt Sumner. You can listen to a recording of the show here.
Due to the significant events that occured this week, I’m returning as a guest either next Monday or the following along with Gavin Schrock to discuss the latest developments. You can join us here at 8 a.m. Pacific/11 a.m. Eastern U.S. time on either day, or the show will be recorded and available for you to listen to at a later date.
In the public dialogue about mobile privacy concerns, I’ve yet to hear a plea to turn back the clock to when mobile apps were supported by subscription fees. Surprisingly, many consumers don’t understand the devil pact that free services come with a loss of privacy. With the exception of enterprise offerings, subscription fees have shrunk or disappeared for most location-based services. At the Institute for Communication Technology Management at the University of Southern California, Allison Cera of Lucent-Alcatel talked about the intersection of technology and identity. More than half of the people in her study felt they shouldn’t have to provide information about themselves just to get the most out of online services. Among the most connected technology users, the expectation of privacy was lower.
As companies rework privacy agreements, it’s interesting that Cera’s research indicates people prefer a simpler privacy policy that is easier to understand, over one that provides more comprehensive protection. In addition to simplicity, people prefer uniformity. Almost 90 percent want to see Internet and mobile service providers, social networking sites, and search engines all governed by the same laws and regulations regarding the collecting, analyzing, and sharing of online data.
Google knows all? Google has experienced heat from lawmakers and consumers over its efforts to consolidate user privacy standards and share data among its offerings. Google announced plans to connect user data across desktop and mobile services including Google+, Gmail and YouTube. “Our new privacy policy makes clear that, if you’re signed in, we may combine information you’ve provided from one service with information from other services,” blogged Alma Whitten of Google. “In short, we’ll treat you as a single user across all our products, which will mean a simpler, more intuitive Google experience.”
You know where I’ve been. Would consumers exchange transparency into whereabouts and driving behavior for a cheaper insurance premium? TomTom is providing the technology behind a new insurance product, which bases premiums on driving behavior. TomTom has teamed up with insurance broker Motaquote for the launch of Fair Pay Insurance, a product that rewards “good” drivers with lower premiums. Drivers who sign up for Fair Pay receive a TomTom navigation device. They will also have a LINK tracking unit fitted in their vehicles, allowing driver behavior and habits to be monitored by the insurer. This information can also be viewed by the policy-holder in their driver dashboard.
A kick without GPS. Mobile location-based advertising, dependent on geo-locating shoppers, hasn’t ramped up as fast as the industry diviners predicted, but shopkick, a location-based shopping app has gotten traction. The company asserts that it helped drive $110 million of in-store revenue to its retail partners in 2011. shopkick rewards shoppers for walking into stores and interacting with products. The solution is not GPS based, as indoor signals remain problematic. Instead, the shopkick phone app detects its presence in a particular store by “hearing” a signal that is emitted from a store-based device. The store is able to send the shopper a reward that can be redeemed for loot.
Pressure mounts for LightSquared. Sprint has given LightSquared until mid-March to obtain FCC clearance for its LTE network. Recent government tests showed that LightSquared interfered with GPS, even under a new deployment plan that the company promoted as a fix to the issue. Lightsquared’s assertion that GPS receivers are “not entitled to any interference protection whatsoever” is open for public comment at the FCC until March 13. Harbinger Capital, the hedge fund that backs LightSquared, reported a 47% decline in its biggest fund.
Love on the Road. Valentine’s Day was yesterday, and love is in bloom. TomTom undertook a mission to find love on the asphalt by seeking roads in the U.S. that are considered romantically named. Texas was a stand out with 102 miles of romantically named roads. Who would’ve thought that the lone star state was such a softie? The most common romantic road names are Rose Road, Lover’s Lane, Valentine Road, Darling Road and Love Street. TomTom counted roads throughout the U.S. containing the words: Couples, Cupid, Darling, Forget-Me-Not, Kiss, Love, Lover, Romance, Rose, Smooch, Sweetheart, Valentine. Smooch Street?
There’s no doubt that geospatial data collected today is more accurate than it was five years ago and will be more accurate five years from now than it is today. A couple of items had me thinking (once again) about the challenge that higher accuracy geospatial is posing and is going to pose in the future.
The first was an interview I did with Dale Lutz this week. Dale is the vice president of software development and co-founder of Safe Software. Dale is a great person to talk to about trends in geospatial data because Safe Software produces geospatial data conversion software tools. Essentially, the company’s software allows users to seamlessly merge geospatial data sets from different sources. For example, a user may have a requirement to merge data sets from AutoCAD, Esri, and Smallworld along with lidar data. Doing so manually can be a terribly laborious task. Not only does the user have to deal with different data formats, but also data of varying accuracy and unknown sources.
“One thing that is an ongoing issue, we see a lot of files that frankly don’t have the right coordinate systems in them or it’s missing, so then that relies on users to know,” said Lutz. “That kind of lack of metadata is going to pose a challenge for people as time goes on because folks aren’t going to remember and the file is going to get passed around. They are not going to know which datum it was collected with and they may not get exactly the correct answer.”
Dale succinctly summarizes the problem. After 20+ years in the geospatial industry, working in many places in the world, and teaching numerous workshops, matching spatial data is the #1 problem people ask me about. It’s fascinating to watch how diligent people are in acquiring the best data collection devices and collecting the most accurate data in the field, only to see it be diluted as it is integrated into a GIS or passed around without the metadata being communicated.
I’m guilty of it as much as anyone. On many mapping projects, I integrate data from several different data sources. Many times the data is a free download from the web with no metadata provided and no technical support. If I’m able to reach someone to ask a detailed question about the data, 90% of the time they will make their best guess as to the datum used and when the data was collected. Was it in the original NAD83 horizontal datum? HARN? NSRS 2007? And even, ugh, NAD27? The difference can be more than a meter or much greater. It doesn’t take much of an error to negate the value of the expensive high-precision GPS receiver you spent thousands of dollars to acquire.
Dale knows all too well. “When we used to deal with a MicroStation file that was accurate to a meter, we didn’t lose too much sleep, but now it’s more of an issue.”
Not only are horizontal datums an issue, vertical accuracy is a challenge of a different kind.
“It’s really doing a good job with the Z (elevation) that is the challenge we are working on. That’s been a big focus for us,” said Lutz.
Another item about geospatial data accuracy I ran into this week was a thread on an Autodesk discussion forum. It was an entertaining thread about parcel maps and how they don’t reconcile nicely.
The original poster summarizes the problem:
“I am trying to draw a parcel map in AutoCAD, using the distance and bearing info that was added by to the original hand-made drawing by the surveyor. The parcels don’t quite close perfectly… Does anyone know what the acceptable tolerances are for parcels of say 1 acre and under, 1-5 acres, and 5-20 acre sites? Will it ever close EXACTLY, or am I a dreamer?? WOuld you send the surveyor back out to take new measurements if, lets say, he was off by .3″? Or a foot? Or 4 feet on a huge parcel? I am new @ this and just getting started. Thanks!”
An obviously well-informed poster responded:
“That is one major open-ended question…
There are all kinds of things that come into play. Some of it is the age of the original plat. There are many places around our country where we have plats created in the 1700’s, using the proverbial “one-eyed goat and a rope”. Those surveys could have major errors, when compared to what we can achieve with today’s technology. But there’s a whole string of law that decides how all of that gets resolved, and it favors the “original survey” whenever possible. But above that, it favors any monuments that are found and recovered. Those typically hold precedence, even if they disagree with the legal record.
There are also standards that you may need to live to now, in our current age, especially if you’re doing something like an ALTA (Land Title) Survey. You have to make sure to perform within the standards set by the law. With today’s technology, this is often relatively easy, but you still may run into issues when dealing with older neighborhoods, laid out in past times when measurements were not as exact, and especially when original monumentation can’t be found… It can get worse; sometimes you find inconsistent monumentation, and have to try to sort through different surveys, figuring out which monuments were set when… It can become quite a puzzle.
Learning all of this stuff is what becoming a professional land surveyor is about. And it takes years to do that. So there’s no real way to explain it all in a forum post.”
Finally, in one sentence the same poster summarizes the colliding worlds of digital cartography, one of the newest digital technologies, and land surveying, one of the oldest professions.
“A jig-saw puzzle made by blind men with dull saws. As I sometimes describe it.”
It’s not a market that will help users find friends or places to eat, but it seems to be one that keeps movin’ along. The government and enterprise market for location-based services seems to be steady, if not growing, as evidenced by nearly 9,000 attendees at the recent Transportation Research Board Annual Meeting in Washington, D.C. Topics included the 20th Anniversary of the government’s intelligent transportation systems program.
WASHINGTON, D.C. — Standing out among the thousands of college professors, scientists and engineers were a core of companies who have made inroads into intelligent transportation systems and other government markets here at the Transportation Research Board Annual Meeting, held January 22-26.
Such companies as TomTom have tried to harness the government market for the past few years with real-time traffic information. The traffic information companies contend that the government market will be big for policy makers, who need detailed support tools to make money-saving decisions for local traffic management programs.
At TRB, TomTom announced a partnership with Delcan Corp. to provide historical traffic data for the Strategic Highway Research Program 2 (SHRP 2). The program is managed by the TRB.
“We’ve been using our real-time traffic information, and our historic products, to work with them on traffic management and planning,” said Nick Cohn, TomTom senior business development manager.
By using GPS-based measurements from the TomTom historical traffic database, Delcan and its partners will develop models for travel time reliability analysis and research as part of the program, the company said. TomTom says its traffic database, which uses traffic measurements, costs less money and is time-saving — compared to survey methods.
Last year at TRB, TomTom announced a partnership with PTV where the company was able to deliver TomTom traffic content, via TomTom Traffic Stats, to its customers in the transportation sector.
20th Anniversary of ITS Well Attended
An introspective session at TRB was the Intelligent Transportation Systems 20th Anniversary, which was attended by industry veterans who were around when the first U.S. Transportation Department directives calling for ITS were issued. Most of the panel members agreed that when ITS was being thrown around as something that may replace Cold War contracting dollars with new markets, no one really tried to predict how technology would shape autos and communication.
While panel members agreed that EZ-Pass was one of the big ITS accomplishments over the last 20 years, some acknowledged that GPS and the Internet and cell-phone development were never really focused on (as at least two weren’t even developed). They agreed that the automotive industry took over the market, not the government.
“Fortunes were made — and lost. Mostly lost,” said Mort Downey, former DOT deputy secretary. Downey said the big deal in getting ITS off the ground was President Clinton’s decision to turn off GPS’ selective availability.
Michael Noblitt of IBM’s Global Business Services remembers that the telematics market really was developed by aftermarket manufacturers. “It was an exciting time. Privacy was traded for convenience and service. Consumers now see [telematics] as valuable,” he said.
Rich Schuman of Inrix, who was the second employee of the entity now know as ITS America, presented a timeline of technology events and tied them to intelligent transportation initiatives. “It’s a chaotic world — don’t try to find it. Focus on business incentives and leave technology to the bigger market,” he said.
Industry old-timers remember that the ITS America and ITS World Congress meetings were the only places to get market information in the 1990s because of auto manufacturers and the two largest digital map makers at the time, Navteq and Tele Atlas/Etak, were the major players. Both meetings have seen a resurgence in the number of auto makers and traffic companies exhibiting to compete for their share of the government market.
ALK Doing Well in European App Stores
At TRB, LBS Insider caught up with Alain Kornhauser, ALK Technologies founder, who talked about his role in the company and what markets have been good for them in the past year. ALK has been in several publications as having the iPhone and Andriod “top app” for its CoPilot Live, which is doing well in Europe, Kornhauser said.
“We’ve done well in respect to app stores. We also participated in the recent Iowa Caucuses when we offered directions to candidates for all 94 of the state’s counties,” he said.
Kornhauser said that Barry Glick, former MapQuest executive who was hired last year as CEO, runs the company’s day-to-day operations. In December, ALK established a new group, Enterprise Solutions, which combined its PC MILER, CoPilot Truck and CoPilot Live Professional product lines plus supporting map data, software tools and professional services. The Enterprise Solutions Group is led by Michael Kornhauser, senior vice president and Alain’s son, who reports directly to Glick.
While competing against free navigation applications, publications are saying that CoPilot Live has a niche because it has a friendlier interface and better directions to gas stations, restaurants and other points of interest.
Industry pioneer Kornhauser, who was involved in autonomous vehicle testing, said that ITS was a success because of the private industry, without government impact or influence. “They didn’t stand in the way,” he said.
Kornhauser, a long-time Princeton University professor and head of its transportation program, said he likes being an entrepreneur. “I also like the [location] space,” he said.
In other LBS news:
Join us for GPS World magazine’s LBS Market in 2012 webinar, “LBS 2012 — Show Me the Money,” on Feb. 22 at 10 a.m. Pacific Standard Time. Speakers will include several industry executives. Register for free.
Audiovox Electronics Corp launched its Car Connection and Care Connection products, both of which Audiovox considers LBS-capable, that will use Sprint’s Nationwide Network in the U.S.A. Car Connection is a new plug-in on-board diagnostic (OBDII) device that will allow consumers to monitor, manage and maintain not only their own but other family drivers’ habits. Care Connection is a wearable personal tracking system that features two-way voice communication to locate children, teen drivers and aging parents.
Persistent Systems purchased Openwave’s Mobile Location-Based business, to offer what its says will be the first enterprise carrier-based LBS. The company says the big market opportunity is that businesses want asset tracking, geo sensing and couponing.
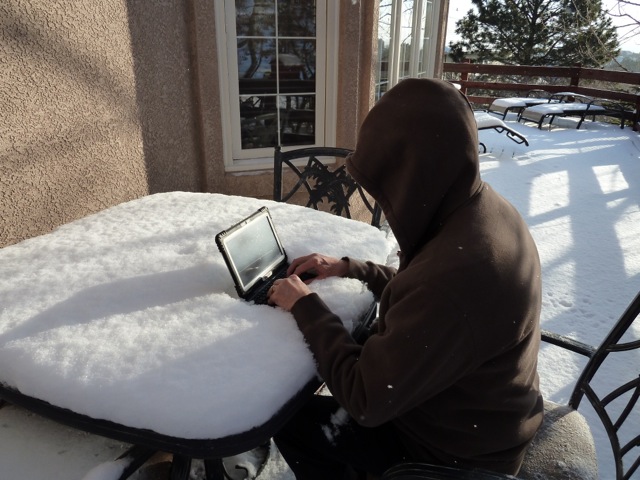
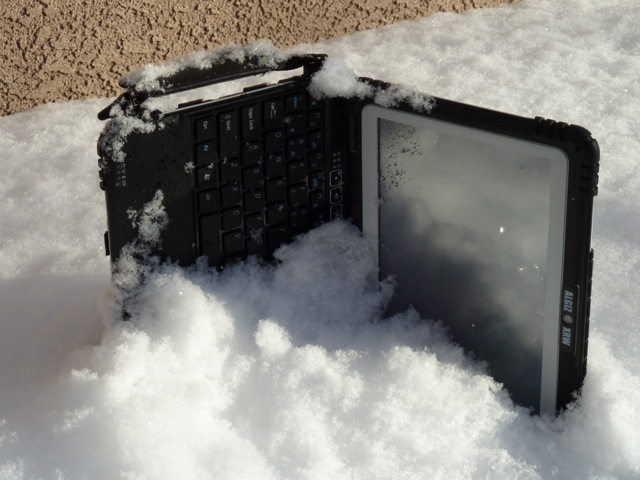
I brushed the snow from the XRW keyboard and in my mind I could hear the neighbors whispering, “Call the men in white coats, there he goes again.” And actually there may be reason for concern, as I am sitting on my deck during a lull in a major blizzard and typing on a laptop computer half buried in snow. But not just any computer.
I am composing the beginning of this month’s column, the words you are reading now, on the Algiz XRW built in the non-tropical Swedish paradise known as Lidköping (which must mean something like “coping by the frozen lake”), and brought to you by the folks at Handheld US. Of course, I know — or certainly hope — my neighbors are not really calling anyone to come take me away to a little padded room because for them my once-strange behavior should by now be almost commonplace. Like swallows returning to Capistrano, when it snows in the Rockies I can be found on my deck with several new devices: dropping them in snow banks and freezing pools of water, and generally putting them through their paces. Where I live in the Rockies, we are eligible for snow 12 months out of the year, so this is not an uncommon occurrence. There are lots of opportunities for testing supposedly rugged devices.
Unfortunately, only about one in ten survive this tortuous treatment, and those are the ones you read about in this column. Remember, my rules of engagement (ROE) are that I only review top-notch products that our warfighters and first responders can use. I never pen a negative review unless it is a comparison evaluation where one of the products is clearly inferior. These inferior products, the ones I don’t write about, are returned to the manufacturers in various states of disrepair. Frankly, I am amazed and disturbed by the huge number of substandard and sometimes just poorly conceived “rugged” laptops on the market. Fortunately, the XRW is not one of them. Indeed, as a rugged GPS-enabled Windows laptop, it rises above the herd of less capable machines and demonstrates that a great device can be produced with just a little, or in the case of the XRW, a lot of planning and forethought, and be genuinely useful to our warfighters and first responders.
The XRW being put through its paces during a lull in a Colorado Blizzard.
Why Test?
I decided to test several rugged laptops during our latest blizzard. A full 20 percent of my warfighter correspondence indicates that there are just some warfighting computer tasks more suited to a rugged laptop than a rugged handheld device.
One of the greatest weaknesses and strengths of current military user equipment (MUE), and be assured it is only one of many, is that the mission planning software requires a separate Windows computer to fully plan missions and download numerous waypoints. The only upside is that, certainly speaking generically, it is usually more convenient and more comfortable to make changes on a laptop versus a rugged handheld. The problem comes with the restriction that this is the only way to make major mission changes to your government-furnished PNT (position, navigation and timing) device. If the mission changes in the field, which happens more often than not, about 90 percent of the time according to warfighters, then you need a rugged laptop in the field to update or change the mission coordinates that are input into the extremely outdated government-furnished GPS device. So for the warfighter, since a laptop is required to make changes, it makes sense to use a rugged laptop or notebook computer to do the updating in the field. Having said that, and considering that in Afghanistan there are really no front lines, everyone is in the field in some respect, I suspect the perceived need is actually very real. Employing a rugged laptop or notebook that actually has an excellent inherent GPS capability adds a layer of familiarity and comfort as well as necessity; consequently and for good reason, many of our warfighters feel strongly that they need a rugged laptop, so a search and subsequent blizzard testing commenced.
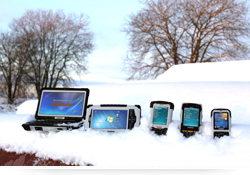
Handheld US produces several mil-spec rugged
devices. We have put many of them through
their paces over the last several years.
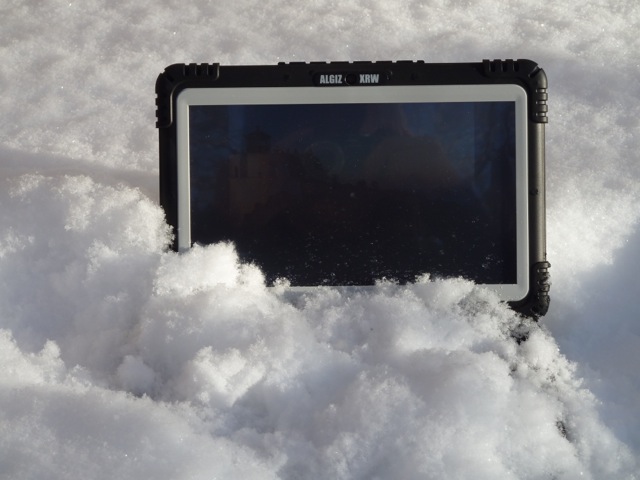
The Algiz XRW, henceforth referred to as the XRW, passed all the mil-spec tests with flying colors, but there was one test event that provided a result I have never before encountered — the first time I dropped the XRW into a snow bank from about five feet up, it hit a hidden rock and the keyboard popped off. I was surprised and a bit disappointed, until I realized this was a design feature, not a fault. The keyboard is connected via an electrical connection that does not alter the imperviousness of the laptop case, ensuring the XRW is immune to water and dust. I simply reinserted the keyboard; it popped back in place very easily, and it has been functioning perfectly ever since.
There really is a keyboard underneath all that snow and the XRW is running applications
as it gets cold soaked for further mil-spec testing.
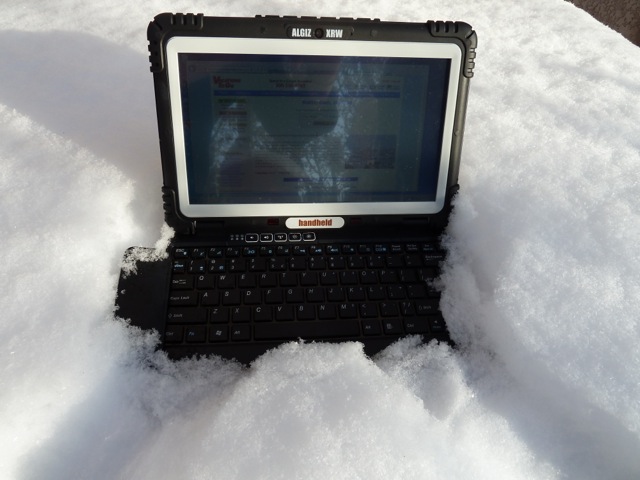
The XRW is truly a rugged laptop with a keyboard that can take everything you can throw at it. As you can see in several of the pictures, the keyboard is covered in fresh snow while I allowed the XRW to cold soak and repel moisture for over an hour with no ill effects. Everything still functions perfectly. And I must admit the XRW keyboard has a nice feel, almost as good as the Apple keyboard I use daily, and that from me is high praise indeed, as I freely admit that I am enamored with the touch and feel of Apple keyboards.
The XRW running applications while embedded in fresh Colorado snow. Note the leather
strap on the left side of the XRW that can be used as a handhold or as an attachment point
for a lanyard, a warfighter requirement.
The XRW is probably more correctly called an ultra-rugged notebook, but most notebooks don’t have touchscreen capabilities. Whether you choose to call it a laptop or notebook, it is extremely rugged. Its size and capabilities make it very well suited for use by warfighters and first responders, as you can see by reviewing the following specifications that include very stringent MIL-STD (military standard) specifications:
Algiz XRW Specifications
Size
260mm x 178 mm x 40 mm (10.2″ x 7.0″ x 1.6″)
Weight
1.5 kg (3.3 lb)
Environment
Operating: -20 °C to 55 °C (-4 °F to 131 °F) MIL-STD-810G, Method 501.5
Procedure II, MIL-STD-810G, Method 502.5, Procedure I, II, III
Storage: -40 °C to 55 °C (-40 °F to 131 °F) MIL-STD-810G, Method 501.5
Procedure II, MIL-STD-810G, Method 502.5, Procedure I, II, III
Drop: 26 drops from 1.22 m (4 ft) MIL-STD-810G, Method 516.6, Procedure IV
Vibration: MIL-STD-810G, Method 514.6 Procedures I & II, General minimum
At just over three pounds, the XRW is easy to hold and has a side strap with a leather Velcro cover that is easily adaptable to attaching to a warfighter via a lanyard. This allows the warfighter to instantly drop the XRW and bring his or her weapon to bear without ever worrying about the rugged notebook hitting the ground. I tested this scenario several times and the side strap held up well. The computer was no worse for wear, mainly because it is rugged and has a 64-GB solid-state drive — in other words, no moving parts. The lanyard and instant-drop capability is fast becoming a requirement or “must have” among our warfighters, and the XRW meets the requirement handily.
Another warfighter requirement, especially in the mountains of Afghanistan, is that the MaxView Technology 10.1-inch touchscreen be usable by a warfighter wearing gloves or using a stylus, a pencil eraser or a bare finger. The XRW’s touchscreen responds well to all these input devices. Therefore with the XRW, whatever comes to hand or the hand itself works for inputting data or selecting applications.
The screen is readable in all lighting conditions, including bright sunlight and sunlight reflected off snow, which can be blinding. Alternatively, the light level of the screen can be lowered to the point that it is only visible to those in a very small radius. The XRW also employs what I like to call a tactical “instant off” capability. Just touch one button and the screen doesn’t just fade-to-black — it goes black instantly, a handy and potentially life-saving feature for our warfighters.
GPS
The XRW’s GPS capabilities are best displayed using an onboard program named U-Center developed by ublox in Switzerland. The display provides more information than the average warfighter would ever want to know about their GPS position and the satellites responsible. A built-in data recorder and viewer can be automatically programmed to reconstruct GNSS environments displaying the number of satellites available by PRN (pseudorandom noise) codes, satellites used (in several graphical formats) and the PDOP or Positional Dilution of Precision (3D) and HDOP or Horizontal Dilution of Precision during any given moment.
The U-Center also displays velocity of the user or, more correctly, the XRW unit, altitude, time, date, coordinates, compass heading, whether you are in 2D or 3D mode, and the last time to first fix (TTFF) when the GPS capability was last initialized on the XRW. Your position and the sub-point position of the GPS satellites utilized is displayed on a global map for geospatial situational awareness. I used Google Maps indoors with the 3D function and the display was crisp and clear. The ublox GPS chipset is sensitive enough to use indoors, where on average I received seven satellites for 5-meter navigation data with the FAA’s (Federal Aviation Administration) WAAS (wide area augmentation system) enabled. EGNOS or the European Geostationary Navigation Overlay Service is also available. This is excellent performance for indoors.
Outdoors, there were always 10-12 satellites available, at 7000+ feet with an approximate 15-degree masking angle toward the Rocky Mountains. The XRW’s GPS accuracy was consistently below three meters and half the time better than two meters. Combine this with the 3G and Wi-Fi communications capabilities, and unless you are geocaching this is excellent performance and certainly acceptable for our warfighters and first responders. Note: I employed Skype using a military tactical headset with a small adapter and it worked flawlessly. With the headset attached, the very capable internal speakers are disengaged.
Philosophy
Try Skyping with the current MUE; no, don’t bother because it doesn’t work. Please note that when I question the status quo and indeed the legitimacy of the current MUE program for our warfighters, it is for good reason. The U.S. Army last year spent $450M on supplying our warfighters with decades-old proprietary equipment that has a user interface from the early ’70s. At the same time the Army is now instigating a program to provide warfighters with very capable Android phones, while setting up what can only be described as an Android apps store for military users, programmers and developers. The U.S. Air Force has several special programs in place that take advantage of the unique capabilities of the iPhone and iPad. The DoD and Services routinely support waivers for specialized GPS/PNT equipment that fills a requirements void. So while the military response to new technology can only be described as bipolar in nature, it is important that our warfighters and first responders have access to the best equipment available, hence the periodic equipment reviews in this column. The Algiz XRW is certainly a piece of equipment that fills one of the equipment voids for our warfighters and first responders.
eXtreme Road Warrior
The XRW or eXtreme Road Warrior performs all the functions of your normal office laptop running Windows 7 Ultimate. I found the screen to be clearly viewable from all angles, even when the unit was unfolded to an almost flat aspect, in all lighting conditions, and the touchscreen to be very intuitive. There were times when touching the screen to enable a function or application seemed much more intuitive than using a mouse. While I agree with Steve Jobs concerning the use of a stylus, that “once a stylus is required you have lost the battle,” in fact there are times with the XRW when the mouse works best, times the stylus works best, and then sometimes your digits are the best tools. The beauty of the XRW is that all three options work when enabled, and it makes using this great little machine very intuitive.
I put the Algiz XRW through the ringer for over two months, and this is another machine that is going to be tough to send back. Do you have any idea how much it costs to FedEx a package to Sweden?!
Bottom Line
The bottom line is the Algiz XRW is the perfect solution for those warfighters and first responders that need a rugged touchscreen netbook capable of doing double duty in the office and in the field.
As the folks in Lidköping, Sweden, home of the Algiz XRW would say, it is lagom.
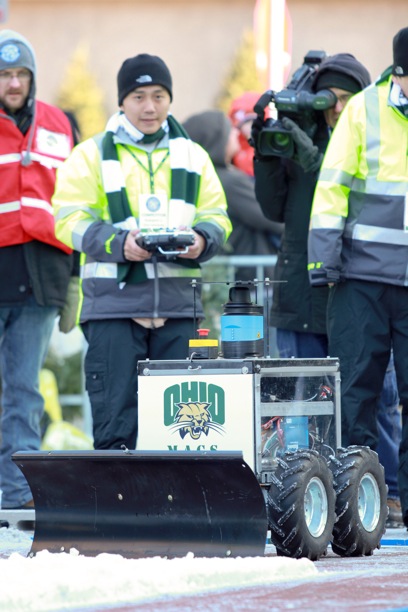
An Ohio University team won the Institute of Navigation (ION) Satellite Division’s second annual ION Autonomous Snowplow Competition. The competition was held January 26-29, at Rice Park in downtown Saint Paul, Minnesota, in conjunction with the 126th Saint Paul Winter Carnival.
Sponsored by The Institute of Navigation Satellite Division and held in cooperation with the ION North Star Section, the ION Annual Autonomous Snowplow Competition is a national event open to college and university students, as well as the general public, that challenges teams to design, build, and operate a fully autonomous snowplow using state of the art navigation and control technologies to rapidly, accurately and safely clear a designated path of snow.
Six teams participated during the four-day competition, each using unique vehicle design approaches.
Teams included students, partners from private industry and faculty advisors from Dunwoody College of Technology; Miami University (Ohio); Ohio University; The University of Michigan, Dearborn; and The University of Minnesota.
Teams were judged based upon their cumulative scores earned throughout the competition phases: 75% of the total score was based upon the plowing competition; and 25% of the total score was based upon the presentations and pre-event report.
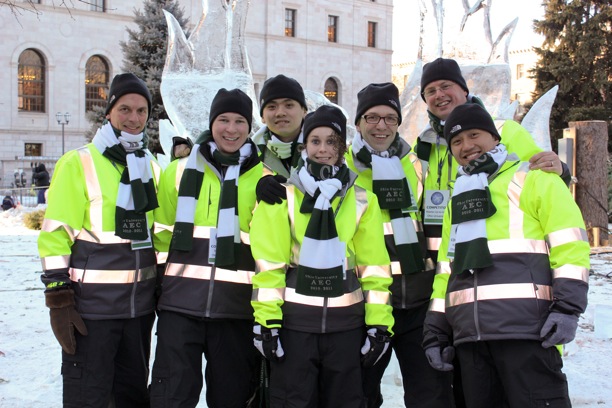
First place was awarded to Ohio University students Samantha Craig, Ryan Kollar, Kuangmin Li and Pengfei Duan with support from faculty advisors Frank van Graas, Woulter Pelgrum and Maarten Uijt de Haag. The first place prize included $3,000 and a golden snow globe trophy.
Second place was awarded to Miami University students Chad Sobota, Mark Carroll, Robert Cole, Mark Stratis, with support from student advisors Steve Taylor, Ryan Wolfarth and Harrison Bourne and faculty advisors Jade Morton, Peter Jamieson and Janet Burge. The second place prize included $2,000 and a silver snow globe trophy.
Third place was awarded to the University of Michigan (Dearborn) students Angelo Bertani, Zach DeGeorge, Mark Lawrence, Doris Kotori, Alf Williams, with support from student advisors Benjamin Craig, Jhonatan Ferrer, and faculty advisor Narasimhamurthi Natarajan. The third place prize included $1,000 and a bronze snow globe trophy.
In addition, the first place team, Ohio University, will be invited to display their winning snowplow during ION GNSS 2012 Conference September 17-21, 2012 in Nashville, Tennessee.
Sponsors of the second annual ION Autonomous Snowplow Competition included Lockheed Martin Corporation, ASTER Labs, Inc, Honeywell, Inc., Alliant Techsystems Inc., U.S. Bancorp, Hitching Post Motorsports, Space Exploration Technologies Corp., and The Toro Company.
The Third Annual ION Autonomous Snowplow Competition will be held in January 2013 at the Saint Paul Carnival, St. Paul, Minnesota.
The First Place team from Ohio University. Photo: Ohio University
By Jordan Britt, David Bevly, and Christopher Rose
Nearly half of all highway fatalities occur from unintended lane departures, which comprise approximately 20,000 deaths annually in the United States. Studies have shown great promise in reducing unintended lane departures by alerting the driver when they are drifting out of the lane. At the core of these systems is a lane detection method typically based around the use of a vision sensor, such as a lidar (light detection and ranging) or a camera, which attempts to detect the lane markings and determine the position of the vehicle in the lane. Lidar-based lane detection attempts to detect the lane markings based on an increase in reflectivity of the lane markings when compared to the road surface reflectivity. Cameras, however, attempt to detect lane markings by detecting the edges of the lane markings in the image. This project seeks to compare two different lane detection techniques-one using a lidar and the other using a camera. Specifically, this project will analyze the two sensors’ ability to detect lane markings in varying weather scenarios, assess which sensor is best suited for lane detection, and determine scenarios where a camera or a lidar is better suited so that some optimal blending of the two sensors can improve the estimate of the position of the vehicle over a single sensor.
Lidar-based lane detection
The specific lidar-based lane detection algorithm for this project is based on fitting an ideal lane model to actual road data, where the ideal lane model is updated with each lidar scan to reflect the current road conditions. Ideally, a lane takes on a profile similar to the 100-averaged lidar reflectivity scans seen in Figure 1 with the corresponding segment. Figure 1. Lidar reflectivity scan with corresponding lane markings.
Note that this profile has a relatively constant area bordered by peaks in the data, where the peaks represent the lane markings and the constant area represents the surface of the road. An ideal lane model is generated with each lidar scan to mimic this averaged data, where averaging the reflectivity directly in front of the vehicle generates the constant portion and increasing the average road surface reflectivity by 75 percent mimics the lane markings. This model is then stretched over a range of some minimum expected lane width to some maximum expected lane width, and the minimum RMSE between the ideal lane and the lidar data is assumed to be the area where the lane resides. For additional information on this method, see Britt, Rose & Levy, September 2011.
Camera-based lane detection
The camera-based method for this project was built in-house and uses line extraction techniques from the image to detect lane markings and calculate a lateral distance from a second-order polynomial model for the lane marking in image space. A threshold is chosen from the histogram of the image to compensate for differences in lighting, weather, or other non-ideal scenarios for extracting the lane markings. The thresholding operation converts the image into a binary image, which is followed by Canny edge detection. The Hough transform is then used to extract the lines from the image, fill in holes in the lane marking edges, and exclude erroneous edges. Using the slope of the lines, the lines are divided into left or right lane markings. Two criteria based on the assumption that the lane markings do not move significantly within the image from frame to frame are used to further exclude non-lane marking lines in the image. The first test checks that the slope of the line is within a threshold of the slope of the near region of the last frame’s second-order polynomial model. The second test uses boundary lines from the last frame’s second-order polynomial to exclude lines that are not near the current estimate of the polynomial. second-order polynomial interpolation is used on the selected lines’ midpoint and endpoints to determine the coefficients of the polynomial model, and a Kalman filter is used to filter the model to decrease the effect of erroneous polynomial coefficient estimates. Finally, the lateral distance is calculated using the polynomial model on the lowest measurable row of the image (for greater resolution) and a real-distance-to-pixel factor. For more information on this camera-based method, see Britt, et al.
Figure 2. Camera-based lane detection (green-detected lanes,blue-extracted lane lines, red-rejected lines).
Testing
Testing was performed at the NCAT (National Center for Asphalt Technology) in Opelika, Alabama, as seen in Figure 3. This test track is very representative of highway driving and consists of two lanes bordered by solid lane markings and divided by dashed lane markings. The 1.7-mile track is divided into 200-foot segments of differing types of asphalt with some areas of missing lane markings and other areas where the lanes are additionally divided by patches of different types and colors of asphalt.
Figure 3. NCAT Test Facility in Opelika, Alabama.
A precision survey of each lane marking of the test track as well as precise vehicle positions using RTK GPS were used in order to have a highly accurate measurement of the ability of the lidar and camera to determine the position of the vehicle in the lane. Testing occurred only on the straights, and the performance was analyzed on the ability of the lidar and camera to determine the position of the lane using metrics of mean absolute error (MAE), mean square error (MSE), standard deviation of error (σerror), and detection rate. The specific scenarios analyzed included varying speeds, varying lighting conditions (noon and dusk/ dawn), rain, and oncoming traffic. Table 1 summarizes the results for these scenarios. For additional results, please see [8].
Scenario
MAE(m)
MSE(m)
σerror (m)
%Det
Lidar
Noon Weaving
0.1818
0.1108
0.3076
98
Camera
Noon Weaving
0.1077
0.0511
0.2246
80
Lidar
Dusk 45mph
0.0967
0.0176
0.1245
100
Camera
Dusk 45mph
0.2021
0.0592
0.2433
57
Lidar
Medium Rain
0.1046
0.0177
0.1314
65
Camera
Medium Rain
0.0885
0.0101
0.0635
91
Lidar
Low Beam, Night
0.0966
0.0159
0.1215
99
Camera
Low Beam, Night
0.1182
0.0185
0.0762
84
Table 1. Lidar and camera results for various environments.
Additional testing on the effects of oncoming traffic at night was examined by parking a vehicle on the test track at a known location with the headlights on. Figure 4 shows the lateral error with respect to closing distance where a positive closing distance indicates driving at the parked vehicle, and a negative closing distance indicates driving away from the vehicle. Note that the camera does not report a solution at -200 m, which is due to track conditions and not the parked vehicle.
Figure 4. Error vs. Closing Distance.
Based on these findings it would appear that the camera provided slightly more accurate measurements than the lidar while having a decrease in detection rate. Additionally the camera performed well in the rain where the lidar experienced decreased detection rates.
References
Frank S. Barickman. Lane departure warning system research and test development. Transportation Research Center Inc., (07-0495), 2007.
J. Kibbel, W. Justus, and K. Furstenberg. using multilayer laserscanner. In Proc. Lane estimation and departure warning Proc. IEEE Intelligent Transportation Systems, pages 607 611, September 13 15, 2005.
P. Lindner, E. Richter, G. Wanielik, K. Takagi, and A. Isogai. Multi-channel lidar processing for lane detection and estimation. In Proc. 12th International IEEE Conference on Intelligent Transportation Systems ITSC ’09, pages 1 6, October 4 7, 2009.
K. Dietmayer, N. Kämpchen, K. Fürstenberg, J. Kibbel, W. Justus, and R. Schulz. Advanced Microsystems for Automotive Applications 2005. Heidelberg, 2005.
C. R. Jung and C. R. Kelber, “A lane departure warning system based on a linear-parabolic lane model,” in Proc. IEEE Intelligent Vehicles Symp, 2004, pp. 891–895.
C. Jung and C. Kelber, “A lane departure warning system using lateral offset with uncalibrated camera,” in Intelligent Transportation Systems, 2005. Proceedings. 2005 IEEE, sept. 2005, pp. 102 – 107.
A. Takahashi and Y. Ninomiya, “Model-based lane recognition,” in Proc. IEEE Intelligent Vehicles Symp., 1996, pp. 201–206.
Jordan Britt, C. Rose, & D. Bevly, “A Comparative Study of Lidar and Camera-based Lane Departure Warning Systems,” Proceedings of ION GNSS 2011, Portland, OR, September 2011.
Mobility’s first phase saw fixed-line communications go mobile. The next phase saw the Internet go mobile. We now behold a paradigm shift in the third phase, where real world communication bridges to the virtual world, via richer communications on smartphones.
For device manufacturers and location-aware service and app creators, it’s no longer about creating unique standalone experiences, it’s about enhancing real-time experiences by enriching everyday consumer behavior with virtual content and relevant information to a particular place and point in time. Location is an important canvas to a series of components that will unlock the possibilities of a more fulfilling, spontaneous — and sometimes amazing — mobile experience. By bringing together the quality of positioning and maps, enabling personalization with places and recommendations, evolving the simple check-in, and enhancing the experience with augmented reality, we activate a seamless, immersive experience that adds value to consumers’ daily life adventures.
Most importantly for wireless operators, location, as a key part of context and relevance, provides a unique opportunity to create revenue.
Location Positioning and Maps
As we create advanced mobile positioning technologies, consumers increasingly become accustomed to location-aware services. Outdoor positioning was our entrée into the market, and it has becoming more and more accurate via new satellite systems in addition to GPS (GLONASS, SBAS, QZSS), use of motion sensors, assisted-GNSS enhancements, and software algorithms to enable instant time to first fix (TTFF), and seamless fixes. On the other hand, pinpointing your location indoors still presents challenges from an accuracy standpoint.
At Nokia, we support Open Mobile Alliance Secure User Plane Location (OMA SUPL, incorporating AGPS and cell-ID) standards for our devices, and enhance our proprietary Nokia Positioning Service (NPS) based on leading-edge assisted-GNSS (GPS+GLONASS) technologies. Our NPS service supports global crowd-sourced databases for cellular tower and Wi-Fi access-point location information. These provide virtually instant TTFF everywhere and enable always-on location awareness — even on devices without an integrated GPS receiver or data connectivity.
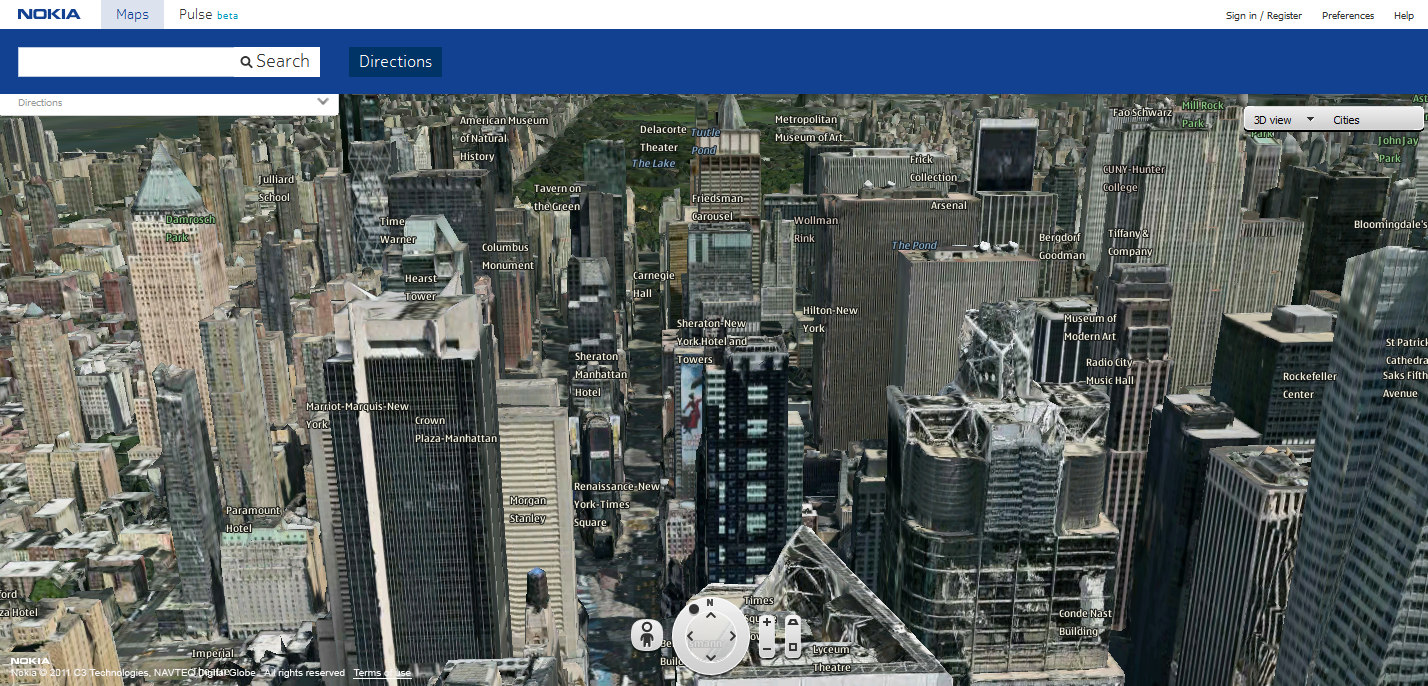
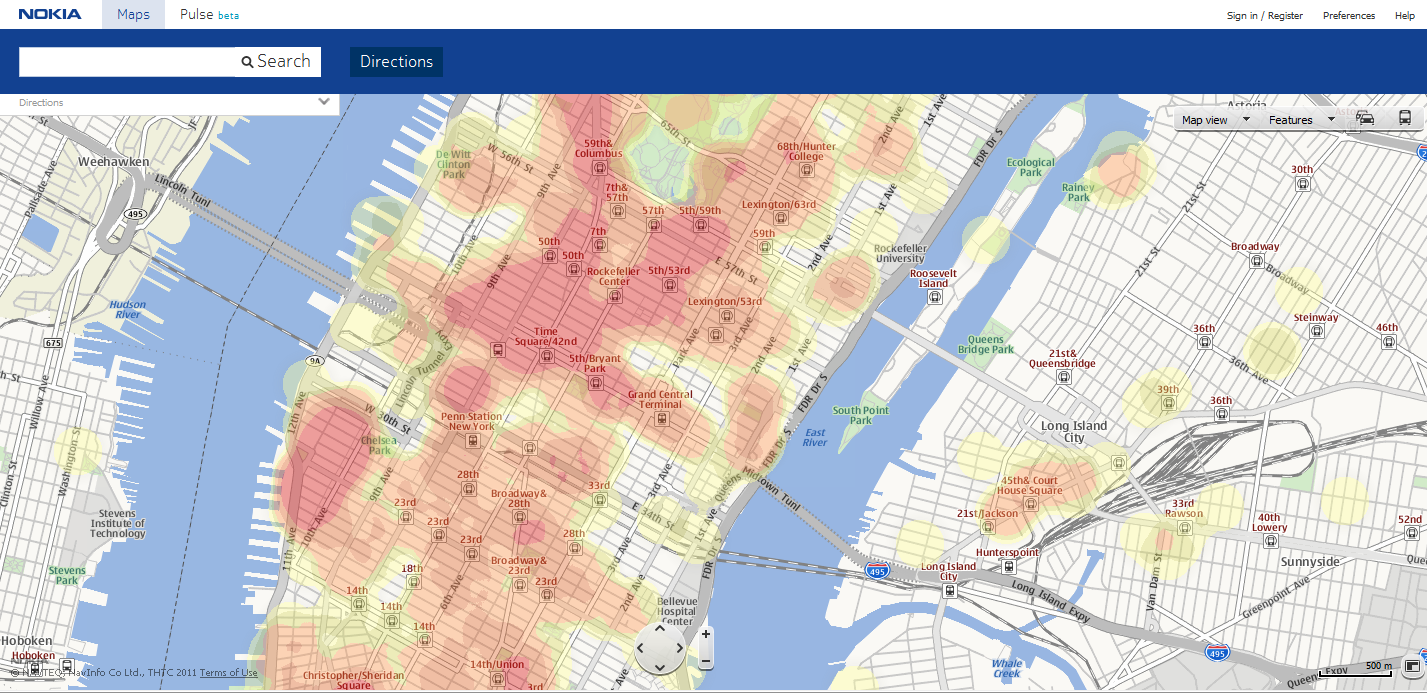
3-D Building overlay for real-world representation.Heat map. to see where the action is: concentrations of location-enabled mobile phone users that can provide data on places where others are dining, dancing, or shopping.
We’re also setting our sights on the next frontier: research concept around high accuracy indoor positioning (HAIP) technologies. Nokia’s current HAIP trial system relies on a dedicated positioning beacon, which acts as an indoor satellite when placed on the ceiling. It can accurately locate your position in a room and how far you are from your desired destination in real-time, with an accuracy of up to 30 centimeters. In this manner, we could direct a potential customer to a physical store front, and further to a specific product on the shelf inside the store.
HAIP beacon from Nokia, for high-accuracy indoor positioning.
Another example comes from Shopkick, with its own proprietary solution for indoor positioning that utilizes a similar beacon placed inside a retail store. On the device side, the ShopKick app listens via the mobile device microphone and alerts a company when a valued customer physically walks into its store. According to TechCrunch, one of Shopkick’s partner retailers “is estimating $50 million in measurable incremental revenue as a result of the Shopkick mobile app.”
The business opportunity is clear: retailers can now directly connect to the consumer for one-to-one marketing and engagement. Consumers are rewarded instantly, on the spot, and enticed to collect further rewards through loyalty programs.
Imagine enhancing this experience further with a visual representation of your position on a map in an outdoor situation, which can offer a wealth of functionality and create a 3D representation of the real world. At Nokia we are further enhancing our NavTeq maps that deliver accurate 360-degree panoramic street-level imagery, 3D building overlays and a point-of-interest (referred to as a place in this article) interface as individual layers. The map data collection provides individual high-density content layers that enable more fluid animation and 3D mesh building overlays. Users can highlight and select buildings and places to interact with in 3D within their surroundings. This merges the real and virtual world, allowing physical and digital objects to co-exist and interact in real time. Imagine the endless opportunities: zoom in on a 3D map of a restaurant storefront, click the menu on the window to see the special of the day, or receive a discounted offer based on something you have liked in the past.
Places and Recommendations
The way we interact with our mobile device is evolving to mimic the way we exist in the real world. When we refer to a place or to a location, for example, we don’t talk in terms of coordinates or an address, rather we say “the Starbucks around the corner from MOMA.” In building devices and applications, we build the place with the foundation of core data (name, address, longitude and latitude, contact details) and layer on top of that an ever-expanding amount of rich data that comprises ratings and reviews, hours of operation, wheelchair access and spatial data extended to entrances, and more. Thus, we begin to layer in context and we no longer need to know the Boolean constructs that we learned in Web 1.0 to talk to a search engine and find exactly what we want.
Managing this rich, evolving set of place data in a relevant manner will increase in importance. It will also open the door to getting recommendations outside of your normal social community. For example, heat maps that allow you to instantly see where the action is in cities around the world, quickly sharing insight into where locals eat, dance, and shop. Check out examples from Nokia (maps.nokia.com) and mobile apps like AroundMe or Foursquare Radar. Providing locally relevant content to end users also extends the opportunity to connect local merchants to their specific target audience or entice new ones.
JiWire reported in August that “53 percent of the on-the-go U.S. audience revealed they are willing to share their location to receive more relevant content. Mobile consumers under the age of 34 are more eager to share, with 60 percent offering their location for better information.” Focusing on the qualifier, “offering their location for better information,” is where places and recommendations become a powerful medium, and advertisements and offers become another valuable piece of the rich data set offered via your mobile device.
Consider a restaurant search that returns a result for a Chinese restaurant your friend has rated 5 stars for its Mongolian beef, which in the past, you have indicated you liked. As part of the information presented, you see a 15-percent off promotion when you view the menu prices. Or perhaps you’ve searched for a children’s museum, and navigation finds the destination and starts directing you from your current location. Upon arrival, you might receive an offer for discounted membership. As more consumers gravitate towards location-based or location-incorporating services on their smartphones, there’s a great opportunity for developers and business owners to integrate place and recommendation experiences.
Consumer Engagement
Utilizing positioning, maps, places and recommendations are the building blocks on which you can create contextually relevant experiences that consumers will find engaging and sticky and which can open the door to business opportunities. Research shows that consumers are willing to check-in to a location, either by text messaging or by using a mobile application on a smartphone; the application will use the phone’s GPS to find the current location. Many social networking services, such as Foursquare, Google+, Facebook, and Gowalla allow users to check in to a physical place and share their location with their friends. Comscore reported that “16.7 million U.S. mobile subscribers used location-based check-in services on their phones in March 2011, representing 7.1 percent of the entire mobile population.”
I still believe check-in remains a niche as it’s not a natural human behavior but is a good starting point for interacting with a location. Check-in needs to be bundled with offer redemption to encourage people to check-in. Also, check-in data can add a new layer of behavior that may not be reflected in recent purchases. For example, a check-in at a gym adds valuable lifestyle information about a consumer, which can aid in ad-targeting efforts.
Now more than ever, as we explore and engage with the world around us, we want to experience amazing everyday adventures. We can enhance this adventure further by augmenting the rich content associated with places in a visual representation that can be consumed through your mobile device in the real world. Imagine you’re in Times Square in Manhattan and you open an augmented-reality experience like Nokia City Lens or Yelp’s Monocle and start panning around you. Icons might pop up to indicate you have a loyalty card for a particular chain of coffee shop; a consumer electronics store has your favorite Wii game on sale; a good friend just gave a nearby restaurant a 5-star review. Perhaps you’ll even find you can get home in less than half an hour if you take a new suggested route that accounts for traffic that’s moving a little slower than usual on your typical drive.
The Opportunity Ahead
In this third phase of mobility, our mobile devices will be a bridge to enriching our lives with virtual content, as long as it is relevant and engaging. Location is a catalyst to enhance virtual interaction with real-world places, enticing people to visit such real-world places. For developers and marketers, business opportunities lie in using highly accurate positioning to drive consumers into storefronts and directly to the products they want; in enabling highly personalized experiences with places that present the right offer at the right time to the right consumer; and in elevating the check-in to engage and reward the consumer. Context, relevance, and consumer engagement will all provide unique monetization opportunities as location technology continues to evolve.
Christopher Peralta is head of location and advertising services for Nokia in North America, responsible for mobile navigation and location-aware services that connect users to locally and socially relevant personalized content and experiences.
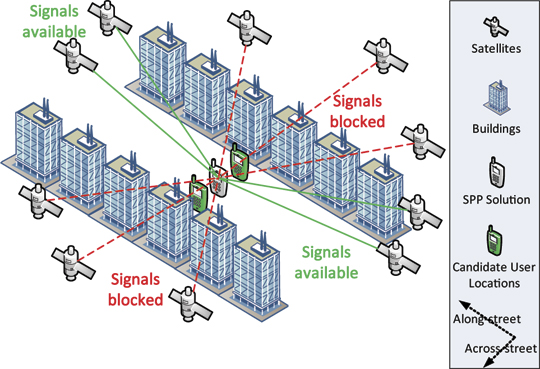
Shadow matching. The two GNSS mobile phones beside the middle one show additional possible user positions referenced by the along-street component of the standard point positioning (SPP) solution.
By Paul D. Groves, Lei Wang, and Marek K. Ziebart
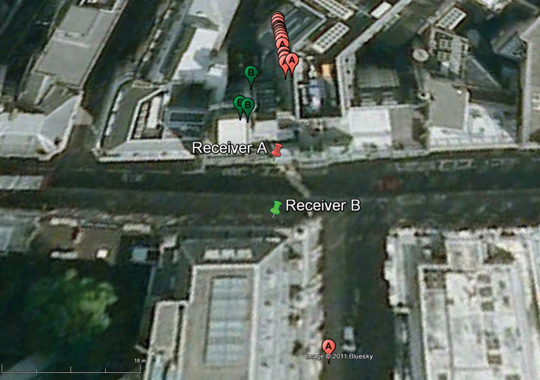
GNSS positioning in dense urban areas is unreliable, with accuracy particularly poor in the cross-street direction. One solution is shadow matching, a new positioning technique that uses 3D building models to predict which satellites are visible from different locations and compares this with the measured satellite visibility to determine position. This article presents test results of a preliminary shadow-matching algorithm in a London urban canyon and discusses the practical implementation of the technique
Poor GNSS positioning accuracy is common in urban canyons where tall buildings block the direct line-of-sight (LOS) signals from many, sometimes most, of the satellites, effectively casting GNSS shadows over the adjacent terrain. Without direct signals from four or more satellites, an accurate position solution cannot be determined. Sometimes, a degraded position solution can be obtained by using signals that can only be received by reflection off a building, known as non-line-of-sight (NLOS) signals.
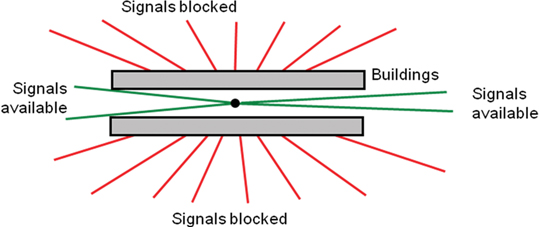
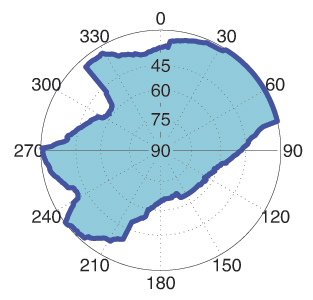
Using GLONASS in addition to GPS considerably enhances direct signal availability, and the ongoing deployment of Galileo and Compass will enhance it further. However, an urban canyon affects the geometry of the available GNSS signals as well as their number. Signals with lines of sight going across the street are much more likely to be blocked by buildings than signals with lines of sight going along the street (see Figure 1). As a result, the signal geometry, and hence the positioning accuracy, will be much better along the direction of the street than across the street. For example, for a building-height-to-street-width ratio of three and direct signals from four GNSS constellations, the cross-street position uncertainty can exceed 20 meters, while the along-street uncertainty is within 5 meters.
Figure 1. Signal geometry of GNSS satellites in an urban canyon (aerial perspective).
This level of accuracy is good enough for some applications but not others. Knowing which side of the street a pedestrian on is useful for visitor guidance and location-based advertising, while it is critical for guiding the blind and visually impaired and for augmented-reality applications. Similarly, lane-level positioning is important for advanced intelligent transportation systems that can direct individual vehicles in order to maximize traffic flow and prioritize emergency vehicles.
Improving GNSS positioning in urban canyons requires lateral thinking. If it’s not possible to calculate a sufficiently accurate position solution using the visible satellites, why not use the nonvisible satellites as well? This is exactly what shadow matching does. If you know where the buildings are and how big they are, you can deduce positional information from the knowledge that certain signals are blocked.
This requires a 3D model of a city’s buildings. These are becoming more accurate and widely available and have already been used to predict GNSS signal availability and multipath interference.
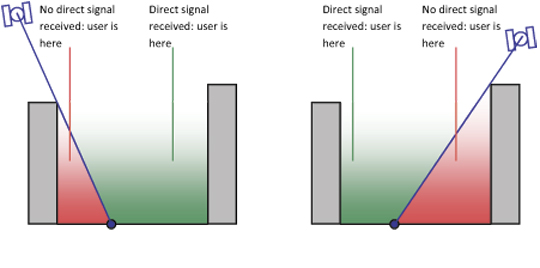
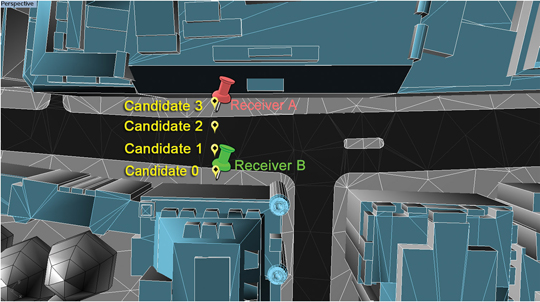
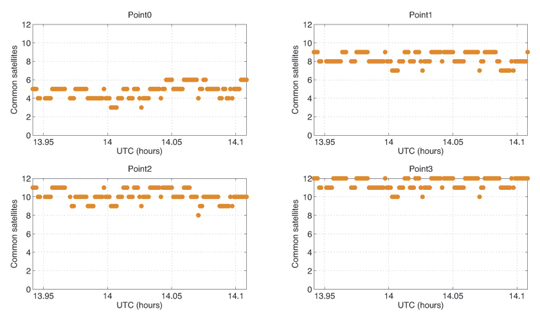
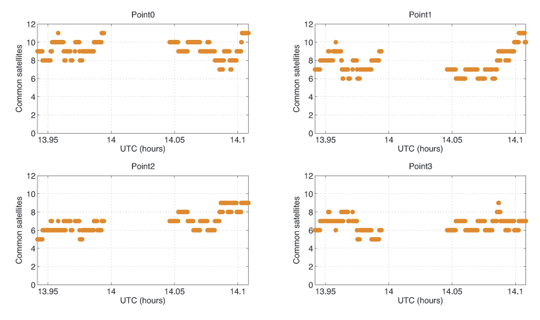
The principle of shadow matching is simple. Due to obstruction by buildings in urban canyons, signals from many GNSS satellites will be receivable in some parts of a street, but not others. Where each direct signal is receivable can be predicted using a 3D city model. Consequently, by determining whether a direct signal is being received from a given satellite, the user can localize their position to within one of two areas of the street. Figure 2 illustrates this. By considering other satellites, the position solution may be refined further, producing a much more accurate cross-street position solution than available from conventional GNSS positioning in this environment. Thus the observed signal shadowing is matched with the predicted shadowing to determine position.
Figure 2. The shadow-matching concept: using direct signal reception to localize position.
This concept of shadow matching, has been proven by mathematical modeling. Satellite visibility predictions using a 3D city model of London have been validated with real-world observation, demonstrating the practical potential of shadow matching. Here, shadow matching is brought from proof of concept one step further to practical demonstration. A preliminary but complete implementation of shadow matching has been developed and tested in London using real-world GPS and GLONASS measurements. The algorithm is described first, followed by the test results. We then discuss dealing with different types of signal propagation that occur in urban areas. and how to implement shadow matching in real time on a platform such as a smartphone.
Shadow-Matching Algorithm
A basic shadow matching algorithm may be broken down into four steps:
Perform standard point positioning (SPP) using GNSS pseudo-ranges to obtain an approximate user position.
Define the search area for the shadow-matching position solution, generating a set of possible user positions close to the approximate position solution.
Predict satellite visibility at each candidate position using the 3D city model.
Evaluate the similarity between predicted and observed satellite visibility at each position. The candidate position with the best match is deemed to be the shadow-matching solution. This process can be conducted epoch by epoch, so the GNSS user can be either static or dynamic.
Conventional Positioning. In the first step, SPP using GNSS pseudo-ranges is conducted to acquire an initial user position. In an urban environment, the accuracy will often be poor, partly due to contamination by NLOS signals. Consistency checking may be used to identify the NLOS signals and, where possible, remove them from the position solution.
Candidate Position Determination. As discussed earlier, signal geometry and hence positioning accuracy will be much better along the direction of the street than across the street. Therefore, in this preliminary shadow-matching algorithm, the along-street component of SPP solution is used as a reference to generate a set of possible user positions that vary in across-street direction only (shown by the two mobile phones beside the SPP solution on the opening page of this article).
A more advanced shadow-matching algorithm would also consider candidate positions in the along-street direction and would vary the size of its search area based on an assessment of the quality of the SPP solution. The smaller the search area, the more efficient the shadow-matching algorithm will be. However, the search area must be large enough to contain the true position. Further research is needed to determine the optimum search area.
Satellite Visibility Prediction. At each candidate position, the two-step building boundary method predicts satellite visibility from the 3D city model. First, a building boundary from a GNSS user’s perspective is determined for each azimuth (from 0 to 360°) as a series of elevation angles. The results from this step show where the building boundaries are located within an azimuth-elevation sky plot. Figure 3 shows an example of a building boundary computed from a possible user location. Once the building boundary has been computed, it may be stored and reused.
Figure 3. Example of a building boundary as azimuth-elevation pairs in a sky plot. (The centre of the plot correspond to a 90º elevation or normal incidence).
Next, each satellite elevation is compared with the building boundary elevation at the same azimuth. The satellite is predicted to be visible if it is above the building boundary. If the satellite is just within the building boundary, a potentially diffracted signal can be predicted. However, this feature was not included in the preliminary shadow-matching algorithm described here. A software toolkit for determining satellite visibility was developed in C++.
Figure 4 shows the relationships between its processes.
Figure 4. The process of satellite visibility prediction. (Click to enlarge.)
The building boundary approach is efficient where a great number of satellite visibility tests are performed at the same location. For real-time visibility determination, building boundaries may be pre-computed over a grid of possible user locations and stored. However, there is an alternative. Instead of computing building boundaries, each satellite LOS can be directly compared with the city model to determine if it is blocked by buildings. This single LOS method is more efficient overall where only a few satellite visibility tests are performed at a given location. However, for real-time, it imposes a much higher processing load than using pre-computed building boundaries.
In practice, either method may be employed, depending on the situation. For real-time shadow matching, the trade-off is between a higher processing load for the single LOS method and greater data storage for the building boundary method. For non-real-time visibility determination, the trade-off depends on the number of tests required at each location.
Matching Prediction and Observation. The final step, evaluating the similarity between predicted and observed satellite visibility at each position and identifying the best match as the shadow matching solution, comprises three functions: satellite matching, position scoring, and position comparison.
Satellite matching determines for each satellite the degree of similarity between the predicted satellite visibility and the real observation. Figure 5 shows the simple satellite matching function deployed for this study. For each satellite above a pre-set elevation mask angle, if the prediction agrees with the observation, the score is one; otherwise, the score is zero.
Figure 5. Scoring matrix giving the score for each satellite in shadow matching.
Future research will be conducted to extend the matching function so that different scores are produced for signals predicted to be in the diffraction region and signals observed with low and medium signal-to-noise levels.
Position scoring evaluates the overall degree of match between predicted and observed satellite visibility for each possible user position, summing up the satellite matching scores for each candidate position to give a position score.
Finally, position comparison selects the candidate position with the highest overall score and outputs this as the position solution. However, sometimes there is more than one candidate. Further research is needed to find the optimum way of determining a positioning solution with associated error bounds from a grid of shadow-matching scores.
Figure 6 summarizes the shadow-matching process.
Figure 6. The shadow matching process. Blue denotes input data, red denotes main process steps, and white denotes intermediate or final results. (Click to enlarge.)
Experimental Verification
We used a 3D city model of the Aldgate area of central London to test shadow matching. The model has a high level of detail and decimeter-level accuracy.
The software toolkit developed for this study stores and processes 3D city model data using Virtual Reality Modeling Language (VRML), an international standard format. Model data in other formats can be transformed to VRML. Buildings in VRML format are represented by structures, which in turn comprise polygons (normally triangle meshes).
Methodology. Experimental data were collected in a highly built-up area in central London, using two multi-constellation survey-grade GNSS receivers, logging 1 Hz data simultaneously (note that shadow matching does not require two receivers). As shown in Figure 7, they were set up on the north and south sidewalks of Fenchurch Street.
Figure 7. True position of receivers against conventional standard point positioning (SPP) solution. Pins show the true positions and bubbles the SPP solutions; the numbers and colors indicate the receiver.
For the first step of shadow matching, software was used to conduct SPP processing using GPS and GLONASS signals. Only L1 pseudo-ranges were used to acquire an initial user position. It can be seen in Figure 7 that the conventional SPP solutions have significant offsets from the true positions (16–31meters for receiver A and 18–24 meters for receiver B). As receiver B suffers more signal blockage from buildings, it has fewer epochs with four or more satellites in view, so fewer successful SPP GNSS solutions were obtained. Although they have significant offsets in the across-street direction, they are consistent and agree much more with the receivers’ true positions in the along-street direction. This result verifies the assumption made in the shadow-matching algorithm that the accuracy of the along-street SPP positioning solution is much better than in the across-street direction.
Four candidate user positions were selected using the common along-street position of the conventional SPP solution. They are distributed across the sidewalks and vehicle lanes, on both sides of the street. Figure 8 illustrates this. Note that candidate 3 is the true position of receiver A and candidate 0 is the true position of receiver B.
Figure 8. Candidate user positions (in yellow) and true receiver positions (in red and green) in the shadow matching experimental verification.
Satellite visibility was predicted individually for each of the four positions. Then each was compared with the real data observed from the two GNSS receivers. Figure 8 shows part of the architectural city model of London used to predict the satellite visibility.
Results. The experimental results are shown in three stages: the satellite visibility comparison between prediction and observation, the candidate position scoring function, and the success rate for each candidate location. The primary success criterion is whether the algorithm is able to determine the correct side of the street. A secondary aim is to test whether the algorithm can distinguish between the sidewalk and vehicle lane on the same side of the street.
To show the degree of agreement or disagreement between the predicted and observed satellite visibilities, time series for each of the four candidate positions are compared with each of the two receivers’ experimental data. The results are shown in eight graphs. Figure 9 compares data from receiver A for each of four possible user locations. Figure 10 shows the same comparison for receiver B. The time window was from 13:56:30 to 14:06:30 (UTC). G denotes GPS satellites and R refers to GLONASS satellites.
In Figure 9, the green and blue dots indicate an agreement between prediction and observation for the candidate user position, while the orange and red colors represent their disagreement. Thus, a larger number of cases of green and blue indicate a better match between the candidate user location and the observations. Therefore, such a candidate is more likely to be close to the receiver’s true position.
Figures 9 and 10 clearly show that the closer the candidate position is to the true position, the greater the agreement between predictions and observations.
Figure 9. Comparison of satellite visibility between receiver A and candidate user locations (candidate user point 3 is the true position). (Click to enlarge.)Figure 10. Comparison of satellite visibility between receiver B and candidate user locations (candidate user point 0 is the true position). (Click to enlarge.)
Even at the correct candidate location, there is not complete agreement between the observations and predictions. A number of signals were observed but not predicted. These had signal-to-noise levels 8 dB or more lower than the predicted signals and are most likely due to reflection and/or diffraction.
However, shadow matching does not require complete agreement in order to work. In this test, no signals were predicted but not observed at the correct location.
To complete shadow matching, we evaluate each candidate position by summing up the number of satellites common to both the predictions and real observations. Figure 11 and Figure 12 show the results of the summation for receivers A and B, respectively.
Figure 11. Evaluation of similarity — number of common satellites in view between each candidate user point and receiver A.Figure 12. Evaluation of similarity — number of common satellites in view between each candidate user point and receiver B.
It is clear from Figure 11 that among four possible user positions, point 3 is the one with the highest agreement score with the observations from receiver A. As shown in the right-bottom graph, for about half the epochs, visibility predictions for all 12 satellites above the masking angle match the real observations.
As shown in Figure 12, for receiver B, the time series of the agreement score is generally better at the true location (Point 0) than at other points. However, the level of agreement between predictions and observations is not as good as at receiver A‘s location.
To judge the performance of shadow matching, the selection rate of each of the four candidate user positions for each of the two receivers was computed by dividing the number of times that position was selected by shadow matching by the number of epochs. Where the same score was attained for two or more positions, each position was considered partially selected. For example, if two positions have the same score, then each of them is considered half-selected.
The selection rate results are shown in Figure 13. For receiver A, the shadow matching algorithm correctly indicated the true position among the four candidates 100 percent of the time. This means the algorithm successfully distinguished between the two sides of the street, and further distinguished between a user on the sidewalk and a user in the vehicle lane. For receiver B, the algorithm identified the correct side of the street (Points 0 and 1) 94.65 percent of the time, and the correct location among the four candidates in 81.29 percent of the epochs evaluated.
Taking the average of the two test sites, the correct side of the street was identified 97.3 percent of the time and the correct position from the four candidates 90.6 percent of the time.
Figure 13. Candidate position selection rate for receiver A (left) and receiver B (right).
Practical Implementation
The basic shadow-matching algorithm operates under the assumption that GNSS signals are either directly visible or blocked by a building. However, in reality, signals can also be received via indirect paths due to reflection or diffraction. This was observed at both locations during the tests. As shadow matching seeks the position with the best match, rather than looking for a perfect match, it can tolerate a certain number of these signals and still identify the correct position.
These tests were performed using survey-grade user equipment with a relatively high tracking threshold, so the weakest signals are not observed. Furthermore, the antenna has strong polarization discrimination so exhibits a low gain for reflected signals. However, for shadow matching to be practical, it should also work on a smartphone, which typically combines a high-sensitivity receiver with a linearly polarized antenna, which does not distinguish between direct and reflected signals. Consequently, a smartphone receiver is likely to observe more reflected and diffracted signals.
NLOS reflected and diffracted signals are weaker than directly-received signals, so the shadow-matching algorithm could be modified such that only signals received above a certain signal-to-noise threshold are classified as observed. However, this would introduce a new problem: signals received via a direct LOS path but attenuated by a person’s body would be classified as not observed, even though they would be predicted to be visible at the correct location. The same problem would occur where the LOS coincides with a direction in which the antenna is weak. Consequently, to get the best performance from shadow matching, several different categories of observed signal should be considered in the scoring matrix.
Diffraction occurs when the LOS is just inside the building boundary. Therefore, the 3D city model can be used to predict when a diffracted signal may be received. However, it cannot easily be used to predict the signal-to-noise level of that signal because diffraction patterns are complex. Therefore, shadow matching can potentially be improved by adding a third prediction category for diffraction. Figure 14 shows a posssible optimized scoring matrix with values between 0 and 1 for the new categories to be determined empirically, possibly as functions of the measured signal-to-noise. Different scoring matrices may be suited to pedestrian and vehicle applications and to different user equipment designs.
Directly-received signals are also affected by multipath interference. However, this will not normally impact shadow matching as it does not affect whether a signal is received or not.
Shadow matching has been demonstrated using both GPS and GLONASS measurements. The more signals available for shadow matching, the better the expected accuracy and reliability. Thus, the addition of Galileo, Compass, and regional systems, including SBAS, should improve performance. However, further research is needed to determine whether shadow matching using GPS alone is viable. Combining data from multiple epochs should also improve shadow matching performance, particularly where the user is moving.
A practical shadow-matching algorithm must be implementable in real time on a mobile device. Three models maybe considered.
A network-based solution, whereby GNSS measurements are transmitted to a server, which stores the building boundary data, computes a solution and then sends it to the user.
A handset-based solution, where the shadow-matching algorithm is run on the handset, which also stores the building boundary data.
A hybrid model, whereby the shadow-matching algorithm runs on the handset, but the building boundary data is streamed from a server as and when required.
Using stored or streamed building boundaries, fewer than fifty comparison and addition operations are required to calculate an overall shadow-matching score for one candidate position with two GNSS constellations. Therefore, shadow matching may be performed in real time on a mobile device with several hundred candidate positions, where necessary.
Without any data compression, about 300 bytes are required to store a building boundary with a 1° resolution. If a 2×2 meter grid spacing is used for the candidate positions, a 1-kilometer long, 20-meter wide street will contain 5000 grid points, requiring 1.5 MB of data storage. By exploiting the similarities both between neighboring azimuths in the same building boundary and between building boundaries at neighboring grid points, substantial data compression should be achievable; possibly up to a factor of ten.
Therefore, a standard 4 GB flash drive could store building boundary data for 2,500–25,000 kilometers of road network. For comparison, the Greater London metropolitan area contains about 15,000 km of road. However, as shadow matching is only useful in streets where conventional GNSS positioning is poor, the database need only contain building boundary data for these streets, maybe 10 percent of the total. Therefore, it should be practical to preload a mobile device with shadow-matching data for several cities, which could be kept up-to-date via the internet.
An alternative model is to download the building boundary data from a network server as required. A conventional GNSS position solution or Wi-Fi fix should be able to localize position to within 1,000 grid points, requiring 30–300 kB of building boundary data to be downloaded in order to perform shadow matching. This takes less than two seconds using a 3G mobile phone connection with an average data rate.
In practice, shadow matching, would be implemented as part of a wider intelligent urban positioning system. This shadow-matching algorithm assumes that the user is outdoors. Indoor operation, if viable, would require a different approach. It is necessary to determine the error bounds of the conventional GNSS position solution, not only to determine the search area for shadow matching, but decide whether shadow matching should be performed at all. For example, in a completely open-sky environment, shadow matching will fail, but a good position solution will be obtainable conventionally.
There are other ways in which 3D city models could be used to improve GNSS positioning. For example, they could aid identification of NLOS and multipath-contaminated signals and, in principle, even correction of NLOS ranging measurements. Intelligent urban positioning can also incorporate additional sensors, such as odometers on cars and cell phone signals, WiFi and inertial sensors for pedestrian users.
Next Steps
Three potential future lines of research stem from this work: improving the initialization from conventional GNSS positioning, improving of satellite visibility predictions with ambiguous observations, and optimizing the position determination from the shadow-matching scores. In addition, performance will be evaluated over a wider range of environments.
Acknowledgments
The authors gratefully acknowledge Kimon Voutsis for his support with the experiments. This work has been jointly funded by the University College London Engineering Faculty Scholarship Scheme and the Chinese Scholarship Council. This article is based on a paper presented at the 2011 European Navigation Conference in London, organized by the Royal Institute of Navigation.
Manufacturers
The tests used two Leica Viva GS15 GNSS receivers. Leica Geo-office software performed SPP processing of GPS and GLONASS signals. ZMapping Ltd. supplied the London 3D model.
Paul Groves is a member of the academic faculty at University College London (UCL), where he leads the Space Geodesy and Navigation Laboratory’s program of research on robust navigation and positioning. He is also author of the book Principles of GNSS, Inertial, and Multisensor Integrated Navigation Systems.
Lei Wang is a Ph.D. student at UCL. He received a Bachelor’s degree in geodesy and geomatics from Wuhan University in 2010. His current research interests are GNSS-based positioning techniques for urban canyons.
Marek Ziebart is professor of space geodesy, director of the Space Geodesy and Navigation Laboratory, and vice dean for research of UCL Engineering.