Speaking at the National Press Club on Nov. 3, Federal Communications Commission (FCC) Chair Jessica Rosenworcel announced a plan to reorganize the agency to include a Space Bureau and a standalone Office of International Affairs.
The rationale for these moves, as explained in a press release, is to “help ensure that the FCC’s resources are better aligned so that the agency can continue to fulfill its statutory obligations and keep pace with the rapidly changing realities of the satellite industry and global communications policy.”
While neither GPS nor Ligado were mentioned in the press release, some have taken establishment of a Space Bureau as a sign the FCC may be reconsidering its decision regarding Ligado Networks.
By creating a Space Bureau, the reasoning goes, the commission is acknowledging a need to better focus on space-based users. A report this summer from the National Academies of Science said that some GPS and Iridium users would be harmed if Ligado Networks is allowed to operate as planned.
Since the commission seems to be trying to prevent future Ligado-like controversies, it may also be ready to reconsider its Ligado decision. In February 2020 seven different petitions were filed by organizations and groups of organizations formally asking the FCC to reconsider. The commission has not yet responded to any of the petitions.
Few can disagree that aligning resources to more effective address constituent concerns is a good idea. At the same time reorganizations rarely, in and of themselves, prevent problems from recurring.
As one example, the FCC had been criticized for years for not including analyses of total costs and benefits to the nation of decisions it was considering. In January 2018, FCC Chairman Ajit Pai established the FCC’s Office of Economic Analysis to address those concerns.
Yet, despite Pai still being chair, the Office of Economic Analysis was not called upon to provide input to the commission’s deliberations on Ligado Network’s application. One of the pending petitions for reconsideration asserts that if the office had done a cost-benefit analysis, the commission’s decision would have been different. This is because the cost of even a small service degradation for potentially millions of GPS users would have very likely easily outweighed any benefit to the nation of granting Ligado Networks permission to operate.
Photo: Bill Oxford/iStock/Getty Images Plus/Getty Images
A photo taken in the aftermath of Hurricane Ian shows the massive destruction on Fort Myers beach. (Photo: felixmizioznikov/iStock/Getty Images Plus/Getty Images)
Not to harp on an event that’s already passed out of the headlines and national coverage, but Hurricane Ian — a Category 4 storm that hit Florida in September — was full of destructive winds and caused major damage that could be with us for years before things get fixed. One source also indicated that so far we have lost 157 people, mostly from drowning — nothing will ever fix those losses.
So harp on I will, especially about the role drones and drone pilots played in rescuing survivors, and determining and mitigating effects of the storm.
The place that took the hurricane hardest was Fort Myers on the southwest Florida coast. The following video is from a security camera.
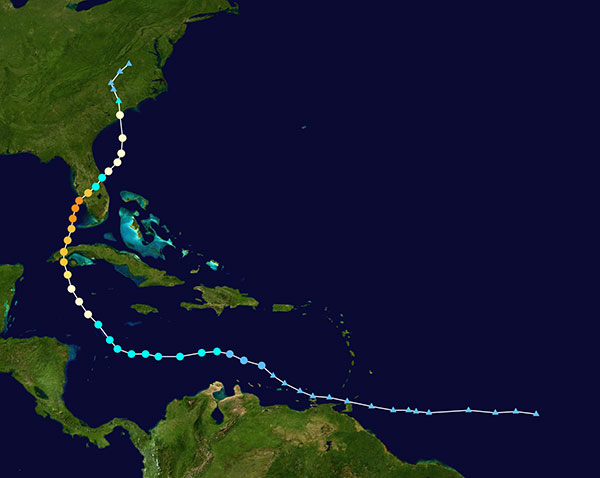
While Hurricane Ian was making a mess of Cuba and crawling over the Caribbean and into the Gulf of Mexico, drones were already flying over areas where the storm could cross from the Gulf onto land — initially forecast around Tampa. But the forecast landfall continued to drift south, over where I live in Venice and 150 miles south of Tampa to Fort Myers.
Before landfall, drone operators in Fort Myers were gathering video/geolocation information on buildings and streets in the path that the forecast 14-foot storm surge might take. They identified areas of potential damage and places people might need rescue.
Map plotting the storm’s track and intensity using data from the National Hurricane Center and a NASA image. (Image: public domain/FleurDeOdile/Wikipedia)/
After the storm hit, first responders began searching more than 400 destroyed houses in Fort Myers, some using the pre-storm drone video to rescue any trapped survivors.
The need was not only for access in difficult conditions, but also for communications. AT&T reportedly got cell coverage up quickly in a couple of areas, and Verizon flew tethered drones (capable of flying for up to 1,000 hours) to restore phone coverage over a circular radius area of five to seven miles. Verizon also hooked up generators and engaged satellite internet coverage for local use, and took a portable cell-site on a barge out to Sanabel Island, which had been cut off from the mainland. T-Mobile put generators at cell-sites that lost power and deployed satellite and ground-based portable cell coverage.
Verizon tethered drones provided cellular service for first responders. (Photo: Verizon)
Powerful Drone
Loss of power was another issue. Florida Power and Light (FPL) flew its recently acquired fixed-wing FPLAir One drone to assess damage to its power distribution infrastructure, which supplies about 12 million people on Florida’s west coast.
FPL drone used in power loss assessment. (Photo: FPL)
Using the drone in damage assessment efforts enabled FPL to get suitable crews to the right places early in the recovery effort.
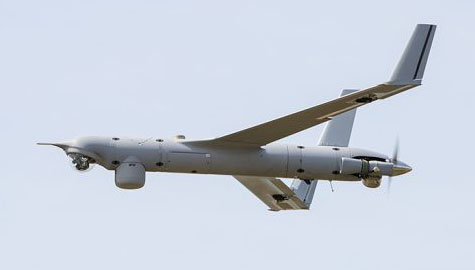
FPLAir One is a group 4/5 large UAV. It appears to be a Navmar Applied Sciences Corporation (NASC)/Sonex Aerospace TEROS unmanned aircraft, which is based on an earlier Sonex-powered glider design introduced in 2003. Because of this heritage and its rugged airframe, the TEROS is ideally suited for flights in high wind conditions — great for FPL’s long-range pre- and post-storm assessment application using FLIR and video cameras.
The drone’s extensive prior airframe proving is assisting NASC/Sonex in its quest for certification of TEROS by the Federal Aviation Administration (FAA). FAA certification will ultimately support its integration into the National Airspace System (NAS) and allow operators to move on from the individual FAA approvals required for each operational drone scenario.
Drones to the Rescue
The principal application for hundreds of drone flights by several organizations was search and rescue for missing residents, mostly in the flooded area in and around Fort Myers. Drones also helped rescue people in North Port, where floodwater was as high as four feet, collapsing roofs and trapping people in their homes.
Skydio provided drones for several search-and-rescue programs by police and other agencies, as well as coaching personnel who might lack experience in flying them. More than 500 drone flights were accomplished in the first days after the storm, a large number using autonomous flight capability, greatly assisting rescue efforts to locate trapped people. First responders were also able to determine whether access was possible, or what steps were initially needed to even enable access.
Insurance companies are also using drone assessment video, determining the level of damage to homes and vehicles, in an effort to put assistance where it was most needed early on. Using artificial intelligence to align food-stamp users with badly damaged homes identified on satellite images in Lee, Collier and Charlotte counties, GiveDirectly offered immediate $700-assistance to many survivors. If all these offers were accepted, the cost could be as much as $2.4 million in no-strings-attached immediate aid for those worst hit.
In the aftermath of the largest, most damaging hurricane to hit the United States since 1935, volunteers, first responders, drone pilots, aid agencies, and power, communication and insurance companies all made use of drones. These agencies and companies are still helping many thousands of people to survive and start the long task of picking up the pieces of their lives.
From its humble beginnings in the 1970s to its expanded use in the present day, GPS technology has been vital for nearly every industry from defense and aviation to farming and construction. GPS devices are designed to receive faint GPS signals transmitted from satellites about 12,000 miles away. Acknowledging this reality, regulators have historically maintained for GPS, which relies on such faint radio signals and sensitive equipment, an appropriately quiet spectrum neighborhood—populated by similar users.
With the NASEM report’s confirmation of harmful interference, the deficiencies of the FCC’s April 2020 decision are even more striking
Although these GPS signals and equipment have benefitted from decades of optimization, it is impractical to place highly sensitive GPS receivers designed to capture faint signals from remote transmission facilities immediately next to high-power communications equipment. Unlike those from communications systems, GPS signals are below the thermal noise floor when they are received. As a result, increases in that noise floor often decrease the availability of GPS services, which in turn places at risk high-consequence and safety-of-life services that rely on GPS.
Alex Damato
Why does this matter? In April 2020, the FCC approved a plan to deploy a terrestrial network in spectrum adjacent to the frequency bands used by GPS — operating communications signals that would be around two billion times more powerful than GPS signals at the same location.
This past September, the National Academies of Sciences, Engineering, and Medicine (NASEM) released a report detailing the harmful effects of a terrestrial communications network that would operate in a frequency band close to that of GPS.
Expert concern within 14 federal agencies and departments, a broad coalition in Congress, and the GPS industry resulted in a congressional mandate that NASEM conduct an independent technical review of potential interference to GPS. After a thorough review of the materials, NASEM concluded that the proposed terrestrial network would result in harmful interference to a substantial number of GPS receivers.
In particular, the report noted that high precision GPS devices, which are used in the most economically significant GPS applications, are the most vulnerable receiver class and likely to be affected by interference. The potential for any interference with GPS, especially with devices used by the Department of Defense, poses a threat to national security, the economy, and our daily lives.
With the NASEM report’s confirmation of harmful interference, the deficiencies of the FCC’s April 2020 decision are even more striking: potentially millions of farmers, pilots, construction companies, and first responders may be required to repair or replace GPS equipment at their own cost. Although the FCC assumed that this equipment could be repaired through upgrades or filters, some devices cannot be filtered without significant financial and performance costs, and some devices simply cannot be filtered at all.
GPS is estimated to provide up to $300 billion annually in benefits to the economy. Any disruption in GPS accuracy and usage would have detrimental effects on productivity and economic growth. Moreover, the year before the FCC’s flawed decision, another key report revealed that the loss of GPS service would have an average impact of $1 billion per-day on the nation.
The GPS Innovation Alliance will continue to work with all federal and industry stakeholders to maintain open channels of communication to connect, listen, and learn from all those involved in the discussion. As technological innovation continues, these debates on harmful interference are not going away, and GPSIA is looking forward to engaging further.
What is the most promising approach to increasing the location accuracy of smartphones?
Ismael Colomina
“In addition to the use of increasingly available augmentation services, such as Galileo’s free High-Accuracy Service (HAS), I see two development directions that may help, particularly in the context of positioning in urban areas where smartphones are most used. One is the use of 3D city models — in general, 3D geoinformation — to compensate for multipath, non-line-of-sight and occlusion effects. The other is to use signals that are robust against those effects, which today are only available in geodetic-grade receivers.” — Ismael Colomina, GeoNumerics
For the navigation of autonomous vehicles, will GNSS become essential, or will it be relegated to a secondary role by robotic navigation methods?
John Fischer
“The PNT solution cannot be from a single source because autonomous navigation requires high integrity. Therefore, it’s not that GNSS will be relegated to secondary status, it’s that no one method will be primary. An intelligent fusion of diverse sensors —including GNSS — will provide the PNT solution along with an integrity metric that safeguards operation. The various sensors must agree. If they don’t, no trust can be put into the solution and autonomous navigation will cease. The definition of a new integrity metric that quantifies this trust level is needed.” — John Fischer, Orolia
Ellen Hall
“Because GNSS provides high precision and widely available PNT, it will continue to be a critical component in navigation while working with computer vision, inertial measurement units (IMUs) and lidar through sensor fusion. As a secondary component, GNSS serves a vital role for localization and validation.” — Ellen Hall, Spirent Federal Systems
Last year I was privileged to be part of a Blue-Ribbon Review Panel for an American Society of Civil Engineers (ASCE) surveying publication. The book is Surveying and Geomatics Engineering: Principles, Technologies, and Applications. I recently received my copy of the published book in the mail and decided to highlight some sections. While preparing this column, the chapters reminded me of how geodesy has expanded into so many different disciplines.
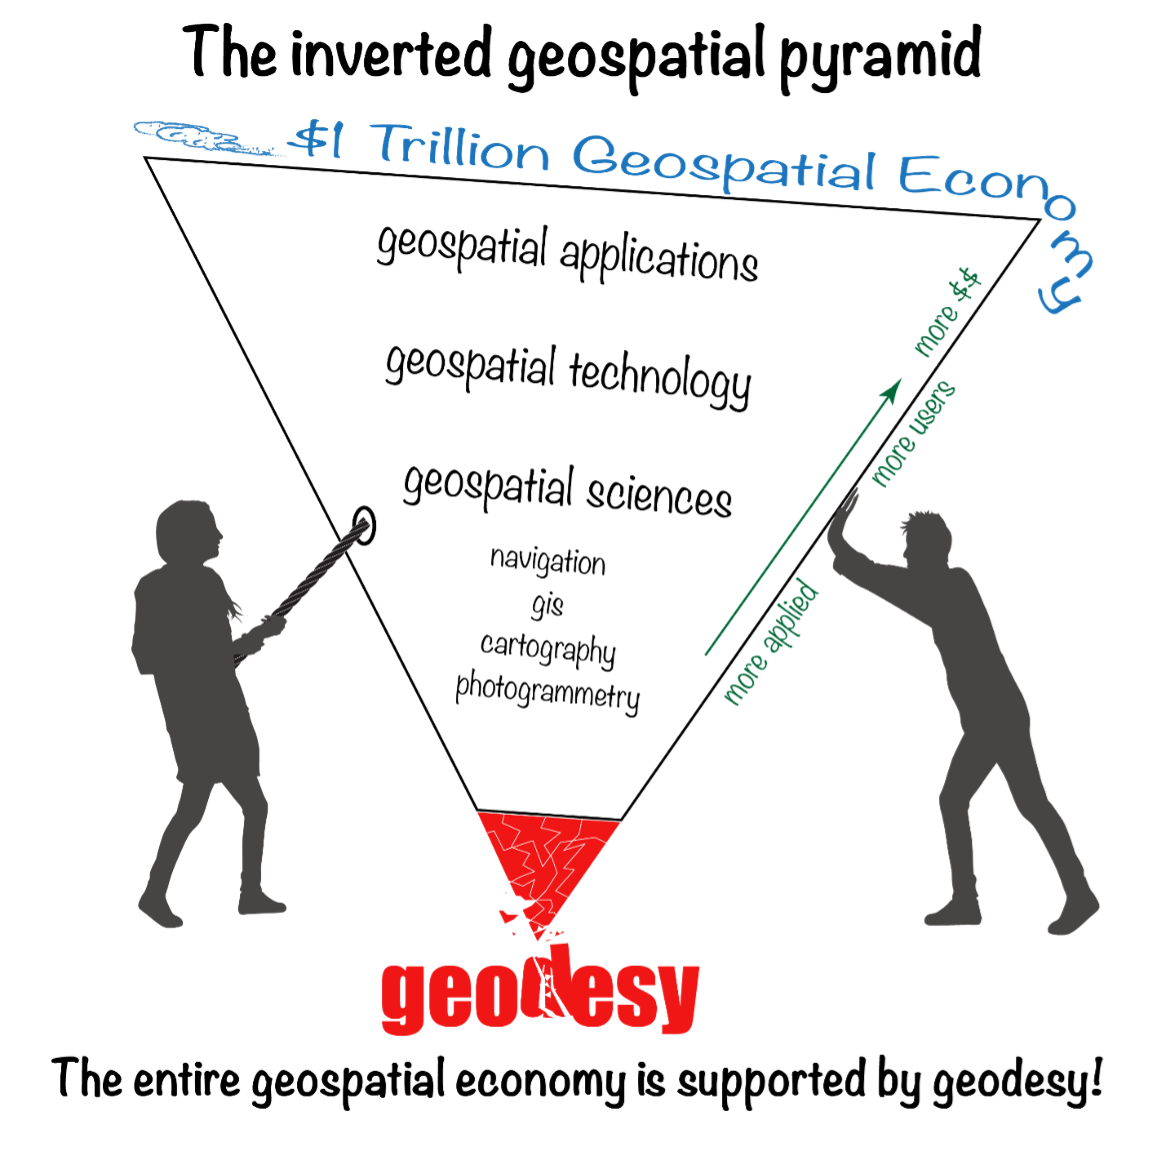
I first mentioned this in my July 2020 article for the “First Fix” column of GPS World, where I stated that the shortage of American trained geodesists poses a significant economic risk for the United States. In that column, I mentioned how geodetic science and technology now underpin many sciences, large areas of engineering (such as driverless vehicles and drones), navigation, precision agriculture, smart cities and location-based services. That is why I believe understanding geodesy is more critical today than ever. In January 2022, Mike Bevis, collaborating with others, prepared a white paper titled “The Geodesy Crisis,” documenting the concern about the lack of trained geodesists in the United States.
Image: Dana Caccamise II
“The inverted geospatial pyramid” graphic depicts how the entire $1 trillion geospatial economy is supported and dependent on geodesy, and how it’s close to collapsing without an increase of support for geodesy. A lack of geodetic expertise in the United States presents a significant challenge, with future impacts on positioning, navigation, mapping and dependent geospatial technologies.
In my opinion, without investment in geodesy, the United States will not have the available skills and knowledge to develop new geodetic technologies and improve models to address challenges to society, such as
how the Earth’s surface is changing as sea level rises and the Earth’s glaciers and ice sheets change on timescales of months
how the tectonic plates are deforming and what physical processes control earthquakes, and
the ability to monitor the temporal changes in Earth’s water reservoirs by measuring changes in Earth’s gravitational field as it responds to the moving water mass and the deformation of the solid Earth caused by moving water.
These challenges need a well-maintained, stable terrestrial reference frame (TRF) with sub-1 mm/year vertical accuracy. Errors in TRF heights can propagate systematically into estimates of atmospheric water vapor, sea level, satellite orbits and other parameters. An accurate TRF can lead to important observations and discoveries because it enables revelations from coherent global motions. (My previous column described the latest International Reference Frame of 2020 [ITRF2020].)
Geodesy has been a significant part of my life for 50 years. I’ve seen a lot, and unless we address the Geodesy Crisis, the innovations in geodetic science of the past will not continue in the future. At least not in the United States.
The Geodesy Crisis paper was mentioned in the Fall 2022 ION Quarterly Newsletter by Everett Hinkley (see the box below). Hinkley noted, “The geospatial community relies on geodesists, though few in the community are fully aware of this connection nor understand the importance of geodesy to their work.” I encourage everyone to download the white paper and the ION Quarterly Newsletter to understand the importance of the need for more trained geodesists.
Excerpt from Everett Hinkley’s Article
“In January 2022, a white paper entitled America’s loss of capacity and international competitiveness in geodesy, the economic and military implications, and some modes of corrective action was released (Bevis et al.). This collaborative paper paints an alarming picture of the dwindling pool of trained geodesists within the United States. The report highlights America’s loss of capacity and international competitiveness in geodesy and states: ‘The U.S. is on the verge of being permanently eclipsed in geodesy and the downstream geospatial technologies. This decline in capability threatens our national security and poses major risks to an economy strongly tied to the geospatial revolution, on Earth and, eventually, in space.’ Though the word crisis correctly describes the dire predicament well, it didn’t occur overnight. Due to several converging trends, the geodesy crisis has been decades in the making. A national lack of geodetic expertise presents a significant challenge with downstream impacts on positioning, navigation, mapping, and dependent geospatial technologies. The Department of Defense, intelligence community, and federal civil agencies’ mapping entities rely on accurate and precise maps for a broad range of purposes, and reliable maps depend on an accurate geodetic underpinning. The geospatial community relies on geodesists, though few in the community are fully aware of this connection nor understand the importance of geodesy to their work.” (Reproduced with permission from ION.)
In my “First Fix” column, I mentioned that I attended The Ohio State University (OSU) to obtain my graduate degree in Geodetic Science in 1979. Therefore, I admitted that I am a little biased — once a geodesist, always a geodesist. That said, in OSU’s geodesy heyday (1960–1990s), many Americans trained were sent there by federal agencies: National Geospatial-Intelligence Agency (NGA), NOAA/National Geodetic Survey (NGS), USGS, Army, Navy and Air Force. During the 1970s, NGS sent two employees back to school every year. These agencies needed geodesists because they were undertaking significant projects, such as the NGS projects to readjust the U.S. national horizontal (NAD83) and vertical geodetic (NAVD88) networks. I was one of the employees NGS sent to OSU to be trained to support the NAD83 and NAVD88.
Today, the environment is different. U.S. federal agencies still need geodesists to develop enhanced and refined geodetic models and tools. However, major U.S. companies, such as Google and FedEx, the automobile industry, the construction industry (automated machine guidance), precision farming companies and mining companies also need more accurate geodetic models, tools and algorithms. Therefore, these companies also need trained geodesists to perform essential research on topics that address their geodetic requirements. As indicated in “the inverted geospatial pyramid” graphic, the entire $1 trillion geospatial economy is supported by geodesy.
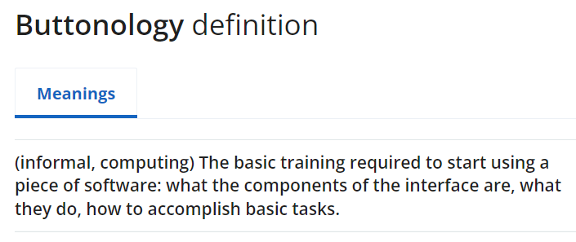
As implied in Hinkley’s article, geodesy has played a role in developing geospatial products but most users didn’t realize that it was their foundation. Since it’s been in the background, everyone assumes it will always be there. A participant at one of my workshops stated that “GPS has made geodesists out of all of us.” In my opinion, the advancements in GNSS equipment and processing software provided some users with a “false sense of knowledge or security” that they understood what was happening within the “black box.” One of my colleagues at NGS said that the new equipment and software programs were creating a field force of “buttonologists.”
These statements concerned me at the time and concern me today. With the last generation of trained geodesists either retired or getting ready to retire, we are at a critical stage of not being able to meet the geospatial needs of the future. As indicated in the white paper, there are significant challenges in rebuilding programs that support the training of geodesists.
Hinkley’s article summarized several action items that could help improve the lack of trained geodesists in the United States. I’ve provided his list in the box below. I’ve highlighted several items the surveying and mapping community can help achieve.
So how do we build and educate the next generation of geodesists?
Make the White House and Congress aware of this crisis, particularly its national security implications; seek direct support in the federal budget to correct this issue. It has become clear that, without engagement at the highest echelons of the U.S. government, averting this current crisis and its eventual outcome is unlikely.
Teach rigorous math in our public schools; follow the scholastic math approach used in many Asian and European countries.
Encourage creative thinking!
Actively market geodesy in high schools as a rewarding career for the math stars before college entry.
Build back, support and sponsor geodesy programs at select universities. This support needs to be strategic, with backing from the highest levels of the U.S. government.
Break our cultural trend of reactions to crises and seize the opportunity to be proactive and prevent the foreseen consequences of this crisis.
Encourage U.S. government support in the form of grants, professional development of staff, and research collaborations/affiliations. There are early efforts underway to bring new talent into the pipeline:
the National Geospatial-Intelligence Agency (NGA) is forming an emerging scientist consortium (ESCON) with partnerships that exist with Ohio State, UT-Austin, and other industry/academic/government partners
a pilot Ph.D. geodesy educational program with three NGA and one NGS employee is in place; the NGA expects to continue growing this program.
the NGA’s new western headquarters in St. Louis will bring 350 companies and organizations into the regional GEOINT ecosystem.
If we answer this call to action collectively, there is hope that a new cadre of U.S. geodesists can be cultivated before it’s too late to recover.
(Reproduced with permission from ION.)
With all that said about the need for more geodesists, one thing that this ASCE publication may do is make some readers realize how much they don’t know about the roots of the technology that they’re using to create geospatial products and services. This knowledge gap is not just correctly using GNSS and other geospatial technology to perform a survey, but also integrating various instruments to create an accurate mapping system, such as mobile mapping and terrestrial laser systems. My intent is not to criticize the expertise or knowledge of anyone, and I only mean to point out that in today’s use of computers and programs, many technical concepts are hidden in “black boxes.” I learned many things about some topics by reviewing this book.
The book is 556 pages and has 15 chapters. As part of my responsibilities as a Blue-Ribbon Panel member, I read every word in the book, and not many people will read the entire book. Still, I would encourage surveyors, engineers, geodesists, photogrammetrists and GIS and remote-sensing practitioners to obtain a copy of the book for reference and to understand the limitations of geospatial technology.
Now to the book’s content. I want to highlight that the forward is written by Juliana Blackwell, director of the National Geodetic Survey (NGS). She states that “A common thread running through the manual is the importance of the National Spatial Reference System (NSRS) to modern geospatial applications.”
Most of my columns highlight something relevant to the NSRS. That’s because the NSRS is the foundation layer for United States federal geospatial products, and geodesy provides the foundation for all geospatial products and services as indicated in the “The inverted geospatial pyramid” figure.
I would also like to highlight a statement by Gene Roe in the preface. He states, “Because entire books could be devoted to each of these topics, this manual only provides a summary, and it points the readers to important references where they can find more details. The manual is meant to provide a comprehensive but general overview to help support education and inform practicing engineers on the important role of the surveying engineer. It is too important for this not to occur.”
I agree with Roe’s statement that the book is important for surveying engineers. Still, I would add that this book is important to anyone working with GNSS and other geospatial data, especially geodesists, surveyors and GIS practitioners.
This publication is edited by three individuals that are licensed surveyors; two of them are geodesists who work for NGS. These individuals have performed a fantastic job of ensuring that all chapters have been reviewed for correctness and that the information provided is current and essential for users of geospatial data.
Readers can download copies of the book and specific chapters here. You can buy it as an e-book or in print. The “Abstract” box summarizes the book from the ASCE Library website.
Abstract
Sponsored by the Surveying Committee of the Surveying and Geomatics Division of the Utility Engineering and Surveying Institute of ASCE and the National Geodetic Survey of the US National Oceanic and Atmospheric Administration
Surveying and Geomatics Engineering: Principles, Technologies, and Applications, MOP 152, is a comprehensive yet general overview to help support education and inform practicing engineers on the important role of the surveying engineer. It provides a much-needed update on the modern practice of surveying and geomatics engineering.
Topics include:
• geodesy
• coordinate systems and transformations
• least squares adjustments and error propagation
• modern surveying and remote sensing technology
• analysis and establishment of control
• geographic and building information systems
• construction surveying, and
• best practices.
MOP 152 can be used as a summary and a reference for practicing engineers, surveying and otherwise, to help provide a solid understanding of the state of the surveying and geomatics engineering field.
Below is a list of the chapters and their authors. This column cannot highlight everything important in this book, but I will select a few items to which I believe users of geospatial data should pay attention.
Chapter Titles
Chapter Number
Chapter Title
Author(s)
Forward
Juliana P. Blackwell
Preface
Gene V. Roe
Acknowledgments
Daniel T. Gillins
1
Engineering Surveying Within ASCE
Gene V. Roe
2
Geodesy and Geodetic Computations
Earl F. Burkholder
3
Map Projections and Local Coordinates Systems
Michael L. Dennis
4
Local, Regional, and Global Coordinates Transformations
Michael L. Dennis
5
Analysis and Adjustment of Observational Errors
Charles D. Ghilani
6
Satellite-Based Surveying Technology
Jan Van Sickle
7
Leveling and Total Stations
N.W.J. Hazelton
8
Terrestrial Laser Scanning
Michael J. Olsen
9
Mobile Terrestrial Laser Scanning and Mapping
Michael j. Olsen, Jaehoon Jung, Erzhuo Che, Chris Parrish
10
Aerial Surveying Technology
Michael J. Starek, Benjamin E. Wilkinson
11
Survey Control
Daniel T. Gillins
12
Construction Surveys
Marlee A. Walton
13
Survey Records
Andrew C. Kellie
14
Information Systems in Civil Engineering
Yelda Turkan, Dimitrios Bolkas, Jaehoon Jung, Matthew S. O’banion, Michael Bunn
15
Professional Services and Design Professionals Agreements
David E. Woolley, Lisa D. Herzog
As a geodesist, I usually focus on topics relevant to geodetic science. This book has a lot of topics that use geodesy concepts to create an engineering product or service. For example, chapter 2, “Geodesy and Geodetic Computation” by Earl Burkholder, provides a good summary of geodetic concepts that anyone using or generating geospatial products should know and understand. It gives basic equations without lengthy derivations of how they were developed.
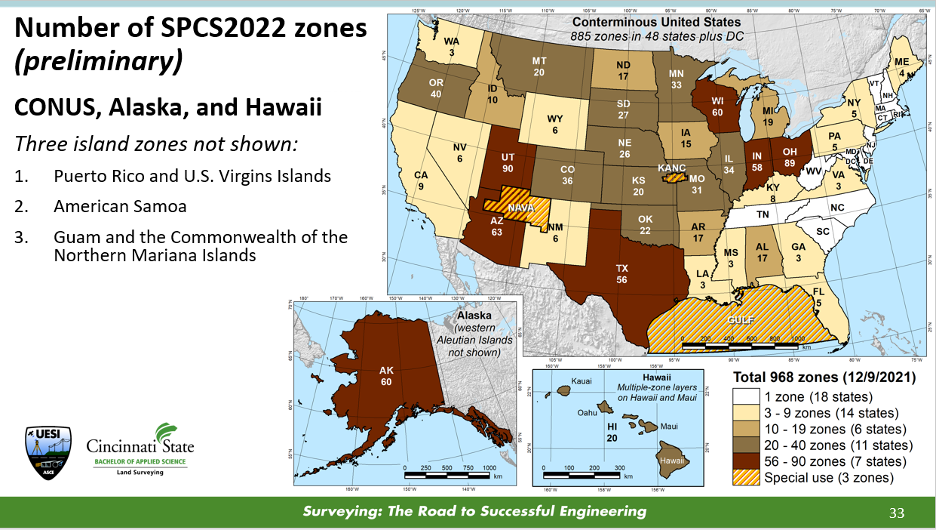
In my opinion, chapter 3, “Map Projections and Local Coordinates Systems” by Michael Dennis, does the best job of explaining the concepts of map projections that are relevant to the surveying and mapping community. Many GIS practitioners use map projections in their software but don’t have a working knowledge of what’s happening to their original data. This chapter describes the current United States State Plane Coordinate System of 1983 (SPCS83) and the future State Plane Coordinate System of 2022 (SPCS2022) that is scheduled to be adopted in 2025. Dennis uses figures and diagrams to describe map projections, angular and linear distortion, and methods for reducing map projection distortion to make it easier for readers to understand the concepts. One section of interest to many surveyors after SPCS2022 is adopted is the Low-Distortion Projection (LDP) Coordinate Systems section. This is useful because, in SPCS2022, many states have designed LDP systems for their state’s SPCS2022. The box below provides a diagram with the number of zones for each state.
Image: NGS Presentations Webpage “Grids for the Future: A New Approach for Designing State Plane Coordinate System Zones” by Michael Dennis.
One purpose of an LDP is to reduce linear distortion; it is not a new concept. Many surveyors have performed a simplified form of it for decades. It’s known by many as a “modified” or “scaled” State Plane. The American Congress on Surveying and Mapping (ACSM) taught a workshop for decades describing how to compute a “modified” State Plane Coordinate. I was an instructor of this class in the 1980s and 1990s. “Modified” State Plane Coordinates had several issues, but they worked reasonably well in small areal extents. Today, with the advancements in computers and computer software, there are better ways to accomplish an LDP. Dennis’ section does a great job explaining the new SPCS2022 and the design of LDPs in the SPCS2022. The use-case examples provide a simplified description of understanding the linear distortion behavior in an area.
Chapter 4, “Local, Regional, and Global Coordinate Transformation” by Michael Dennis, is one that every surveyor and GIS practitioner should read. Dennis highlighted the differences between “equation-based” transformations and “grid-based” transformations, as well as combined equation-based transformations with grid-based transformations. Understanding the information provided in chapter 4 will be important when NGS replaces the NAD 83 (2011) and NAVD 88 datums with the new, modernized NSRS in 2025. NGS will provide models and tools for users to perform coordinate transformations, but hopefully, some users will want to understand what’s happening behind the scenes.
Chapters 8 and 9 discuss laser scanning systems. In chapter 8, “Terrestrial Laser Scanning,” the “Data Quality Considerations” section highlights common artifacts or limitations encountered with terrestrial lidar system data. The authors provide many examples of these artifacts, making the concept easy to understand. At the end of this chapter, there are 14 pages of references that will be very helpful to users involved with terrestrial laser scanning systems.
Chapter 9, “Mobile Terrestrial Laser Scanning and Mapping,” is very informative, especially the section on georeferencing. This section is not just the description of properly using GNSS to perform a survey, but also the integration of various instruments to create an accurate mobile mapping system. I like how the authors discussed the error sources in georeferencing the system, listed the source, and provided an explanation of the error.
Anyone performing a GNSS survey project that meets NGS’s requirements needs to read chapter 11. I like the section describing how users should evaluate CORSs before using them as control. Evaluating CORS is something all users should do before using any CORS in their project, because not all CORS are created equal. See the excerpt from chapter 11 below for the recommended steps from the author.
Excerpt from Chapter 11 – Steps for Evaluation of CORS
The author recommends the following steps:
1. Choose stations that are within 100-300 km of a project site. It is well known that errors in GNSS baseline processing are directly correlated with baseline length (Chapter 6). Tropospheric delay is reduced when baselines are shorter and atmospheric conditions at each end of the line are similar. In addition, mutual satellite visibility at each end of the line for differencing diminishes as baselines grow longer. That said, errors in GNSS processing are more occupation time-dependent than baseline length-dependent (Eckl et al. 2001). Therefore, for short GNSS sessions (i.e., < 2 hours), choose CORS within approximately 100 km as control; for moderate GNSS sessions (i.e., 2 to 8 h), choose CORS within approximately 300 km. Note that even longer baselines can be successfully processed when GNSS sessions are very long in duration (e.g., up to 2,000 km for 24 h sessions).
2. Determine if GNSS data are available at a given CORS during the time of your survey. Of course, if data are unavailable, then the station simply cannot be used as control. NGS provides a tool known as “User Friendly CORS (UFCORS)” for entering a date and time range to view available data at a given station (NGS 2021c). This tool can also be used to download the raw GNSS data for processing and adding a station to the survey network.
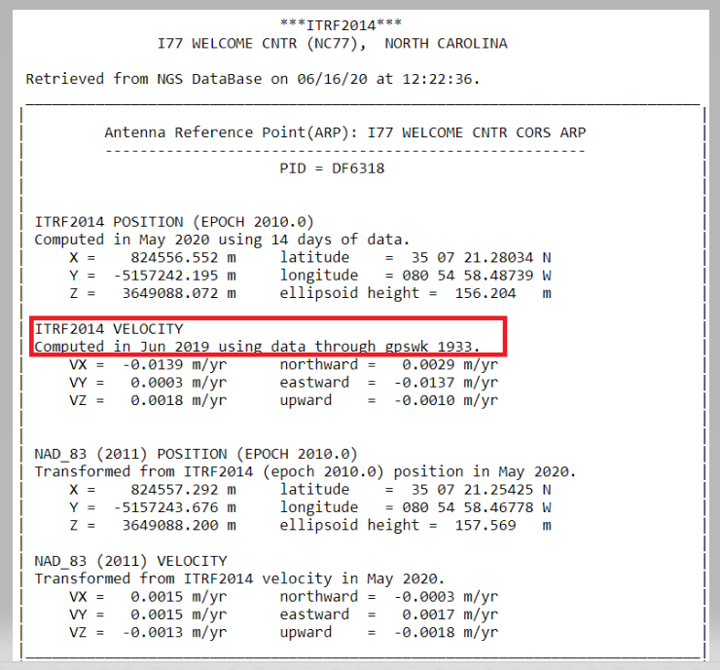
3. As discussed previously and when possible, choose a CORS with computed velocities rather than modeled velocities from HTDP. NGS provides tables of official coordinates with “computed” versus “htdp” coordinates and velocities on the website for CORS.
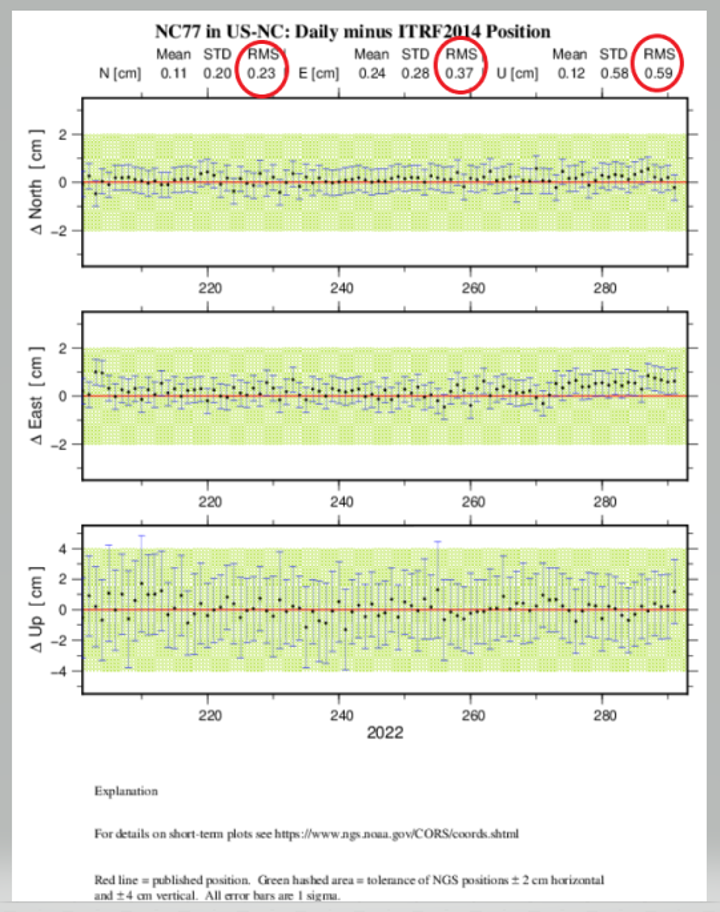
4. Review the aforementioned short-term time-series plot for the station, ideally at the time of the project. Stations with large spikes, data gaps, bias from the published “red” line, or large standard deviations should be avoided. A good rule-of-thumb is for the RMS in the short-term time-series plot (Figure 11-2) to be less than 1.0 cm in north and east and 2.0 cm in the up direction in a local geodetic horizon frame at the station.
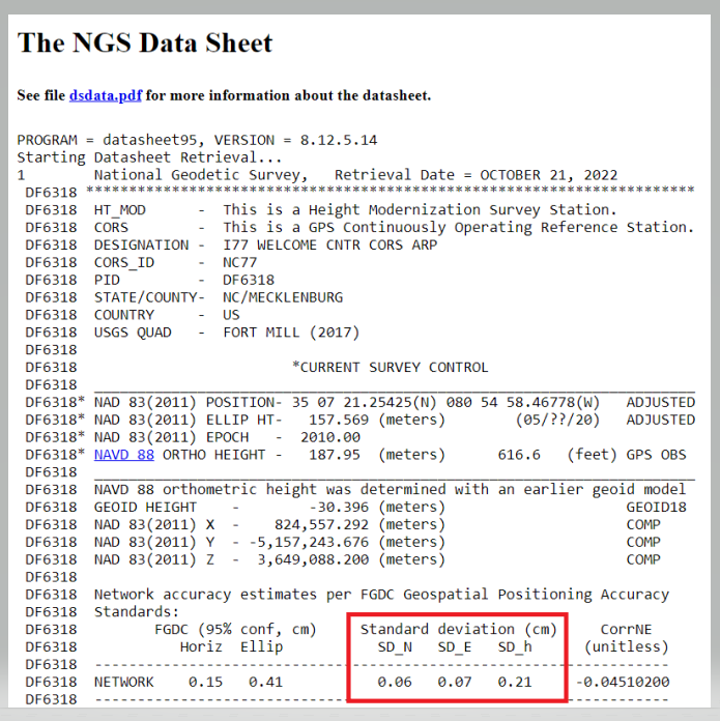
5. Examine the formal uncertainties for the official coordinates of the CORS. Standard deviations in north, east, and up are provided on the station’s datasheet, accessible from the webpage for the CORS (more on datasheets are discussed in the following under Passive Control). Stations with unusually large standard deviations (> 3 cm) should be avoided. Note that standard deviations are not available for CORSs with modeled velocities.
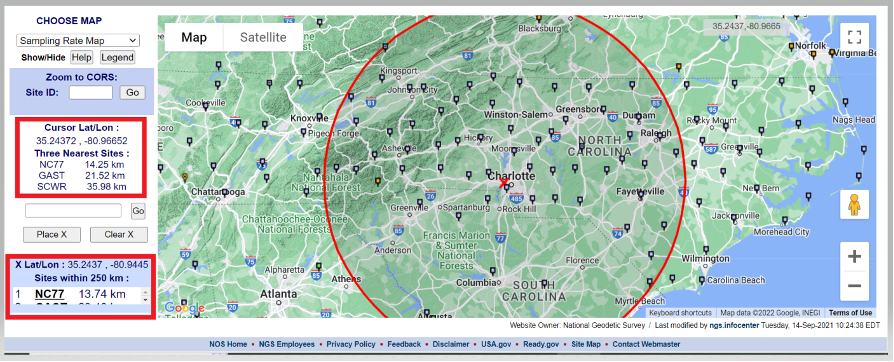
I believe that the evaluation of NOAA CORS is critical, so I’ve described Dan Gillins’ “Steps for Evaluation of CORS” below. First, users can access the NOAA CORS using the NGS CORS Map utility. After the map appears, users can move the cursor over the center of the project area, where it provides the location of the cursor and the three closest CORS. Users can click on a CORS icon and get coordinates and other information about the CORS. Also, they can place an X on the map, and the utility will draw a 250-km circle around the point. The box in the lower left-hand side of the map provides a list of the sites within 250 km of the marked location.
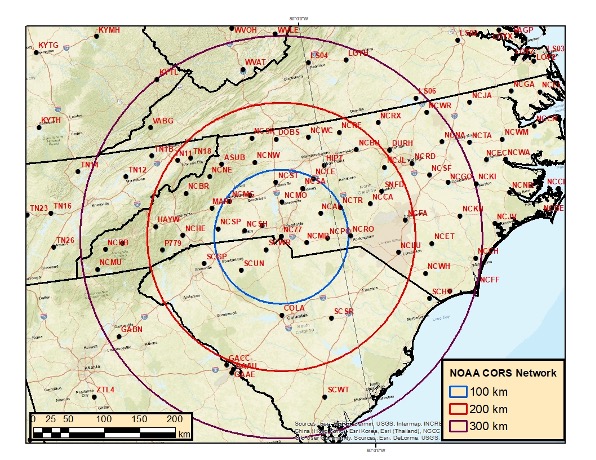
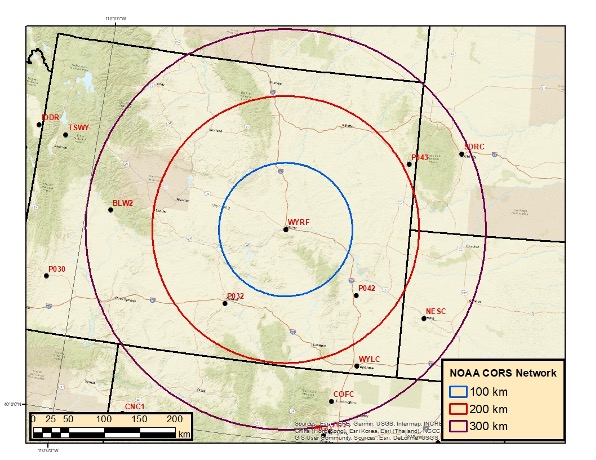
Users can download the NOAA CORS coordinates and velocities (computed and modeled). I downloaded the files and plotted three circles (with radii of 100, 200, and 300 km) around CORS NC77 in Charlotte, North Carolina. I only plotted CORS that are operational and have computed velocities. North Carolina has a lot of CORS to select from. In contrast, I’ve plotted three circles (also with radii of 100, 200 and 300 km) around CORS WYRF in Casper, Wyoming.
Buffer Zones around Charlotte, NC
Image: Dave Zilkoski
The plot depicting the buffer zones around Casper indicates that there are no CORS within the 100-km circle and only a few between 100 and 200 km.
Buffer Zones around Casper
Image: Dave Zilkoski
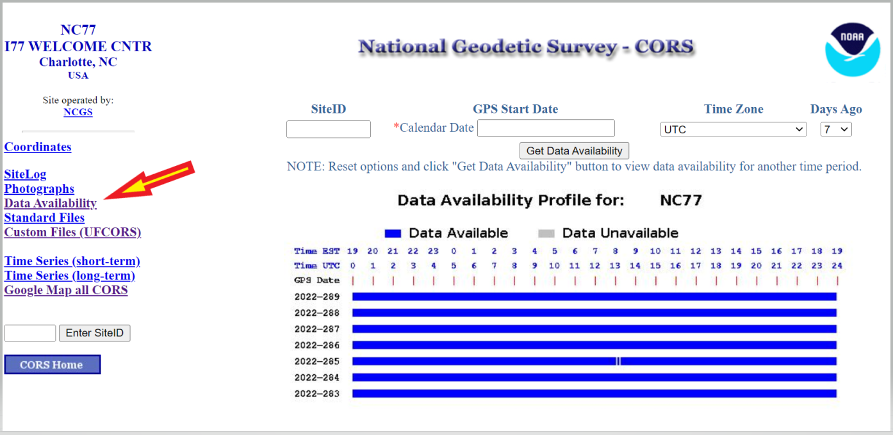
The data availability of the CORS site can be obtained by clicking on the CORS icon, selecting “Get Site Information,” and then selecting “Data Availability.”
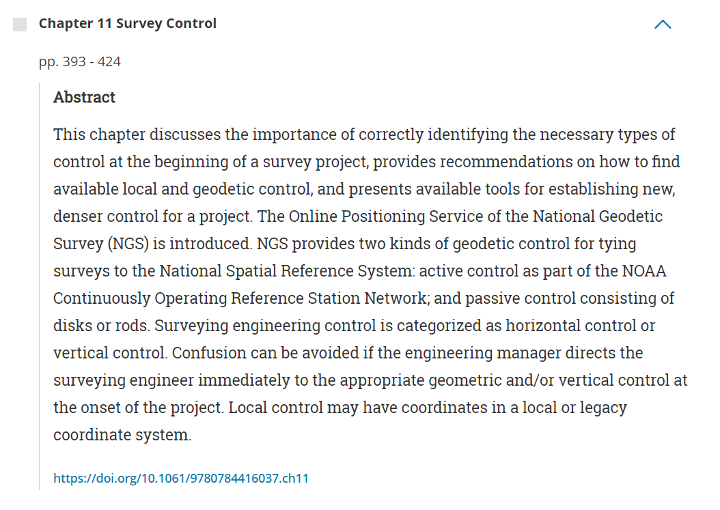
There are too many chapters to describe each one, but I encourage users to check each chapter’s abstract on the ASCE website and decide which ones would be the most beneficial to them (see the box titled “Abstract for Chapter 11 Survey Control”). The manual provides numerous references and can serve as a helpful resource for finding further details on the fields of geodesy and surveying.
A goal of mine is for some readers of this column to obtain enough knowledge to “whet their appetite” and encourage them to pursue an education in geodesy and surveying. Others who are influential in federal government programs and those responsible for geospatial research for industries will recognize the need for more trained geodesists in the United States and help by doing the following:
actively market geodesy in high schools as a rewarding career for the math stars before college entry
build back, support, and sponsor geodesy programs at select universities; this support needs to be strategic with backing from the highest levels of the U.S. government
encourage U.S. government support in the form of grants, professional development of staff, and research collaborations/affiliations.
To paraphrase Galileo Galilei — the great Italian astronomer, philosopher, engineer, mathematician and physicist — positioning, navigation and timing (PNT) does not revolve around GPS. The European GNSS named after the father of modern science (as Albert Einstein called him) is making great strides and currently provides more accurate positioning than the United States’ GPS, Russia’s GLONASS, or China’s BeiDou-3. In fact, there are more Galileo satellites providing an L5 signal than GPS satellites.
I heard much well-earned pride about Galileo’s achievements expressed by European presenters at the Institute of Navigation’s GNSS+ conference in Denver in September; during a visit to the European Commission’s Joint Research Center in Ispra, Italy, on Oct. 7; and at the INTERGEO conference and trade show in Essen, Germany, on Oct. 18-20. (On the way, I stayed several days in Pisa, Italy — where I spent my teen years when my father taught physics at the city’s university — at a friend’s home about 100 feet away from the house where Galileo was born in 1564.)
While two more launches are required to complete the Galileo constellation so that it will have at least one spare satellite per plane, its service availability is already at 98-99% and a new ground segment has been deployed. A second generation of satellites is on its way, with expected initial operational capability in 2028 and full operational capability starting after 2031. Its features will include new signals, improved effective isotropic radiated power (EIRP), inter-satellite links, and a 15-year lifespan.
The Open Service Navigation Message Authentication (OSNMA), a free data authentication function for users of Galileo’s Open Service, has been stably transmitted worldwide for a year. It will enable users to verify the authenticity of GNSS data, thereby greatly helping to detect instances of spoofing. A declaration of initial service is foreseen for 2023, and the first OSNMA-capable receivers are already on the market.
Galileo’s High Accuracy Service (HAS) signal has been available worldwide with orbit and clock corrections and biases for Galileo and GPS since July 22. While it is still in its validation phase, it is already performing very well and an initial service declaration is expected by the end of the year, including an Internet-based correction distribution service.
Galileo is also developing an emergency warning service that will use the L1 band to broadcast alerts and guidance to populations at risk of natural disasters. It is expected to enter service in 2024 and reach any Galileo-enabled device, of which there are already about three billion. Other services will include advanced timing, space service volume (to aid in the positioning and navigation of spacecraft in high-Earth orbits), advanced receiver autonomous integrity monitoring (ARAIM), and predictions of ionospheric perturbations.
Like so much else, completion of the Galileo constellation was affected by Russia’s war in Ukraine, because two launches planned for this year from French Guyana aboard Russian Soyuz rockets were scrapped.
Finally, one of my favorite quotes from Galileo: “Measure what can be measured and make measurable what cannot yet be measured.”
Plus: Visual AI radar aids drone searches, and a drone is released into Hurricane Ian
Just when you imagine there couldn’t be any more twists and turns to the war in Ukraine, another one turns up. Some may recall that Estonian security forces caught an Estonian/Russian man trying to send drones to Russia. The Estonian government confiscated the shipment of DJI drones.
Now Estonia has donated those drones to Ukraine for use against Russia in the ongoing war.
Remember the drones we confiscated from a person trying to donate them for the Russian aggression in Ukraine? Well, these drones still made it to Ukraine. But the right way around and on the right side of the battlefront. https://t.co/No38Bbjkom
Some might say that this is an example of, “What comes around goes around.” Nevertheless, everyone respects Russia’s nuclear options…
Making Drones Smart
It’s all well and good that we have all shapes and sizes of battery- and gas-powered drones, ones that take off and land vertically (eVTOL) or horizontally (generally, fixed-wing). But how do we make them smart enough to complete tasks on their own?
Artificial intelligence (AI) could be the answer. Take the Boeing Loyal Wingman drone. It is being developed to fly autonomously alongside high-end fighters, and perhaps to control other drones flying nearby. Those tasks require AI, which is being incorporated into the capabilities of drone systems.
We also have immediate needs, such as search and rescue, security patrol and inspection (for commercial and military facilities, border and crowd control) and military intelligence, surveillance, target acquisition and reconnaissance (ISR/ISTAR). Along comes Sentient Vision Systems of Australia with a passive, software-based “visual radar” solution.
Sentient Vision Systems uses its digital AI processing with existing visual and infrared sensors. This combination can apparently surpass human and conventional radar capability to detect and track small moving objects.
Search and rescue at sea can be a really difficult task for people. It’s not surprising that a lot of lengthy searches end up with zilch. During a search, an aircraft flies from 20,000 feet down to 500 feet over the waves. If you have seen cabin video of air-sea searches in progress, with a searcher gazing out of the aircraft’s window for hours, straining to see something small bobbing in the sea below, it does seem like a herculean task.
As an alternative, take a long-range (>55 nautical miles) drone, such as a Boeing/Insitu ScanEagle. Hook up the scanning search camera and high-resolution nose turret to the vidar (visual detection and ranging) processing.
Boeing/Insitu ScanEagle UAV with vidar pod. (Photo: Insitu)
As a result, you have an autonomous airborne system that can find a person in the water from a distance of about 1.7 nautical miles, and spot a ferry deck from ~30 nautical miles. Insitu claims that conventional radar systems cannot do this. In 12 hours it can search an area of about 13,400 square nautical miles.
Several such sorties might just have found an early trace of Malaysian Airlines Flight MH370 in 2014. The Boeing 777 with 239 people on board disappeared over the South China Sea 38 minutes after takeoff on a flight to Beijing. Over three years, long-range patrol aircraft covered 46,000 square miles before the search was abandoned.
During 2015 and 2016, pieces of the airplane began washing up on the shores of countries on the Western Indian Ocean. The search would probably not have been easy even for a fleet of ScanEagles, considering the logistics and the available range of the unmanned aircraft, but major incidents might find success with vidar-equipped UAVs.
Into the Eye of the Hurricane
The devastation that Hurricane Ian wrought in Southwest Florida has been terrible. A shark swimming up a street in Fort Meyers illustrates the degree of flooding left from landfall of the category 4-5 hurricane.
Ian was the strongest hurricane to make landfall in the United States in decades, with extremely high winds and strong storm surge. I sat through the storm 75 miles to the North, and it was one scary hurricane even there. I can’t sympathize enough with the residents of Lee County, who only received a warning to evacuate one day before it hit them.
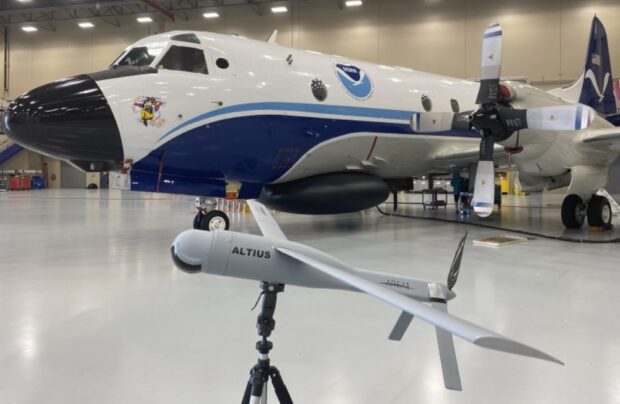
Nevertheless, the National Oceanic and Atmospheric Administration (NOAA) had its Hurricane Hunter Orion aircraft up to investigate on Sep. 28 as the storm came in from the Caribbean. Despite bad turbulence, the P-3 aircraft flew into the upper regions of the Hurricane and launched an Altus-600 27-pound drone into the eye at 4,500 feet. With a 275-mile range at up to 100 mph, the aircraft crew controlled the small drone, using it to collect data on wind speed, pressure, temperature and humidity.
The Orion P-3D Hurricane Hunter aircraft and the Altus-600 drone. (Photo: NOAA)
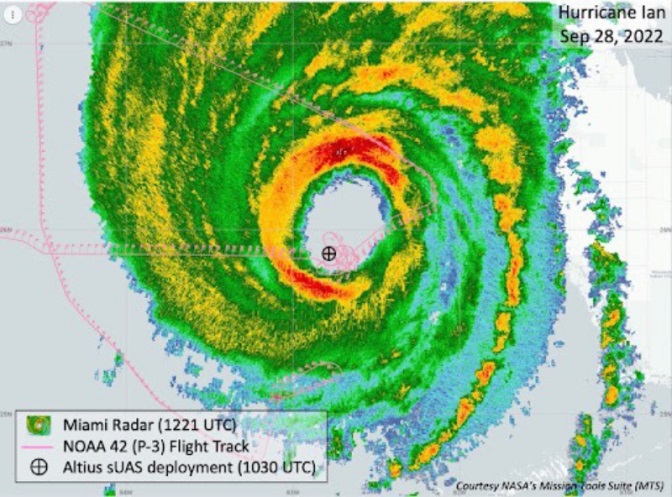
During the two-hour mission, the Altus drone flew into the eye wall, where winds of 187 mph were detected at altitudes between 2,300 and 200 feet. It’s not exactly clear whether the drone survived.
This radar image of Hurricane Ian shows the Altus release point. (Image: NOAA)
While information gathered may have assisted with the immediate forecasting for us Florida folks on the ground, the real scientific value comes from feeding the data into National Hurricane Center models for storm detection and analysis to keep us safer in the future.
Wrap up
To sum up, this month we saw drones destined for Russia sent to Ukrainian forces. Vidar artificial intelligence on Insitu ScanEagle drones promises huge gains for search and rescue. And, once again, a NOAA crew flew directly into the eye of a hurricane, this time releasing a drone to aid in gathering essential storm data.
The LightSquared/Ligado Networks saga, now in its second decade, continues. On Sept. 9, the Committee to Review FCC Order 20-48 Authorizing Operation of a Terrestrial Radio Network Near the GPS Frequency Bands of the National Academies of Sciences, Engineering and Medicine (NASEM) released its consensus study. Both sides claim the report supports their position.
According to Ligado, the report confirms the FCC’s finding that the company’s operations “can co-exist with GPS.” It cited the report’s conclusion that “the technology to enable compatibility has been in use for over a decade, and most consumer equipment, commercial general navigation, timing, cellular and aviation receivers will not experience harmful interference from Ligado’s operations.”
The NASEM report also confirmed, the company said, the FCC’s finding that “[a] small percentage of very old and poorly designed GPS devices may require upgrading.” Ligado reaffirmed its commitment to “upgrade or replace” federal equipment negatively impacted by its operations and expressed its hope that now the Department of Defense (DOD) and the National Telecommunications and Information Administration “will stop blocking Ligado’s license authority and focus instead on working with Ligado to resolve potential impacts relating to all DOD systems.”
By contrast, the GPS Innovation Alliance applauded the NASEM’s “reaffirmation that Ligado’s terrestrial operations would have a harmful, real-world impact on the millions of federal and commercial users that rely on GPS, satellite communications, and weather forecasting services every single day.” It further stated that the report “demonstrates that Ligado would pose an unacceptable risk to services critical to safety-of-life operations, our national security, and our economy” and urged “government action to address the imminent, but preventable, harm that would result from Ligado’s deployment.”
According to the DOD, the NASEM study “confirms that Ligado’s system will interfere with DOD GPS receivers, which include high-precision GPS receivers.” The study also concludes, DOD says, that the FCC’s proposed mitigation and replacement measures “are impractical, cost prohibitive, and possibly ineffective.”
The NASEM committee pointed out repeatedly in its report that matters are more nuanced than represented by either side and that test results and harmful interference depend on many factors — including the receiver’s signal processing architecture, the amount of SNR loss, the use case, and the relevant failure modes. “The determination of harmful interference is dependent on the particulars,” it said.
The committee also bemoaned “a lack of a quantifiable definition of harmful interference” and “the lack of common receiver assumptions” and called for “more definitive receiver standards.” It also pointed out that “many spectrum conflicts could be avoided if receivers were better designed and implemented.”
The GPS user base is in the billions. Therefore, even if “most” receivers will not be harmed by Ligado’s operations, as the committee reported, tens of millions of devices will be. I highly recommend reading the full report.
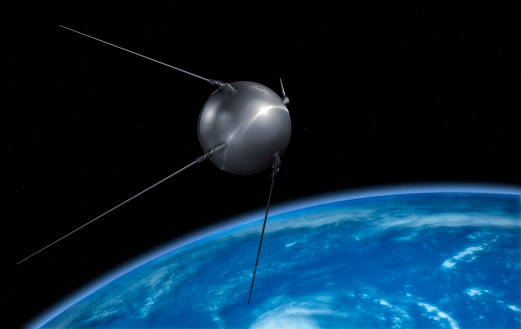
The world watched in awe and a bit of terror as the 23-inch polished metal sphere arced across the sky. Its elliptical, 65-degree declination low-Earth orbit covered virtually the entire planet. Its beep, beep, beeping could be easily heard by professional and armature radio operators alike.
The Soviet Union had just put the world’s first artificial satellite, Sputnik I, in space. It was Friday, the 4th of October, 1957.
The Soviets had gained the high ground, quite literally. The Space Race had begun. As had the West’s greatly increased focus on education in science and engineering. School children in the United States would never lack for homework again.
On Monday, the 7th of October, scientists William Guier and George Weiffenbach arrived to work at the Johns Hopkins University Applied Physics Laboratory in Laurel, Maryland. To their surprise, they found no one had been listening in on Sputnik’s signal over the weekend. So, they decided to do just that. Just for good measure, they also recorded it.
Thus began a series of events that led directly to every satellite navigation system that has come since.
Guier and Weiffenbach’s story was documented in the Johns Hopkins Technical Digest in 1997. It is a fascinating tale of discovery. I highly recommend it.
And it may be a good reason for October 7 to become “World SatNav Day.”
On Aug. 5, the National Geodetic Survey (NGS) stated it will be updating the NOAA CORS to be aligned with the latest International Terrestrial Reference frame, ITRF2020 (see below). As stated in the announcement, NGS will soon compute a third multi-year continuously operating reference station (CORS) solution, MYCS3.
The last multi-year CORS solution, MYCS2, was performed by NGS in 2019. I discussed the MYCS2 in my February 2019 and April 2019 columns. This new multi-year CORS solution will be important to the 2022 modernized National Spatial Reference System (NSRS), because NGS will establish a strict mathematical relationship between the 2022 NSRS frames and the ITRF2020 frame. This will allow direct access to the NSRS (NOAA Technical Report NOS NGS 67).
NGS Aligns National System to Global Reference Frame
August 5, 2022
The International Global Navigation Satellite System (GNSS) Service, which provides GNSS data products globally, recently released a new GNSS-only version of the International Terrestrial Reference Frame. This provides GNSS users access to the reference frame through coordinate functions for a global set of reference stations. In response, NGS will soon compute the multi-year Continuously Operating Reference Station (CORS) Solution 3, which will modernize the National Spatial Reference System. Aligning the National Spatial Reference System with the updated global reference frame will allow greater access for the global community of scientists, educators, and commercial users of location science.
For more information, contact: Phillip McFarland
As in the past, the multi-year CORS solution will mean that the NOAA CORS coordinates will be updated to be consistent with the latest International Terrestrial Reference Frame of 2020 (ITRF2020). The International GNSS Service provides information about its GNSS products and services. Readers can find information on the latest International Terrestrial Reference Frame 2020 here. This column will provide basic information on the ITRF2020. Please note: NGS stated that it will soon start computing the third multi-year CORS solution, but — as of October — all NOAA CORS coordinates are still based on MYCS2 and provide coordinates in ITRF2014 epoch 2010.00 and NAD 83 (2011, MA11, PA11) epoch 2010.00. As in the past, NGS will provide advance notice before publishing the results of its third multi-year CORS solution.
A document on the ITRF website stated the ITRF2020 is expected to be an improved solution compared to the previous solution, ITRF2014. It listed several innovations introduced in the ITRF2020 processing.
ITRF2020 is the new realization of the International Terrestrial Reference System. Following the procedure already used for previous ITRF solutions, the ITRF2020 uses as input data time series of station positions and Earth Orientation Parameters (EOPs) provided by the Technique Centers of the four space geodetic techniques (VLBI, SLR, GNSS and DORIS), as well as local ties at colocation sites. Based on completely reprocessed solutions of the four techniques, the ITRF2020 is expected to be an improved solution compared to ITF2014. A number of innovations were introduced in the ITRF2020 processing, including:
The time series of the four techniques were stacked all together, adding local ties and equating station velocities and seasonal signals at colocation sites;
Annual and semi-annual terms were estimated for stations of the 4 techniques with sufficient time spans;
Post-Seismic Deformation (PSD) models for stations subject to major earthquakes were determined by fitting GNSS/IGS data. The PSD models were then applied to the 3 other technique time series at earthquake colocation sites.
The box below provides a good summary of the International Reference Frame and why it’s important to the scientific community as well as the surveying and mapping community. Readers can download the article from the June 2022 International GNSS Service Issue 4 newsletter. Users also can sign up to receive notices and newsletters from the International GNSS Service.
What is the current rate of sea level rise in different regions of the globe? How does our Earth deform under the effect of plate tectonics, seismic phenomena, or the melting of ice caps? How the Earth’s center of mass is varying? How to determine the position of a point on the surface of a constantly deforming Earth and compare it to positions estimated decades apart? The answers to these fundamental questions for understanding the dynamics of our planet require the availability of a global, long-term stable terrestrial reference frame, but preferably a standard reference so to ensure interoperability and consistency of various measurements collected by sensors on the ground, or via artificial satellites. The International Terrestrial Reference Frame (ITRF) is the standard reference recommended by a number of international scientific organizations, including the International Union of Geodesy and Geophysics (IUGG) and the International Association of Geodesy (IAG) for earth science, satellite navigation and operational geodesy applications. The ITRF is an international effort that is built on the investments of space and mapping agencies, universities and research groups in operating geodetic observatories, archiving and analyzing the collected geodetic observations to derive not only the ITRF, but also critical geodetic products for science and society.
The ITRF integrates and unifies technique-specific reference frames provided by the four IAG’s international services of space geodetic technique (DORIS/IDS, GNSS/IGS, SLR/ILRS, VLBI/ IVS). It is supplied to the users in the form of temporal coordinates of more than 1500 stations, Earth Orientation Parameters, as well as parametric functions describing nonlinear station motions: seasonal signals due to mainly loading effects and post-seismic deformations for sites subject to major earthquakes. It is necessary to regularly update the ITRF (approximately every 5 years) in order to benefit from continuous observations so to improve its accuracy, considering station position temporal variations due to geophysical phenomena.
The ITRF is maintained by a research group at IGN-France and IPGP (Institut de Physique de Globe de Paris), and whose new release called ITRF2020 was published on April 15 and accessible here: https://itrf.ign.fr/en/solutions/ITRF2020. The ITRF2020 brings significant improvements compared to previous achievements: it confirms the estimate of the position of the center of mass of the Earth as it was determined in 2016, but also provides its seasonal variations; it improves the accuracy of the scale of the frame at the millimeter level, which represents a gain in precision of a factor of 8 on the measurement of the size of the Earth (compared to that determined in 2016); it provides a precise quantification of co- and post-seismic displacements caused by devastating earthquakes, such as that of Sumatra in 2004, Chile in 2010 and Japan in 2011. The IAG Services rely on the ITRF to align their geodetic products to it, and therefore disseminate it widely among the various users. In particular, using the IGS products, such as the orbits, allows a universal access in space and time to the ITRF.
As stated in the article by Zuheir Altamimi, ITRF2020 involves IAG’s international services of four space geodetic techniques: DORIS/IDS, GNSS/IGS, SLR/ILRS, VLBI/ IVS. Computing an International Terrestrial Frame is very complex and requires analyses of difference types of geodetic and geophysical data. It is beyond the scope of this column, but online is more detailed technical information.
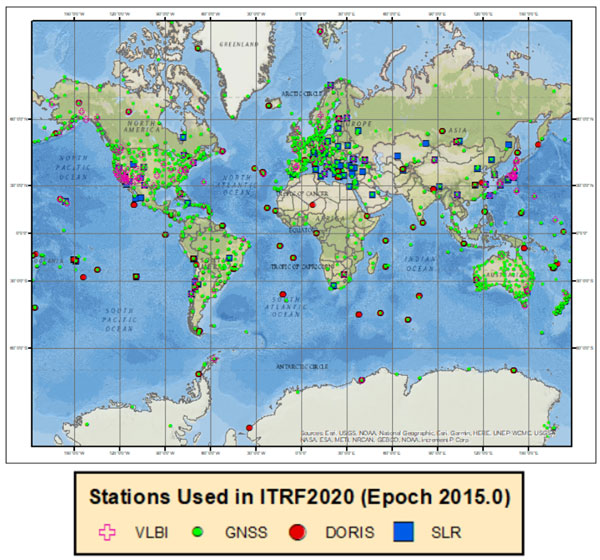
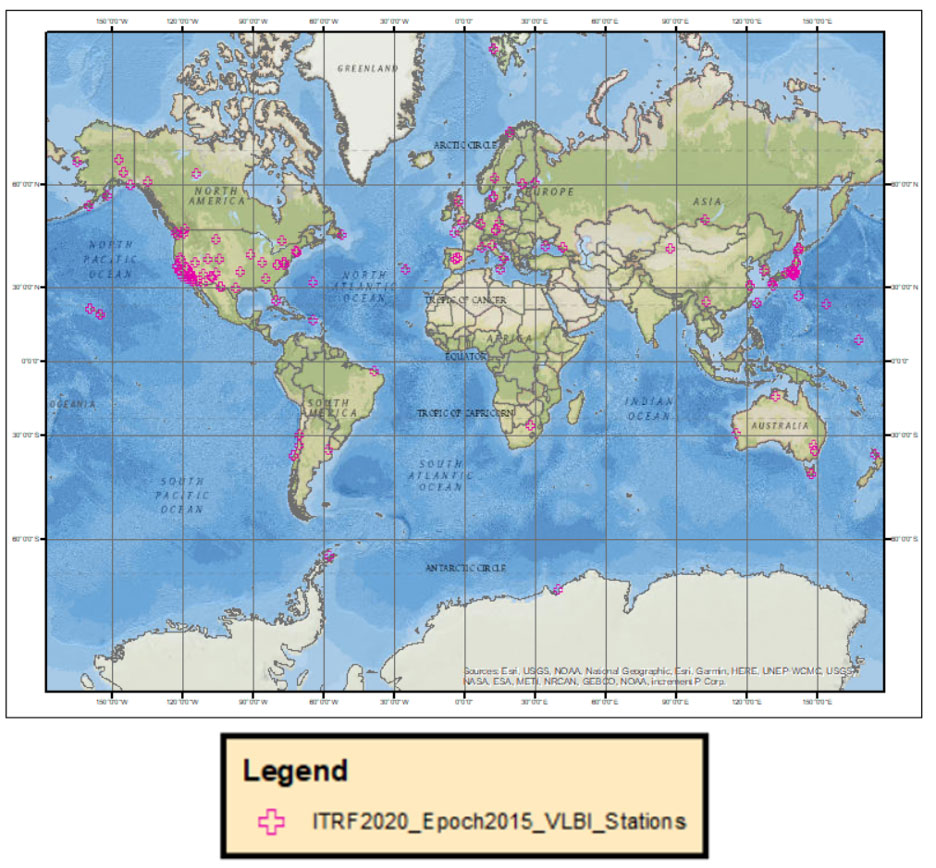
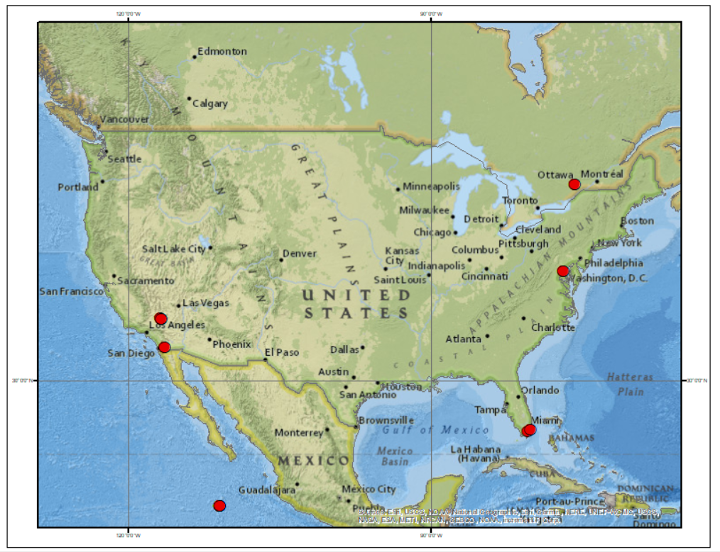
For this column, I downloaded the station lists from the four space geodetic techniques and provided a few plots that depict the location and velocities of these sites. The box below depicts the location of the space geodetic techniques around the world. As indicated in the plot, some locations have more than one technique collocated at the same site.
Plot of the Four Different Space Geodetic Techniques
Image: Dave Zilkoski
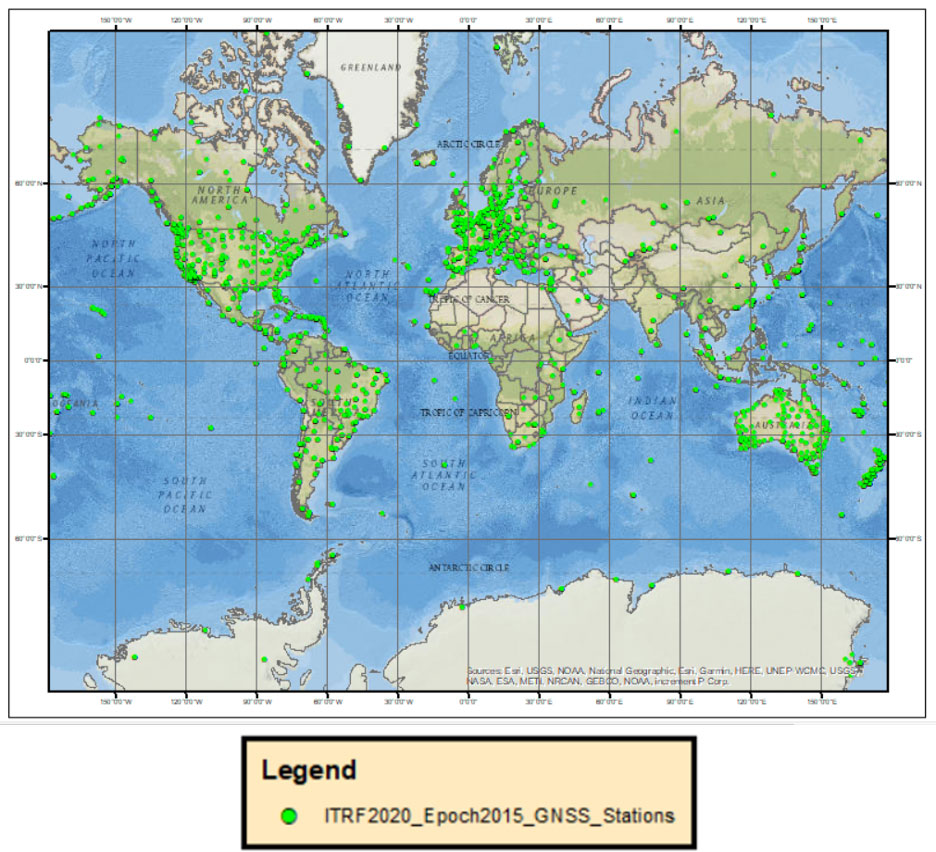
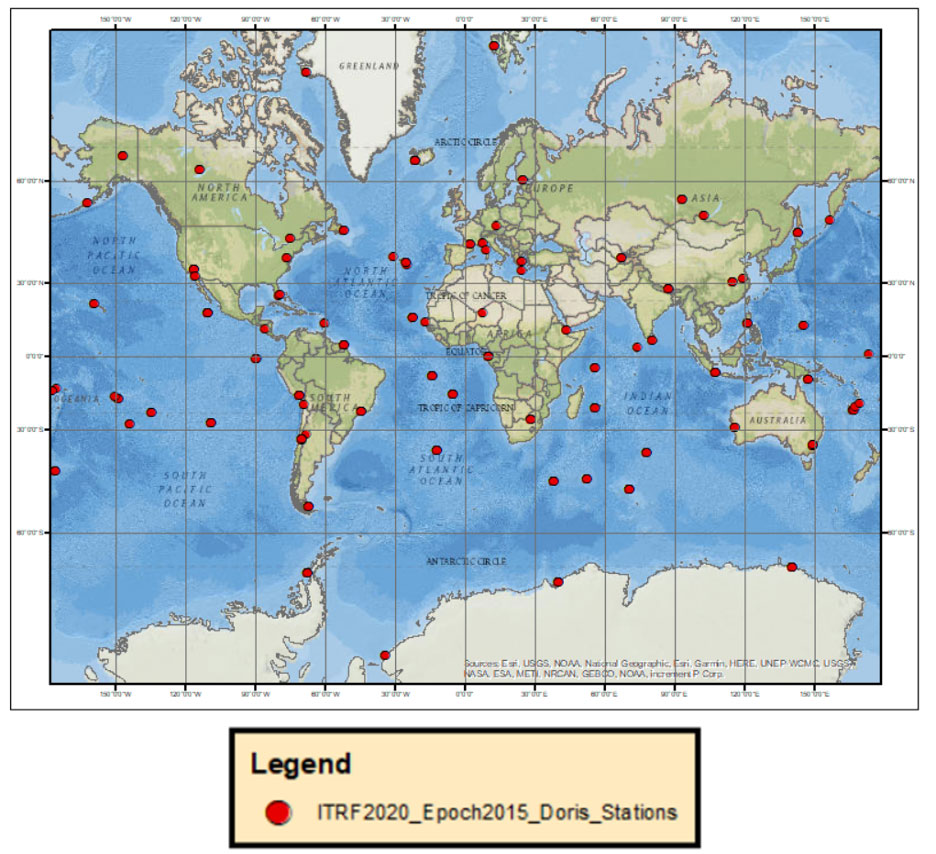
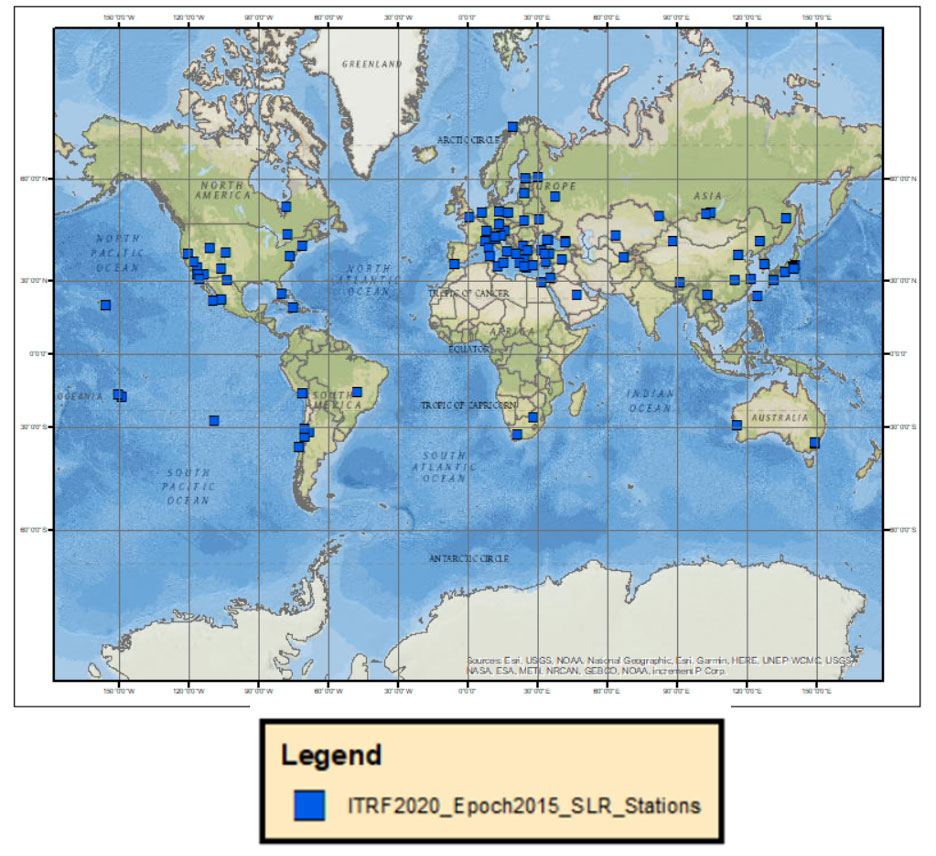
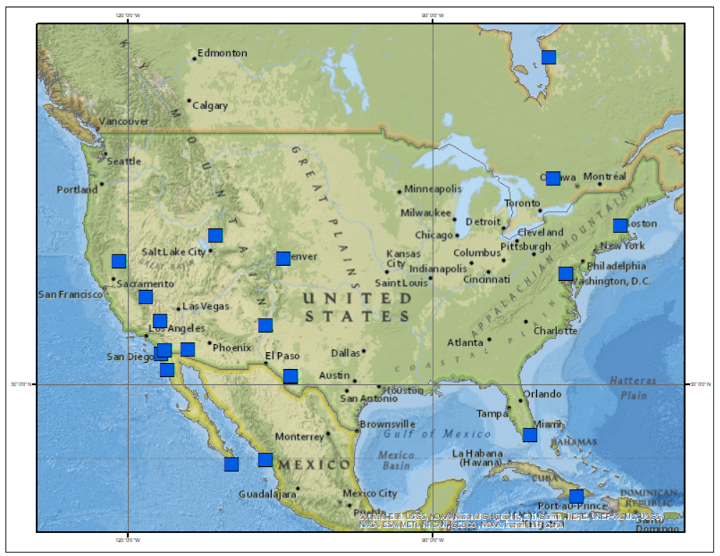
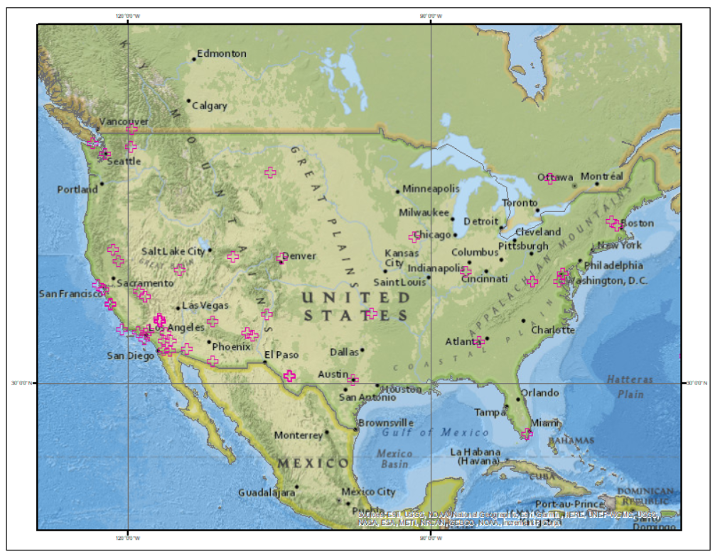
The following plots depict the locations using each space geodetic techniques: GNSS sites, DORIS sites, SLR sites and VLBI sites.
Plot of GNSS Sites
Image: Dave Zilkoski
Plot of DORIS Sites
Image: Dave Zilkoski
Plot of SLR Sites
Image: Dave Zilkoski
Plot of VLBI Sites
Image: Dave Zilkoski
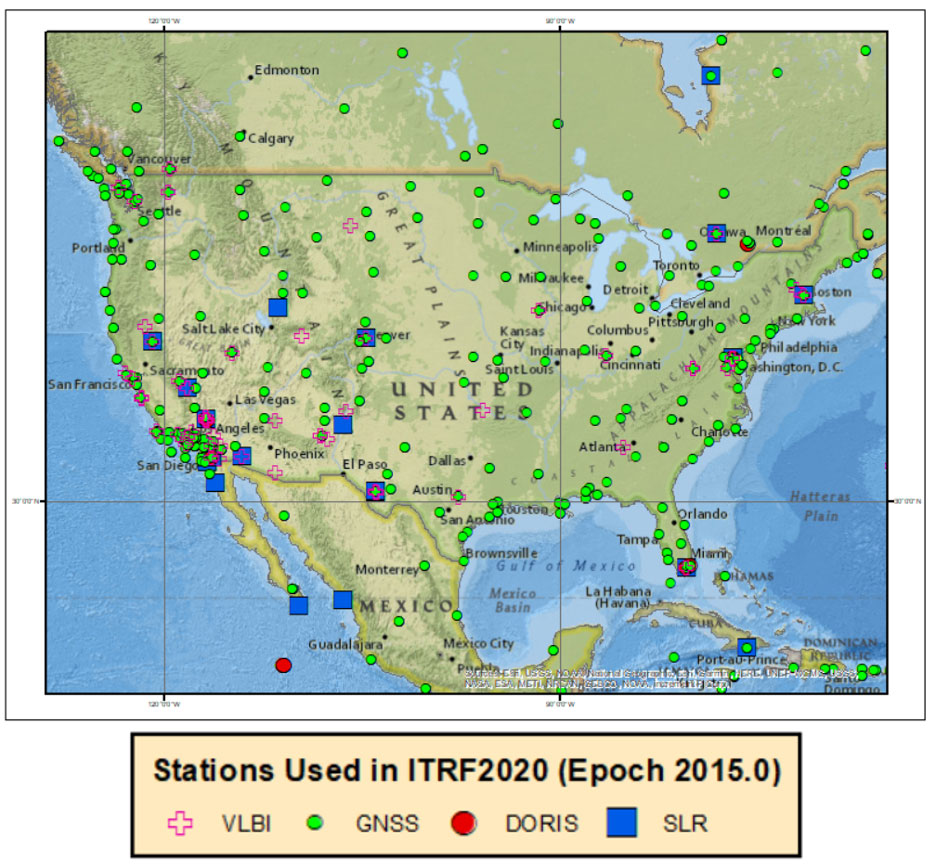
The box below shows the location of the techniques in the conterminous United States.
Plot of the Four Different Space Geodetic Techniques in the CONUS
Image: Dave Zilkoski
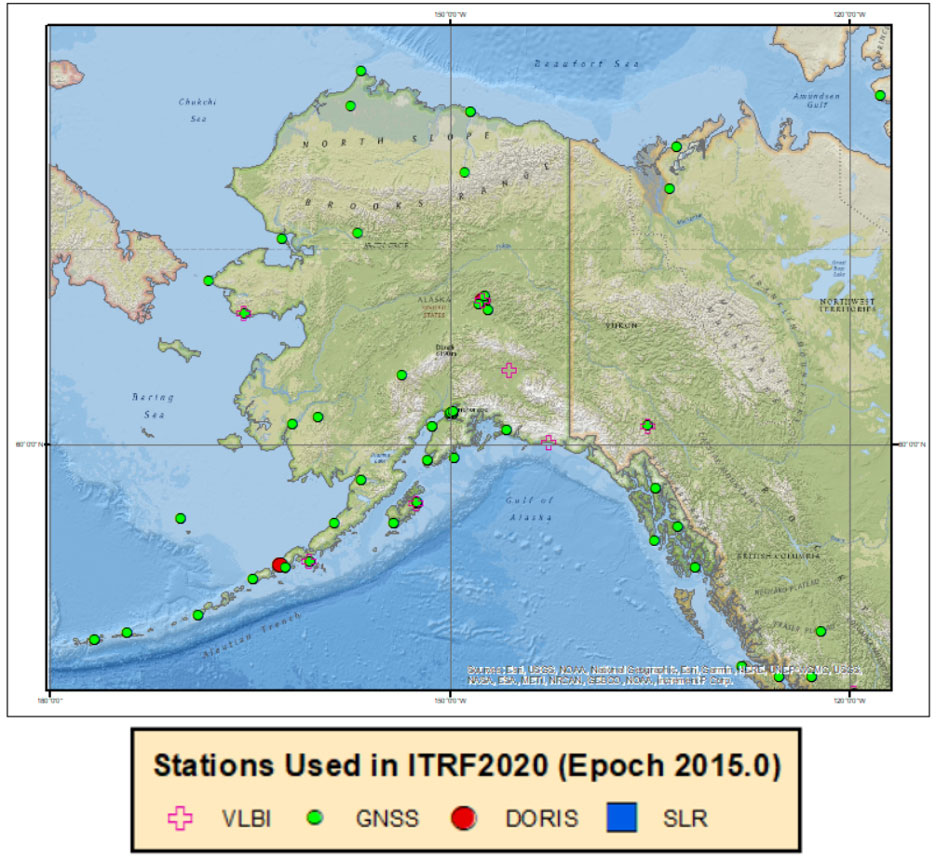
The plot below depicts the sites in the state of Alaska.
Plot of the Four Different Space Geodetic Techniques in the Alaska
Image: Dave Zilkoski
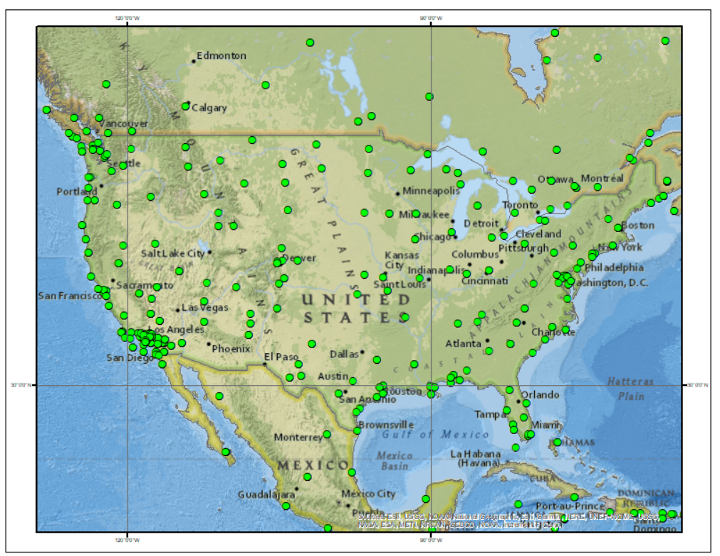
The images below depict each of the four space geodetic techniques in the conterminous United States.
Plots of the Space Geodetic Techniques by Technique in the CONUS
Plot of GNSS Sites in CONUS Image: Dave ZilkoskiPlot of DORIS Sites in CONUS (Image: Dave Zilkoski)Plot of SLR Sites in CONUS (Image: Dave Zilkoski)Plot of VLBI Sites in CONUS (Image: Dave Zilkoski)
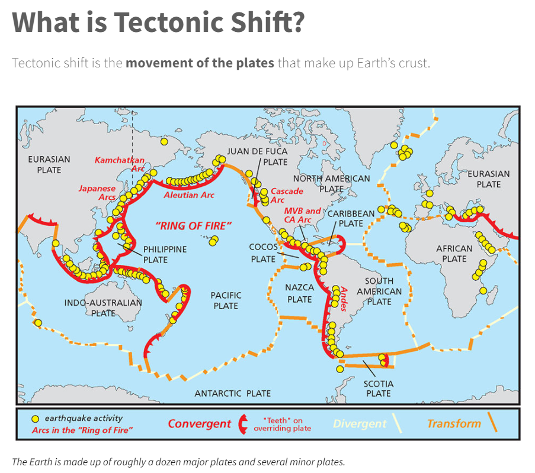
Altamimi’s article on the ITRF2020 stated it is “necessary to regularly update the ITRF (approximately every 5 years) to account for station position temporal variations due to geophysical phenomena.” My February 2022 column discussed the tectonic plates and why is it necessary to account for movement in a geodetic reference frame. As I stated then, coordinates basically change because the Earth’s surface is moving due to the movement of major tectonic plates. See the box titled “What is Tectonic Shift?” for information about why it is called plate movement or tectonic shift. The world’s geodesists understand this and are attempting to manage the changing coordinates by providing a time-dependent component of the international terrestrial reference frame.
Image: National Ocean Service websiteImage: National Ocean Service website
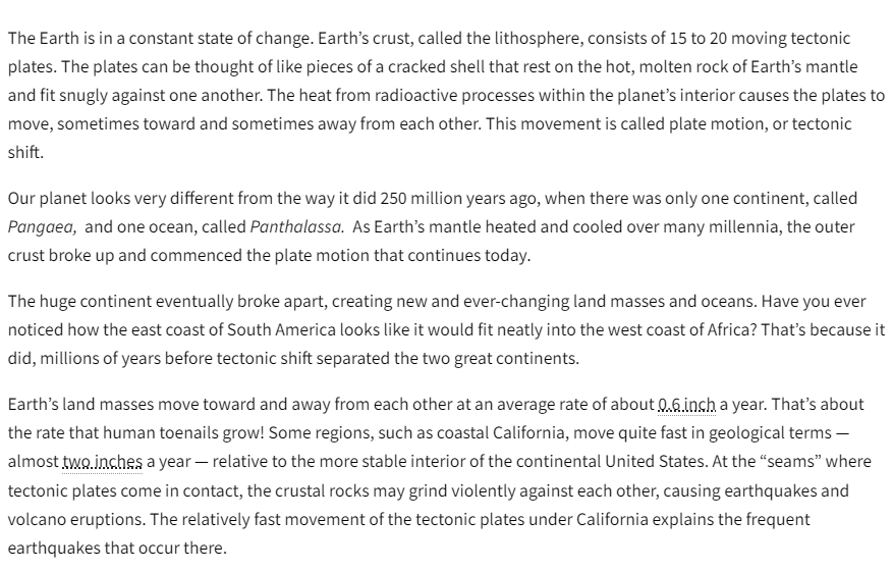
The box below depicts the horizontal velocity based on the ITRF2020 velocities (downloaded on 08/12/2022).
Plot of the Horizontal Velocity Vectors based on the ITRF2020 Velocities
Image: Dave Zilkoski
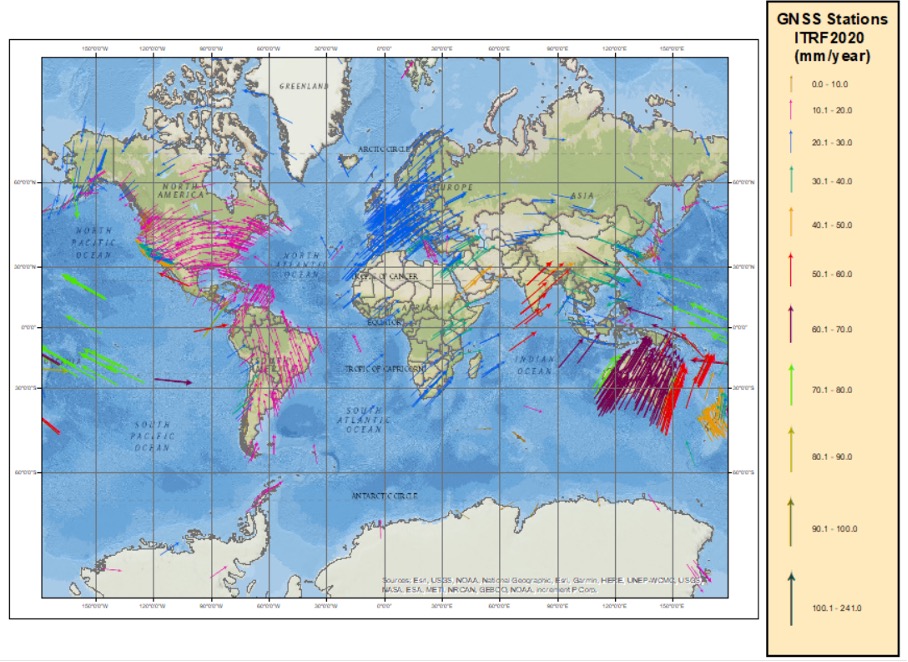
The box below depicts the horizontal velocities in the North America. These vectors look very similar to the velocities reported in my February 2022 column.
Plot of the Horizontal Velocity Vectors in North America based on the ITRF2020 Velocities
Image: Dave Zilkoski
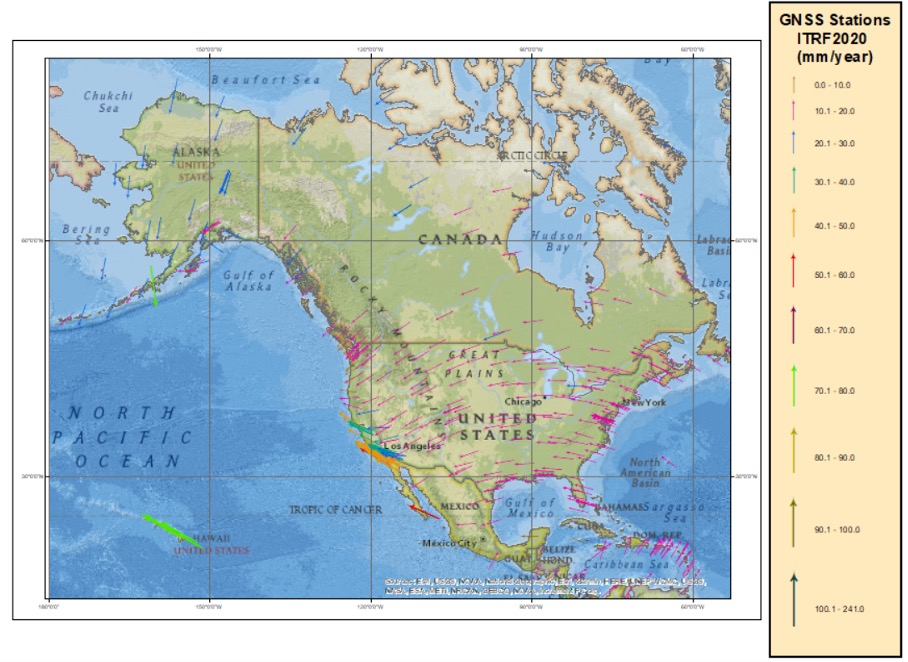
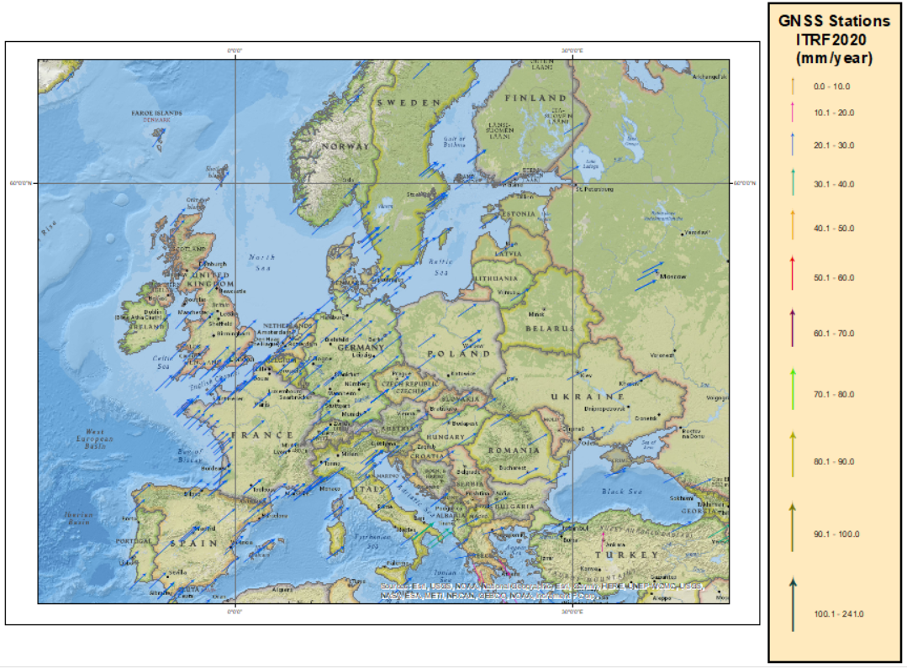
For a comparison to North America vectors, the box below depicts the velocity vectors in Europe.
Plot of the Horizontal Velocity Vectors in Europe based on the ITRF2020 Velocities
Image: Dave Zilkoski
They are similar in magnitude, but not in direction. Once again, looking at the map of tectonic plates, North America is located mostly on the North American plate and Europe is on the Eurasian plate.
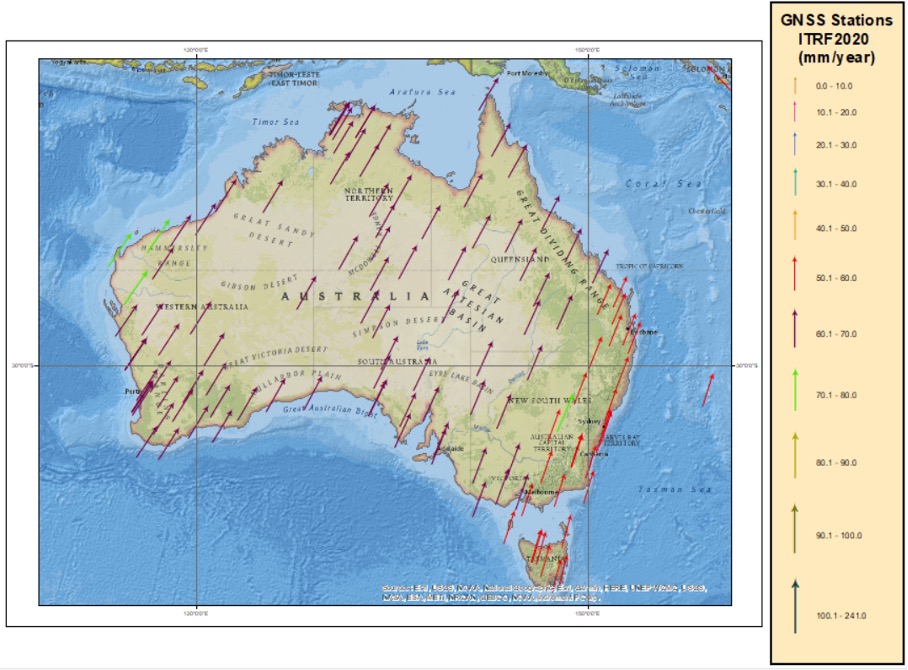
Australia is on the Indo-Australian plate and has some fairly large horizontal velocities vectors. See the box below.
Plot of the Horizontal Velocity Vectors in Australia based on the ITRF2020 Velocities
Image: Dave Zilkoski
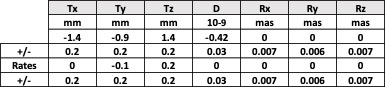
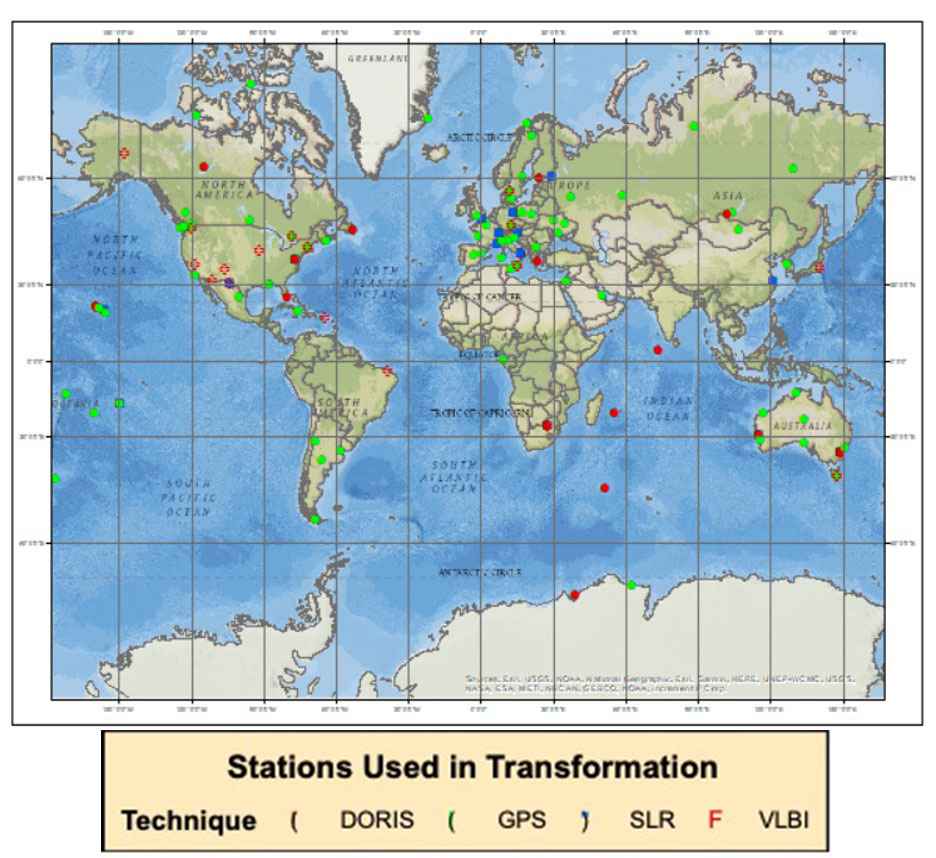
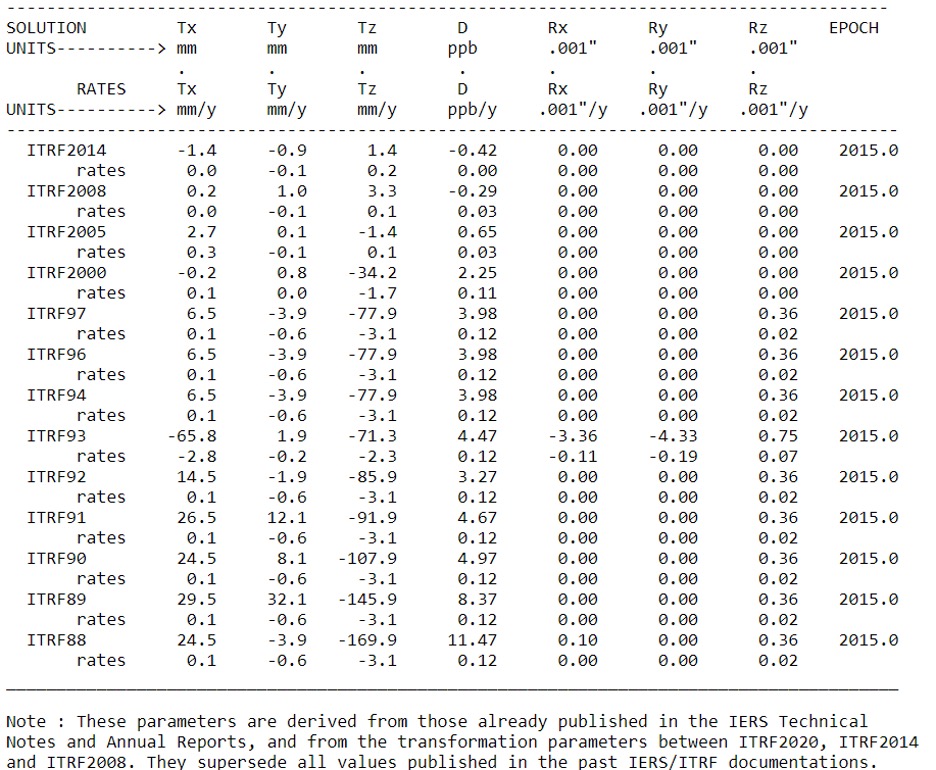
So, what’s the difference between ITRF2014 and the new ITRF2020? The box below provides the 14 transformation parameters from ITRF2020 to ITRF2014. These transformation parameters have been estimated using 131 stations located at 105 sites. See the box “Plot of the Stations used in the Transformation Parameters from ITRF2020 to ITRF2014” for the location of these stations. Notice that the translation values in X,Y,Z are very small (<1.5 mm) between the two reference frames.
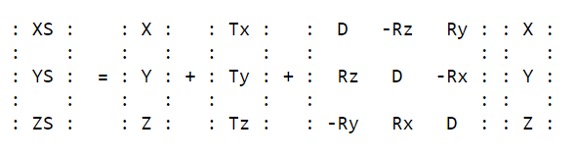
Transformation Parameters from ITRF2020 to ITRF2014
X,Y,Z are the coordinates in ITRF2020, and XS,YS,ZS are the coordinates in ITRF2014.
Plot of the Stations used in the Transformation Parameters from ITRF2020 to ITRF2014
Image: Dave Zilkoski
The transformation parameters from ITRF2020 and past ITRFs are provided in the table below. As indicated in the table, most of the changes in X,Y and Z are very small since ITRF2005.
Transformation Parameters from ITRF2020 to Past ITRFs
As previously stated, the third multi-year CORS solution will be important to the new 2022 modernized National Spatial Reference System (NSRS) because NGS will establish a strict mathematical relationship between the 2022 NSRS frames and the ITRF2020 frame. This will allow direct access to the NSRS, according to NOAA Technical Report NOS NGS 67. Again, there will not be any changes to NGS’s NOAA CORS coordinates due to ITRF2020 until NGS completes its third multi-year CORS solution.
Users can receive emails about the latest NGS News by signing up for NGS’s newsletters. These notices will highlight the release of new products, updates to existing services, progress reports for major projects, information about upcoming NGS-sponsored events, and job opportunities at NGS.
“Precautionary principle: The principle that the introduction of a new product or process whose ultimate effects are disputed or unknown should be resisted.” — Oxford Languages
Photo: U.S. Fish and Wildlife Service
The Arctic National Wildlife Refuge spans almost 20 million acres. It is home to a vast array of wildlife from tiny pollinating flies to giant grizzly and polar bears.
It also has oil. Lots of oil.
Getting that oil out of the ground and to market would create jobs and benefit commerce. It would also harm the environment. Some wildlife would suffer.
Many argue the long-term harms of drilling outweigh the short-term benefits. The Biden administration agrees and has banned drilling to protect the refuge’s environment and wildlife.
The administration has taken a similarly conservative approach to preserving the spectrum environment for satellites.
Like the previous administration, it has urged the Federal Communications Commission (FCC) to not allow Ligado Networks’ use of frequencies adjacent to spectrum assigned to GPS and Iridium Communications. The concern is that Ligado’s more powerful transmissions will harm some existing users.
A recent report by the National Academies of Sciences, Engineering and Medicine validated that concern. As is the case with many complex environmental issues, the total number of impacted individuals, and the total negative impact to the nation, are unknown. They may be unknowable.
As an independent agency, the FCC gets recommendations from, but does not report to, the administration. To date it has not been swayed by formal appeals from the executive branch, nor by those from numerous industry and non-profit groups, to rescind its decision allowing Ligado to operate.
Like other agencies making environmental decisions, the commission should use the “precautionary principle” when thinking about new uses and users. It is a well-recognized and systematic method of linking science and public policy.
increasing public participation in decision making
shifting the burden of proof to the proponents of an activity
taking preventive action in the face of uncertainty
exploring a wide range of alternatives to possibly harmful actions.
The first three of these were part of the FCC’s process in its Ligado decision, though critics of the outcome might question how rigorously each was applied:
Hundreds of public comments were received before the order was issued.
Critics note that opposition to the FCC’s eventual course of action was expressed by stakeholders across a very a broad spectrum of society.
The applicant, Ligado, was required to bear the burden of proof.
However, as the National Academies report says, different assumptions in Ligado’s analysis led it to an entirely different conclusion from studies done by the Department of Transportation.
The FCC order allowing Ligado to operate includes “preventative actions.”
Yet many see these preventative measures as unworkable window dressing. In the staid and reserved phrasing of the National Academies report, they “may in some cases not be practicable within operationally relevant time and financial parameters.”
Regardless of the virtues or sins of its process to date, the FCC’s path forward must hinge on the final tenant of the precautionary principle: “Exploring a wide range of alternatives in the face of uncertainty.”
The most obvious, simplest, and straightforward of these alternatives is for the FCC to assign Ligado different frequencies, ones more distant from those used by space-based applications.
Admittedly, this path is only “simple and straightforward” in concept. It will require restarting the frequency allocation process nearly from the beginning, detailed analyses, complex negotiations, and difficult decisions.
Yet the current situation means certain harm to an unknown but significant number of GPS and Iridium users. Harm that could, in some instances, be severe. Even life-threatening.
It also means harm for Ligado. As things stand now, the company will always be under a cloud in the minds of federal officials and other GPS and Iridium users. Ligado will also undoubtedly be blamed for a variety of problems not of its doing from solar weather to criminal jamming. And a significant mishap related to company-caused interference could cause it extreme harm. Perhaps even bringing about Ligado’s demise.
The radio frequency spectrum is a limited and critical national resource. The FCC’s desire to use it to best advantage is necessary and appropriate. This, however, requires great care to safeguard the overall environment and existing users.
Resolving the “Ligado issue” will require creativity and a departure from the adversarial approach that has characterized the FCC process to date. Let’s hope that as the commission reconsiders the issue, it finds a way for everyone to come out ahead.
Technology changes the rules of the game, and surveying may be more in its crosshairs than the profession will admit
Maps have existed for centuries. The lines on maps indicating the boundaries of political and administrative units — cities, counties, states, and countries — are graphic representations of the limits of those entities. These lines don’t, however, typically exist in real life. There isn’t a large line between the United States and Canada stretching from the Pacific Ocean, through the Great Lakes, and onto the Atlantic Ocean.
The same goes for latitude and longitude lines on maps and globes. The public generally accepts the various delineations on maps as being somewhat accurate with an unwritten level of trust in those who have produced these maps.
Definition
trust: assured reliance on the character, ability, strength, or truth of someone or something.
Here are the guidelines surveyors use for determining surveys.
lines physically verified in the field and proven from evidence
monuments and/or boundaries set and called for within legal descriptions
natural monuments
artificial monuments
adjoiners (to determine junior/senior rights)
courses
bearings, then distances (metes and bounds states)
distances, then bearings (public land survey states)
recitation of area
controlling description
evidentiary description
coordinates: local and/or geodetic
Surveyors rely on physical monuments, title documents and evidence of occupation to assist with the establishment of not just major dividing lines, but all lines of property, public or private. Finding, setting and honoring physical monuments has been a significant character trait of the surveyor for as long as maps have existed.
Monuments are placed to determine the endpoints of these lines as depicted on maps or plats, but what happens when technology introduces new ways to re-establish these lines? What will happen to our monuments when technology — more specifically those who utilize them — deems them obsolete?
The guidelines above are known as “priority of calls” or “rules of construction” by the surveying community. These items have provided the instructions for surveyors to follow in retracement of lines for many years. However, like nearly everything else in our modern world, technology has a hand in modernizing even this time-honored “surveyor’s code of retracement.”
Who would have guessed that the rotary phone dial would give way to touch-tone buttons, that the system would jump from landlines to cellular and satellite signals to remote handsets, then progress to receivers evolving away from physical buttons to touchscreens?
Technology changes the rules of the game, and surveying may be more in its crosshairs than the profession will admit.
Here come the numbers
Note that the last entry in the above guidelines for survey retracement is “coordinates.” In accordance with most accepted lists, coordinates can be local or geodetic. These coordinate values are generated by surveyors, geodesists and public agencies; they can be found on plats, and in records and websites kept by government agencies.
Now that we are more than two decades into the 21st century, it would be safe to say that most of the surveying profession uses an established geodetic coordinate system. The use of GNSS receivers is widely accepted as normal practice by many surveyors because these systems are much more user friendly than in years past. Additional constellations have added to the availability and accuracy of GNSS positional values, so utilizing state plane coordinates has become the norm.
We are now surrounded by something that has an incredible impact on our profession and the world around us. We are placing trust in a georeferenced coordinate system that cannot be identified by any of our senses, like we can with a physical monument.
A coordinate cannot be seen, touched, tasted, heard or smelled.
We are placing our full trust in a reliable position on Earth as determined by our GNSS receiver working within a published coordinate system. Because of these advancements in technology, a new generation of geospatialists is insisting we should revise the way we survey, because technology provides much higher precision and accuracy.
Just like lines on a map or plat, coordinates only exist as a calculation of a position on the face of Earth. So why is there animosity in trusting coordinates over the more traditional items on the list of retracement guidelines? It may have to do with the fact that the ground we are surveying is not in the same place it was a short time ago. Depending on where you live, it may have moved more than you think. For more information on the shifting ground we live on, let us dig into some research about our continents.
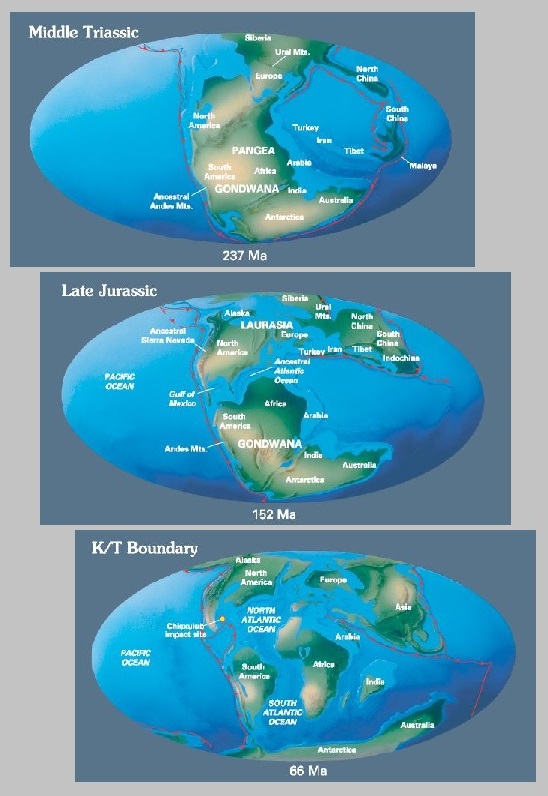
From about 300-200 million years ago (late Paleozoic Era until the very late Triassic), the continent we now know as North America was continuous with Africa, South America and Europe. They all existed as a single continent called Pangea. Pangea first began to be torn apart when a three-pronged fissure grew between Africa, South America and North America. Rifting began as magma welled up through the weakness in the crust, creating a volcanic rift zone. Volcanic eruptions spewed ash and volcanic debris across the landscape as these severed continent-sized fragments of Pangea diverged. The gash between the spreading continents gradually grew to form a new ocean basin, the Atlantic. The rift zone known as the mid-Atlantic ridge continued to provide the raw volcanic materials for the expanding ocean basin.
Meanwhile, North America was slowly pushed westward away from the rift zone. The thick continental crust that made up the new east coast collapsed into a series of down-dropped fault blocks that roughly parallel today’s coastline. At first, the hot, faulted edge of the continent was high and buoyant relative to the new ocean basin. As the edge of North America moved away from the hot rift zone, it began to cool and subside beneath the new Atlantic Ocean. This once-active divergent plate boundary became the passive, trailing edge of westward moving North America. In plate tectonic terms, the Atlantic Plain is known as a classic example of a passive continental margin.
Today, the Mesozoic and Cenozoic sedimentary rock layers that lie beneath much of the coastal plain and fringing continental shelf remain nearly horizontal.
Image: USGS
In geologic terms, a plate is a large, rigid slab of solid rock. The word tectonics comes from the Greek root “to build.” Putting these two words together, we get the term plate tectonics, which refers to how the Earth’s surface is built of plates.
The theory of plate tectonics states that the Earth’s outermost layer is fragmented into a dozen or more large and small plates that are moving relative to one another as they ride atop hotter, more mobile material. Before the advent of plate tectonics, however, some people already believed that the present-day continents were the fragmented pieces of pre-existing larger landmasses (“supercontinents”).
The diagrams below show the break-up of the supercontinent Pangaea (meaning “all lands” in Greek), which figured prominently in the theory of continental drift — the forerunner to the theory of plate tectonics.
Image: USGS
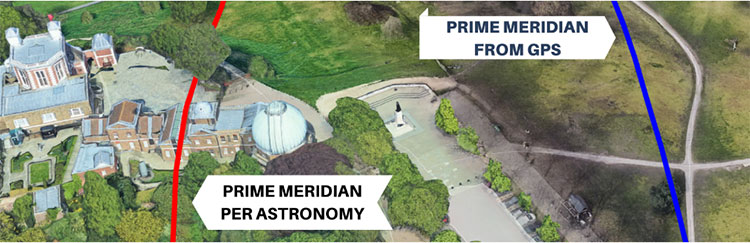
Continental drift, plate tectonics and prime meridians
Historians and other scientists have theorized about Pangea for centuries. Common soil types, fossils, and other evidence found on different continents help to solidify the concept of Pangea. Items discovered on the west coast of Africa have many similarities with those found on eastern South America. The physical evidence is quite convincing that an earlier supercontinent existed millions of years ago.
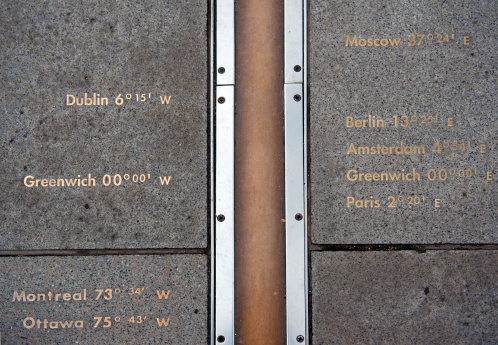
Now, let’s apply a fixed measurement system with lines upon Earth that defines latitude and longitude. In the past, geodesists, geographers and mathematicians established various “prime meridians” around the world to serve as a basis for maps. Locations and cities used included Amsterdam, Antwerp, the Bering Strait, Bern, Brussels, Copenhagen, Florence, Giza, Jerusalem, Kyoto, Lisbon, Madrid, Naples, Oslo, Paris, Philadelphia, Pisa, Rio de Janeiro, Rome, Stockholm, Warsaw and Washington, D.C. (in four different places!), just to name a few.
Thankfully, scientists gathered in the 19th century to agree upon a singular “initial meridian” that would pass through Greenwich, England, and was based upon several centuries of astronomical observations at the nearby Royal Observatory.
For approximately 100 years, mapmakers (and geodesists) used the new Prime Meridian at Greenwich as the beginning baseline for longitude determination around the world. After all, it was based upon years of astronomical observations and solved the age-old problem of where longitude starts. (Latitude was a much easier calculation for astronomers and geodesists, but that story is for another day.)
The late 20th century and the fourth industrial revolution
Technology, once again, provides us with conflicting results. While most technological advancements are game-changing improvements to mankind, they also tend to shake up information and standards that have existed for many generations. Like the previously discussed advancements in telephones, technology makes us change the way we look at things and how we go about our lives.
Mapping has become a central part of our everyday lives. Georeferenced positions for literally everything is now a standard characteristic of many functions within our environment, especially in our surveying world. Most of these improvements are due to GPS, which was originally developed for the U.S. military to guide and assist with positional location of our defense systems in relation to our enemies. We use this same precise technology to establish positional locations for boundary points, infrastructure and topographic information.
Image: Tim Burch
We have also used GPS to learn much about our tectonic plates and varying movement of the continents.The first thing we learned is that the Prime Meridian established in 1884 does not fall in the same place as our 0° latitude designation as determined by GPS/GNSS calculations.
This finding, however, is not the telling item within our adaptation of GPS data; it came when various agencies established the continuously operating reference system (CORS), composed of static GPS base stations. CORS stations, while used to help establish new survey positions in relation to a known reference location, also measure a continuous drift of latitude and longitude positions over time.
The National Geodetic Survey (NGS) is in the process of finalizing a new reference framework for establishing coordinate values that utilize time as a core component. Future implementation of the new National Spatial Reference System (NSRS) will require the additional attribute of time within the metadata of any new values.
So how does this affect surveying and the monuments we surveyors hold on such a high pedestal? The answer varies depending on who one asks. Most surveyors will continue to hold the “priority of calls” as listed above. Several practitioners, however, want to move coordinates higher up the list because of technology, and the ability to retrace a published point because of the increase in technology and the higher accuracy and precision of today’s GNSS.
This is possible if the user of the technology follows the procedures as established by NGS with metadata and accurate timing, but there are still several variables in the setting and retracing methodologies. When was the last time the equipment was calibrated? Was adequate research performed to minimize environmental errors? Was there any interference due to solar storms or multipath? There are many potential issues a surveyor can face, but few are checking all the boxes when performing highly accurate and precise positional measurements.
Technology has brought surveying into the 21st century with GPS/GNSS and ever-increasing accuracy and precision. It should also be the profession’s goal that the technology does not override what the general public can see. They can see monuments, fence lines, buildings and other improvements, but they cannot see coordinates, which remain invisible to the naked eye. Technology may change that in the future, too, but until that time, we must rely on what we can see.