Plus: UAVs in Ukraine, vineyard protection and a royally awesome light show
Taser-equipped drones
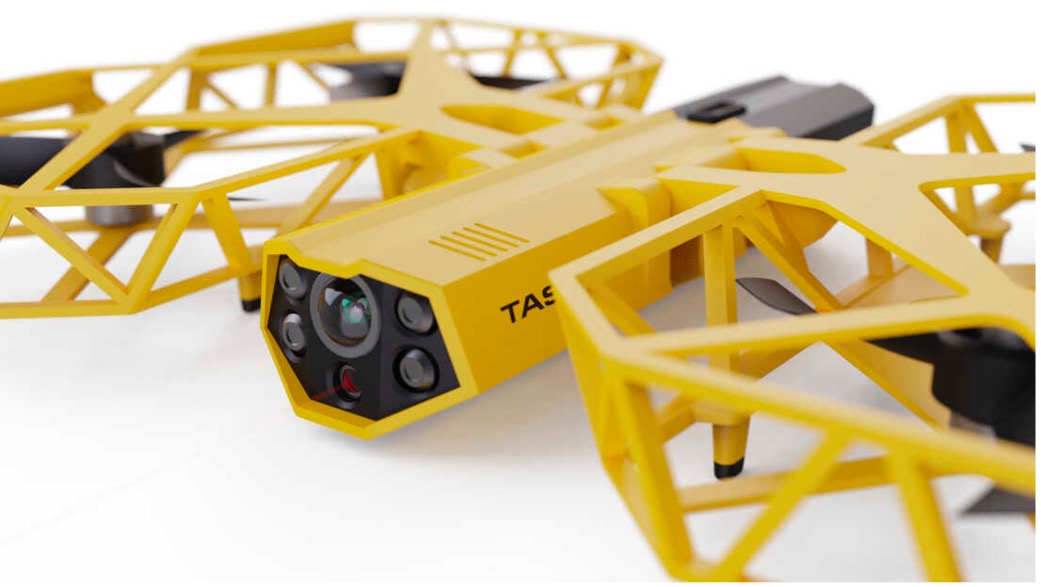
We hear of mass shootings in schools, and this week on a crowded street in Philadelphia a school adviser was among those killed. Everyone continues to be outraged, but as we wait for any sort of positive, preventive action by our leaders, an idea from a drone developer was shut down before it even got out of the company.
Axon taser drone concept. (Photo: Axon)
Axon Air supplies Tasers and body cameras to police forces, and last year someone came up with the idea of loading a drone with a Taser so that it could find and suppress a gunman in a school. There are a lot of problems with the idea, and Axon’s own internal artificial-intelligence board nixed the idea.
Doors were the board’s primary concern. What happens if something triggers a drone to Taser kids in the classroom or hallway? Could autonomous drones or even multiple intelligent cameras detect an actual weapon of any description, and set off an automated response?
We use metal detectors on entry to some schools to deter carrying weapons to class, but how about recognizing carried weapons in the school? To even attempt an automated drone response, you would need multiple Taser-equipped drones in all areas of a school, as well as time to test and verify that any autonomous response would work correctly.
Could anything along these lines be something we might consider in any way?
Keeping watch at vineyards
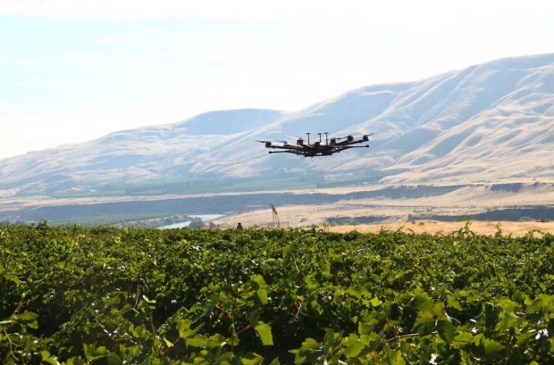
A team at Washington State University (WSU) has come up with a new twist on an old idea. Hawks have been trained effectively in the past to chase off flocks of birds on or around runways at airports or to protect crops. Now WSU has developed a system that uses intelligent cameras to detect birds, and which is then able to dispatch drones to the invaded area to chase off the birds.
The system has been tested to protect local grapevines. Bird fruit losses were actually reduced by ~50% following manual drone flights, which also reduced the number of bird invaders four-fold.
Manually flown drone patrols over vineyard. (Photo: WSU Agricultural Automation and Robotics Lab)
Nevertheless, birds can learn over time how to get round such deterrence, so WSU proposes disguising drones as predator birds and arming them with distress calls or raptor-attack behavior. WSU is looking for wine-industry support to develop this approach into a feasible, deployable solution.
Grey Eagles might fly in Ukraine
The United States is considering providing Grey Eagle UAVs (the Army version of the Predator) to Ukraine — the first time a relatively high-tech drone with weapon-carrying capability would be supplied for the Ukrainian conflict.
The Grey Eagle can carry up to eight hellfire missiles, fly for 30 hours at relatively high altitude, and gather masses of surveillance information — a formidable, front-line weapon/reconnaissance system. Four UAVs are envisaged; missiles would not be included in the first round, but would likely come soon after.
Grey Eagle drone (Photo: General Atomics)
Th Grey Eagle UAV system usually requires months of advanced training, but the Ukrainian forces have already been operating the smaller missile-carrying Turkish Bayraktar-TB2, so training may be reduced to a few weeks for operational necessity. Meanwhile, the sale must first be approved by Congress, so nothing is yet certain.
Officials with a donated TB2 drone. (Photo: Baykar)
Before the war with Russia, Ukraine purchased up to 30 TB2 drone systems, and many have seen action in the current conflict. A crowdfunding effort by a TV station in Lithuania gathered enough cash to buy yet another TB2 to help Ukrainian forces stay in the fight.
However, Baykar, the Turkish manufacturer, declined the sale, instead offering to donate a TB-2 so that the Lithuanian funding could go toward humanitarian aid for the Ukrainian people.
Meanwhile, in Estonia the Internal Security Service (KAPO) arrested a man leaving the country who is suspected of supplying commercial drones to the Russian forces.
Photo: Platinum Jubilee Committee
Honoring the Queen
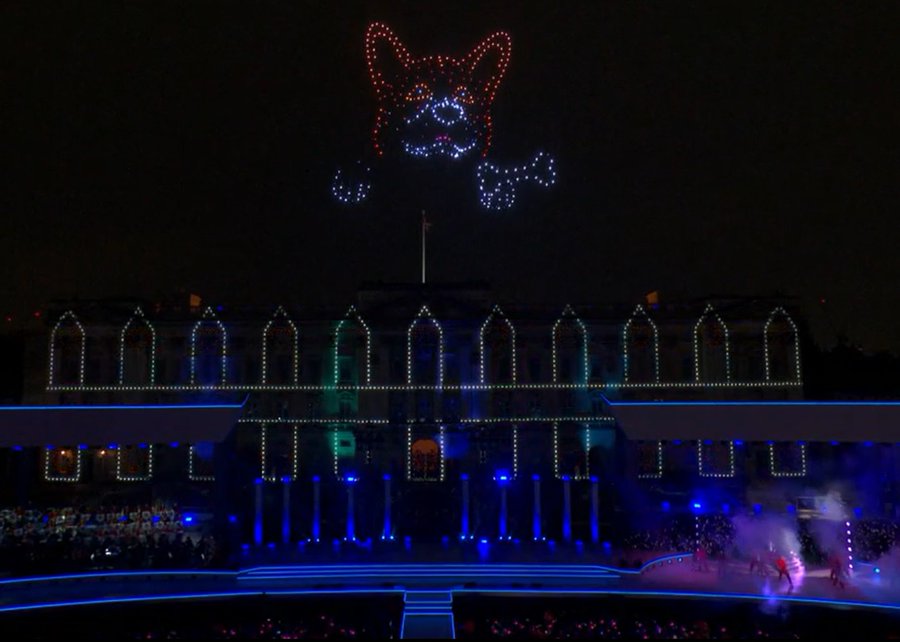
Finally — on a much lighter, respectful note — a drone light show was a big hit over Buckingham Palace in London on the occasion of the Platinum Jubilee concert for Queen Elizabeth II.
The queen has been on the United Kingdom’s throne for 70 years. To celebrate, the Brits hosted a major shindig. As part of a concert held outside Buckingham Palace, 400 lightshow drones from SkyMagic flew above the palace. The drones created various designs, showing the message “Thank you, ma’am”, a Corgi, a handbag, a teapot pouring into a teacup, guards in busbies, and a figurehead postage stamp — all good fun received in good spirit by a huge milling crowd.
Food for thought
To sum up, maybe it’s not such a good idea to have drones equipped with Tasers in schools, but perhaps it’s an idea we could build on to better protect our kids.
Trained, autonomous drones that take off and chase birds when they descend on vineyards — could this be a better solution than low-slung netting?
The war in Ukraine rages on. Not only the West, but also some Eastern countries pitch in with support.
Finally we saw a drone light show for the queen during the Jubilee celebration of her 70 years reign. We’re seeing a lot of smart drone potential out there.
In a world where GPS and other GNSS signals can be easily denied or, worse, spoofed, interest in other forms of navigation has rebounded.
Imagine being able to locate yourself within a couple of centimeters with just your cellphone – deep underground. Or inside a metal structure. Or underwater (assuming you can keep your equipment dry).
No satellite signals, no Wi-Fi ranging, no inertial system. Just the ambient magnetic flux that constantly surrounds us all. Everywhere.
Animals have used the Earth’s magnetic field to find their way for millions of years. People have been using magnetic compasses for over a thousand. Until the advent of GPS, magnetic compasses were foundational tools for aircraft and ship navigation, especially when out of sight of easily recognized landmarks.
Then GPS came along, and almost everyone’s eyes turned to space.
But in a world where GPS and other GNSS signals can be easily denied or, worse, spoofed, interest in other forms of navigation has rebounded. And because GPS helped demonstrate the efficiencies geospatial services provide, users also want those services to be more resilient and to work in places signals from space just can’t reach.
According to Neill, “Our solution builds upon inexpensive magnetometers, smartphones, machine learning, edge computing, and some incredibly complex math to convert raw magnetic data into a source of ultra-precise location data. These relatively recent tech developments allow us to bring things together for a major update to a centuries-old way of navigation and positioning.”
Describing AstraNav as a software tech company, Neill said that the company’s system is “hardware agnostic.” It can work on “just about anything that has a magnetometer. No additional hardware or external connectivity is required, and we can run on any existing operating system.”
The company has partners in retail, automotive and telecom validating the technology. They have also been working with a U.S. Department of Defense (DOD) combatant commander to demonstrate the product, as well as Virginia Tech and its National Security Institute (VTNSI.) “This is not a case of ‘here’s an idea that we hope will materialize,” said Neill. Describing two real-world trials and use cases to the board, he said, “This technology is a reality, and we’re doing it.”
Most previous magnetic navigation efforts relied upon relatively low-resolution maps. An airplane could find its way safely across the ocean using the maps that were available and likely end up within a mile or two of an airport. Much higher resolution maps built through surveys and artificial intelligence are critical to AstraNav’s centimeter-level accuracy with systems that continue to learn on their own.
Intellectual property is AstraNav’s biggest asset. “We have multiple patents filed and pending,” said Neill. “Our IP is what allows us to sense and analyze magnetic fields so finely, develop maps, and make use of very low-cost magnetometers, such as the ones in cell phones.”
Several people at the advisory board presentation expressed surprise that they had not heard of the company and this capability before. “We have been busy getting established as a company, supporting our first commercial clients, and doing demonstrations for various folks within DOD,” Neill explained. “This presentation is by way of our coming out party. We are very eager to become better known and are looking forward to explaining our capabilities one-on-one with potential users.”
Citing an abundance of proprietary material, Neill was unwilling to discuss a lot of technical detail at the public meeting. His short presentation, he said, was to raise awareness and stimulate interest.
The number of those in attendance who after the presentation said they were eager to learn more showed that he was successful.
Dana A. Goward is President of the Resilient Navigation and Timing Foundation
In the decades since the U.S. GPS became fully operational, GPS has become a highly innovative, successful and increasingly ubiquitous technology critical to applications and services touching the lives of almost every American today and for decades to come. As GPS-enabled technologies have become an irreplaceable part of our national infrastructure, growing more deeply ingrained each year, GPS is a success story of what can happen when government-backed R&D, paired with a light-touch regulatory approach, is turned loose in the private sector.
At the GPS Innovation Alliance (GPSIA), our member companies and affiliates are driving this innovation forward. While we use their products every day now, they’re also focused on inventing the future. Several key features are necessary to this continued success: a stable and predictable spectrum environment; a regulatory framework that fosters innovation and balances the fundamental technical needs of navigation systems; and appropriate, established interference protections where necessary.
Regulators must take care not to fundamentally depart from the longstanding approach to spectrum policy that has enabled the GPS technologies and services that underpin our economy. The prize on the other side of a well-calibrated policy is the next generation of GPS-enabled applications and products, which, as a GPS enthusiast first and foremost, I get a front row seat to our members building every day. These innovations span land, sea and space, unlocking opportunity for their U.S. government partners and consumers alike.
Innovations on Land, at Sea and in Space
On Earth, GPS-based products and services are getting even better at improving our everyday lives, helping farmers, builders, drivers and hobbyists work more efficiently and providing the critical inputs for everything from trucks to cell phones.
Take GPSIA member Trimble’s recently introduced R750 modular GNSS receiver, a connected base station used in both civil construction and agriculture that provides improved base-station performance and gives contractors, surveyors and farmers more reliable and precise positioning in the field. John Deere is likewise helping build next-generation precision agriculture technology with its new autonomous tractors, which will use GPS signals to ensure optimal plowing, planting and harvesting by adapting to real-time data analytics on soil conditions and other factors.
Garmin, a household name in GPS consumer products,continues to enhance satellite location and communication technologies for increased safety and user awareness, recently launching its inReach Mini 2 compact device that offers up to 30 days of battery life, integrated location and situational awareness technologies, and two-way texting and SOS capabilities.
Elsewhere, CalAmp recently celebrated two years of partnership between their LoJack Stolen Vehicle Recovery System and BMW Group Italy, the first step in a larger plan toward a GPS-based security solution for BMW’s full product range, while Apple continues to build revolutionary consumer tech, such as their GPS-enabled Apple Watch that can track workouts, activity, elevation and time, all without connection to an actual iPhone.
The ubiquity of GPS is particularly critical at sea. Collins Aerospace, for example, just launched Artemis Elite, the first–ever military underwater navigation system (MUNS) with M-code technology, that improves GPS signals’ precise positioning, navigation and timing (PNT) capabilities, making them more resistant to threats of jamming and spoofing. Garmin is also improving the consumer boating experience with its suite of OnDeck products, which pair onboard sensors and GPS to create a remote monitoring and management solution giving boaters 24/7 access to critical and timely information about their vessels.
Of course, GPSIA members are driving the effort to modernize the GPS satellite constellation itself. Lockheed Martin is building the next generation GPS III satellites and follow-on GPS IIIF satellites that will improve antijamming capabilities and geolocation accuracy for GPS-enabled devices, while L3Harris is building critical inputs on these satellites, such as their advanced navigation and timing payloads.
Our companies are also leading the way to help nations operate in space, providing critical GPS applications including guidance systems for crewed vehicles; the management, tracking, and control of communication satellite constellations; and monitoring the Earth from space.
Raytheon, for example, announced this month that it installed the first global aircrew strategic network terminal (ASNT) for the U.S. Air Force to enable protected communication capabilities for aircrews, while Lockheed Martinis the primary contractor in a cutting-edge project from the Space Development Agency to improve U.S. missile tracking and defense through a layer of multi-orbit satellites speaking to one another and sharing location data in real time.
Looking across GPSIA’s member companies, it’s clear that we live on a globe propelled by GPS. We should continue to give them the tools — and protect the regulatory framework — that has allowed them to do what they do best, which is bring us products that transform our daily lives for the better and innovate new technologies and services.
My April column addressed the vertical movement at the NOAA CORS Network (NCN). The values at the sites indicate the potential movement of marks in the area of the CORS. The rates are based on GNSS data and have an estimate of error associated with them.
As I mentioned in my previous column, I’m not sure how the National Geodetic Survey (NGS) will address the vertical movement effects in the new, modernized National Spatial Reference System (NSRS). That said, NGS will be monitoring the CORS and looking for trends to help describe the vertical movement at the CORS. These trends are an indication of what may be happening in that area.
As stated in previous columns, orthometric heights in NAPGD2022 will be defined through ellipsoid heights and a geoid model, for example GEOID2022. In addition to the movement of individual marks due to crustal movement, there are geophysical reasons for changes in the geoid that affect the orthometric height of a mark. Therefore, changes in the geoid model will be very important to users estimating orthometric heights using GNSS.
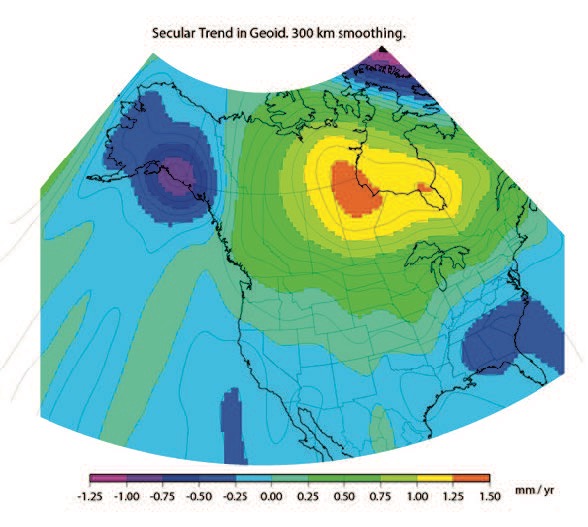
As stated in the NOS NGS 64 report, NGS has set a goal of maintaining geoid accuracy at 1 centimeter (1 standard deviation) in both absolute and differential geoid undulations. The box titled “Figure 13 from NOS NGS 64 Report” depicts an estimate of the secular change in the geoid. As indicated in the plot, the changes are very small, ranging from -1.25 mm/year to 1.5 mm/year.
What I find interesting is the small negative change in the southeastern United States. There are other drivers for geoid changes. This column will address some of these changes and what they mean to users.
Secular geoid change
Figure 13 from NOS NGS 64 Report (Image: NGS)
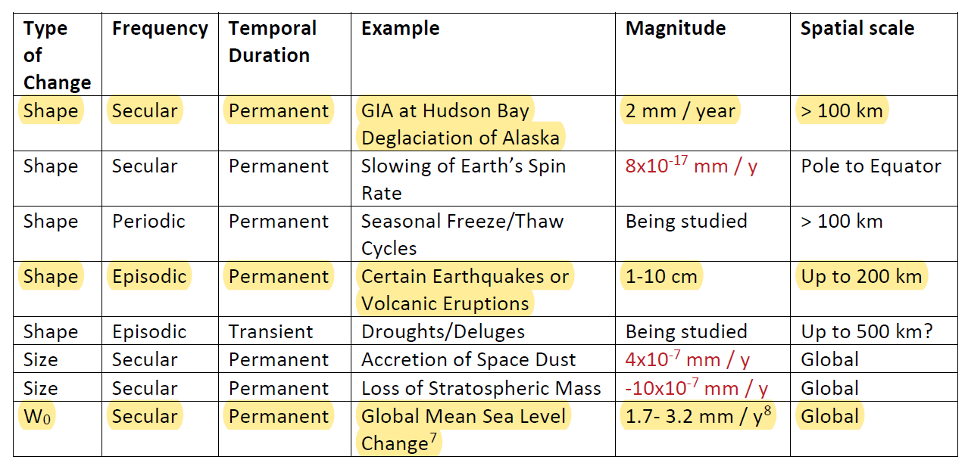
As mentioned in many of my articles, the new, modernized NSRS has a time-dependent component. This includes the geoid model. Table 5-1 from NOS NGS 64 report are examples of some of the physical processes being investigated by NGS to account for changes in the geoid. (See the box titled “Some of the geophysical drivers of geoid change.”)As mentioned in the NOS NGS 64 report, the magnitudes in red have already been determined to be too small for NGS to model. The examples highlighted in yellow have magnitudes that are significant and NGS will attempt to account for these changes to the geoid.
Table 5-1: Some of the geophysical drivers of geoid change
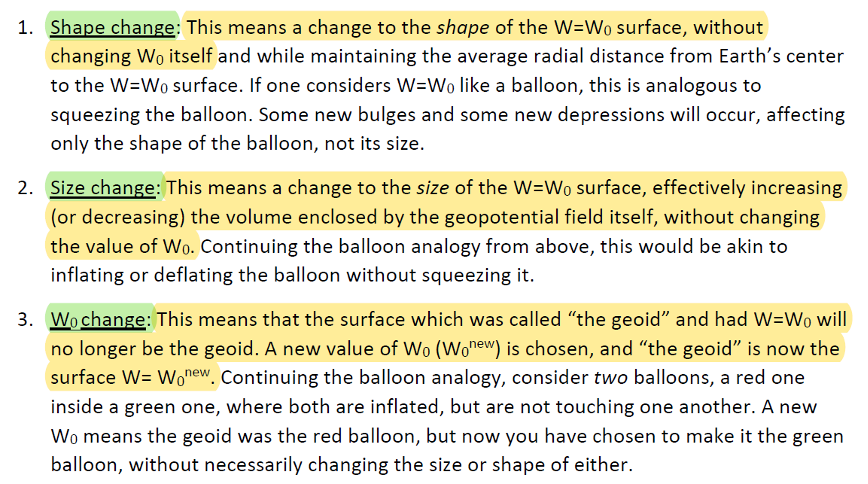
NGS classifies the changes in the geoid in three different groups: Shape Change, Size Change, and W0 Change. The box titled “The Groups of Geoid Change” provides NGS’s definition and explanation of the terms.
The groups of geoid change
NGS’s report on their Geoid Monitoring Service (GeMS) program provides figures that depict an estimate of the secular geoid rate trend based on the NASA GSFC mascon model. See the boxes titled “Estimate of Geoid Rate Over CONUS” and “Estimate of Geoid Rate Over Alaska.” For more details on GeMS, download the report NOAA Technical Report NOS NGS 69: A Preliminary Investigation of the NGS’s Geoid Monitoring Service (GeMS), and read my December 2019 Survey Scene column. The secular geoid rate trend is an example of the geoid changing its shape, but not the W0 value. What this means is that the local geoid undulations will change, but the overall size of the geoid will not.
Estimate of geoid rate over CONUS
Figure 32: Geoid rate over CONUS based on the GSFC mascon model [mm/yr] (Image: NOAA)Estimate of geoid rate over Alaska
Figure 33: Geoid rate over Alaska from GSFC mascon model [mm/yr] (Image: NOAA)These changes in the geoid are fairly small values (+/- 1.3 mm/year), but they will accumulate over a decade. As previously stated, NGS’s goal is to maintain geoid accuracy at the centimeter level (1 standard deviation) in both absolute and differential geoid undulations. In my February 2022 column, I discussed how coordinates change because Earth’s surface is moving due to the movement of major tectonic plates. It’s fairly obvious how the tectonic shift affects horizontal coordinates, but earthquakes and volcanic eruptions can also cause large shifts in vertical coordinates.
In recent history, on May 18, 1980, geologists watched in awe as Mount St. Helens erupted in a gigantic explosion. After the eruption, the volcanic cone of Mount St. Helens had been completely blasted away; the peak, which was at an elevation of 9,677 feet (2,950meters) was changed to a horseshoe-shaped crater with an elevation of 8,363 feet (2,549 meters). Extreme crustal movements such as the Mount St. Helens eruption can change the shape of the geoid. As explained in my April 2022 newsletter, NGS understands this and is attempting to manage the changing coordinates by providing a time-dependent component to a mark’s ellipsoid height, but there is also a time-dependent component to the geoid that affects the mark’s orthometric height.
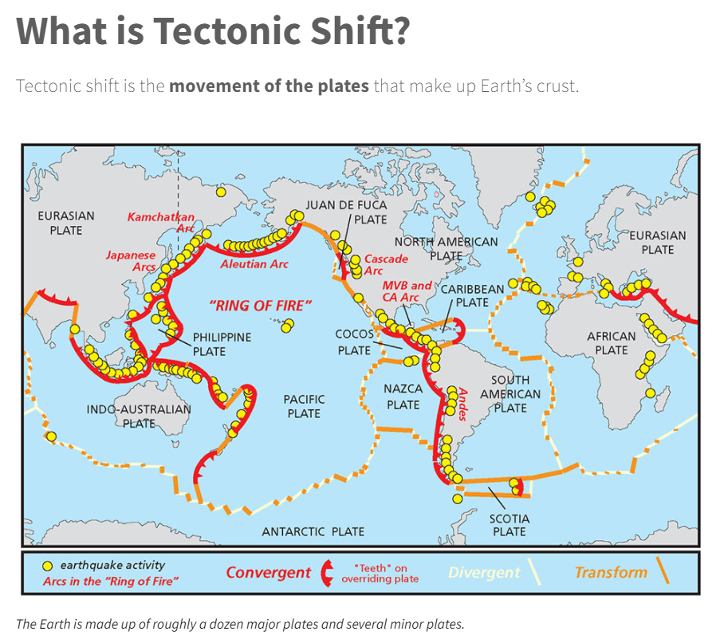
Ring of Fire
Image: National Ocean Service
The “Ring of Fire” map highlights earthquake activities around the world. As indicated in Table 5.1, earthquake or volcanic eruptions can change the shape of the geoid. Of course, they also can change the height of a mark due to crustal movement, which would typically be larger than the change in the geoid height. The amount of movement would be due to the size and magnitude of the event, but even small earthquakes could cause a change in the height of a mark located near the event. Earthquakes are occurring all over the world every day.
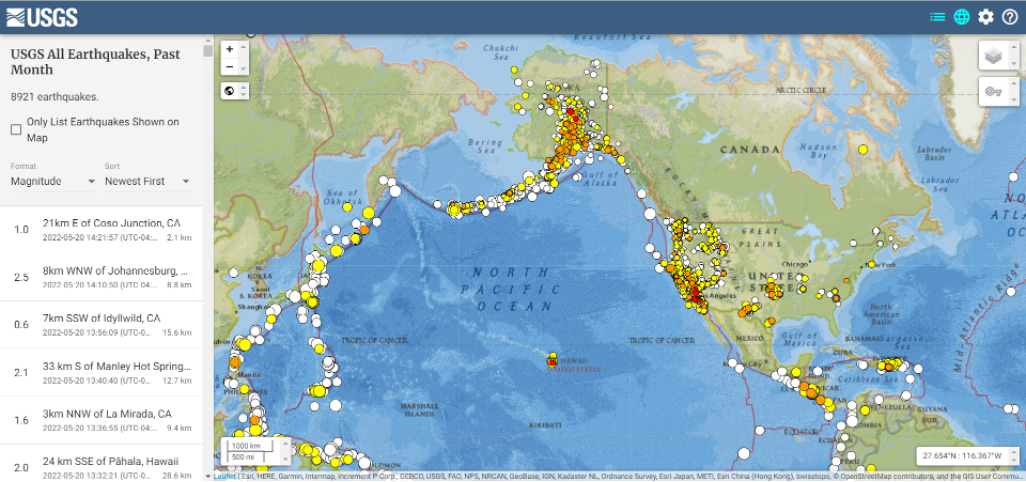
Earthquakes with large magnitudes are highlighted by news media outlets, but ones with smaller magnitude typically are not highlighted. The four figures below provide examples of earthquakes that have occurred over 30 days. This information can be obtained from the United States Geological Survey (USGS).
Earthquakes during the past 30 Days Date: May 20, 2022
Image: USGS
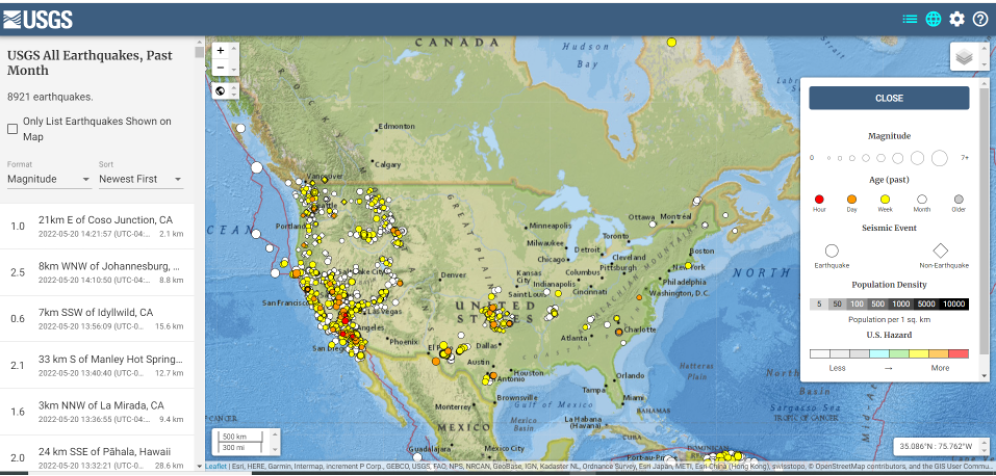
Earthquakes in the lower 48 during the past 30 days Date: May 20, 2022
Image: USGS
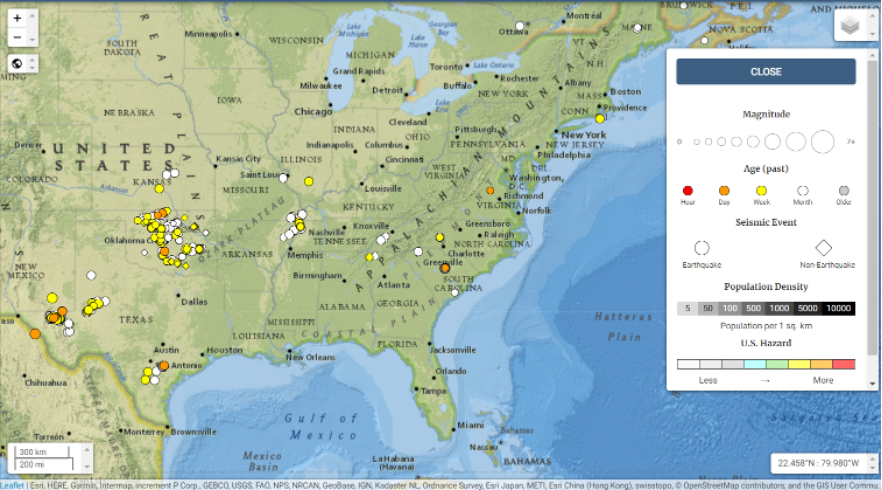
Earthquakes in eastern United States in the past 30 days Date: May 20, 2022
Image: USGS
I found the large number of earthquakes that occurred in Oklahoma in just 30 days to be very interesting. This isn’t something that I thought occurred in the eastern region of the United States.
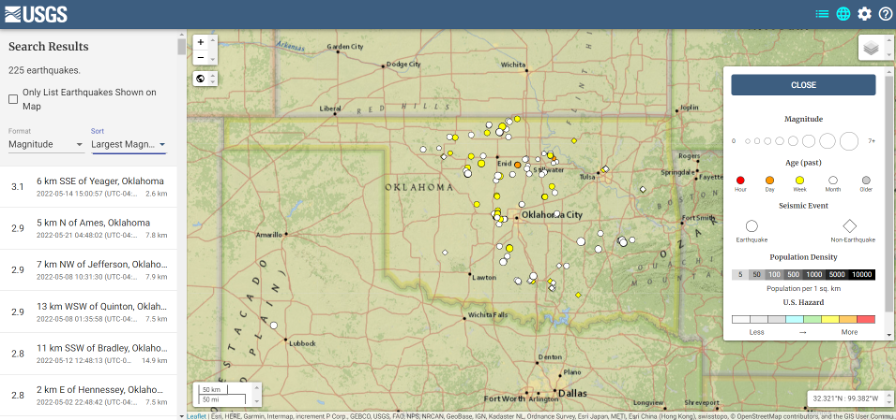
Earthquakes in Oklahoma during the past 30 days
Date: May 20, 2022
Image: USGS
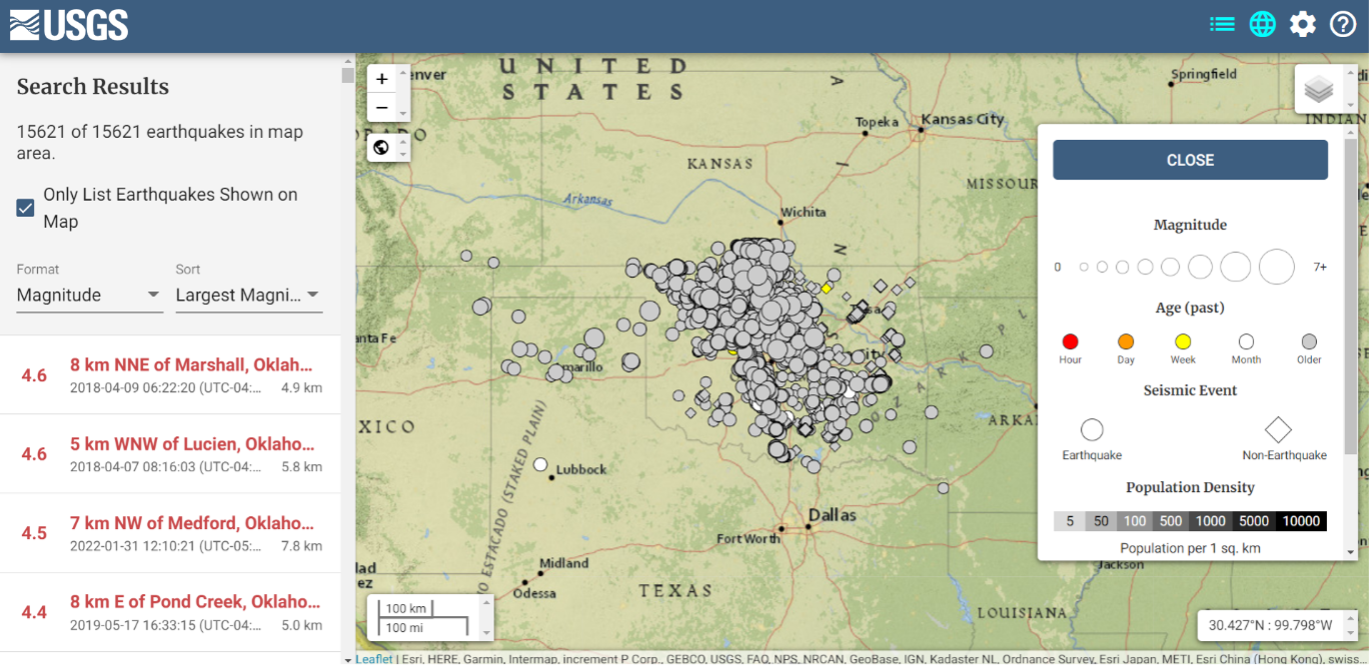
The image below depicts earthquakes that have occurred in Oklahoma in the past five years. They are fairly small in magnitude, but what is the cumulative effect on the geoid in the region, as well as changes to the orthometric heights of marks due to crustal moment in the region? This is why it is important for the new, modernized NSRS toimplement time-dependent coordinates.
Earthquakes in Oklahoma in the last 5 years Dates: 2017 to 2022
Image: USGS
To better understand the changes to the geoid, NGS performed a survey in Alaska to obtain geodetic data as part of its GeMS program. On May 12, 2022, Kevin Ahlgren, a geodesist at NGS, described in a webinar the observations collected and some of the results.
The presentation provided an overview of a field campaign performed in support of the GeMS program and a time-dependent geoid model. The campaign included static GNSS, relative gravity, and deflection of the vertical techniques on 50 stations in Alaska. The webinar was can be downloaded.
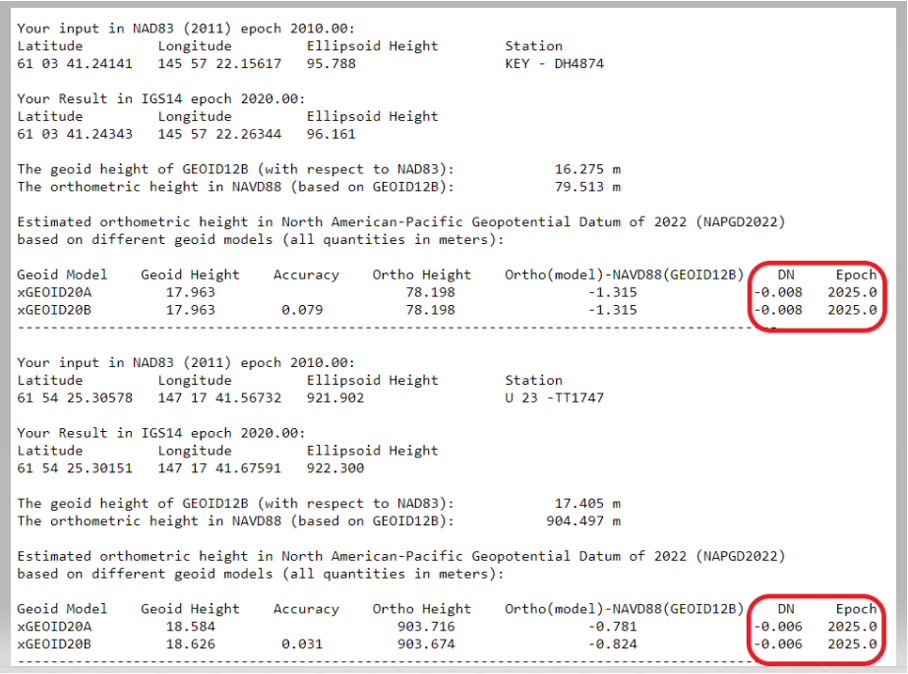
I encourage everyone to download the presentation. The change in the geoid due to geophysical drivers is small, but if the new, modernized NSRS is going to include time-dependent coordinates, then changes in the geoid must be accounted for. For demonstration purposes, NGS provides an example of the time-dependent geoid change in the xGEOID20 webtool. The box below, “xGEOID20 interactive computation output,” is an example of using this tool. The two stations are located in Alaska. As indicated in the output from the tool, the change in the geoid is 8 mm in five years. Again, NGS’s goal is to maintain geoid accuracy at the centimeter level (1 standard deviation) in both absolute and differential geoid undulations. These small changes can become significant over time.
xGEOID20 interactive computation output
Note: DN is the time-dependent geoid change computed between user inputted epoch (t) and t. (Image: NGS)
The last geoid change group that I’ll highlight has to do with the change in the gravity potential (W0) value that defines the model. The NOS NGS 64 Report states that the standing definition of the geoid, as adopted and used at NGS, is the following:
The geoid is the equipotential surface of the Earth’s gravity field which best fits, in a least squares sense, global mean sea level.
As stated in the NOS NGS 64 report, over a century of sea-level measurements imply that global mean sea level (GMSL) was rising at a rate of approximately 1.7 millimeters per year and was rising at a rate of 3.2 millimeters per year between 1993 and 2010 (IPCC, 2014). If NGS is going to define the geoid as theequipotential surface of the Earth’s gravity field that best fits, in a least squares sense, global mean sea level, then the geoid in the new, modernized NSRS must change when the GMSL exceeds a certain threshold.
Again, NGS’ goal is to maintain geoid accuracy at the centimeter level (1 standard deviation) in both absolute and differential geoid undulations. What this means is that as GMSL rises, the value of gravity potential which best fits to GMSL (called W0) will also change. In other words, the surface which was called “the geoid” and had W=W0in 2022 will no longer be the geoid. A new value of W0 (W0new) is chosen, and “the geoid” would now be the surface W=W0new.
So, what does this really mean to users? The NOS NGS 64 Report states on page 37:
“NGS and the Canadian Geodetic Survey have jointly adopted the value of 2.0 m^2/s^2 as the replacement threshold for a new geoid model (and new geopotential datum). This represents approximately 20 centimeters of GMSL (and thus geoid) rise. At the current rate of sea-level change of about +3 millimeters per year (IPCC, 2014), this means NGS expects to replace NAPGD2022 in approximately 60 to 70 years.”
Therefore, this should not be a major concern of users for a long time.
This column highlighted that orthometric heights in NAPGD2022 will be defined through ellipsoid heights and a geoid model, for instance GEOID2022; and therefore, changes in the geoid model will be very important to users estimating orthometric heights using GNSS. It briefly described the geophysical reasons for changes in the geoid that affect the orthometric height of a mark.
If NGS is going to meet the goal of maintaining geoid accuracy at 1 centimeter (1 standard deviation) in both absolute and differential geoid undulations, they will have to address changes in the geoid. The secular changes in the geoid, as indicated in Figure 13 in the NOS NGS 64 report, are very small, ranging from -1.25 mm/year to 1.5 mm/year. Once again, these are small changes to the geoid, but they will accumulate over time, and that is why NGS is including time-dependent coordinates in the new, modernized NSRS.
We all need to be careful that the numbers we are throwing around to support our case aren’t really undermining it.
Dana Goward, President, Resilient PNT Foundation
Over the last several weeks, I have repeatedly heard government officials and others talking about the value of GPS to the U.S. economy.
In each case they cited a 2019 report sponsored by the National Institute of Standards and Technology. It determined that, if GPS services were to go away, the U.S. economy would lose one billion dollars a day.
A billion dollars is a lot of money.
Yet the U.S. annual gross domestic product is more than $22 trillion a year. That’s more than $60B a day. One billion dollars is less than 1.7%.
That just doesn’t seem right.
A member of the White House’s National Security Council said “GPS is still a single point of failure” for America. That sounds like a pretty big hit to the economy. Not to mention our national security.
GPS signals are critical for networks, transportation, communications, power grid operations, first responders…virtually every critical infrastructure. If they go away, the U.S. GDP will certainly suffer much more loss than 1.7%. The economy would likely go from growing to shrinking and continue that way for quite a while.
I don’t know exactly how much the U.S. will suffer if GPS suddenly goes away, but I am sure it will be a lot. Texas alone lost an estimated $195 billion with at least 57 dead as a result of its February 2021 week-long power crisis. Although not caused by a GPS outage, the number gives us real-world benchmarks for the impacts of a major tech infrastructure failure.
If GPS fails, there will certainly be more accidents while people across the nation get used to it not being available. First responders will have a much harder time getting places and using land mobile radios. All kinds of essential services will be disrupted. More people will die than would have been the case otherwise.
In December 2021, a member of the White House’s National Security Council said “GPS is still a single point of failure” for America. That sounds like a pretty big hit to the economy. Not to mention our national security.
The authors of the NIST-sponsored study were undoubtedly diligent. But they were faced with an impossible task – to quantify the unquantifiable. And like any analysis, they were limited in what they could do by the available time, money, and hard data. They were asked for a number. They delivered one that could be easily supported.
A billion dollars is a lot of money. It might be a fairly impressive sound bite for general audiences.
Government budget analysts and policy makers, though, are accustomed to dealing with dollars in the hundreds of billions and trillions. A billion a day, while not chump change, is not a major issue.
Protecting GPS and ensuring the nation has resilient positioning, navigation and timing services are major issues.
We all need to be careful that the numbers we are throwing around to support our case aren’t really undermining it.
Dana A. Goward is president of the Resilient Navigation and Timing Foundation.
The largest source of error in GNSS positioning is the delay suffered by the signals as they pass through the ionosphere traveling from the satellites in orbit to receivers on or near Earth’s surface. That is because the ionosphere is full of free electrons stripped from atoms and molecules by ionization and this plasma refracts the signals, changing their speed. Normally, models compensate for this. However, geomagnetic storms wreak havoc on the free electrons in the ionosphere, making it difficult to accurately determine the signal delay.
That is why space weather matters for GNSS and for the myriad human activities that have come to depend on it.
So, here’s the good news. “On a scale of one to five, the geomagnetic storm on April 14 was a three,” Bill Murtagh told me. Murtagh is the Program Coordinator and Space Weather Forecaster at the Space Weather Prediction Center (SWPC) of the National Oceanic and Atmospheric Administration (NOAA). He was referring to the third rung of NOAA’s space weather scales, which were introduced to communicate to the public the current and future space weather conditions and their possible effects on people and systems.
NOAA has three space weather scales, one each for geomagnetic storms (G scale), solar radiation storms (S scale), and radio blackouts (R scale). The steps on the scales, ranging from “minor” to “extreme,” are analogous to those NOAA uses to classify hurricanes, tornadoes and earthquakes. They describe the environmental disturbances for each of these events and list their possible effects at each level.
Solar activity runs in 11-year cycles. A G5 event happens two or three times per cycle, and the last one was in October 2003, Murtagh told me. “I can only remember a handful of occasions over the past 20 years when ionospheric activity has significantly impacted users,” told me Gavin Schrock, PLS, manager of the Washington State Reference Network, a regional cooperative of GPS reference stations and data. According to Rick Hamilton, the GPS Information Analysis Team Lead at the U.S. Coast Guard Navigation Center, it “did not receive any reports of interference related to the geostorm” and “there was no significant increase in reports that we might attribute to geomagnetic activity.”
Now, the bad news. We are heading for a maximum in solar activity, expected to occur in 2025. The Sun is “already quite active,” Murtagh pointed out, and recently there has been an increase in the number of R1 and R2 storms. Solar coronal mass ejections (CMEs), which launch plasma and magnetic fields into space, also have become more frequent. When a CME hits the Earth, its collision with the Earth’s magnetic field causes a geomagnetic storm.
So, the GNSS constellations and the GNSS industry should be preparing now. Fortunately, improvements in GNSS software and receiver technology, plus corrections and integrity information and the much larger number of satellites, make us better prepared than we were during the last cycle. On the other hand, the stakes also are much larger, due to our ever-greater reliance on GNSS.
As a sailor, I rely on NOAA nautical charts and marine weather forecasts. GNSS users can thank NOAA for its space weather forecasts.
This month our UAV and GNSS news ranges from a drone diving into the Boston subway to a GNSS receiver designed for Moon orbit. We also look at the types of drones heading to Ukraine to help fight the Russian invasion and rescue citizens from demolished buildings.
Boston cleanup
Bostonians’ morning commutes were disrupted at the end of March after 100 tons of demolition debris fell nine stories onto ground directly above subway tunnels, and the Massachusetts Bay Transport Authority (MBTA) closed the Orange and Green lines as a precaution.
The bad news got worse. A construction worker was killed when part of a parking garage under demolition collapsed. Apparently his jackhammer-construction vehicle — in the midst of demolition work — fell nine stories when the floor near the edge of the building buckled and crumbled away.
MBTA was concerned that damage could have occurred to the subway under the building from the huge amount of debris that fell on the ground above a tunnel. The agency closed the line passing through that section of the system. Hundreds of morning commuters were turned away from the subway at nearby station entrances and were directed to buses hastily brought on as temporary shuttles around the closed subway sections.
MBTA wanted to immediately, but carefully, inspect the tunnel for damage, but was concerned for the safety of its inspection personnel. As news of the disaster circulated, the Massachusetts Department of Transportation (MassDOT) Aeronautics Division became aware of the subway issue, and proposed a rapid solution to the dilemma — to fly a drone through the tunnel. The drone would transmit high-resolution video and gather data on the status of both tracks and tunnel structure.
Soon after, Bostonians were able to watch a 29-second video collected by the drone that was sent into the subway tunnel.
“As we work to safely restore service following the Gov Center Garage accident, we teamed with @MassDOT Aeronautics to scan Orange & Green Line tunnels with a drone. This allowed us to safely assess tunnel conditions before sending engineers in for in-depth structural inspections.” pic.twitter.com/LHGUfiou9r
MBTA was then able to gauge that live inspections would be safe. The tunnel was ultimately assessed as being sound and, following test trains being run, service was restored.
It has been difficult to establish which drone was used for these initial visual tunnel inspections, but in 2021 the Aeronautics Division was operating multiple drones, including the DJI Matrice, Inspire, Phantom and Mavic, as well as a few fixed-wing and multi-rotor models manufactured by Yuneec, SenseFly and Delair.
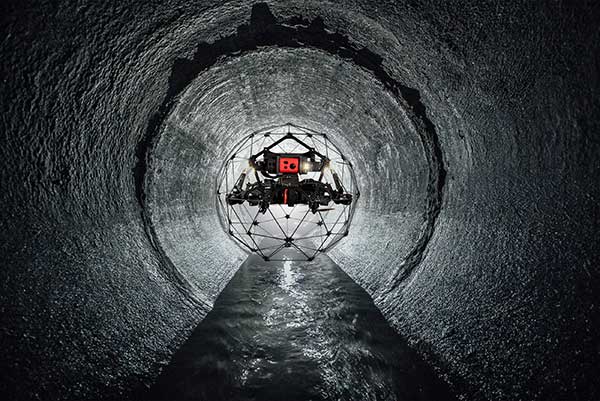
Flyability provides the Elios 2 drone, specifically built for indoor inspection, for such places as inside underground tunnels. Similar “caged” inspection drones include Droneball 360 by Imaze, the Skycopter Cobra drone, the Asio Caged Inspection Drone and several others.
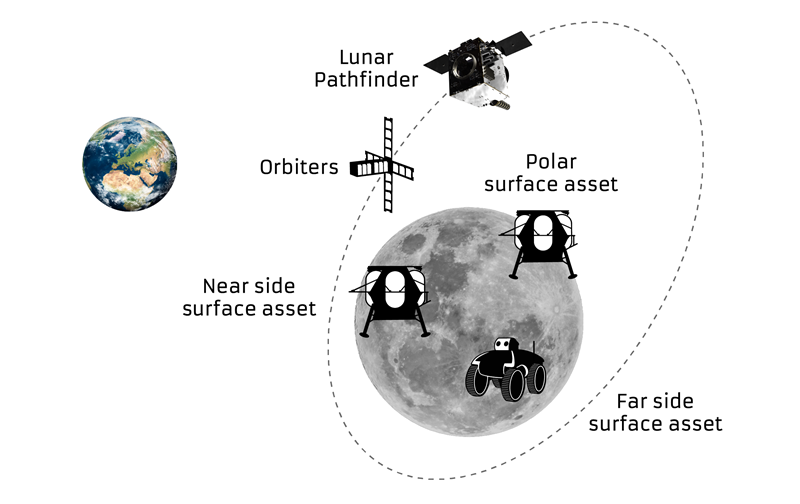
Turning our attention to space, the European Space Agency (ESA) will conduct a mission to place a refrigerator-sized satellite in orbit around the Moon. Of course, there have been many successful efforts to put things in lunar orbit since Russia first achieved the feat with Lunar 10 in 1966. NASA’s Lunar Reconnaissance Orbiter followed in 2009, along with India’s Chandrayaan-2 orbiter and its failed lander.
ESA has contracted Surrey Satellite Technology Ltd. (SSTL) in Guildford, UK, to develop the Lunar Pathfinder communications relay satellite — the first part of a project to provide communications and navigation for the Moon. This capability will enable assets on the lunar surface to communicate directly with the Pathfinder via S-band and UHF, which will then relay their signals onwards to Earth using X-band.
The satellite will also carry a laser retro-reflector and a space-weather payload designed to assess the radiation environment in orbit. This should help support landers carrying astronauts, such as the NASA Artemis, by broadcasting radiation intensity to the surface.
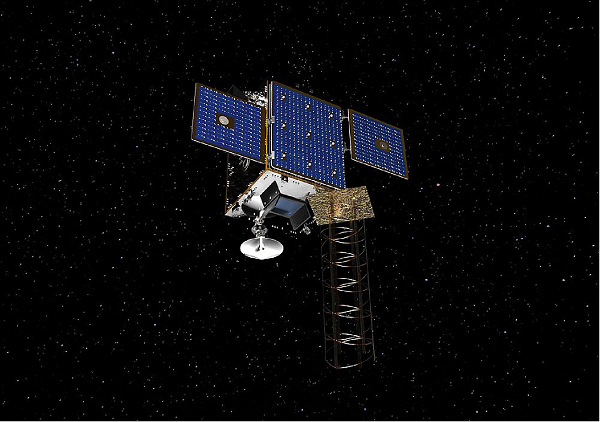
Artist illustration of the Pathfinder mission. (Image: SSTL)
The Lunar Pathfinder satellite. (Image: SSTL)The Pathfinder satellite will carry a few passenger payloads, but the most interesting to us might be the highly sensitive GNSS receiver, which will attempt to make position fixes from lunar orbit using GPS and Galileo satellites in Earth orbit.
The NaviMoon receiver designed by SpacePNT in Switzerland was implemented and tested by European Engineering & Consultancy, which added a special low-noise amplifier of its own design — essential for detecting minute satnav signals at 20 times the distance they usually travel to Earth’s surface from Earth orbit. In addition, antennas on GNSS satellites are designed for transmissions towards the Earth’s surface, not out toward space, further decreasing the signal strength in the vicinity of the Moon.
As you might expect, the view of the various constellations of GNSS satellites from orbit around the Moon is extremely limited. To give the NaviMoon receiver any sort of chance of picking up signals when they are in view, an onboard dynamic force model provides the receiver with its anticipated location along its orbit, and also derives the apparent direction from which signals should be observed. Even detecting a single satnav signal could assist the receiver in creating a position fix. SSTL will also reorient the Lunar Pathfinder satellite from time to time to enable the receiver to gain access to GNSS signals from Earth.
Measurements from Earth using laser ranging, aimed at the laser retro-reflector on the satellite, will be used as “truth” against which the position fixes by the NaviMoon receiver will be verified.
UAVs for Ukraine
Meanwhile, as the war in Ukraine continues to rage on, AeroVironment has been contracted by the U.S. Army to supply its RQ-20 Puma AE for use in Ukraine for almost $20 million. The package includes reconnaissance/surveillance and target acquisition kits, spares, logistics support and training for operators in Ukraine.
The Puma has an endurance of about three hours, carries a gimbaled visual/IR camera and is equipped with dual GPS receivers.
AeroVironment’s Puma is hand-launched. (Photo: Lance Cpl. Frank Cordoba/U.S. Marine Corps)
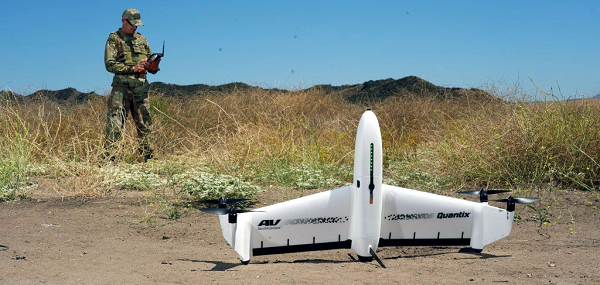
U.S. drone manufacturers have donated hundreds of other recon drones to Ukraine. The AeroVironment Quantix Recon drone takes off and lands vertically, but flies rapidly as a fixed-wing observation platform. While its endurance is not as long as the Puma’s, it flies faster so it can return with information more quickly.
Quantix lands vertically, but flies fixed wing. (Photo: AeroVironment)
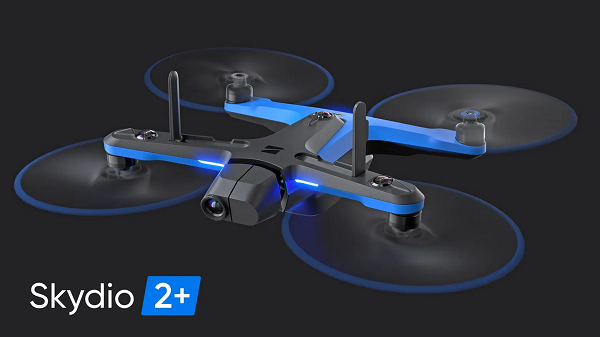
Brinc has also donated and sold its Lemur tactical drones to Ukraine for use in disaster recovery work in devastated buildings throughout the country. The rugged quadrotor drone has two-way voice communications, video and lidar, and has proven itself in difficult building-collapse search and recovery operations in confined spaces. Skydio has apparently donated and sold quadrotor drones to Ukraine with multi-view video from six 200-degree color cameras, also for use in collapsed building search and recovery.
Mason and Dixon were pioneers in bringing geodetic astronomy to the American colonies. Through the efforts of the Mason and Dixon Line Preservation Partnership, we can promote this scientific contribution along with the placement of the boundary stones.
Ask surveyors why they became engaged in the profession and why they had continued with it, most will centralize on one aspect: working outside. A career that allowed them to work outside in various environments, solving problems, and being part of a solution is typically the main answer they give.
Depending on the task at hand, a day in the field surveying can take one to several places, including urban/suburban neighborhoods, construction sites, and agricultural/wooded farmland.
View from Mason Dixon Stone #95 looking toward Maryland. (Image: Tim Burch)
My entry into surveying was no different. From residential sites, condominium surveys, boundary and topographic surveys, and construction layout, my early years in surveying covered a lot of territory. While my career eventually took me out of the field and into an office managerial role, and now into leading a professional association, it does not erase the roots of one’s surveying knowledge and experience. Opportunities to be part of the field exercises of a survey, especially a boundary survey, are typically rare and subject to time constraints.
Having spent all my life in the flat topography of Illinois and surrounded by farm fields and urban sprawl, the ability to see for miles over the various horizons was the norm. Coupling these conditions with the Public Land Survey System (PLSS) and use of GNSS technology, it makes for a great environment for the professional surveyor to go about his or her work.
However, the United States covers many areas and contains distinct types of terrain, ecosystems and demographic groups that provide challenges to the surveyor. While I assumed moving from Illinois to the mid-Atlantic region would require adaptation, an opportunity to help retrace and inventory a significant part of American history provided me with an eye-opening experience. It also helped me appreciate the legacy of our surveying forefathers.
A small title dispute
Even in the 17th and 18th centuries, disagreeing title descriptions to common lands was an issue. Reviewing two conflicting legal descriptions describing adjacent land boundaries is the basis of this survey exercise, and thus began a symbolic establishment of a famous boundary line that would lead to political and demographic ramifications in later years.
Here is the situation:
1632: King Charles I grants to Cecilius Calvert (second Lord Baltimore), a royal charter for establishing a new colony north of Virginia to a point “which lieth under the Fortieth degree of north latitude” and westward to the source of the Potomac.
1681: King Charles II (eldest son of Charles I) grants William Penn a royal charter of land between 43° N and a line extending westward from “a Circle drawn at twelve miles distance from New Castle…” to “the beginning of the fortieth degree….”
1682: King Charles II grants to William Penn an additional grant in the Delaware peninsula, which Lord Baltimore claimed.
1685: King Charles II directed his Board of Trade and Plantations to issue an edict ordering that territory to be divide equally, the western half going to Baltimore. This order endorsed Calvert’s claim of a boundary line being 19 miles to the north and providing him claim to Philadelphia. Part of the edict placed a burden on Calvert of providing a survey to authenticate the claim, but the survey was not completed. The boundary would eventually be established 19 miles to the south.
1731-1732: Charles Calvert, the fifth Lord Baltimore, petitioned King George II for help in demarcating the final boundary. He agreed on the final boundaries; however, a commission created to study the legal claims failed to deliver instructions in which a survey would be based upon. Calvert disputed its interpretation and refused to implement the arrangements.
1730s: Ongoing conflict over the disputed land claimed by both people from Pennsylvania and Maryland resulted in Cresap’s War, named after the land agent, Thomas Cresap, hired by Calvert to settle new development. In 1736, Cresap was accused of murder, arrested by Pennsylvania officials and his housed burned was burned down.
1750: After years of bitter controversy, British Lord Chancellor Hardwicke ruled that the southern boundary of Pennsylvania should be a line running westward from the point at which the line dividing the Delaware peninsula was tangential to a circle with a radius of 12 miles from the center of Newcastle.
After 100+ years of boundary disputes and deadly confrontations, in 1760 Frederick Calvert was directed by the English monarch to accept the terms of the 1732 treaty.
Penn-Calvert Land Grant Agreement. (Image: National Archives)
The unfilled challenge, however, was to commission a survey to establish the terms of the agreed-upon boundary. Given that the final location of the Pennsylvania/Maryland border was geographically based (approximate latitude of N 39°43’20”), the surveyors chosen to establish this line would have to be knowledgeable in such calculations.
Finding qualified surveyors in the colonies turned into a bigger challenge than first considered, so the monarchy assigned two surveyors from the Royal Society (full name: Royal Society of London for Improving Natural Knowledge). Enter Jeremiah Dixon (surveyor) and Charles Mason (astronomer) — the field party charged with tackling this monumental deed.
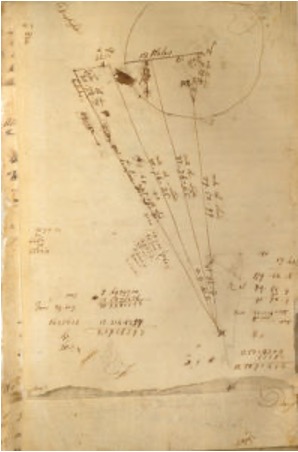
The survey calculations of Charles Mason. (Image: National Archives)
We know them by name for the lines they established in fulfilling the requirements of the boundary agreement, but how they accomplished their task remains a mystery to most. Previous exercises using geographical position determination was used in the sailing and shipping industries with lesser degrees of accuracy. This assignment would require higher levels of accuracy and precision, hence the reason for calling upon Dixon and Mason for the task.
By using geodetic astronomy, they were able to determine accurate (for the period) geographical positions of latitude. Geodetic astronomy is the art and science for determining, by astronomical observations, the positions of points on the earth and the azimuths of the geodetic lines connecting such points. It relies on spherical astronomy, using calculations and techniques developed by the Greeks in the second century A.D.
Besides the knowledge of performing the necessary calculations, the duo would also need to possess instruments to gather the accurate astronomical information. The survey of the agreed-upon line was to be established upon a constant line of latitude. The survey procedures would require turning angles (azimuths) from their meridian westwardly with accuracy not yet utilized in the New World.
Both instruments used for the project were built by John Bird, a well-respected instrument maker in London. The equipment consisted of a zenith sector, capable of measuring to two arc seconds. No field azimuth instrument of this accuracy existed in that era. They also brought a converted telescope/level set up for surveying purposes. This transit has no divided horizontal “plate,” only a tangent screw for slow azimuth motion.
In addition to the instruments and astronomical tables from Greenwich and Paris, the duo relied on a highly precise clock for marking time by the second, which was quite advanced for the period.
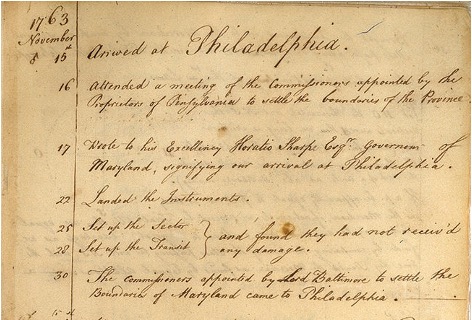
Dixon and Mason spent the better part of 1766-67 establishing the agreed-upon line using astronomy via the Bird instruments and taking copious notes documenting their calculations and survey conditions.
Field notes from Jeremiah Dixon. (Image: National Archives)
The markers set along the way —stone monuments chiseled back in England with demarcations — were quite accurately established despite the primitive nature of equipment and methodology for the survey. Mason and Dixon laid out the 233-mile long “West Line” in short segments, following the latitude arc of approximately N39°43’20” for 233 miles westward.
Old line versus new technology
In 2020, the Maryland Geological Survey (MGS) and the Pennsylvania Historical & Museum Commission (PHMC), members of the Mason and Dixon Line Preservation Partnership, began a new initiative to inventory these historic markers and submit them for inclusion into the National Registry. If accepted, the monuments will be part of a program established to help protect and preserve these physical boundary markers that define the boundary between the two states.
Part of the inventory has been the recovery and position confirmation by volunteer surveyors from the Maryland Society of Surveyors (MSS) and the Pennsylvania Society of Land Surveyors (PSLS). Using a geographic information system (GIS) app designed and implemented by the Maryland Geological Survey (MGS), volunteer retracers capture significant attributes about each monument.
While reestablishing the latitude/longitude of the recovered monuments with a smartphone or handheld GPS receiver is sufficient, several volunteers have used high-accuracy surveying equipment to determine a monument’s position.
Incredibly, the variation in the location of a given monument is well within reasonable tolerances from the originally intended installation. Also, because of GNSS technology, we now know more about continental drift. Because of this additional knowledge, 250+ years of tectonic plate movement should be considered when making these positional comparisons.
It should be noted that these monuments are a critical component of the boundary between states, and therefore must be considered senior to many other survey corners set after them. We cannot get lost in the sentimental aspect of recovering the monuments and not acknowledge the fact these points are the gospel when it comes to defining these state boundaries.
A Midwesterner in a ‘foreign’ land
My surveying career, as noted above, was solely in a state that is 200 years old, based upon the PLSS, and does not carry the history of the Mason-Dixon era of line establishment. So, when I was presented with the opportunity to join fellow surveying professionals from Maryland and Pennsylvania in recovering Mason-Dixon monuments for the inventory, I found it an easy event to join.
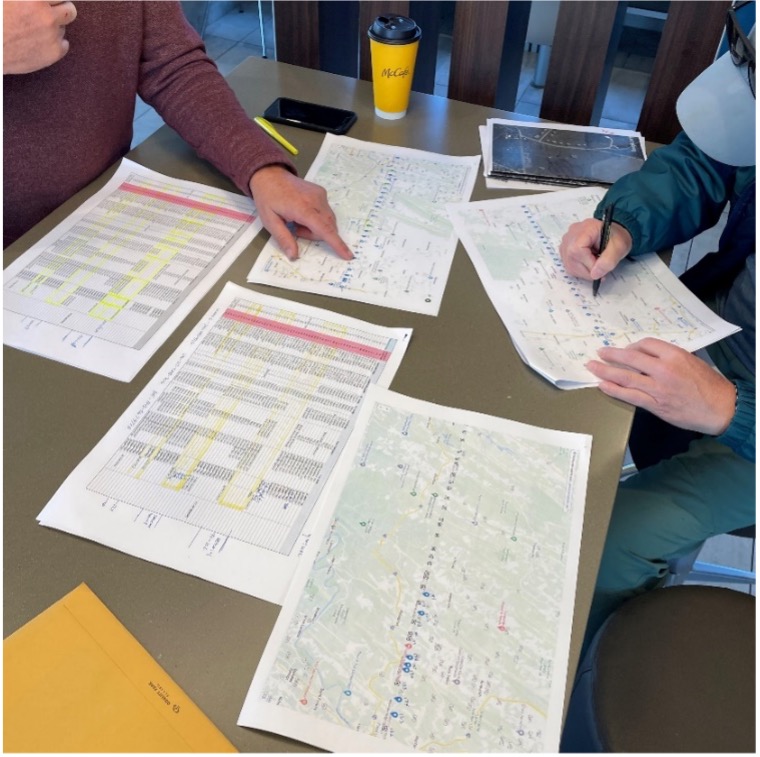
The planned meeting spot was a local fast food place at 8 a.m. on a sunny Saturday. Being it was in a small town, there were several groups meeting for their normal Saturday coffee klatches. Hearing a group mention “surveying,” I found my opening to identify myself as a fellow surveyor. After opening pleasantries, we settled into a game plan for recovering the targeted monuments for the day.
Planning a day of stone monument recovery along the Mason-Dixon line. (Photo: Tim Burch)
We settled on our assignments and enthusiastically went about our way. My partner for the day was Eric Gladhill, a Pennsylvania professional surveyor and veteran of Mason-Dixon monument retracement. In addition to his volunteer work, he has also authored several articles and a book on his surveying experiences, so it was quickly evident that we were in for a good day.
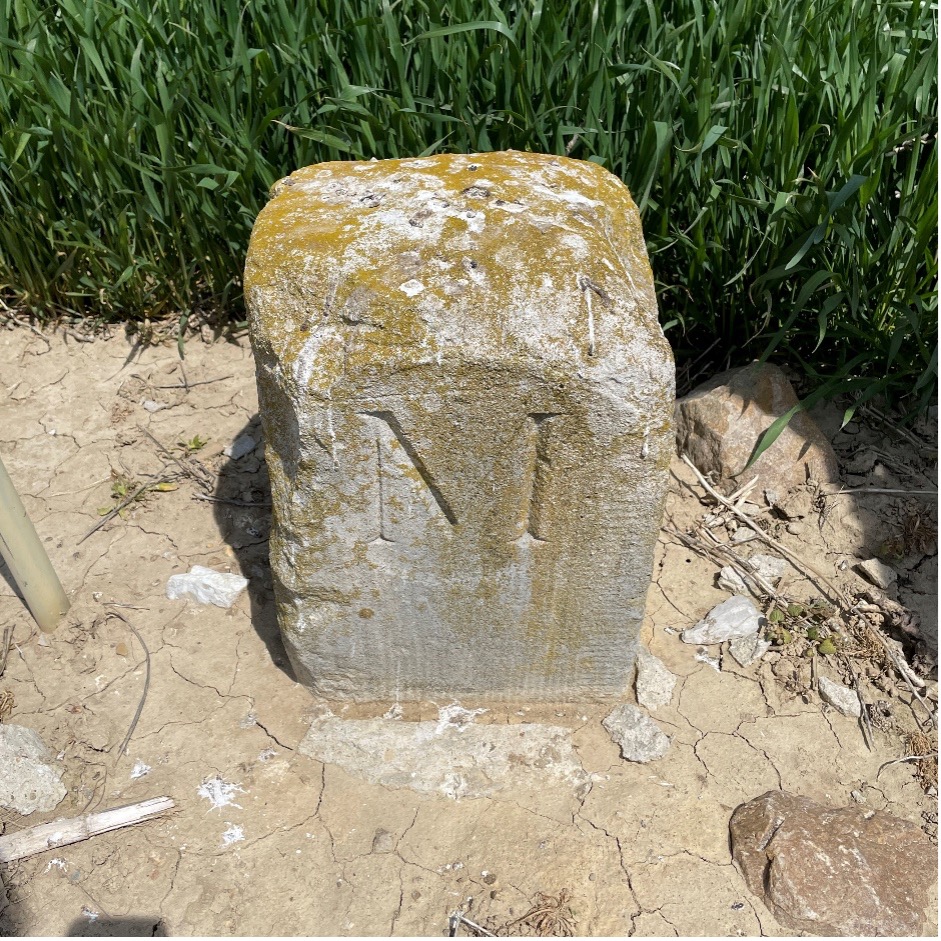
The first monument was not difficult to get to, and seeing it nearly brought a tear to my eye. Here before me was my first sighting of a Mason-Dixon monument stone, and it was simply amazing. Standing there admiring this 250+ year old stone, hand cut and carved in England and brought here by ship to be specifically placed on this line, I could not help but realize the importance of this monument.
This line, and these stones, were the culmination of two land grants that disagreed with each other more than 400 years ago. We were standing in the same location as a large survey party once did, where they observed the stars to determine an accurate position and directed axmen to clear the untamed forest to establish this important line. While it was a warm and sunny day, it gave me a chill to know we were following in the footsteps of our surveying forefathers.
Mason Dixon Stone #98 – My first recovery! (Photo: Tim Burch)
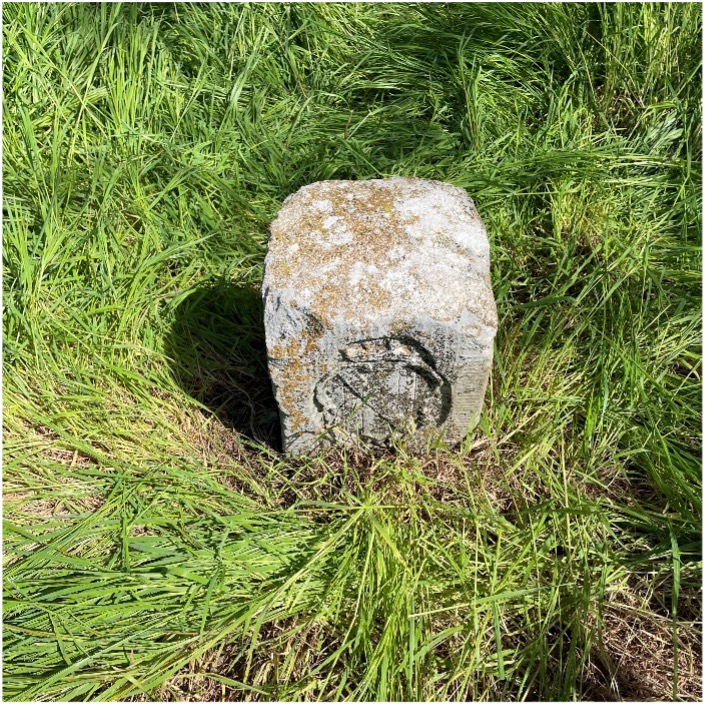
We continued our way and recovered six more monuments, including a crown stone. Crown stones were placed at 5-mile intervals. The detail in the carvings for most of the monuments was noticeably clear, and is a testament to the craftsmanship of the era’s stonecutters.
Mason Dixon Stone #95, a crown stone. (Photo: Tim Burch)
While locating these historic monuments, were felt we were standing on hallowed ground. The location of this line was important enough that people, both indigenous and settlers, fought for the right to build their lives there.
This was also a line that would be the site of many battles during the Civil War. Observing these monuments drove home the fact that surveyors play important roles in establishing land ownership both today as well as almost 300 years ago.
Mason Dixon Stone #93, a Maryland side marking. (Photo: Tim Burch)
Mason and Dixon were pioneers in bringing geodetic astronomy to the American colonies. Their work has provided inspiration for future generations of geospatial professionals, yet most of the public does not know about that portion of their contribution. Hopefully, through the efforts of the “Mason and Dixon Line Preservation Partnership,” we can promote this scientific contribution of Mason and Dixon along with the placement of the boundary stones.
My heartfelt thanks go out to Eric along with Wayne Aubertin and Rob Kundrick (Appalachian Chapter of the Maryland Society of Surveyors) for allowing me to join them for this task. They gave me a chance to be a true surveyor again and connect the past with the future.
The following op-ed was released by U.S. representatives Don Bacon and Mikie Sherrill, co-chairs of the congressional Global Positioning System Caucus.
The US military needs a modernized GPS capability to maintain superiority
By Rep. Don Bacon and Rep. Mikie Sherrill
Don Bacon
In December 1993, the U.S. declared that the satellites comprising the Global Positioning System constellation had achieved initial operational capability, representing the culmination of a 20-year effort to develop and launch the first global navigation satellite system.
GPS, which began as a U.S. government project to provide positioning, navigation and timing information by broadcasting radio signals from satellites to the ground, stands alone in the revolutionary impact it has had on both our warfare abilities and our commercial industries. However, an aging constellation and unyielding international competition has put America’s GPS superiority at risk.
“We believe it is critical to our international interests that the U.S. reinvest in GPS modernization. We cannot afford to overlook the satellites.”
Mikie Sherrill
In the decades since achieving initial operational capability, GPS has become integrated into virtually every facet of the U.S. economy and is part of everything from our cellphones to our financial, agricultural, transportation and manufacturing sectors — and to every aspect of our national security.
Even as GPS has grown to become a fundamental part of our everyday life, the U.S. provides GPS signals for free to users worldwide. And yet, China, Russia, the European Union, India, and Japan have all developed regional or global satellite systems since GPS was launched.
Most recently, China’s completion of its BeiDou system comprised of over 30 satellites — part of its broad Belt and Road Initiative — risks endangering U.S. technological leadership. Beijing has made it clear that it will leverage BeiDou as part of an overall strategic effort to obtain greater influence internationally, heavily subsidize the adoption of BeiDou-equipped infrastructure for government and military use in countries throughout its region, and advantage BeiDou-compatible domestic products.
As the House co-chairs of the congressional GPS Caucus, we believe it is critical to our international interests that the U.S. reinvest in GPS modernization. We cannot afford to overlook the satellites — the oldest of which were launched in the late 1990s or early 2000s — that underpin civil and social infrastructure, including civil aviation, banking systems, financial markets, power grids, precision agriculture, and communications networks and applications. Even as manufacturers develop multi-constellation devices that can receive signals from both GPS and other global systems, it is more critical than ever that the U.S. accelerate its investment in next-generation GPS satellites.
To that end, the U.S. has begun modernizing the GPS constellation, with significant technological benefits for U.S. warfighters and civil users. New GPS satellites provide three times greater accuracy, and eight times improved resistance to inference and signal blocking known as jamming. However, the replacement of outdated GPS satellites in the constellation has not kept pace with our international competition and emerging global threats.
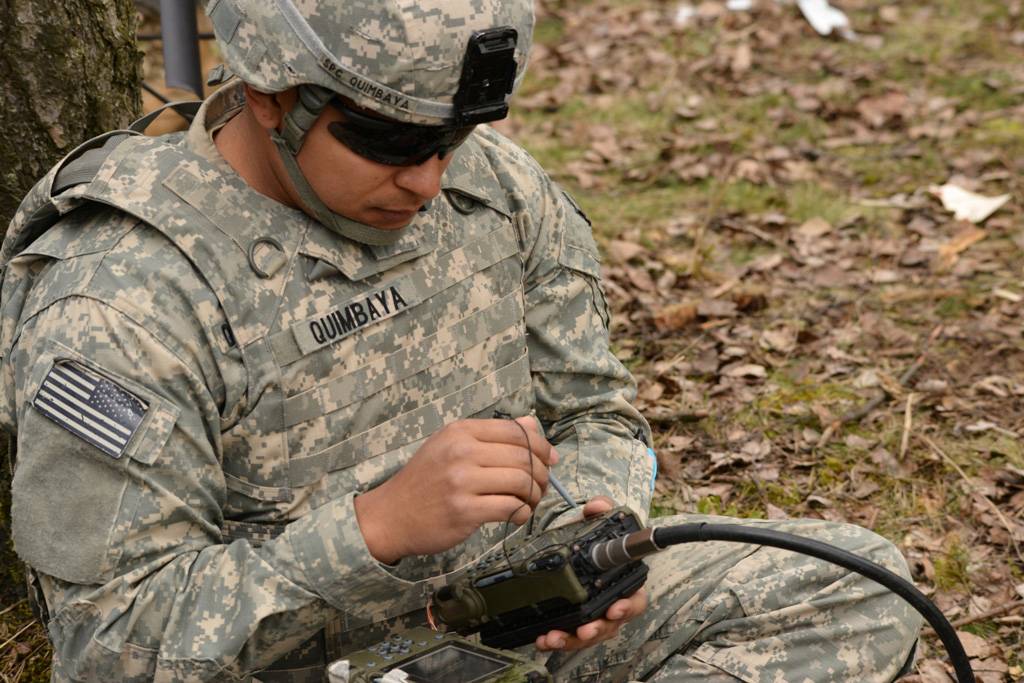
A U.S. paratrooper uses a Defense Advanced GPS Receiver during a live-fire exercise at Grafenwoehr, Germany. (Photo: Spc. Markus Rauchenberger/U.S. Army)
We believe that our efforts to invest in American technological leadership must include an increased launch rate of new GPS satellites with both crosslinks and on-orbit reprogrammable capabilities. Crosslinks enable greater accuracy, and on-orbit reprogrammability can counter jamming and spoofing by providing means to update signal and/or data streams and quickly counter emerging threats without the need to produce and launch new satellites.
A necessary and critical element of GPS modernization is also the development of a systematic road map for the use of our modernized GPS system by civil manufacturers and users across industries. Together, these steps will allow the United States to maintain its global leadership; enable U.S. firms to continue to offer innovative GPS-based products and services; and counter efforts by our international adversaries to give preference to their own technologies.
As the first and unrivaled provider of space-based services to the public, GPS currently provides $1 billion in economic impact from the U.S. civil GPS sector every day. As we move to a multi-constellation world, it is more critical than ever that the U.S. accelerates investment in our GPS enterprise to enable the next-generation benefits that a modernized constellation will bring to our warfighter, the U.S. economy and the free nations of the world.
Rep. Don Bacon, R-Neb., is a member of the House Armed Services Committee and a co-chair of the congressional Global Positioning System Caucus. He retired from the U.S. Air Force as a brigadier general.
Rep. Mikie Sherrill, D-N.J., serves on the House Armed Services Committee and is a co-chair of the congressional Global Positioning System Caucus. She served in the U.S. Navy for nearly a decade as a helicopter pilot and Russian policy officer.
Russia’s brutal aggression on Ukraine changed the world in a few days. Devastation and displacement in Europe already are on a scale unseen since World War II, and the risk of a catastrophe greater by orders of magnitude has not been as high since the Cuban Missile Crisis of 1962, the year I was born. Given the long production timeline of a monthly magazine, I will not venture a guess as to what the headlines will be on the day you read this.
The Russian assault has sharply raised concerns about GNSS vulnerabilities. In a March 17 bulletin, the European Union Aviation Safety Agency (EASA) warned of a GNSS outage leading to the degradation of navigation and surveillance. Reports analyzed by EASA indicate that since Feb. 24, GNSS spoofing and jamming has intensified in the Baltic Sea, neighboring states, Eastern Finland, the Black Sea and the Eastern Mediterranean. “The effects of GNSS jamming and/or possible spoofing,” the bulletin stated, “were observed by aircraft in various phases of their flights, in certain cases leading to re-routing or even to change the destination due to the inability to perform a safe landing procedure.”
Russia already has aided in the proliferation of handheld GPS jammers, the deployment of road-mobile jammers, and even development and testing of space-based jammers. Now, it could turn its substantial cyberspace hacking capability against the ground-control segments of GPS and Galileo.
When Russia tested an anti-satellite weapon on Nov. 15, 2021, the Kremlin claimed on state television that this capability “means that if NATO crosses our red line, it risks losing all 32 of its GPS satellites at once.” This threat was particularly dangerous because GPS satellites carry, as a secondary payload, the U.S. nuclear detonation detection system.
At a panel discussion about resilient GPS that I moderated at the International Wireless Communications Expo in Las Vegas on March 24, Diana Furchtgott-Roth, an adjunct professor at George Washington University and former deputy assistant secretary for Research and Technology at the U.S. Department of Transportation (DOT), titled her presentation “Russia Proves America Needs Backup GPS.” She cited the National Defense Authorization Act of 2017, the National Defense Authorization Act of 2018, and the National Timing Resilience and Security Act of 2018, which instructed DOT to provide a complement and backup for civilian GPS. The legislation required the Secretary of Transportation to put in place a backup system for GPS by the end of 2020, subject to congressional appropriations. However, she pointed out, these funds have not yet materialized.
Multiple technologies can and should be used to complement GPS. Several of them are mature and commercially available, including signals from low Earth orbit satellites and terrestrial broadcast stations.
Meanwhile, the United States should accelerate the launch schedule for GPS III satellites already produced. They provide better accuracy, anti-jamming capabilities, and opportunities for civilian connectivity that could offer critical assistance to its European allies.
My February column explained why it is important to account for horizontal movement of marks everywhere, and not just in areas influenced by active crustal movement due to earthquakes such as Southern California.
It provided information about the NOAA CORS Network (NCN) rates of movement based on International Reference Frame of 2014 (ITRF2014) coordinates and horizontal velocity information. It highlighted reports from the National Geodetic Survey (NGS) that describe models that will facilitate users transferring coordinates between reference frames and dealing with intra-frame movement between marks based on surveys performed at different epochs.
NAPGD2022 orthometric heights will primarily be accessed through GNSS technology.
As I stated in my February column, this is not just a horizontal positioning issue. In this month’s column, I address estimates of vertical movement that will have to be accounted for in the new, modernized National Spatial Reference System (NSRS).
NAPGD2022 will provide gridded models for North America (that includes CONUS, Alaska, Hawaii, the Caribbean, Canada, Mexico, Central America and Greenland), American Samoa and Guam/Commonwealth of Northern Mariana Islands (CNMI). My previous columns have described the NAPGD2022 in detail. The revised NOS NGS 64 report mentioned that NAPGD2022 will be built upon ITRF2020. It states that NAPGD2022 will operate equally well in any of the four new terrestrial reference frames developed as part of the new, modernized NSRS in 2022.
As I stated in previous columns, orthometric heights in NAPGD2022 will be defined through GNSS ellipsoid heights and GEOID2022. This means NAPGD2022 orthometric heights will primarily be accessed through GNSS technology. GEOID2022 will be defined in a manner that best fits global mean sea level at the epoch of NAPGD2022.
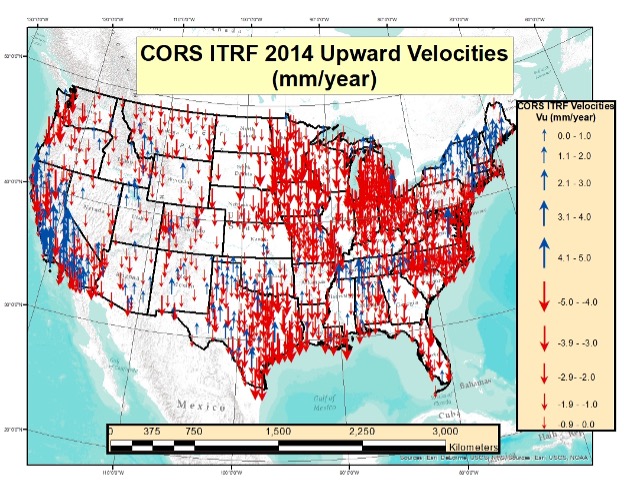
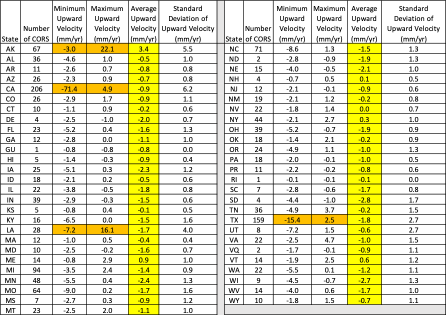
As in my previous column, to better visualize the potential size of the vertical movement, I used the CORS ITRF2014 coordinates and velocities from the NGS website to create plots depicting the upward velocity (Vu) values for CORS that are designated as operational and have computed velocities. [Note: I use the term upward because that is how it is reported on the NGS CORS website under the tab labeled “position and velocity.” The term upward velocity means movement in both directions — negative is downward and positive is upward.] The box below shows maximum, minimum, average and standard deviations of upward velocity values for each state and territory of the United States.
Table of ITRF 2014 Upward Velocities of US CORSs
The upward velocity values are not as systematic as the horizontal velocity values, and they are significantly smaller. I have highlighted the average value velocity column. As indicated in the table, the values vary from state to state, but they are all small relative to the horizontal movement values. (See my previous column for plots depicting the horizontal values.)
What is interesting is the range of values in some states. For example, Alaska and California have a very large range — understandable because of the active earthquakes and other movement that occur in these states. Also, Louisiana and Texas have a very large range due to local subsidence.
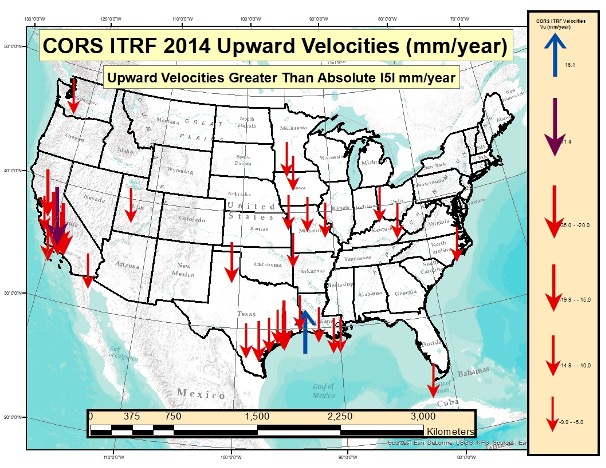
I decided to highlight the values for the conterminous United States (CONUS) in two separate plots. The box “Upward Velocities (Vu) Between +/–5 mm/year in CONUS” depicts upward velocities (Vu) between +/–5 mm/year in CONUS. The box “Upward Velocities Greater than Absolute Values of 5 mm/year in CONUS” depicts upward velocity values greater than +/–5 mm/year.
Upward Velocities (Vu) between +/- 5 mm/year in CONUS
Image: Dave Zilkoski
It’s obvious that most of the vertical movement values are between +/–5 mm/year in CONUS. There are some large values in California, Louisiana and Texas. This is highlighted in both plots.
Upward Velocities (Vu) Greater than Absolute Values of 5 mm/year in CONUS
(Image: Dave Zilkoski)
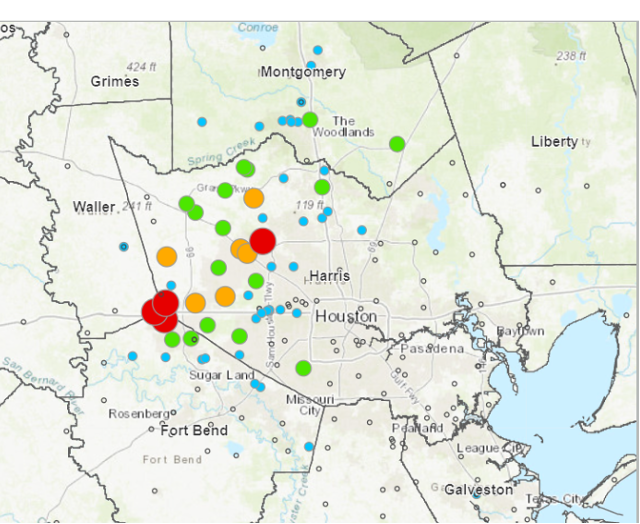
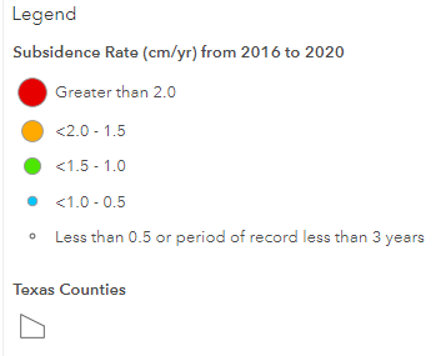
As indicated in the plots, some of the values exceed 10 mm/year. In five years, the heights of marks in these regions could potentially change by 5 cm. An example of the potential subsidence in the Houston-Galveston, Texas, region is depicted in the box below. As indicated in the plot, some marks are subsiding greater than 2 cm/year. That means in five years the marks in that region could have subsided more than 10 centimeters.
Estimate of Subsidence in the Houston-Galveston, Texas, Region
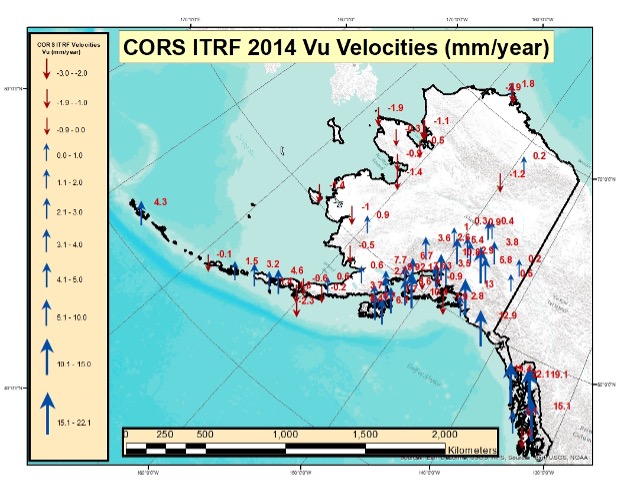
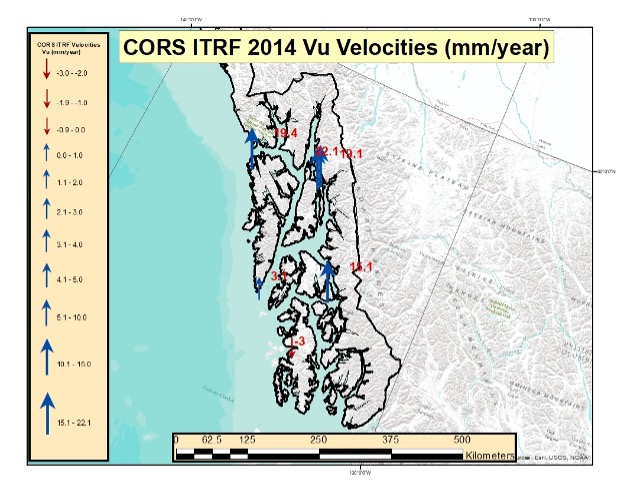
The box below depicts the values in Alaska. Most of these values indicate that the marks are uplifting. Some of these values exceed 10 mm/year. Once again, height coordinates in some regions will potentially change 5 cm in five years. I generated a separate plot for the southeastern region of Alaska. (See the box titled “Upward Velocities (Vu) in Southeastern Alaska.”)
Upward Velocities (Vu) in Alaska [All Values]
Image: Dave Zilkoski
Upward Velocities (Vu) in Southeastern Alaska [All Values]
Image: Dave Zilkoski
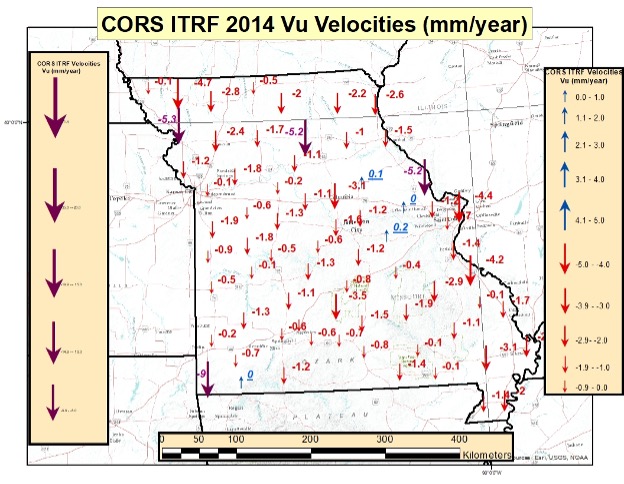
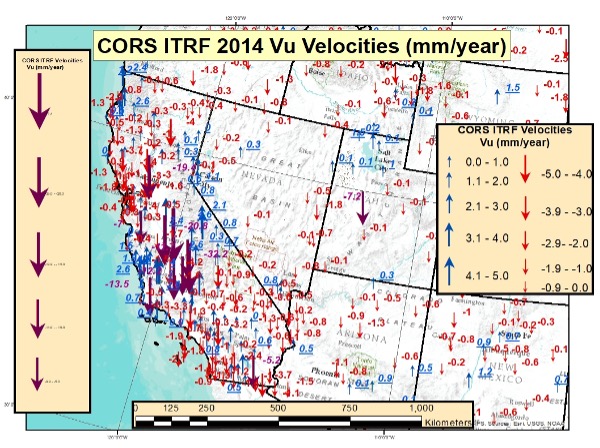
As I did in my previous columns, I prepared several plots that depict the upward velocities in various regions of the United States. See the boxes below for North Carolina, Missouri Southwest U.S. The plots indicate that the magnitude of the vertical movement varies from state to state, as well as within the states.
CORS ITRF 2014 Upward Velocities (Vu) in Missouri [All Values]
Image: Dave Zilkoski
CORS ITRF 2014 Upward Velocities (Vu) in Southwest U.S. [All Values]
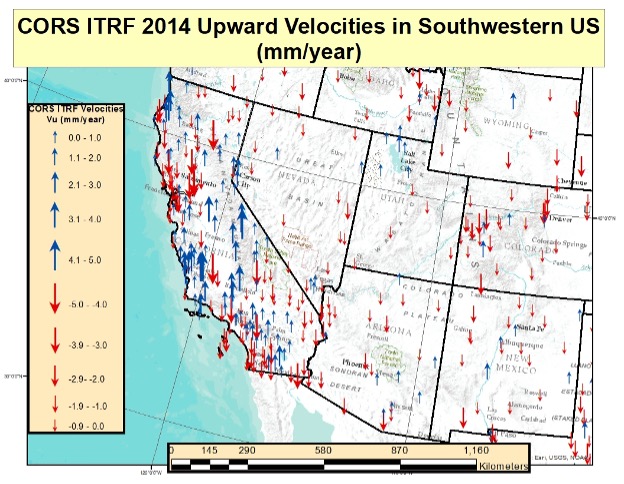
Image: Dave Zilkoski
CORS ITRF 2014 Upward Velocities (Vu) in Southwest U.S. [Values Between +/- 5 mm/year]
Image: Dave Zilkoski
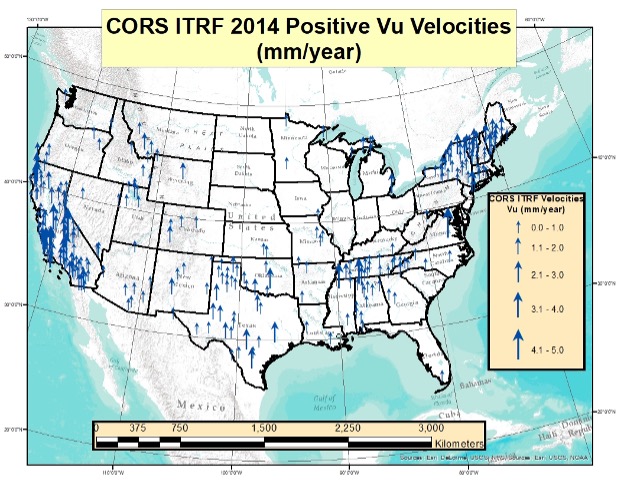
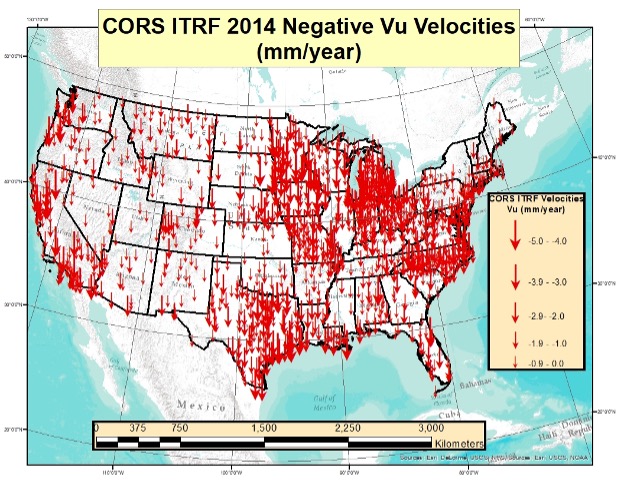
I also generated plots that separately depict the positive and negative upward velocities for the conterminous United States. There are more negative upward velocity values than positive values.
CORS ITRF 14 Positive Upward Velocities (Vu) in Conterminous U.S. (Values between 0 and 5 mm/year)
Image: Dave Zilkoski
CORS ITRF 2014 Negative Upward Velocities (Vu) in Conterminous U.S. (Values between -5 and 0 mm/year)
Image: Dave Zilkoski
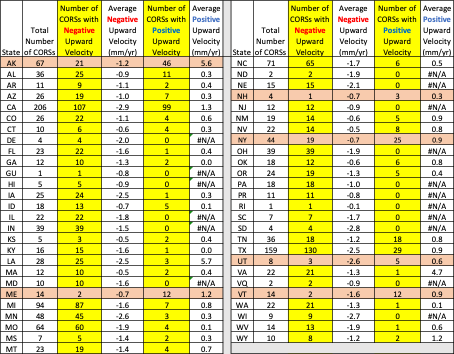
The table below provides the number of CORS with negative upward velocity values and the number of CORS with positive values for every state and territory of the United States. I have highlighted the states and territories that have more positive values than negative values. As you can see, only six states have more positive upward velocities than negative values. Four of the six states are in Northeastern United States.
Table of ITRF 2014 Positive and Negative Upward Velocities for United States
So far, this column has only addressed the vertical movement at the NCN CORS. The values at the sites indicate the potential movement of marks in the area of the CORS. The rates are based on GNSS data and have an estimate of error associated with them.
I’m not sure how NGS will address the vertical movement effects in the new, modernized NSRS. That said, NGS will be monitoring the CORS and looking for trends to help describe the movement at the CORS. These trends will be an indication of what may be happening in the area.
In addition to the movement of individual marks, there are geophysical reasons for changes in the geoid. As I stated in previous columns, orthometric heights in NAPGD2022 will be defined through ellipsoid heights and GEOID2022. Therefore, changes in the geoid model will be very important to users estimating orthometric heights using GNSS.
As stated in the NGS 64 report, NGS has set a goal of maintaining geoid accuracy at 1 centimeter (1 standard deviation) in both absolute and differential geoid undulations. Figure 13 from the NGS 62 Report depicts an estimate of the secular change in the geoid. As indicated in the plot, the changes are very small, ranging from –1.25 mm/year to 1.5 mm/year.
What I find interesting is the small negative change in the southeastern United States. There are other drivers for geoid changes. Future columns will address some of these changes and what it means to users.
Figure 13 from NOS NGS 62 Report
Image from NGS website: Blueprint 2 Revised NOAA_TR_NOS_NGS_0064.pdf
Figure 13 – Secular Geoid Change
Lastly, I’d like to highlight a new service from NGS: “NGS Webinar Series Certificates of Attendance.” See the box titled “Ways to Earn a Certificate of Attendance.” Basically, users can earn certificates by viewing a webinar after it has been posted by NGS. This is very useful for users who could not attend the original webinar. I encourage all users to check out the site to find out more information about the new service.
Ways to Earn a Certificate of Attendance
Image from NGS website: https://geodesy.noaa.gov/web/science_edu/webinar_series/certificates.shtml
Lidar sensors that used to cost tens of thousands of dollars now cost only hundreds of dollars. With prices significantly decreasing, 3D sensors are more accessible than ever before. Now, what was once a niche technology exclusively for autonomous vehicles is being deployed globally to make places safer and smarter. Additionally, the industry is continuing to grow: market analysis firm Yolé estimates that the lidar industry will be worth nearly $4 billion by 2025, a 19% CAGR between 2020 and 2025.
While decreasing sensor prices are a critical factor in the proliferation of lidar, an arguably more significant development is the development of robust perception software that can track, identify and monitor with far greater accuracy and efficiency than ever before.
Effective 3D sensors, from lidar to radar and 3D cameras, require both hardware and software components. The hardware is critical to capturing data with high resolution and accuracy, while the software processes and comprehends the data, making them actionable. Essentially, software is the “brain” of sensors. Lidar, without equally strong perception software, is like an iPhone without iOS — inoperable and just a piece of machinery.
Today, at the confluence of these factors, we are beginning to see a proliferation of 3D perception applications beyond autonomous driving. Cities, security and retail are a few key sectors where I predict we will continue to see advancements over the next few years.
Making Cities Smarter
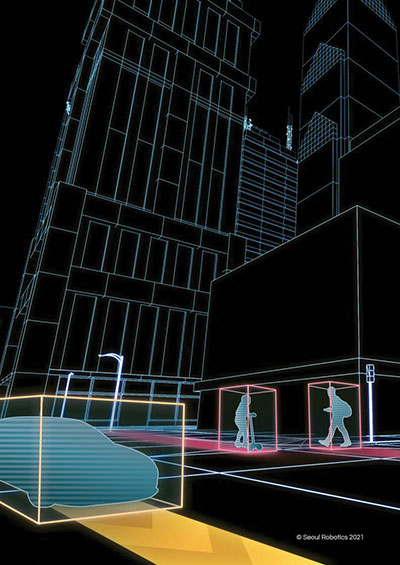
The steep drop in the cost of lidar sensors has made 3D sensors more accessible than ever. (Image: Seoul Robotics)
Today’s cities have a variety of challenges to address, from decreasing traffic collisions to reducing congestion, and we are witnessing municipalities leveraging lidar to collect critical insights into city safety and efficiency.
However, why are they turning to 3D solutions, specifically? Because they can capture the data necessary to make actionable changes. 3D sensors were developed to quickly track and analyze city surroundings for autonomous vehicles, so they are an effective way to ensure that vehicles are not veering into opposing lanes or traversing crosswalks already occupied by pedestrians.
Cities also adopt 3D applications because they can often address multiple challenges with one system. For example, a city may install a lidar system on an intersection to detect traffic violations, but the system can also capture data about pedestrian safety and traffic flow. These multi-benefit solutions are ultimately more cost-effective for cities because they eliminate the need to install multiple different solutions to solve these problems.
Creating Safer Spaces
Companies are turning to 3D data to create safer and more secure environments. (Image: Seoul Robotics)
From airports to museums, from stadiums to music venues, the market for 3D-based security solutions is vast. While each of these environments is unique in how it operates, they all rely on technology to ensure that areas are secure, visitors do not enter prohibited areas, and crowds are seamlessly moving through the space.
3D perception helps address these challenges by creating “zones” that can alert security systems if someone enters. Additionally, because 3D sensors can detect and track various objects, including humans, they are increasingly becoming a popular solution for crowd control. They can help venues monitor and address foot traffic, such as with security lines, and they can be valuable in the event of an emergency to ensure that an area is clear.
Beyond the tangible benefits 3D sensors bring to different venues, companies are turning to 3D data to create safer and more secure environments because they are more accurate and anonymous. Unlike traditional camera-based systems such as CCTV, which are often prone to false positives, 3D data are incredibly accurate and precise, so they are less likely to set off alarms unnecessarily. Additionally, 3D data do not include biometric information, so they address privacy concerns while still ensuring that areas are secure.
Building 3D Retail Environments
By implementing 3D-based solutions into a physical retail environment, companies can better understand how shoppers are moving through and spending their time in stores. They can glean insights into key metrics, such as:
How long are people in line?
What areas of the store are receiving the most traffic?
With what products are people engaging most frequently?
As one example, Mercedes-Benz has integrated 3D sensors into its showrooms in Korea, gaining fascinating insights into customer behavior. For example, they’ve discovered that nearly 60% of customers spend their time looking at the trunk space of SUVs, and that red is the most popular color.
As these solutions continue to become more sophisticated and accessible, we should expect to see them in more areas of our everyday lives. The future of 3D perception is exciting, and it will ensure safer, smarter and more efficient spaces — improving the quality of life.
HanBin Lee is CEO of Seoul Robotics, a 3D perception company specializing in lidar.


![Figure 32: Geoid rate over CONUS based on the GSFC mascon model [mm/yr] (Image: NOAA)](https://stage.globalpositioningnews.com/wp-content/uploads/2022/05/Geoid-rate-CONUS.jpg)
![Figure 33: Geoid rate over Alaska from GSFC mascon model [mm/yr] (Image: NOAA)](https://stage.globalpositioningnews.com/wp-content/uploads/2022/05/geoid-rate-alaska.jpg)