Category: Opinions

  • Integrity is integral to precision agriculture

    Integrity is integral to precision agriculture


    THE TREKTOR HYBRID ROBOT for agriculture, made by the French company SITIA, can work on a variety of crops by changing the width of its wheelbase and can perform many repetitive tasks, such as spraying and hoeing. (Image: SITIA)
    The Trektor hybrid robot for agriculture, made by the French company SITIA, can work on a variety of crops by changing the width of its wheelbase and can perform many repetitive tasks, such as spraying and hoeing. (Image: SITIA)

    Precision agriculture has been around for more than 30 years and now covers the majority of U.S. farmland. It refers to the ability of farmers to observe, measure and respond precisely to the variability of soil and crop characteristics within and between fields by using maps of these characteristics and GNSS navigation. It enables them to reduce inputs of seed, water, fertilizer, pesticides and fuel while increasing outputs. It also enables them to work at night and in the fog and automate many functions at large feed lots.

    For precision agriculture, GNSS integrity can mean the difference between, say, a robot protecting a vineyard by weeding and spraying pesticides or damaging it by straying onto the vines.

    Autonomous Tractors, Mowers, and Feed Monitors

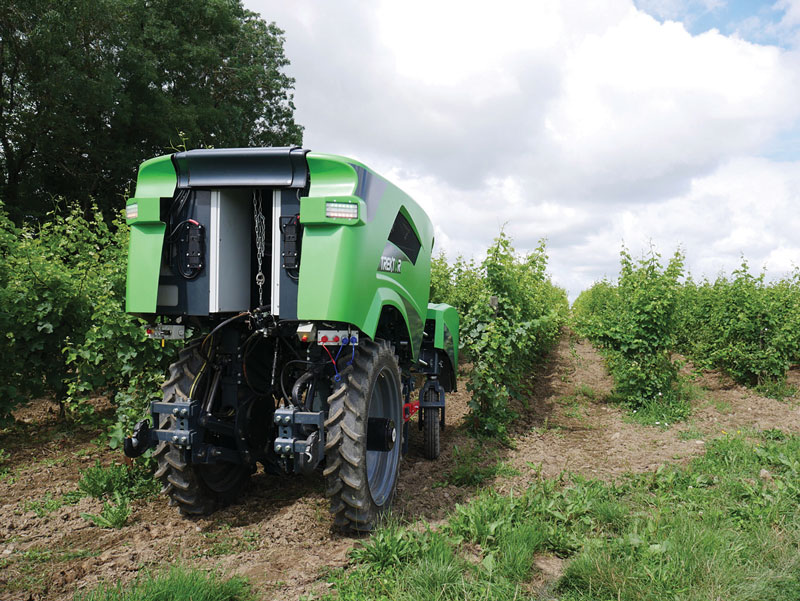
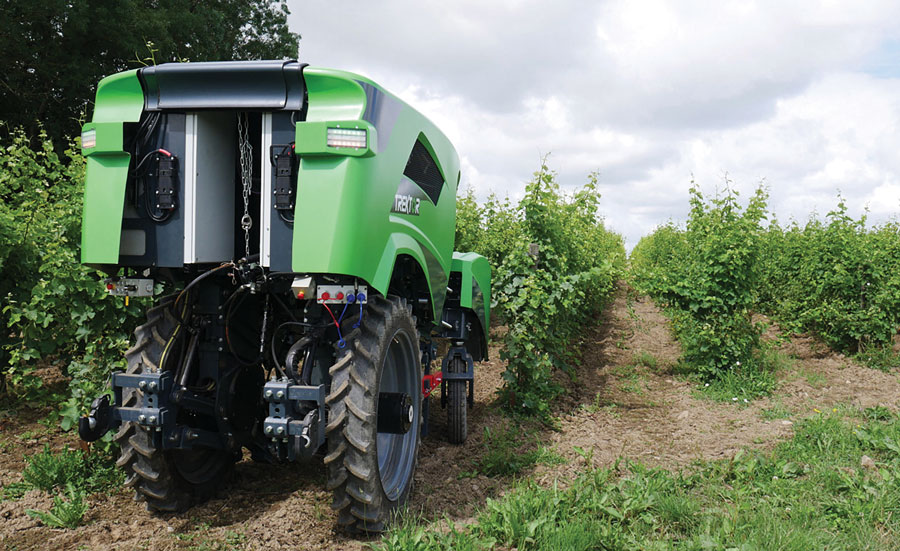
    SITIA, a French company, has developed an autonomous tractor that is used by, among others, an organic vineyard in France’s Loire valley to tirelessly weed the narrow rows between the grape vines — compensating for the movement of young workers to cities. Thanks to the high accuracy and integrity of the Septentrio GNSS heading receiver inside, the autonomous tractor has decreased the damage to the vineyards by more than an order of magnitude compared to the traditional work done by a farmer with a manual tractor.

    Renu Robotics, based in San Antonio, Texas, makes a robot for vegetation management, called Renubot. It uses machine learning, a form of artificial intelligence, to plan its route, optimize its energy consumption, perform self-diagnostics, collect environmental data and assess the topography that it traverses.

    Navigation is based on a stored map of paths, a Septentrio RTK GPS receiver and sensors to avoid obstacles. A radio link enables the Renubot to communicate with a control center, for reporting and updates. When the Renubot returns to its recharge pod, it charges its lithium battery and performs updates and downloads.

    Manabotix Pty. Ltd., an Australian company, has developed an automated system to monitor cattle in large feedlots, using GNSS, lidar scanning and other vision or perception technologies and artificial intelligence. This has greatly improved the accuracy and consistency of feedlot volume estimates, which for the previous 150 years had been the responsibility of a select few employees, who would visually gauge the amount of feed in concrete troughs. This visual inspection by humans was inherently imprecise, subjective, and inconsistent, often causing animals to eat too much or too little one day and get off their optimal growth curve or even become ill. Manabotix’s solution consists of a Septentrio AsteRx-U GNSS receiver and antenna, a lidar scanner, and an onboard processing platform.

    Statistical Analysis

    Integrity is a key aspect of all these applications. A part of delivering integrity is a statistical analysis called receiver autonomous integrity monitoring (RAIM), which was developed for such safety-critical applications as aviation or marine navigation. A refinement of RAIM, called RAIM+, takes this analysis to the next level as part of a larger positioning protection package.

    For autonomous operation, it can be particularly hazardous to be overly optimistic about GNSS accuracy. This parameter is reported in the form of positioning uncertainty, which is the maximum possible error on the calculated position. It is especially necessary in challenging GNSS environments, where the receiver has a direct line of sight to only a limited number of GNSS satellites or where GNSS signals are degraded. RAIM alerts users when their receiver’s uncertainty strays beyond the limits they have chosen for their application.

    Users can be deceived by a consistent position or movement — which can be consistently inaccurate. The positioning uncertainty gives them an indication of the extent to which they can rely on their receiver’s positioning accuracy at any given moment. The receiver operator can set an alarm limit, so that the receiver can flag situations when positioning uncertainty becomes too large.

    The blue line in Figure 1 shows position uncertainty estimated by a GNSS receiver under favorable conditions, when the view of the sky is unobstructed, and the receiver has a direct line-of-sight to many satellites.

    Figure 1. Under good GNSS conditions, the position uncertainty shown by the blue lines is well within the alarm limits, indicating safe operation. The actual position of the receiver should always remain within the blue uncertainty boundaries. (Image: Septentrio)
    Figure 1. Under good GNSS conditions, the position uncertainty shown by the blue lines is well within the alarm limits, indicating safe operation. The actual position of the receiver should always remain within the blue uncertainty boundaries. (Image: Septentrio)

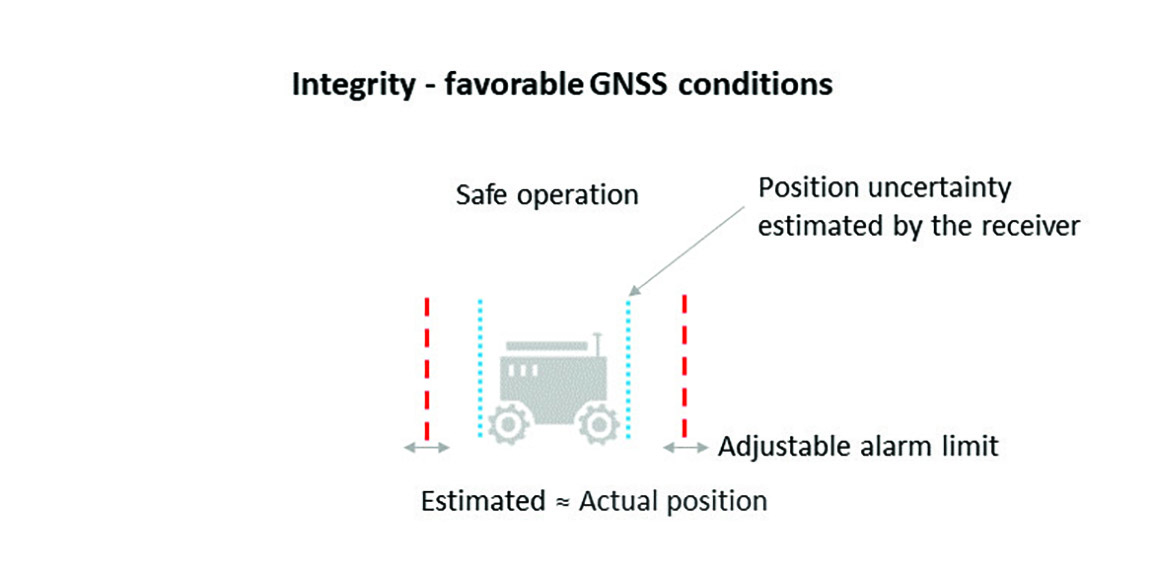
    During favorable conditions, the positioning uncertainty stays well below the alarm limit because the calculated position is almost the same as the robot’s actual position. However, in challenging environments, the truthfulness of positioning uncertainty becomes most critical (see Figure 2).

    Figure 2. In challenging environments receivers with high integrity report large positioning uncertainty, flagging possible inaccuracies to the system. If the receiver is too optimistic about its accuracy, the operation becomes hazardous. (Image: Septentrio)
    Figure 2. In challenging environments receivers with high integrity report large positioning uncertainty, flagging possible inaccuracies to the system. If the receiver is too optimistic about its accuracy, the operation becomes hazardous. (Image: Septentrio)

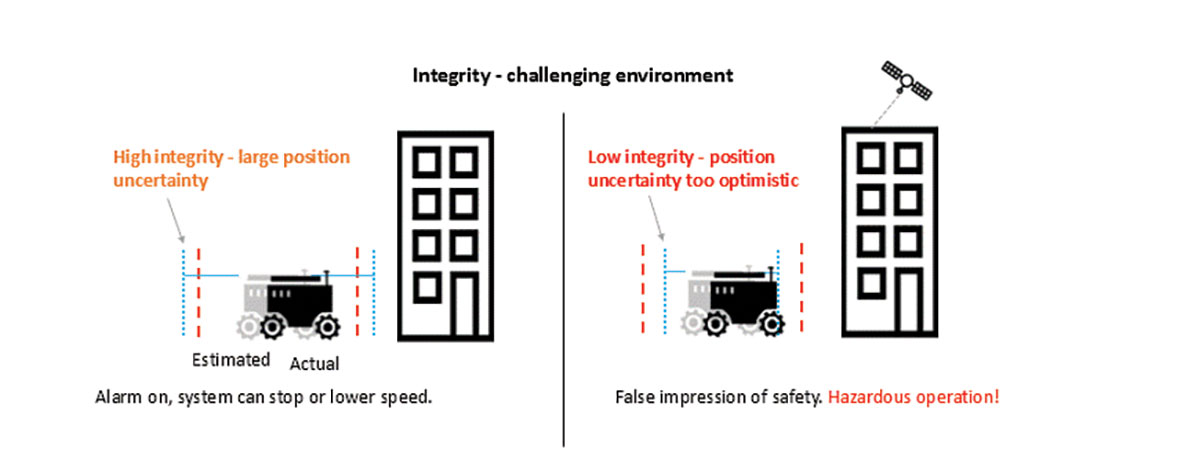
    For instance, when the view of the sky is partially obstructed by buildings or foliage, the receiver has access to only a limited number of GNSS satellites, making it harder to calculate accurate position. In such cases the receiver must report a higher positioning uncertainty, so that the system can take adequate action such as switching to lower speeds, staying further away from predefined boundaries, or stopping.

    A low integrity receiver may keep reporting an optimistic positioning uncertainty, that stays below the preset alarm limit even when the calculated position is way off from the actual position. The number may look fine, but effectively it becomes a “robot on the loose,” no longer on its planned path with a risk of damaging itself and its surroundings.

    Let us look at uncertainty limits in action during a GNSS car test in an urban canyon, where the view of the sky is partially obstructed by houses (see Figure 3). The orange lines are the positioning and its uncertainty boundaries reported by a Septentrio mosaic GNSS module in the car, while the red lines are the positioning and its uncertainty boundaries reported by another popular GNSS receiver. The white line shows the actual position of the car as it drives along the road. The orange uncertainty boundaries of the mosaic receiver are truthful and somewhat wider in this challenging environment, and you can see that the actual position always remains within these boundaries. On the other hand, the red trajectory jumps off course in a certain challenging spot on the road, with the actual position no more within the uncertainty boundaries, which remain too optimistic. In this case the competitor’s receiver gives a false sense of security and the system is unaware of its hazardous operation.

    Figure 3: In an urban canyon car test the Septentrio receiver reports truthful position uncertainty. A competitor receiver seems to be more accurate, while the actual position is not even within its reported uncertainty boundaries. (Image: Septentrio)
    Figure 3. In an urban canyon car test the Septentrio receiver reports truthful position uncertainty. A competitor receiver seems to be more accurate, while the actual position is not even within its reported uncertainty boundaries. (Image: Septentrio)

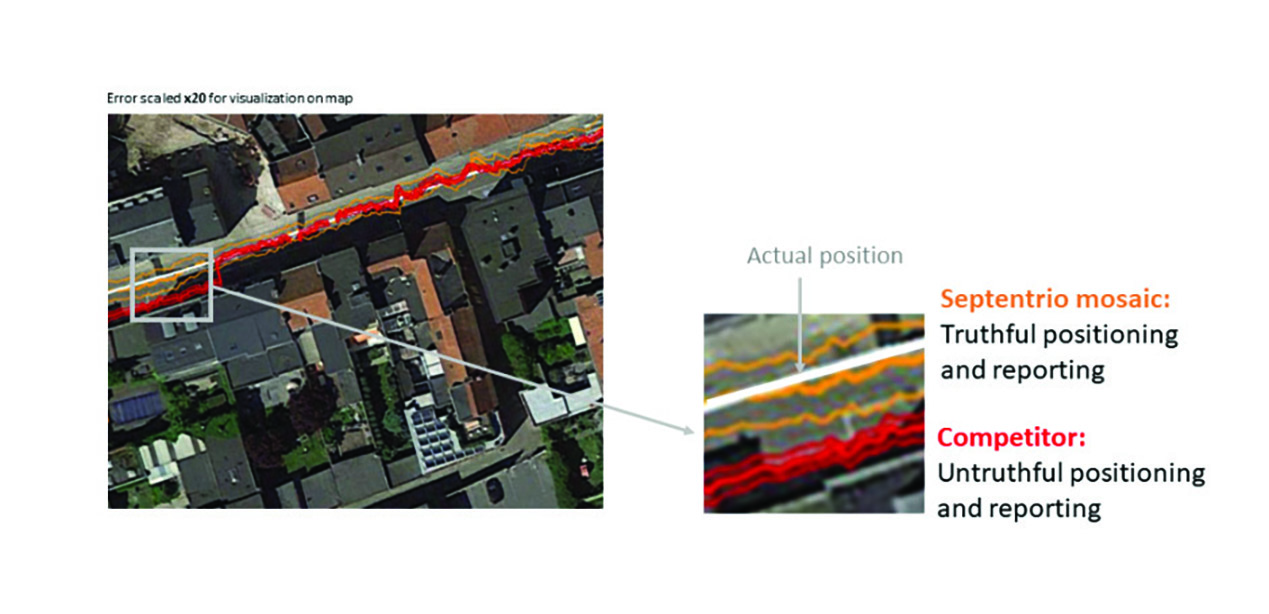
    If the receiver depicted by the red line provided navigational information for an ADAS automotive system, for example, this could mislead the system into thinking that the car switched lanes. If the system then attempted to correct the trajectory by switching back to the “correct lane” this would result in taking the car off course and potentially hitting the sidewalk or even another car.

    RAIM vs RAIM+

    The underlying mechanism behind truthful positioning uncertainty reporting is RAIM, which ensures a truthful positioning calculation based on statistical analysis and exclusion of any outlier satellites or signals. Septentrio receivers are designed for high integrity and take RAIM to the next level with RAIM+, guaranteeing truthfulness of positioning with a high degree of confidence.

    In Septentrio receivers RAIM+ is a component of a larger receiver protection suite called GNSS+ comprising positioning protection on various levels including AIM+ anti-jamming and anti-spoofing, IONO+ resilience to ionospheric scintillations, and APME+ multipath mitigation.

    Septentrio has fine-tuned its RAIM+ statistical model with more than 50 terabytes of field data collected over 20 years. It removes satellites and signals which may give errors due to multipath reflection, solar ionospheric activity, jamming and spoofing, while working together with the GNSS+ components mentioned above. Because of this multi-component protection architecture, it achieves a very high level of positioning accuracy and reliability which goes well beyond the standard RAIM. The RAIM+ statistical model is adaptive, highly detailed, and complete, taking advantage of all available GNSS constellations and signals. The full RAIM+ functionality is also available in Septentrio’s GNSS/INS receiver line. User controlled parameters allow it to be tuned to specific requirements.

    The diagram in Figure 4 shows RAIM+ in action during a jamming and spoofing attack on a Septentrio GNSS receiver. While AIM+ removes the effects of GNSS jamming, both AIM+ and RAIM+ work together to block the spoofing attack. Satellites with high distance errors, shown on the middle graph, are removed by RAIM+ since they do not conform to the expected satellite distance.

    Figure 4. In this scenario jamming gives satellite distance errors but is countered by AIM+ technology. During spoofing AIM+ eliminates some of the spoofed satellites, while other satellites that have wrong distances are dismissed by RAIM+ algorithms. (Image: Septentrio)
    Figure 4. In this scenario jamming gives satellite distance errors but is countered by AIM+ technology. During spoofing AIM+ eliminates some of the spoofed satellites, while other satellites that have wrong distances are dismissed by RAIM+ algorithms. (Image: Septentrio)

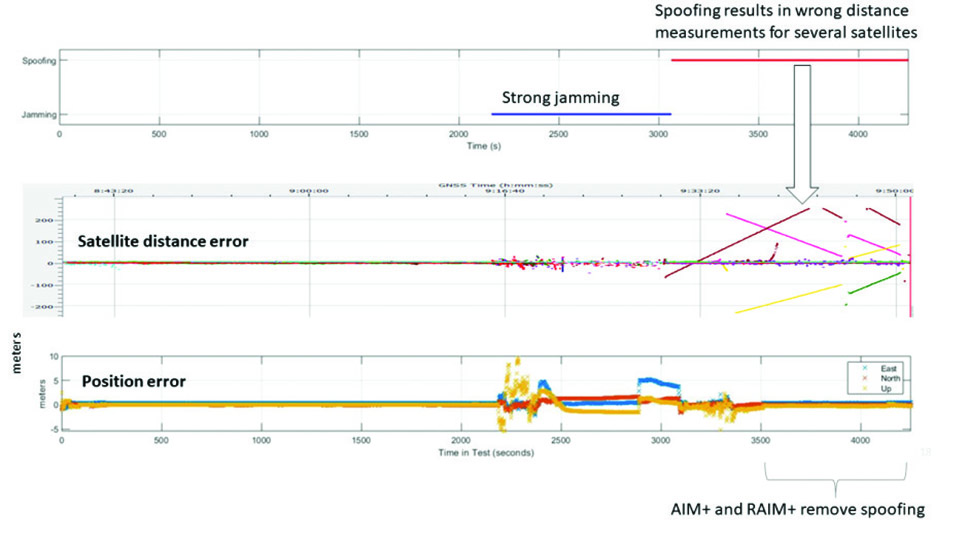
    This example shows that even in the case of jamming and spoofing, Septentrio’s high integrity receiver technology delivers truthful and reliable positioning on which any autonomous system can count.

    GNSS Design Around Reliability

    GNSS receivers designed to be reliable strive for high integrity in both reporting of the positioning uncertainty as well as in RAIM+ advanced statistical modelling. This ensures that these receivers provide truthful and timely warning messages and are resilient in various challenging environments. Other technologies such as inertial navigation system (INS) can also be coupled to the GNSS receiver to extend positioning availability even during short GNSS outages. Quality indicators for satellite signals, CPU status, base-station quality and overall quality allow monitoring of positioning reliability at any given time. High-integrity GNSS receivers provide truthful positioning in autonomous machines such as the SITIA weeding tractor. They are also crucial components in safety-critical applications, assured PNT and any other application where accuracy and reliability matters.

  • Increasing GNSS interference: UK and EU warn aviation

    Increasing GNSS interference: UK and EU warn aviation

    Image: Chalabala/iStock/Getty Images Plus/Getty Images
    Image: Chalabala/iStock/Getty Images Plus/Getty Images

    “Since February 2022, there has been an increase in jamming and/or possible spoofing of GNSS. This issue particularly affects the geographical areas surrounding conflict zones but is also present in the eastern Mediterranean, Baltic Sea and Arctic area,” the European Union Aviation Safety Agency stated in a Feb. 17 safety information bulletin.

    On April 4, the United Kingdom’s Civil Aviation Authority followed with its own advisory adding that, in addition to the year-over-year increase, interference has intensified in recent months citing the same geographic areas of concern.

    Both advisories list impacts to aircraft that include:

    • loss of ability to use GNSS for waypoint navigation
    • loss of area navigation (RNAV) approach capability
    • inability to conduct or maintain Required Navigation Performance (RNP) operations, including RNP and RNP Authorization Required (RNP AR) approaches
    • triggering of terrain warnings, possibly with pull up commands
    • inconsistent aircraft position on the navigation display
    • loss of automatic dependent surveillance-broadcast (ADS-B), wind shear, terrain and surface functionalities
    • failure or degradation of a variety of air traffic management service and aircraft systems that use GNSS as a time reference
    • potential airspace infringements and/or route deviations due to GNSS degradation.

    Airspace infringement can be a real concern, especially in conflict zones or near belligerent nations.

    GPS was first authorized for civil use because of just such an incident. In 1983, a Korean airliner accidentally trespassed into Soviet airspace and was shot down. Despite the fact that the GPS constellation had not yet been declared fully operational, in September of that year President Ronald Regan authorized its use in civil applications to help avoid similar tragedies in the future.

    GPS-based navigation for aircraft was subsequently found to be so efficient and successful that the Federal Aviation Administration (FAA) planned to eliminate all the terrestrial navigation beacons it maintains for air traffic and rely entirely upon GPS. Despite a 2001 report from the U.S. Department of Transportation’s Volpe Center cautioning against such an action, this plan was not abandoned until several years later when an aircraft crossing the Atlantic lost GPS reception.

    In recent years, aviation industry concerns about interference with GPS and other GNSS signals have intensified. These concerns have even included planned and announced military exercises that cause interference. Aviation industry groups have complained that the exercises disrupt and are too costly to their operations.

    Safety of life has also been a concern.

    In 2019 a commercial passenger aircraft was nearly lost to GPS interference in Sun Valley, Idaho. Flying a GPS-based approach through the mountains to the airport, low-level interference caused the aircraft to deviate from its course. In the words of the safety report filed with NASA, had a sharp-eyed radar controller hundreds of miles away not spotted the problem and intervened, “…that flight crew and the passengers would be dead, I have no doubt.”

    This incident was cited by the International Air Transport Association (IATA) in a filing later that year urging international action. Along with other groups, it pressed the U.N.’s International Civil Aviation Organization (ICAO) concerning “An Urgent Need to Address Harmful Interferences with GNSS.” In 2020, ICAO issued a letter to all member states recommending action.

    Similar concerns have been expressed by other international bodies as well.

    In 2021 a EUROCONTROL seminar said that there had been a 2,000% increase in GNSS RFI incidents since 2018 as measured by voluntary incident reporting. Also, that 38.5% of European en-route traffic operated in regions regularly affected by interference.

    The International Telecommunications Union, the U.N. body responsible for coordinating spectrum use, issued its own concern and warning in 2022. It cited more than 10,000 aviation-related incidents the previous year and, like ICAO, urged member states to take action to prevent such occurrences.

    While interference with GNSS signals is unquestionably a concern for commercial aircraft, it is perhaps even more of a safety risk for smaller, general aviation users.

    The only electronic navigation aids in many of these aircraft are consumer-grade GPS receivers. Since these are not certified by the FAA, they are only officially authorized for use to help pilots maintain “situational awareness” while they fly using visual reference with the ground. Interference with GNSS signals can cause disorientation and could result in aircraft becoming lost, running out of fuel, or straying into prohibited areas.

  • Science of geodesy and surveying: support progress report

    Science of geodesy and surveying: support progress report

    Image: Avalon_Studio/E+/Getty Images
    Image: Avalon_Studio/E+/Getty Images

    On March 20, 2023, I wrote a short announcement about a funding opportunity by the National Geodetic Survey (NGS) to support the science of geodesy.

    As mentioned in previous columns, Everett Hinkley wrote about the geodesy crisis in an ION article. Hinkley’s article summarized several action items that could help improve the lack of trained geodesists in the United States. One action was to encourage U.S. government support in the form of grants, professional development of staff, and research collaborations/affiliations. A pilot PhD geodesy educational program with three National Geospatial-Intelligence Agency (NGA) and one NGS employee is in place. He stated that the NGA expects to continue growing this program. Click here for more information on NGA’s academic research program.

    NGS’ geospatial modeling grant is another example of this action item. There needs to be more funds added to this task, but it is a start. The program priorities under NGS’ grant program include: research and develop new methodologies for defining and applications for working with the NSRS; develop and evaluate tools, models, and guidelines to access, analyze, and manipulate geodetic data; enhance infrastructure of geodetic control, coastal remote sensing data, survey measurements, and other physical datasets that comprise the NSRS; support education, capacity building, and technology transfer for the future of geodesy; coordinate through partnerships with local, state, and regional users such as state and local governments, universities, and/or the public sector.

    The geospatial modeling grant was included in the 2023 Omnibus Appropriations Bill. The agreement provides $8,000,000 for the program and states that all funding shall be distributed externally. Hopefully, the same amount or more will be in FY 24 appropriations. Additional information about NOAA’s appropriations can be found in the 2023 Omnibus Appropriation Bill under the explanatory statement for Commerce, Justice, Science and related agencies. The bill can be found here. To find the language in the bill click here, then search the document for “geospatial.” See the image below for the language in the bill.

    Image: Senate.gov website
    Image: Senate.gov website

    For those that are interested in the appropriation process, the image below provides a list of the senators that work on these agencies’ appropriations. If you are interested in learning more about the appropriation process and the geospatial modeling grants, contact your senator. The more congressional representatives know about the geodesy crisis — which includes the lack of trained geodesist as well as surveyors — the sooner they will support funds to help correct the problem. Click here for a list of senators on the Commerce, Justice, Science and Related Agencies Appropriation Committee.

    Advancing geodesy with conferences

    Another activity that promotes the advancement of geodesy and surveying are national and international surveying and mapping conferences. Before the American Congress on Surveying and Mapping (ACSM) disbanded, the four-member organization collaborated to convene annual surveying and mapping conferences in the United States. Topics like those presented at a FIG Working Week were presented at these conferences.

    Since these ACSM conferences are no longer being held, I encourage users of geospatial data and GNSS technology to attend conferences like FIG Working Week 2023. I have participated in several FIG meetings and learned a lot from presentations as well as holding hallway meetings with experts from the international surveying and mapping community. In the March column, I highlighted that FIG Working Week 2023 is going to be held in Orlando, Florida, on May 28 – June 1. NGS will be presenting a full-day worth of content on NSRS modernization during the conference. I want to highlight some presentations that may be of interest to readers. Register for FIG Working Week 2023 here.

    The image below provides a list of NGS presentations with scheduled times. There will be a panel session in the beginning of the day to set the context for the day.

    Agenda of NGS DAY at FIG Meeting (Image: FIG website)
    Agenda of NGS DAY at FIG Meeting (Image: FIG website)

    As in most conferences there are several ways participants can register, one day to the entire conference. This is a great opportunity to have discussions with the leadership of the National Geodetic Survey and individuals working on the development of the new, modernized NSRS.

    Image: FIG website
    Image: FIG website

    There are a lot of presentations on various topics so, I would encourage readers to look through the entire agenda. FIG’s technical work is led by ten commissions. The August 2021 column provided information about the FIG commissions. See the list of commission below:

    Commission 1 – Professional Standards and Practice
    Commission 2 – Professional Education
    Commission 3 – Spatial Information Management
    Commission 4 – Hydrography
    Commission 5 – Positioning and Measurement
    Commission 6 – Engineering Surveys
    Commission 7 – Cadastre and Land Management
    Commission 8 – Spatial Planning and Development
    Commission 9 – Valuation and the Management of Real Estate
    Commission 10 – Construction Economics and Management

    The full technical program lists the topics by date and time. I highlighted sessions by commission 5 and 6 that I think would be interested to the surveying and mapping community. See the image below.

    Image: FIG website
    Image: FIG website
    Image: FIG website
    Image: FIG website
    Image: FIG website
    Image: FIG website
    Image: FIG website
    Image: FIG website
    Image: FIG website
    Image: FIG website
    Image: FIG website
    Image: FIG website
    Image: FIG website
    Image: FIG website

    Finally, I would like to highlight a NGS product that is now in production mode. That is, OPUS Project 5.1 is now a production product. *NGS did not make an official announcement about this change, but if you access OPUS Project the new version comes up. As described in the March column, OPUS Project 5.1 routine allows the use of RTN vectors and post-processed vectors from vender software.

    Clicking the “projects” icon on the OPUS page connects you to the latest version of OPUS Project 5.1. See image below. Please see the March column or NGS’ January webinar to learn more about OPUS Project 5.1.

    Image: NGS Website
    Image: NGS Website

    *Note: As of the writing of this column, March 29, it is still listed on the beta release section of NGS website. If you click on OPUS Project 5.1 in the Beta Release section, it will link to the production version of the routine.  

  • Monitoring earthquakes, eruptions and avalanches to mitigate risk

    Monitoring earthquakes, eruptions and avalanches to mitigate risk

    On Feb. 6, a magnitude 7.8 earthquake struck Turkiye and northern Syria creating enormous damage throughout both countries.
    On Feb. 6, a magnitude 7.8 earthquake struck Turkiye and northern Syria creating enormous damage throughout both countries. (Image: mustafaoncul/iStock /Getty Images Plus/Getty Images)

    Geographical information of urban areas is critical because it forms the basis for planning, intelligent urban modeling and disaster mapping and management. For many decades, ground surveys and aerial photographs were used as the primary tools for collecting this data. Starting in the 1990s, these methods were replaced by such advanced remote-sensing technologies as synthetic aperture radar (SAR) and ground-based interferometric radar (GBIR).

    This article explores the use of software-defined radio (SDR) platforms for acquiring high-resolution SAR/GBIR images, including:

    • How low-cost commercial-off-the-shelf SDR platforms can be used to realize complex systems for acquiring images and processing measurements.
    • How different specifications of SDRs make them suitable for use in SAR applications.

    Hazard Monitoring in Urban Areas

    Many urban areas and critical infrastructure are in regions highly prone to natural disasters such as volcano eruptions, earthquakes, avalanches and landslides, or near man-made systems such as dams and quarries. Monitoring of surface changes and structures is integral to the mitigation of risk and ensuring public safety. Modern remote-monitoring systems allow surface displacements to be monitored without the need to access a location. With these systems, several square kilometers of Earth’s surface can be monitored at once and with high accuracy. The sub-millimeter accuracy of modern remote-monitoring technologies enables accurate measurements to be collected with impressive precision, including in rainy and foggy conditions.

    Remote-monitoring systems are autonomous and can operate for a long time without human intervention. Their real-time feedback makes them suitable for use as early-warning systems. In addition, these monitoring systems can be integrated into a wide range of sub-systems, such as decision support systems that assist decision makers in assessing emergency plans and selecting the best options.

    Using Radar to Measure

    Details of the surface observed by a SAR satellite are encoded in the amplitude and phase of a SAR image. The amplitude component contains information about the surface roughness and terrain slope of the target area, while the phase component contains information about the elevation of the satellite.
    A typical SAR satellite transmits microwave signals toward a target area at an oblique angle and measures the backscattered signal. The intensity of the reflected signal is mainly determined by the roughness and the structure of the target, and the distance between the satellite and the target. This measurement is usually described in terms of the radar cross-section (RCS) parameter, which is obtained by calculating the ratio of the scattered to the intercepted signals as shown in this equation:

    Equation PNT Ca

    The RCS parameter is mainly dependent on the surface roughness and the dielectric properties of the target object.
    The interferometric SAR (InSAR) technique allows surface movements to be identified. These observations also can be used to measure and monitor changes associated with volcanic eruptions, tectonic activity and other geophysical processes. To identify crustal changes using this geodetic technique, at least two SAR images are required.

    Figure 1. Phase shift in InSAR observations due to ground movement.
    Figure 1. Phase shift in InSAR observations due to ground movement. (Image: Simon Ndiritu)

    In differential InSAR, two images of the same location that are recorded at different times are used. If a surface movement has occurred between the first and the second acquisition, a phase shift is observed (Figure 1). The presence of interference fringes on an interferogram is an indicator of a phase shift and these fringes are summed during processing to provide a relative value of the phase change.

    Ground-based SAR (GBSAR) employs the synthetic aperture radar technique to capture high-resolution images of the electromagnetic reflectivity of a target. This remote-sensing system is commonly used for monitoring civil infrastructure, buildings, mines, landslides, glaciers and more. While spaceborne SAR is capable of surveying large areas and records data over long periods of time, usually several weeks or months, GBSAR is suitable for monitoring small areas and has short sampling periods, usually a few minutes. In most surveying applications, the two remote-monitoring techniques are used together in a complementary fashion to enhance the overall performance.

    The all-weather monitoring capability of satellite-based SAR makes it a popular tool for natural disaster management. Since the launch of the first SAR satellite in 1991, this technology has provided many emergency response teams with important insights on manmade and natural hazards. SAR data can be used to study different aspects of long-term behaviors of slow-moving surfaces, which is critical for planning emergency response to natural hazards such as volcanic eruptions, landslides and avalanches. SAR satellites orbit Earth at altitudes of between 500 km and 800 km and operate in the C-band (5 GHz to 6 GHz), X-band (8 GHz to 12 GHz) and L-band (1 GHz to 2 GHz). The temporal resolution of these satellites is mainly determined by their revisit periods.

    Software-Defined Radio Platforms

    A typical SDR platform features a radio front end (RFE) and a digital back end, with the RFE performing receive (Rx) and transmit (Tx) functions and offering a wide tuning range, typically 0 GHz to 18 GHz. This range is acceptable for widely used bands in SAR applications, including L-band, C-band and X-band.

    The digital back end of a high-performance SDR system features a field programmable gate array (FPGA). This FPGA offers a variety of digital signal processing (DSP) capabilities, including upconverting, downconverting, modulation and demodulation. In addition, an SDR platform offers multiple transmit and receive channels, making it suitable for implementing multi-in multi-out (MIMO) radar systems.

    The architecture of SDR platforms allows them to integrate easily with a wide range of complex systems, such as SAR systems. The reconfigurability of SDRs allows upgrades and updates to be implemented without modifying the existing hardware, and can be designed to meet the size, weight and power (SWaP) requirements of an application. These features make SDRs suitable for implementing custom SAR monitoring solutions in small and large ground stations (Figure 2).

    Figure 2. A simplified diagram of an SDR-based SAR system is shown, which employs a mobile-transmitter fixed-receiver passive bistatic SAR (MF-PB-SAR) architecture. (Image: Simon Ndiritu)
    Figure 2. A simplified diagram of an SDR-based SAR system is shown, which employs a mobile-transmitter fixed-receiver passive bistatic SAR (MF-PB-SAR) architecture. (Image: Simon Ndiritu)

    Integrating SDRs with SAR

    A software-defined radar (SDRadar) is an SDR-based radar system that offers high flexibility and robustness. Compared to conventional radar, SDRadar offers many benefits, including the opportunity to reuse hardware, develop multi-function radar solutions, achieve faster development cycles, and have easier implementation of updates and new algorithms.

    Tests with prototype SDR-based GBSAR systems have revealed the strong potential of SDR-based implementations. The MIMO architecture of an SDR platform allows realization of complex multi-frequency GBSAR systems uniquely suited for measuring displacement and other geophysical characteristics of landforms. SDR-based GBSAR systems can operate in different frequency bands and offer unmatched flexibility when it comes to signal generation and digital signal processing.

    Many prototypes of airborne/satellite SAR systems based on SDR platforms have been implemented and their performance evaluated. Results have shown that they can offer better performance compared to conventional implementations. The use of multiple independent channels by SDR platforms allows the realization of compact and power-efficient multimode SAR systems, while the architecture of an SDR platform allows complex signal processing techniques such as digital beamforming (DBF), null steering and direction of arrival estimation to be implemented on FPGA.

    Benefits of Integrating SDRs with SAR Solutions

    Integrating SDRs into SAR systems provides many benefits. The MIMO architecture of SDR systems provides more channels than are required for SAR functions. The extra channels can be used for other applications such as satellite communications during emergencies. The wide frequency-tuning range of an SDR system allows the realization of a multi-function system with applications using different frequency bands. The reconfigurability of SDR platforms allows them to be repurposed for other applications. In addition, this reconfigurability enhances reusability, scalability and power efficiency. The low-latency FPGAs in high-performance SDR systems allow the realization of ultra-high-speed DSP algorithms for use in image processing and DBF.

    Conclusion

    The reconfigurability and impressive performance features of SDR platforms make them ideal for implementing scalable and flexible SAR monitoring systems for measuring land changes. The wide tuning range and MIMO architecture of SDR devices allows realization of a multi-function and multi-frequency system using a single device. In addition, the reconfigurability of SDR devices allows hardware reuse and low-cost implementation of updates and new algorithms.


    Brendon McHugh is the field application engineer and technical writer at Per Vices. He possesses a degree in theoretical and mathematical physics from the University of Toronto.

    Simon Ndiritu is an independent technical writer for Per Vices with a background in electrical and electronic engineer with a wealth of experience in designing hardware and firmware. He also has a passion for writing.

  • What does the future hold for military and commercial systems dependent on current GPS?

    What does the future hold for military and commercial systems dependent on current GPS?

    Artists rendering of the B-21 raider, which is being produced by Northrup Grumman for the U.S. Air Force to operate in tomorrow's high-end threat environment. (Image: U.S. Air Force)
    Artists rendering of the B-21 raider, which is being produced by Northrup Grumman for the U.S. Air Force to operate in tomorrow’s high-end threat environment. (Image: U.S. Air Force)

    With assured positioning, navigation and timing (APNT) and low-Earth orbit PNT (LEO PNT) coming on strong, what does the future hold for military and commercial systems dependent on the current configuration of GPS? Should military and commercial platforms be modified to include APNT, for now, with an eye to adding LEO PNT in the future? Should they integrate these two systems, or rely on one or the other as standalone systems?

    Government and industry agree that interference with GPS and all GNSS is an increasing threat as jamming and spoofing technologies evolve. This has prompted government support for APNT to bolster GPS. A Feb. 12, 2020, Executive Order required a comprehensive update to national policy on PNT services by the federal government, and by owners and operators of critical infrastructure to strengthen the resilience of critical infrastructure.

    Research, development and production have improved the performance — positioning, timing and (desired) accuracy — of GNSS PNT and the ability to operate in RF-challenged environments. APNT gives the U.S. military a reliable way to further enable GPS, or to act as an alternative to it, by utilizing other sensors, such as inertial navigation systems, differential GPS, visual sensors, lidar, radar, radios and star trackers that complement GPS.

    The near-term expansion of internet service to include commercial broadband LEO satellites also provides potential for robust PNT, using their waveforms as signals of opportunity (SOOP). GPS and other GNSS have an infrastructure to maintain very precise time throughout their constellations, as well as satellites with specially designed transmitters, clocks, and a waveform dedicated to the PNT function. By contrast, SOOPs are in space for another purpose and not optimized for PNT. Therefore, the challenge is to exploit features of the SOOP waveforms, designing innovative techniques to determine the range to each satellite and to provide users with reliable PNT. The approach for LEO PNT may have applications to ground troops and for aerial, munition, missile and commercial applications requiring higher levels of PNT security and integrity.

    GPS receivers for future military platform designs may use a software defined radio (SDR) approach and be capable of incorporating LEO PNT signals. This technology, although designed to work standalone, can be used to complement existing navigation sensors that are typically used in navigation systems, including APNT. Expansion to the usage of multiple constellations will serve to optimize performance and resiliency in an RF-challenged environment. However, LEO satellites’ closer proximity to Earth and their signal structures allow for higher signal powers, thus are more robust against jamming. With all these separate systems or fusion by SDR, how does the receiver ensure the integrity of the signal or its accuracy? An SDR qualification test would involve an unlimited number of scenarios.

    One hallmark of the GPS program is that it facilitates a thorough systems engineering effort by managing in a single location interface control documents (ICDs) for alternative systems being developed by different program offices all over the country. This makes both the integration of the systems and the development of the receivers extremely difficult and complex.

    “The new SPD-7 [Space Policy Directive 7, the United States Space-based Positioning, Navigation and Timing Policy, dated Jan. 15, 2021] focusing on interoperability and APNT is a seminal document to address a realized threat and a way forward,” said Bernie Gruber, a former head of the GPS Directorate (now the Military Communications and PNT Directorate). “To that end, the combination of SDRs and data fusion potentially offer a clear advantage to utilize signal and sensor diversity, thus improving the robustness of critical PNT information.”

  • Editorial Advisory Board Q&A: How could the U.S. develop GPS high-accuracy analogous to Galileo’s HAS?

    What would be required for the United States to develop and deploy a GPS high-accuracy service analogous to Galileo’s HAS?


    Headshot: Ismael Colomina
    Ismael Colomina

    “Galileo HAS is a particular implementation of a PPP-RTK service. U.S. companies are already providing similar fee-based services that are even more accurate than HAS. Therefore, there is no big technical challenge for the United States to provide a GPS HAS. Actually, the European Union already provides a HAS for GPS. It is more a question of strategy for GPS policy makers: which user segment to service with a HAS-like augmentation? What about other services analogous to Galileo’s OSNMA and the upcoming CAS [commercial authentication service] for resiliency purposes? In short, a HAS-like service would just require including it in the U.S. GNSS evolution roadmap.”

    — Ismael Colomina
    GeoNumerics


    Photo: Orolia
    John Fischer

    “The challenge is probably more political than technical. The U.S. government usually refrains from competing with commercial services. The prevailing attitude in the United States is that the private sector is more efficient than the public sector. Maybe the most practical approach is for the government to provide the authentication mechanism and open access to the data required, then allow the private sector to offer services. There isn’t a pressing need for high-accuracy GPS for transportation — it needs resiliency/reliability. However, precision agriculture needs it, so maybe sponsorship from the Department of Agriculture would be more effective than from the Department of Transportation.”

    — John Fischer
    Orolia


    Mitch Narins
    Mitch Narins

    When I saw this question, my first impression (as a systems engineer) was to ask ‘For whom? For what applications? For which services?’ (Positioning? Navigating? Time/frequency?) Many have concentrated on accuracy, competing in a GNSS Olympics to see who can achieve ‘the best’ position accuracy and precision (repeatability). Finally, (thanks to Logan Scott) integrity is being pushed beyond just SBAS and GBAS, and real civil authentication of signals is being pursued. I can promise nanometers/nanoseconds if I don’t have to prove it’s true. While we finally understand the need for zero trust, we must still address loss of service by establishing real complementary PNT.

    — Mitch Narins
    Strategic Synergies

  • First Fix: How high is the sky?

    First Fix: How high is the sky?

    Matteo Luccio
    Matteo Luccio

    When the U.S. Air Force shot down a Chinese balloon flying at 60,000 ft (11.4 miles) on Feb. 4, the incident raised many questions about international security, international law, U.S.-China relations and technology. Among them, where is the end of a nation’s airspace — the portion of atmosphere it controls above its territory? Its horizontal boundary corresponds to that of its land border and territorial waters, which extend 12 miles out from its coastline. However, there is no international agreement on the vertical boundary.

    The 1967 Outer Space Treaty — to which the United States is a party and which bans “appropriation” of outer space by any nation — omits a definition of “outer space” because none of the major powers wanted to limit their own freedom of action in space. At a United Nations meeting in Vienna in 2001, the U.S. delegation said, “Our position continues to be that defining or delimiting outer space is not necessary.”

    The United Nations has historically accepted as the boundary of space the Kármán line, at an altitude of 62 miles above mean sea level. It roughly marks the altitude where traditional aircraft cannot effectively fly using lift generated by Earth’s atmosphere, because the air there is just too thin. The Fédération Aéronautique Internationale agrees with this definition.

    Some countries have adopted a definition for their own legal purposes, usually based on either the Kármán line or on the altitude at which orbital flight is possible without utilizing atmospheric lift. As a courtesy, a state launching a space vehicle that will traverse another state’s territory during its sub-orbital flight will notify the overflight state.

    The U.S. military and NASA on the other hand, define space to begin at 50 miles above Earth’s surface. “Pilots, mission specialists, and civilians who cross this boundary are officially deemed astronauts,” according to the U.S. Department of Commerce’s National Environmental Satellite Data and Information Service.

    Escaping Earth’s atmosphere entirely is another story. It requires traveling at least 600 miles, to its outermost layer, where violent solar winds have greater sway than air. If that were the definition of space, however, the Space Shuttle (which orbited up to 200 miles up), the International Space Station (205 miles to 270 miles), active Earth observation satellites (280 miles to 500 miles), some of the National Oceanic and Atmospheric Administration’ s polar-orbiting satellites (540 miles) and most scientific satellites, including nearly all of NASA’s Earth Observing System fleet, would not be considered spacecraft! Lower orbits have significant air-drag, which requires frequent orbit re-boost maneuvers.

    There’s no question that GPS satellites, orbiting at an altitude of about 12,550 miles, are in space. That is why they are acquired, sustained, and operated by the U.S. Space Force (USSF), established in December 2019 as the newest branch of the U.S. armed forces. Its mission is to organize, train and equip space forces to protect U.S. and allied interests in space and provide space capabilities to the joint force. As the USSF grows, we’ll hear more about it.

    Matteo Luccio | Editor-in-Chief
    [email protected]

  • UAVs doing the dirty work in war and nuclear inspections

    UAVs doing the dirty work in war and nuclear inspections

    Now that balloon-season appears to be ending, unmanned aerial vehicles (UAV) are seeing more use in the war in Ukraine. With the delivery of an updated fast transport craft to the U.S. Navy, autonomous ship operations are expected to be tested extensively. In addition, use of collision-protected UAV is demonstrating high returns for nuclear facility inspections.

    UAVs used in Russia-Ukraine war

    UAV attacks on Moscow seem to be escalating. A Ukrainian UJ-22 UAV allegedly crashed March 2 near the village of Gubastovo, about 60 miles from Moscow. It’s not clear what the intended target was, or whether the UAV was armed, but an undamaged Gazprom gas plant is close to where the UAV crashed.

    The UJ-22 UAV has a maximum range of about 500 miles. Therefore, to maximize its range, it’s unlikely that a big payload was onboard. It may have been just an attempt to assess how far the UAV could penetrate Russian airspace and which targets are in range from Ukraine’s border.

    In an earlier apparent UAV attack, the Krasnodar oil facility about 500 miles from the Ukraine border was damaged. A group of Belarusian partisans announced that it attacked and damaged a Beriev A-50 Airborne Warning and Control aircraft (called Mainstay by NATO) using UAVs at the Machulishchy airfield near Minsk, escaping back into Belarus without incident.

    The peaceful use of UAVs for the good of humanity seems to be taking a backseat in the escalating Russian-Ukraine conflict, where armed UAVs are enabling previously unheard-of incursions. Russia will likely respond, hopefully limiting action to legitimate military targets as Ukraine has done. However, the existing Russian stock of Iranian-made Shahed 136 “loitering munition” and the Mohajer-6 reconnaissance UAV might be running low. Ukraine has shot down at least 24 Shahed 136 UAVs through January and February and Russia has recently reduced its UAV attacks on Ukraine.

    US Navy relies on autonomous capabilities

    The U.S. Navy is making great strides in its efforts to incorporate ships with autonomous capability into its fleet. Several developments initiated in 2008 have led to the creation of a fleet of 12 Spearhead EPF Expeditionary Fast Transport ships built by Austal USA. The latest ship, the USNS Apalachicola EPF-13, has been outfitted during build with complete autonomy and has just joined the fleet. The EPF fleet is designed for the rapid deployment of troops, tanks/armaments and heavy equipment. The latest EPF-13 — built by Austal USA, L3Harris and General Dynamics Mission Systems — has a range of 1,200 miles, can accommodate the V-22 Osprey tilt-rotor aircraft, and clocks in at a maximum speed of 40 knots.

    Image: Austal USA
    Image: Austal USA

    The earlier ships incorporated automation of hull, electrical and mechanical/power systems, which are all now accessible on the bridge. The latest EPF-13 has added automated maintenance, health monitoring and mission readiness. The EPF 13 Apalachicola comes with the ability to run independent unmannered operations for up to 30 days. At 337 feet long and displacing 362 tons, the EPF can carry up to 600 tons of weapons and equipment, while running a draft of less than 15 ft. Alternatively, EPFs have sufficient capacity to transport 312 soldiers over short distances, plus a crew of 41 when fully manned.

    Inspecting nuclear facilities with UAVs

    Clean-up operations at nuclear waste facilities are continuing to use UAVs for inspection and assessment of locations that are difficult to access and potentially contaminated. Flyability intends to add a Miron RDS-32 radiation sensor to its Elios-3 UAV family to gather in-situ radiation measurements while inspecting complex confined spaces at nuclear sites.

    In recent activity at a nuclear plant, an annual inspection of three tank rooms and collection of detailed visual video of a suspected leaking valve were readily accomplished in two UAV inspection sessions of a few minutes each.

    The previous manual inspection process required the plant output to be reduced to 20% of normal capacity over a six-hour cooldown. When radiation levels became low enough, two inspectors dressed in protective gear climbed down into the first tank room where radiation levels exposed each person to around 250 millirem (2,500 µSv or about 10% of the allowed annual exposure). They took a few still pictures and measured radiation levels, then exited each hot area before repeating the process for the other two tank rooms. The whole time, the productive output of the plant was significantly reduced. Another six hours was required afterwards to restore the plant back to full output, never mind that personnel were exposed to a bunch of radiation.

    Flyability’s solution is to fly an Elios UAV down into each tank room, take high-resolution video of the entire area in 1-2 minutes and repeat the process for each of the other tank rooms, without reducing plant output power. For detailed inspection of the suspected valve, the UAV was flown deeper into the reaction vessel. Detailed video was collected and the UAV was extracted — all within about 10 minutes.

    The bottom line is that generation of around 4.8 GW of power, worth maybe $456,000, was saved using the Elios UAV inspection approach. No one was exposed to the higher radiation levels inside the facility, and significant time was saved for both the annual and suspected valve inspections. Incidentally, the valve in questions was cleared of any potential leaks.

    Conclusion

    In summary, developments in autonomy include use in the Ukraine-Russian war, more ship automation for the U.S. Navy, and more efficient inspection of nuclear facilities.

  • New feature in OPUS Projects: Using RTN vectors to support 2022 Transformation tool

    New feature in OPUS Projects: Using RTN vectors to support 2022 Transformation tool

    February’s column focused on potential errors in orthometric heights using a digital barcode leveling system with multi-piece leveling rods. As stated in the column, businesses need to make decisions based on expenses and ultimately on the profit margin; but making a business decision that results in a bad technical outcome is never the right decision. This newsletter column is going to highlight a new feature in the National Geodetic Survey (NGS) Beta OPUS Projects 5.1 routine permitting the use of RTN vectors to support the development of the 2022 Transformation model.

    On Jan. 12, NGS held a webinar titled “Using RTN Data in OPUS Projects 5 for GPSonBM.” Users can download the video and PowerPoint slides here.

    I’ve been highlighting NGS’s GPS on Bench Mark program that supports the 2022 Transformation Tool in my columns since 2018. NGS delayed the completion date for the new modernized NSRS until 2025, so they have extended the cut-off date for submitting GPS on Bench Mark data for use in the 2022 Transformation Tool until Sept. 30.

    NGS GPS on BenchMarks Program (Image: NGS website)
    NGS GPS on BenchMarks Program (Image: NGS website)

    NGS has been developing tools that facilitate submitting data to the NGS GPS on BM campaign such as OPUS Share. The latest tool is the OPUS Project 5.1 routine that allows the use of RTN vectors. OPUS Projects 5.1 is a beta product, but NGS is now allowing users to use the routine to submit data for the GPS on BM campaign. My October 2021 column highlighted NGS’s Beta OPUS Projects 5.1.

    The 2023 requirements for using OPUS Projects in the GPS on BM program (Image: NGS website)
    The 2023 requirements for using OPUS Projects in the GPS on BM program (Image: NGS website)

    I’d like to note that OPUS has been updated to support the newly released ITRF2020 (IGS20) orbits. My October 2022column discussed the latest International Terrestrial Reference Frame of 2020 (ITRF2020) released by the International Earth Rotation and Reference System Service (IERS). A previous NGS news bulletin provided a statement about the new reference system and products.

    Excerpt from NGS News Bulletin (Image: NGS website)
    Excerpt from NGS News Bulletin (Image: NGS website)

    Clicking on the link titled “NEW: 2023 Requirements for Use in the GPSonBM Campaign” on the OPUS Projects 5.1 webpage provides the requirements for using OPUS Projects 5.1 and Real-Time Network (RTN) data to support the 2022 Transformation Tool; that is the 2023 GPS on BM campaign. There are five sections in the writeup: Introduction, Project Planning, Equipment and Configuration, Field Requirements and Office Requirements. The Introduction section states that the requirements are limited to the GPS on BM Campaign and will be replaced, or superseded, when NGS finishes its new GNSS surveying specifications.

    Introduction Section from Requirement Write Up (Image: NGS website)
    Introduction Section from Requirement Write Up (Image: NGS website)

    The project planning section of the announcement states that RTN vectors of 5-minute occupations can be used instead of the 4-hour occupations required for OPUS Share.

    Project Planning Section from Requirement Write Up (Image: NGS website)
    Project Planning Section from Requirement Write Up (Image: NGS website)

    However, the Field Requirement section states that the mark must be occupied three different times.

    “During the RTN survey, measure each mark in your project (including the RTN Validation Station) for a minimum of 5 minutes for three independent occupations. All three measurements must agree by 3 cm horizontal and 5 cm ellipsoid height. They also must be separated by at least 3 hours (even if occupied on different days). Plan to occupy a mark, go occupy a few more in the area, then circle back. Or rotate day-by-day,” the section states.

    Field requirements Section from Requirement Write Up (Image: NGS website)
    Field requirements Section from Requirement Write Up (Image: NGS website)

    As stated in the section on office requirements for using OPUS-Projects 5 in the 2023 GPS on BM Campaign writeup,“The OPUS-Projects User Guide provides instructions on how to run the software and submit a project to NGS. The User Guide states to follow the steps in the order listed below, and it explains steps 1 – 7 and 9 – 11 in detail. For step 8 and when including GVX data in OPUS-Projects 5, refer to those portions of the User Guide’s Quick Start which are highlighted in yellow. NGS is working on fully updating the User Guide to include more details; for now, use the Quick Start Guide for assistance with GVX.”

    OPUS Projects User Guide (Image: NGS website)
    OPUS Projects User Guide (Image: NGS website)
    Quick start guide. (Image: NGS website)
    Quick start guide. (Image: NGS website)

    I recently used OPUS Projects to analyze some GNSS results using Harris-Galveston Subsidence District CORS and PAMS GNSS data. I want to emphasize that it may seem like a lot of work the first time you use the routine, but NGS makes it fairly simple to complete each task. The manual is very complete and does a good job of describing every step. The manual can be downloaded here. In my experience, the most time-consuming task is creating the descriptions. There are several items that must be correctly entered because the answer to some entries affect the answers to other entries. That said, NGS supports a description entry software called WinDesc that facilitates entering the appropriate information. The OPUS Projects User Guide provides an appendix that describes using the WinDesc module to enter description metadata.

    For marks that are in the NGS database, known as the NGS Integrated Data Base (NGSIDB), WinDesc will import information from NGSIDB, thereby decreasing the number of entries users need to address. In other words, if the mark has a PID then it should be in the NGSIDB. If you are occupying a mark that is part of NGS GPS on Bench Marks website then it probably has a PID and a description in NGSIDB.

    Example of PID from Mark Priority List (Image: NGS website)
    Example of PID from Mark Priority List (Image: NGS website)

    I’ve included three slides from the Jan. 12 webinar that summarize the basic requirements.

    This slide is a depiction of how a CORS station must be connected to the RTN vectors. (Image: NGS website)
    This slide is a depiction of how a CORS station must be connected to the RTN vectors. (Image: NGS website)
    This slide provides the occupation and precision requirements. (Image: NGS website)
    This slide provides the occupation and precision requirements. (Image: NGS website)
    This slide provides a list of the required metadata for the project. (Image: NGS website)
    This slide provides a list of the required metadata for the project. (Image: NGS website)

    As for the requirement of at least three independent RTN occupations on different times, in my opinion at least one occupation should be on a different day. My October 2021 column addressed a study that reported on using RTN solutions to estimate accurate horizontal and vertical coordinates.

    The report stated, “When differenced with coordinates from a static GNSS survey campaign, the horizontal and vertical RMSE of the NRTK-derived coordinates was 2.3 cm horizontally and 4.5 cm vertically at 95% confidence. Repetitive NRTK vectors on each baseline differed between ± 2.4 cm horizontally and ± 3.4 cm vertically at 95% confidence.”

    The report also stated, “Adjustment of hybrid survey networks with four repeat NRTK vectors per bench mark produced network accuracies at 95% confidence for the adjusted coordinates at all bench marks less than 1 cm horizontally and 2 cm vertically (ellipsoid height).”

    The requirements are limited to the GPS on BM Campaign and will be replaced, or superseded, when NGS finishes its new GNSS surveying specifications.

    (Image: Screenshot of Accuracy of GNSS Observation from Tree Real-Time Networks in Maryland, USA)
    (Image: Screenshot of Accuracy of GNSS Observation from Tree Real-Time Networks in Maryland, USA)

    The paper by Gillins, et. al was presented at the 2019 FIG Working Week held in Hanoi, Vietnam, on April 22–26, 2019. The International Federation of Surveyors (FIG), involves a wide range of professional fields within the international surveying community; this includes surveying, cadastre, valuation, mapping, geodesy, hydrography, and geospatial and provides an international forum for discussion and development to promote professional practice and standards. FIG meetings are held all over the world. I’d like to highlight that the 2023 FIG Working Week is going to be held in Orlando, Florida, on May 28 – June 1, 2023.

    NGS will be presenting a full-day worth of content on NSRS Modernization during the FIG Working Week 2023. For the first time in more than 20 years, this annual FIG gathering will take place in the United States, hosted by the National Society of Professional Surveyors (NSPS).

    I’ve participated in several FIG meetings. I’ve learned a lot from presentations as well as holding hallway meetings with experts from the international surveying and mapping community. All geospatial users should plan on attending this event. I have provided information about the FIG commissions in my August 2021 newsletter. I would encourage everyone to visit the FIG website and review the information about the 2023 FIG Working Week. The a list of the FIG Commissions can be found here. More information can be obtained on each commission by clicking on its title.

    Future columns will highlight the FIG Working Week as the agenda is developed. I would encourage everyone to check NGS’s Website for updates on Beta products and new surveying specifications. Geospatial users should also subscribe to NGS’s News Services at the following here. Check out the NGS News Services site for what’s available.

  • Balloon sparks intrigue

    Balloon sparks intrigue

    Feb. 4 saw the news networks alive with sometimes wild reports about UFOs, UAVs and then a balloon. Balloons are used for weather forecasting on a regular basis, launched daily into the stratosphere with payloads gathering wind speed and direction, temperature, humidity, pressure and, of course, position.

    Synchronized twice a day at about 900 locations around the world, balloons are released into the stratosphere gathering essential atmospheric data to feed our weather forecasts. Reaching altitudes of 20 miles, these balloons often drift on winds as far as 125 miles from the release point, broadcasting measurements from their onboard sensors.

    At first, maybe North American Aerospace Defense Command (NORAD) thought the balloon crossing into Alaska’s airspace was just one of these high-altitude weather prediction vehicles. Aircraft were apparently scrambled, and initially it was decided there was no threat, so the balloon was allowed to continue and enter Alaskan airspace. It was detected and subsequently tracked by both the United States and Canada for some time as it continued to drift on the jet stream over the border into the lower 48. Then, people in and around Billings Montana (home to one of the nation’s three nuclear missile silo fields at Malmstrom Air Force Base) started to send in reports of a very large balloon high overhead — according to one observer with a high-resolution camera, it even seemed to be stationary for 35 minutes.

    Apparently, by the time the good folks in Montana were looking up, the Pentagon had decided the balloon was a Chinese surveillance vehicle. To get this detail, one or more U-2 high altitude reconnaissance aircraft had been dispatched to investigate. The collected U-2 information spotted markings of a Chinese manufacturer on the 200-foot-tall balloon. A payload the size of a small passenger jet dangled some 20 feet below the balloon canopy. It had several antennas of various configurations. A huge solar panel was attached — presumably to power its suite of surveillance sensors.

    The Federal Aviation Administration (FAA) ordered a ground stop for all aircraft traffic at the Billings airport while decisions were made about downing the balloon or allowing it to proceed.

    Meanwhile, it may seem obvious that both the United States and China have developed, launched and make use of surveillance satellites. I imagined that a couple of dozen of these space vehicles would be buzzing over not only each other’s landmass, but also surveilling dozens of other countries as they orbit the whole planet.

    What I found was a report that China had at least 260 such orbital observation platforms in 2022, and the United States has even more. Isn’t that enough without resorting to lower-tech balloons?

    It’s possible that some electronic transmissions are short range and would not be detected by surveillance satellites operating in geosynchronous orbit (22,000 miles out), or even at 300 miles where the International Space Station (ISS) and most surveillance satellites hang out. So, a slow-moving balloon at 20 miles up might be ideal to “sniff” ground transmissions from sensitive military installations, and if you could control the balloon to hover, all the better to pick up radio signals. Could the gathering of transmission data somehow be used to geo-locate the source? It’s something the U.S. military may be working on, too, as it is reportedly also building a fleet of autonomous dirigibles and balloons.

    According to press reports, the United States decided not to immediately take down the balloon, even though it subsequently discovered its surveillance capabilities. Not only was there concern over debris falling on populated areas but allowing the balloon to continue its flight over the United States provided an opportunity to observe its behavior and gather useful information. U.S. bases along its path apparently shut down all communications in sequence, as the balloon passed overhead.

    The balloon was apparently found to be transmitting – presumably reporting on where it was and what it had detected. But, at some time transmissions ceased, possibly when U.S. Air Force activity was detected nearby.

    The take-down off Myrtle Beach

    An F-22 flew to almost the same altitude as the balloon and fired an AIM-9X Sidewinder missile into it, leaving the payload to tumble from 60,000 feet into the shallow (50-foot deep) Atlantic Ocean off Myrtle Beach, South Carolina. Recovery boats were already on hand to pick up the collapsed canopy, and to begin locating the electronics payload on the seabed. At time of writing, the U.S. recovery effort has yet to inform us on finding the key electronic payload, which would go a long way to confirming the intended mission for the balloon.

    Image: Screenshot of CNN news coverage
    Image: Screenshot of CNN news coverage

    Strange, but a couple of days later over Canada, F-22s were again in action to take down a “cylindrical object” detected at 40,000 feet — an altitude posing a danger to airline traffic. Little has been released on what this object might have been — could it possibly be a re-entering piece of space debris? Again, debris recovery and analysis is underway, and we patiently wait for a public report about what this was all about.

    What have we learned?

    Both China and the United States operate huge fleets of surveillance satellites gathering intelligence daily about each other’s capabilities and those of other countries. Both China and United States have also invested in surveillance balloons, but China is the only country to send one over U.S. territory.

    There may have been earlier balloon incursions, which are only now being reported. The U.S. response was initially to determine the configuration of the balloon and its payload, then to allow its journey along the jet stream to continue. The United States has said the balloon did not uncover anything already available by other means, but recovery and analysis of the payload would presumably confirm this announcement.

    China is not happy about the U.S. takedown of a harmless, stray weather balloon. And what the heck were F-22s shooting at in Canada?

    We’ll tell you more when we learn more….

    Tony Murfin

    GNSS Aerospace

    Editor’s Note: Since the initial instance of an unidentified object floating across U.S. airspace — later identified as a Chinese surveillance balloon — three additional unidentified aerial objects were spotted in North American airspace. One was spotted in Alaska, one in northern Canada and one over the Great Lakes region. All three were shot down by U.S. fighter jets out of caution.

  • One GPS Mystery Solved, Another Remains

    One GPS Mystery Solved, Another Remains

    Ever since it came on-line in February 2022, the website GPSJam.org has shown what appears to be regular interference with GPS signals in Texas near San Antonio and Del Rio, and locations north and south of Oklahoma City, Oklahoma.

    Only on normal workdays, however. Not on weekends or holidays. Furthermore, whatever was happening also took time off between the Christmas and New Year holidays GPSJam.org also shows similar, though less regular, activity in New Mexico. Experts say this is easily explained as White Sands Missile Range is often the site of electronic warfare training and tests. These are always announced in advance in FAA Notices to Air Missions (NOTAMs) when any interference with GPS reception is anticipated.

    The regular patterns observed in Texas and Oklahoma and the lack of NOTAMs led some experts to speculate the source could be inadvertent interference from a commercial or government activity. Said one former official, “It’s just the kind of pattern you see from large organizations. They are off every weekend, federal holidays, and around Christmas.”

    Aerobatic-capable Military Training aircraft reporting low NIC values (Image: Stanford University)
    Aerobatic-capable Military Training aircraft reporting low NIC values (Image: Stanford University)

    GPSJam.org is the brainchild of aviation analyst John Wiseman. The site uses crowdsourced ADS-B reports gathered by the ADS-B Exchange and displays it on a world map. Areas in yellow indicate that between two and ten percent of ADS-B reports for the day had low navigation accuracy. Areas in red had ten percent or more.

    Information from the site has proved useful in identifying patterns of regular GPS jamming and spoofing in Russia and other conflict areas around the globe.
    The workday patterns in Texas and Oklahoma have appeared on GPSJam.org displays since the site went live in February 2022.

    GPS Interference and Aviation

    Minor interference with GPS signals is fairly common. GPS jamming devices, while illegal to use, are inexpensive and easy to obtain from vendors on the internet.

    Truck drivers wanting to defeat their company’s fleet tracking system, people concerned about being tracked by the government or others, even ministers trying to keep parishioners from texting during sermons – all have been known to use such devices.

    Most GPS interference is unintentional. A two-year European Union study found hundreds of thousands of potentially harmful signals, but judged only about ten percent to be intentional. The rest were the inadvertent byproduct of poorly tuned electrical and electronic equipment.

    ADS-B tracks of training aircraft performing aerobatics. Red indicates low NIC value reported. (Image: Stanford University)
    ADS-B tracks of training aircraft performing aerobatics. Red indicates low NIC value reported. (Image: Stanford University)

    While most GPS interference is unintentional and localized, spurious signals powerful enough to noticeably impact airborne operations are not unknown.

    In two separate incidents last year strong interference near the Denver and Dallas airports impacted air traffic, each for more than a day. The Denver incident lasted for 33 hours before authorities found the source and shut it down. Air traffic was disrupted at Dallas for 44 hours according to government sources, though researchers found the actual interference only lasted for 24 hours. The source of the disruption was never identified.

    In 2019 a passenger aircraft was almost lost due to GPS interference while on approach to Sun Valley, Idaho’s Friedman Memorial Airport. As the aircraft flew a GPS-based approach in smoke and haze, the interfering signal was just strong enough to lure it off course and toward a mountain. Fortunately, a sharp-eyed radar controller hundreds of miles away spotted the problem and intervened in time. The source of the interference was never identified.

    As a result of the Sun Valley incident and input from numerous aviation groups, the International Civil Aviation Organization told its members there was an “urgent need to address harmful interferences” to satnav signals.

    Texas and Oklahoma Mystery Solved

    A researcher at Stanford University finally solved the puzzle of the strange recurring sequence of reports from Texas and Oklahoma.

    While investigating last October’s GPS interference event near the Dallas airport, PhD candidate Zixi Liu noticed aircraft outside the main area of effect also reporting low Navigation Integrity Category (NIC) values. This began before and continued after complaints from commercial airlines about GPS not being available at Dallas-Fort Worth. These aircraft were in the same general area of Texas, but far enough away that there were large areas between them and Dallas that did not contain any reports with low NIC values.

    Low navigation accuracy reports displayed at GPSJam.org. in New Mexico reports were due to GPS interference from military testing. In Texas and Oklahoma, military aerobatics training likely caused reports of low navigation accuracy. (Image: GPSJam.org)
    Low navigation accuracy reports displayed at GPSJam.org. in New Mexico reports were due to GPS interference from military testing. In Texas and Oklahoma, military aerobatics training likely caused reports of low navigation accuracy. (Image: GPSJam.org)

    At the same time MS Liu was also investigating anomalous ADS-B reports near San Antonio and Del Rio, Texas. She discovered in all three cases the reports of low NIC values were coming from military training aircraft regularly used for aerobatics. Other aircraft nearby reported good NIC values and showed no evidence interference.

    In a recent presentation to the Institute of Navigation, she postulated that Interference with GPS signals was not the cause of the low navigation integrity reports. Rather, the rapid maneuvers and unusual aircraft attitudes of aerobatics caused the airplanes’ navigation receivers to intermittently lose lock on signals from GPS satellites. This caused their ADS-B equipment to report low navigation integrity.

    Having solved that mystery, Ms. Liu continues to work on her original question – identifying the source of October’s 24-hour GPS disruption near the Dallas-Fort Worth airport.

    Mr. Dana A. Goward is the President of the Resilient Navigation and Timing Foundation and a former US Coast Guard helicopter pilot.

  • Business decisions that result in bad technical outcomes could lead to lawsuits

    Business decisions that result in bad technical outcomes could lead to lawsuits

    My previous column provided an update on the current set of published orthometric heights in the southeast Texas region and rules by the National Geodetic Survey (NGS) for estimating and publishing GNSS-derived orthometric heights using OPUS Projects. It also highlighted my personal crusade, that is the United States geodesy crisis. The Geodesy Crisis white paper can be downloaded from the American Association for Geodetic Surveying website.

    This column focuses on potential errors in orthometric heights using a digital barcode leveling system with multi-piece leveling rods. Every business makes decisions based on expenses and ultimately on the profit margin. That said, making a business decision that results in a bad technical outcome may lead to issues that cost the company more than expected.

    I have been involved with establishing orthometric heights, both leveling-derived heights and GNSS-derived heights, for most of my career. On a personal note, the digital bar code leveling system is important to me because I was the lead author of the document by the Federal Geodetic Control Subcommittee (FGCS) to incorporate the digital barcode leveling systems Specifications and Procedures to Incorporate Electronic/Digital Barcode Leveling Systems (2004).” Recently, a colleague brought to my attention that many surveyors are using the digital barcode leveling system (which wasn’t a surprise to me), but they are not using the one-piece, single-scale, invar rod. They are using the multi-piece rods, either fiberglass or wooden. Surveyors can use any type of instrument to perform their project, but it will not meet the Federal Geodetic Control Subcommittee specification and procedures for leveling unless they use a one-piece leveling staff. This not a new requirement; it has been a requirement since the first publication of the FGCS specifications and procedures.  Surveyors have always requested to use multi-piece rods but the potential errors associated with them were considered too large to be incorporated into the specifications and procedures to meet first-, second-, or third-order U.S. federal accuracy standards.

    Photo:
    Excerpt from FGCS Specifications and Procedures (Image:FGDC)
    Photo:
    Excerpt from FGCS Specifications and Procedures (Image:FGDC)

    In 2018, NGS documented a study to evaluate the use of multi-piece rods using the digital barcode leveling system. I first saw a draft of this report in 2011 and forgot that it existed.  A colleague of mine recently provided me with the 2018 report. In my opinion, anyone who uses the digital barcode system and multi-piece rods should read this report and, of course, the rest of this column.

    Photo:
    NOAA Technical Memorandum NOS NGS 75. (Image: NGS)

    The image below provides the important summaries of the tests. I highlighted the statement “In the field, these errors were as high as 1.5 mm per setup and up to 7 mm for the entire 180-meter section.” In my opinion, an error of 7 mm in a 180-meter section is too large for any order and class of leveling. Also, the results of the study support the current FGCS specifications and procedures requirement of the use of one-piece, calibrated rods.

    Photo:
    Image: NGS

    The 2018 report states that multi-piece level staffs are popular among the surveying community because of their ability to break down into an easily transportable unit and they are relatively inexpensive and readily available. They may also be extended to reduce the number of leveling setups required over sloping terrain. This makes good business sense but surveyors should not make technical decisions based solely on business costs. That said, the FGCS “Specifications and Procedures to Incorporate Electronic/Digital Barcode Leveling Systems (2004)” prohibit the use of multi-piece rods for any order/class of leveling based on technical decisions, not on business expenses. To evaluate the multi-piece barcode rods, NGS developed and implemented laboratory and field tests designed to detect and quantify possible loss of precision in multi-piece leveling staffs. All their tests were conducted at the NGS Testing & Training Center located in Woodford, Virginia, in December 2011. The report was published in 2018.

    The report did note that only a small sampling of instrumentation, three multi-piece leveling staffs comprising two separate models from two separate manufacturers, were included in the NGS study. Therefore, the results found within the report evaluate the accuracy and precision of the specific staffs tested. As the report states: “The tests are qualitative in nature with respect to bifurcation and non-Invar construction. Similar results are expected for similarly designed level staffs; nevertheless, the results should not be considered precisely valid for all types or models of multi-piece leveling staffs.”

    Users should download the document and read it but I’ll highlight a few results. First, the report made the following statements about the plumbing of the rods:

    • “With the Leica GKNL4M level staff carefully plumbed, the section directly above the bottom section housing the level vial was visually slightly out of plumb. No correction was made for this effect in the lab or field tests. No measurements were made to the top third section of this level staff during this evaluation.”
    • “With the Trimble LD23 level staff carefully plumbed, the sections directly above and below the middle section housing the level vial was visually bowed and slightly out of plumb. No correction was made for this effect in the lab or field tests.”

    Obviously, having a correctly plumbed rod is extremely important.

    To estimate the potential scale error in a controlled environment, NGS performed a special test where they set up the level instrument 5 m from the leveling rods inside their building and made a measurement every decimeter on each rod. To perform this, the level instrument was moved upward one-decimeter after each measurement and the measurement was repeated.  Figure 9 from the 2018 report depicts the results of the process. The first thing to notice is that the two calibrated, invar rods indicate very small errors. The other thing to notice is that there is a change in scale error at the section breaks of the multi-piece staffs. I highlighted the section breaks in the image below. The plots in Figure 9 indicate that the upper section of the rod is different from the lower section. This may result in a large error when going up (or down) an incline; that is, when leveling up an incline the upper section of a rod would be read in the back-sight reading and the lower section of a rod would be read in the foresight reading. The opposite would occur going down the incline.

    Photo:
    Figure 9 from NGS 2018 report. (Image:NGS)

    NGS also performed a small field test. The height difference was only 10 m over about 180 m distance. Figure 15 from the report provides the results of their field test. Some of the rods showed an error of almost 7 mm in the 180-meter section. Obviously, this is a significant error over such a short leveling distance, especially since it appears to be systematic. The report made a note about the systematic error; it noted that the height differences between the forward and backward runs were similar, but they were different from the standard. In other words, the forward and backward runs may meet a FGCS section misclosure but the mean difference would still have the accumulated systematic error. This means that following double-run procedures will not account for the systematic error.  As a side note, according to FGCS specifications and guidelines, for establishing a height of a new bench mark, double-run procedures must be used. Single-run methods can be used to re-level existing work provided the new work meets the allowable section misclosure.

    Photo:
    Figure 15 from NGS 2018 Report. (Image:NGS)

    As stated in the 2018 report, errors as large as 6.8 mm over a 180-meter sloping section were due to using the multi-piece leveling rods. This is unacceptable for meeting FGDC specifications and procedures for leveling surveys.

    The NGS report was based on a small sample and over a very small project area. It provides a compelling argument for requiring one-piece leveling rods.  Now, for a real-world example that supports the results of NGS’s study. I received a report where the results of repeat leveling surveys using the multi-piece fiberglass rods over the same basic route indicated a large systematic height error. The figure below provides the difference in heights between the two surveys. As indicated in the figure, the data indicates a height dependent error of -0.43 mm/meter between the two surveys. In this example, the difference approaches 200 mm. Clearly this type of systematic error needs to be accounted for when multi-piece barcode rods are used in a survey.

    Photo:
    Example of Height Dependent Error in Fiberglass Rods. (Image: Dave Zilkowski)

    As previously stated in the conclusion of NGS’s 2018 report, “Calibration of these type survey instruments provides a means of quantifying these type error sources, thus providing a mechanism for ‘correcting’ for them during post processing of data sets.” If a company or agency created a calibration process similar to NGS’s test site, then surveyors could use the site to evaluate their multi-piece barcode rods. In my opinion, until users account for the index and scale error in multi-piece barcode leveling rods, they should not be used to perform leveling surveys to compute orthometric heights with any expected accuracy value.

    Clearly, it is more cost effective to use multi-piece rods instead of single-piece invar rods because of the increase in expenses for the single-piece invar rods. However, making a business decision that results in a bad technical outcome could lead to lawsuits, professional liability issues, and/or additional expenses for having to resurvey projects. Enough said.