Radio altimeters are critical in aircraft landing systems. (Getty image). (Photo: guvendemir/E+/Getty Images)
As most GNSS industry insiders already know, the Federal Communications Commission (FCC) has licensed adjacent GNSS L1 protection frequencies to Ligado Networks (formerly Lightsquared) for its nationwide 4G-LTE network.
Many objections emerged as expected this second time around from government agencies, industries and U.S. forces — yet the roll-out is still underway, pending actual interference occurring. This all in an attempt to find communications bandwidth for many emerging commercial radio applications.
Now, as 5G C-Band 3.7–3.98 GHz wireless phone networks begin their FCC approved roll-out, the Federal Aviation Administration (FAA) has apparently lodged an unanticipated objection on the grounds that cross-interference could compromise aircraft radar altimeter and wireless communications that operate at 4.2 to 4.4 GHz in the C-band.
While 5G wireless has already been operating in many parts of the world without reports of interference with aircraft systems, the FAA appears to be taking a more conservative approach to how aviation in the United States should co-exist with the new 5G phone wireless system. The FAA has proposed imposing an exclusion zone around airports for 5G wireless networks — which apparently have already been operating with reduced power in these areas — until cooperative operation has been proven.
Now along comes a new C-band wireless network (SkyLink) aimed at providing high-integrity unmanned aircraft systems (UAS) command and control (C2). The SkyLink company uAvionix has also developed a C-band Control & Non-Payload Communications (CNPC) radio for UAS applications.
Together with Thales, uAvionics recently tested its radio with its SkyLink radio network. The network has been qualified in accordance with the RTCA DO-377 standard for a network management system that monitors network and radio link health, and the radio has been developed to the draft FAA Technical Standard Order (TSO) C-213A to support critical UAS operations.
The network uses new DO-362A-compliant SkyLink C-band radios, integrates certifiable aviation-grade hardware and software, uses frequency agility, and provides critical fault monitoring and control capability. The objective is to obviate the loss of the C2 link with the vehicle, and thereby enable beyond-visual-line-of-sight (BVLOS) operations without an FAA waiver.
It’s unclear whether the emergence of the C-band network — approved by both the FAA and FCC — will play a role in the current phone network interoperability issue. However, uAvionix reports that several sites in the United States and offshore are either rolling out C-band SkyLink networks or evaluating doing so.
North Dakota already has an ISM-band SkyLink network at its UAS test site that will shortly transition to C-band.
The Choctaw Nation in Oklahoma under an FAA program seeks to enable BVLOS operations through a C-band C2 network.
New Mexico State University will use a Skylink C2 network around Las Cruces airport for small UAS (sUAS) operations and testing to overcome anticipated interference from nearby Air Force and Space Force operations.
The Tillamook UAS test range in Oregon has already installed the first ground site of a SkyLink network.
The University of Alaska at the Fairbanks UAS test site will use uAvionics radios for testing large, heavy UAS operations.
In Canada near the Jonesburg airport, a Skylink C2 network will support the safety case for BVLOS pipeline inspection operations for the oil industry.
While many of these new networks are not yet fully online, the use of frequency hopping, safety-monitored C-band, and certifiable transmissions for UAS command and control appears to be moving forward rapidly. Because the FAA is supporting this testing phase, it seems inevitable that large-scale C-band network rollout for UAS C2 will happen eventually.
5G phone networks, wireless UAS command and control, and aircraft safety systems essential for landing will need to find a way to co-exist and provide reliable, sustained service to their respective customer bases. Look for much more to develop in this ongoing tussle between industry groups and agencies who appear to have little in common, other than grudgingly sharing a crowded radio spectrum.
By J. David Grossman Vice President of Regulatory Affairs Consumer Technology Association
This January, the annual Consumer Electronics Show (CES) — owned and produced by the Consumer Technology Association (CTA) — returned to Las Vegas. As the premier global platform for innovation, each year CES showcases the latest and greatest consumer technologies, from smartphones and wearables to self-driving trucks and electric cars.
GPS continues to play a central role in the technology we use daily. At CES, GPS-enabled technologies are found in nearly every product category, including 5G, internet of things (IoT), smart cities, vehicle tech and fitness wearables.
They are also among the CES 2022 Innovation Awards honorees, such as a connected bracelet that can alert emergency contacts and a robot that can identify the difference between crops and weeds.
How did GPS come to play such a critical role in devices as diverse as drones and smartphones?
Over the past 40 years, GPS has transformed from its origins as a military technology to one that no consumer or business can live without. During the 1990s, CTA members such as Panasonic and Sony pioneered commercially available GPS receivers.
At CES 1998, Garmin introduced StreetPilot, described as “one of the first practical and affordable GPS-based road navigation devices” and paved the way for huge growth in the consumer GPS market.
By the 2000s, GPS was no longer just a stand-alone technology. Following new Federal Communications Commission requirements, GPS-enabled smartphones opened the door for all-in-one devices. These products could deliver turn-by-turn navigation or identify the location of a lost or stolen device. In more recent applications, GPS technology provides the foundation for ever-more-complex mobile applications.
Opening of the 2022 Consumer Electronic Show. (Photo: Consumer Technology Association)
Foundational Technology
The evolution of GPS reflects a broader industry trend: innovators integrate foundational technology into successive generations of products, spurring development of new products and services. We’ve seen the same pattern play out for Wi-Fi, Bluetooth and Near Field Communication (NFC), which enables the latest tap-to-pay technologies. Hundreds of companies simply would not exist without free, global access to GPS signals!
With GPS, ridesharing companies such as Lyft match drivers and passengers, lead drivers to a precise pick-up location, and chart out a safe and efficient driving route. GPS-integrated smartwatches allow runners and cyclists to easily track pace and distance, a huge boon for many of us in the pandemic era. Closer to home, GPS-enabled pet collars help families keep tabs on their furry friends.
Revolutionary
Beyond the technology we use daily, GPS technology is also revolutionizing such industries as agriculture. Thanks largely to GPS, centuries-old businesses are now technology companies. For instance, John Deere leveraged its 185-year history of building tractors and combines GPS with other location technologies to steer semi-autonomous tractors with centimeter accuracy. In addition to the time and efficiency benefits for farmers, technologies like these support sustainable agriculture by reducing the use of pesticides, water, seed and fertilizer.
John Deere held a Media Days press conference at Mandalay Bay during CES 2022. (Photo: Consumer Technology Association)
The success of GPS is important for our industry’s success, and I am proud of the role GPS plays in everyday life. Modernization of GPS, supported by the U.S. government and industry, will enhance the accuracy, reliability and resiliency of the technology, which in turn will ensure GPS remains central to the innovation economy.
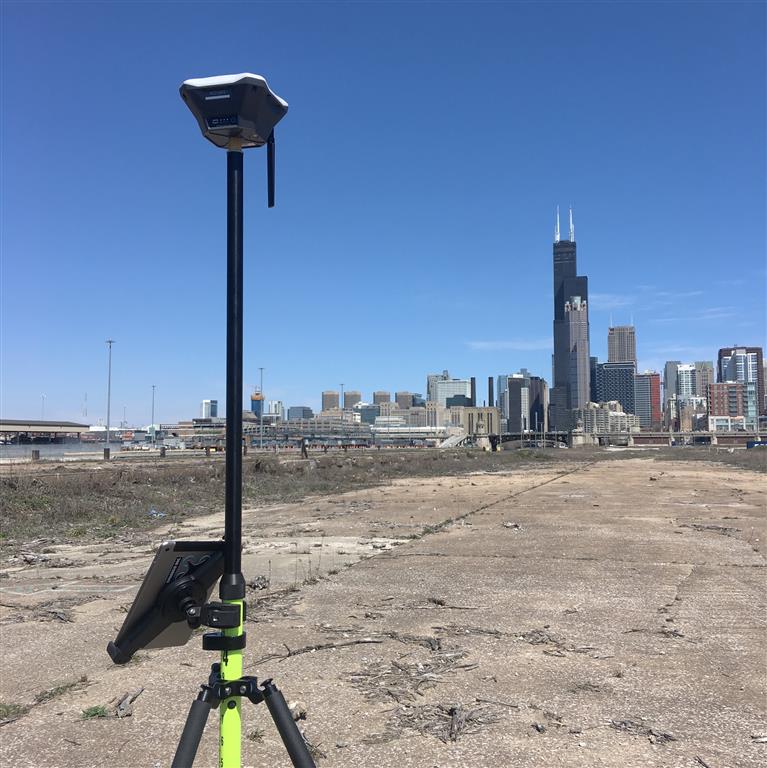
Approaches to providing real-time kinematic (RTK) solutions at high rates have existed in various forms for decades, providing value for high precision applications. This technique is nearly universally adopted in the industry, and many surveyors may have been using it for years without realizing it. Yet there are persistent misconceptions about the subject.
By Gavin Schrock, PLS
For many on the development side of high-precision real-time kinematic (RTK) GNSS, like those we interviewed for this article, the incorporation of high-rate solutions into their RTK products is a given — and has been for a very long time. Yet, in some end-user communities there may still be many question marks: Does my gear do it? Does other gear do it? What can it do for me? What are the pluses and minuses?
We asked for insights from 10 prominent firms that develop and manufacture RTK-enabled high-precision GNSS solutions and equipment, spanning multiple applications:
By high rate, we mean higher than 1 second (1 Hz) increments, such as 0.2 second (5 Hz), 0.1 second (10 Hz), etc. Part of the confusion about high-rate RTK is that there are two scenarios. One is transmitting corrections from a base or network at high rate, receiving and solving on-the-field sensors or rovers at a high rate (for example, 5 Hz base + 5 Hz rover).
The other is base transmission of corrections at a lower rate and receiving/solving on the rover at a higher rate (for example, 1 Hz on the base + 5 Hz or more on the sensor/rover).
While both can be valuable for different applications, what has been adopted as standard for most surveying, construction, agriculture and mapping applications is the latter.
What are applications that would run the base and rover at higher than 1 Hz? “Moving Base” applications are prime examples, where you are seeking to resolve positions for one or more sensors relative to a base that is also on a moving platform. Think of a barge on the ocean where a helicopter (or rocket) might be landing. Here is a definition from the user manual for a popular OEM receiver that has been in many makes and models since 2003:
“Moving Baseline RTK is an RTK positioning technique in which both reference and rover receivers can move. Moving Baseline RTK is useful for GPS applications that require vessel orientation. [For example, the] reference receiver broadcasts [correction] data at 10Hz, while the rover receiver performs a synchronized baseline solution at 10Hz. The resulting baseline solution has centimeter-level accuracy. To increase the accuracy of the absolute location of the two antennas, the Moving Reference receiver can use differential corrections from a static source, such as a shore-based RTK reference station.”
Beyond such specialized applications, running the base at a high rate is a burden on radios or bandwidth. Additionally, as industry experts explain below, it is of little (or no) value and may only unnecessarily use excess bandwidth and burden broadcast radios.
When would you run the base at 1 Hz and the rover at higher than 1Hz, such as 5Hz, 10Hz, or more? When the base is static. That pretty much covers nearly all surveying, mapping, precision agriculture and construction applications. What is meant by high rate in the sensor/rover receiver and its RTK engine, in the context of such applications? As one of the firms interviewed stated:
“The number of RTK position fixes generated per second defines the update rate.”
For most of the surveying, mapping, precision agriculture and construction applications, that means base 1 Hz + rover 5 Hz or 10 Hz. Then there are specialized applications, such as structural monitoring and geophysical studies, that may run sensors/rovers at 20 Hz, 50 Hz or (though rare) as high as 100 Hz. Whether a higher rate is a default, or 1 Hz is the default, changing the rate is almost always a user-configurable option.
A general perception is that base-rover gear defaults to base 1 Hz + rover 1 Hz. However, as the experts below note, that is not necessarily the case — often the rover rate is higher by default.
By any other name…
The respective approaches, and their appropriateness for different end-use applications, may seem fairly straight forward. However, part of the confusion about the subject for end users comes from the wide range of terminology used to describe how high rate is applied across the industry.
The understanding of processing approaches is clear among GNSS engineers, and in specific terminology, but this rarely gets translated well or consistently in terms meaningful to end users in documentation or marketing.
Developers might have different approaches to achieving high-rate solutions and would of course not wish to completely reveal their cards, but many of the fundamentals are the same. A mutual recognition of parallel development among GNSS engineers, and the manufacturers they develop for, in that each strives to continually improve solutions, means that the high-rate element of RTK generally does not get much marketing hype.
Often, when high-rate RTK does get laterally mentioned — in manuals, marketing or labeled as configuration options in GNSS field software — the mix of terms can confuse the user. Such terms as extrapolation, prediction, update rate and solution rate could evoke a negative connotation to an end user who is used to hearing one set of terms, and they might view otherwise like terms as contrasting terms.
GNSS engineers do not have issues with mixed terms. As some indicated in their respective interviews, they seem a bit puzzled as to why anyone would misunderstand the subject, and how marketing spin might lead users to be confused.
In recent years, the subject seemed to get discussed a lot more than usual in various high-precision end-user social media platforms. Perhaps this was a natural progression in growth of understanding of the nature of GNSS among these constituencies, and a desire to know more about what goes on in those black boxes — a positive thing. There may also have been some instances of marketing nudge.
For whatever reason it became a subject of discussion, we heard from readers who asked us to look into it. So here, in alphabetical order, are insights from of the experts in this field. You can jump ahead to the specific section for your equipment vendor, but we encourage you to read through each; combined, they provide a more complete picture of the subject.
Bad Elf
With Larry Fox, VP for Marketing and Business Development
Larry Fox uses the Bad Elf Flex. (Photo: Bad Elf)
Bad Elf has long provided GNSS solutions for aviation- and mapping-grade field applications. Several years ago, the company introduced a survey-grade-precision system, Flex. It is offered with an option for a modest initial investment in the hardware, and an innovative token system for enabling and operating at centimeter precision.
Larry Fox has been in the industry for a long time and has seen the evolution of real-time GNSS. He is Bad Elf’s vice president for marketing and business development, but he also had a key role in the development of the Flex system. Fox said that, of course, high-rate RTK is supported. “We allow options up to 20 Hz on the rover if the user has this enabled.”
For the approach of 1-Hz base and higher rates on the rover, he said that Bad Elf does not have a specific term for this. “For purposes of description, I could refer to it as high update rate, but I suspect high solution rate is pretty much synonymous.”
Fox explained how the standard approach works. “The rover knows the location of the fixed base and therefore applies the same processing techniques by simply reusing the last received data.”
He also mused about various hypothetical scenarios. “Given that the converse is also possible — a slow data rate from the base, say, 0.2 Hz at the base and 1 Hz at the rover — is there fundamentally any difference?”
For many applications, Fox does not see a substantial advantage in running at higher rates: “I see no benefit for higher data rates in a static situation such as a survey. I would argue that in a survey workflow, one should allow the RTK algorithm to settle over the static shot being taken, as the RTK algorithm likely benefits from aging out some of the data it used while moving.”
He adds, “I would suggest that once you have occupied a point for a modest amount of time and you remained fixed, I can’t see any benefit. My argument here is that by the time you have leveled and prepared your collector of choice, any decent RTK receiver with a good sky portrait and good corrections will not observe any benefit.”
As for disadvantages and trade-offs, “More and faster data,” Fox said, “must be better, correct? Sarcasm included. Unless there is a tangible need for more samples, what is one going to do with all the extra data? I could have seen a possible argument that a single constellation receiver may benefit from averaging, but that could be a be a whole different subject as multi-constellation is now standard. Arguably, at a higher data rate one could capture more epochs and reduce the time on station. With multi-constellation receivers I am just not convinced that these techniques have the same merit they may have had in the past.”
Bad Elf doesn’t support higher correction transmission rates from the radio. “The current module only supports RTCM3 at a 1Hz rate,” Fox said. “Even if we could transmit faster, the payload required would exceed the capability of the message transmission rate of the radio. The battery life of a radio is directly correlated to the transmission duty cycle. The more you are transmitting, the less battery life you will have. I would argue this would impact the useful field time you would have without an external battery solution.”
Fox notes that any application where a rover is moving — such as on a vehicle or for machine control — could benefit from high rate. “I could see a potential application for drones,” he added. “I would want to have the epoch of an image recording very tightly coupled to the image captured. Fundamentally, an RTK drone’s imagery is only as good as that. If one was taking video at any reasonable framerate, a higher frequency RTK GNSS may benefit the geolocation of more individual frames with less extrapolation.”
What about rates higher than 20 Hz? “We have run our receiver up to 20 Hz on the rover side. Although there are units capable of even higher rates, I don’t have any data that would convince me that this is viable, for mapping or surveying.”
I asked about some of the misunderstanding out there about high-rate RTK, and Fox replied, “We can be creatures of habit and tie ourselves to beliefs that ‘this is the way I did it and it worked then.’ People should always ask themselves the question, ‘do I still need to do it this way?’ Again, there is the premise that more is better. I can’t tell you how many times I have seen people collect very high-rate data for lines and poly features only to decimate the data because it reduced performance, increased storage, or lowered the performance of the apps rendering the data.”
Emlid
With Svetlana Nikolenko, Lead Application Engineer
Photo:Svetlana Nikolenko with an Emlid GNSS receiver. (Photo: Emlid)
Emlid, a relatively new entrant to the market for high-precision GNSS, has made a splash with their line of affordable systems, such as the Reach RS2 rover and base-rover kits, and RTK systems for UAVs.
“All our devices support this,” said Svetlana Nikolenko, lead application engineer. “We do not have a special term for this, as it is simply a standard. We recommend 5 Hz and higher for a moving rover, but it can be overkill for a stationary one.”
Asked why one would want to run at high rate, Nikolenko explained, “The need to set a higher update rate depends on the rover’s velocity and acceleration. The higher the update rate, the more solutions per second are calculated. So, if you’re moving fast, the higher update rate simply allows you to keep your position current. If the rover is stationary, there are no issues with working at 1 Hz. Still, there is nothing wrong with running a stationary rover at 5 Hz or higher: it is excessive, but produces more samples with different satellite geometries.”
For moving applications such as UAVs, higher rates are of value. “It really depends on velocity,” Nikolenko said. “For example, if the rover is on a drone flying at a speed of 5-20 m/s and the update rate is set to 1 Hz, you won’t have the actual positions of the images. The higher update rate our devices have is 10 Hz, and at a drone speed of 20 m/s, even if you take photos each second (which might be a bit excessive), you’ll get accurate positions.”
Using an Emlid receiver in harsh conditions. (Photo: Emlid)
Emlid does not support a moving base. However, if there is a strong demand from users, they will consider adding this. For non-moving applications, Nikolenko said, an approach of broadcasting from the base at a high rate is excessive. “This increases the load on the radio (or any other connection link) because the base sends its position and corrections to the rover as often as it calculates it. Anything excessive simply adds load to processors and batteries.”
CHC Navigation
With Carlos Cao, Technical Manager for the Asia-Pacific region
CHC Navigation, or CHCNAV, has steadily grown as a recognizable brand of GNSS and other geospatial products internationally. While the brand might be new to some in North America, in some regions of the world CHC has a substantial share of the market, selling hundreds of thousands of units over the past 15 years. The company develops its own solutions, but also incorporates OEM components. In all cases, CHCNAV has provided high rate as standard from its earliest days.
Multi-constellation rover with tilt compensation. (Photo: Schrock)
Carlos Cao, technical manager for the Asia-Pacific region, said that his company supports the approach of broadcasting at 1 Hz and solving at higher rates on the rover. “For example, you can get coordinates every 0.2 seconds in the Landstar 7 Topo Survey software,” said Cao. “Meanwhile, with different OEM boards, RTK models and supported software, [the equipment] can also reach 10-Hz or 20-Hz static data recording and NMEA data output (including GNGGA coordinate data).” Their term for solving RTK solutions at a high rate on the rover is “high update rate.”
This can bring advantages, specifically for moving applications, Cao said. “When you stake out, the 5-Hz update rate brings faster coordinate updates, especially when surveyors walk quickly. When you survey by time during movement, you can get denser points; while you survey by distance, the accuracy will be better if you are at high speed. For example, speed is 6 m/s, and you want to survey a point every 5 meters; 1 Hz update rate cannot do this with high accuracy.”
When would 1Hz be sufficient? “Normally,” Cao said, “a 1 Hz update rate is enough for a topography survey because users won’t survey at a high speed, so our default setting is 1 Hz, though you can choose higher rates if enabled and as needed. Unless you are moving, however, such as when some surveyors mount a rover on a vehicle, there is no significant difference in the final results.” He added that running at high rates can drain the battery faster.
Broadcasting at higher rates has several major issues. “With more satellites launched, especially BeiDou, correction data becomes much larger,” Cao said. “It means that network RTK requires more data flow, and UHF radio RTK needs a UHF modem that can send data at a high rate. It is a very big challenge for base RTK.”
Meanwhile, notes Cao, “The rover could even have a correction age of 5 or 10 seconds, and it will use the previous package to calculate the position. Since 1-Hz base and 5-Hz rover can work without degradation of precision, there’s no need to change the base to 5 Hz.”
Other applications CHC supports often use higher rates. “Navigation, machine control and precision agriculture normally use a 10-Hz, 20-Hz or 50-Hz update rate,” Cao said, “because these devices work under high-speed movement status, especially navigation. Also, they need to combine with high-update inertial measurement unit (IMU) data. The max update rate is 50 Hz. Normally the application data for these uses is NMEA data output by COM port or TCP/IP protocol. For surveying applications, such as topography, 1-Hz base and 5-Hz rover is enough. For other applications that need higher rates, we also provide such devices.”
Hemisphere GNSS
With Kirk Burnell, Senior Product Manager
Kirk Burnell
“At Hemisphere, we simply refer to this as RTK,” said Kirk Burnell, senior product manager for Hemisphere GNSS. Burnell added that they do not have any special term for this — it is simply a standard.
We were discussing specifically the approach of solving on the rover at higher rates than the base corrections. “All Hemisphere RTK products can work in this way, meaning corrections can come in at 1 Hz or slower, and rover output can be at 1 Hz, 5 Hz or 10 Hz as the user sees fit and as the application demands.”
Hemisphere develops GNSS and multi-sensor solutions for many industries: surveying, construction, agriculture and more. While Hemisphere has its own branded survey rovers, its OEM boards are in many other popular rover brands, makes and models. So, whichever you are running, you get high rate as a standard option.
Hemisphere’s receivers are frequently used in construction applications. (Photo: Hemisphere GNSS)
Burnell explained further that this is a given in the industry. “This is the standard expectation for RTK amongst our competitors, based on their product offerings, documentation, and standard operation. When describing RTK, the expectation is for 1-Hz base-station corrections, and a user-selectable rover output rate. Understandably, when people discuss RTK in technical terms, they may use different phrases to help distinguish between different techniques, which is why there might be different phrases out there. For us, it is simply RTK.”
As for the benefits of high rate, Burnell explained that inside the receiver, the measurement engine and RTK algorithms are typically running at 10 Hz or 20 Hz, and the selected output rate of the solution does not impact the RTK engine’s performance. The receiver will fix as fast and as accurately as possible given the quality of the RTK correction stream. Survey users could see a smoother update rate on their screen using 5 Hz compared to 1 Hz. This makes such tasks as leveling the rod or watching the change in height on screen while moving from the bottom to the top of a curb feel more natural. The user is not waiting an extra second each time to see the stability of the output. “A 5-Hz update rate is a good tradeoff for smooth workflows versus consuming CPU and battery power, compared to 10 Hz or 20 Hz,” he explained.
Would there be a disadvantage to simply running the rover at 1 Hz? “When using a 1-Hz update rate to the data collector, there will be fractions of a second spent waiting for the screen to update,” Burnell said. “Over the course of a day’s work, this could add up to a few minutes of extra time spent. In reality, this does not impact the ability to deliver a job on time. If the user does not feel impeded by the slower update rate of the screen, there is not a significant difference between the quality of the data, comparing 1 Hz and 5 Hz.”
Addressing one misconception that some users have about high rate, that it might significantly improve precisions, Burnell clarified, “For classic RTK surveying, outside of the workflow differences for the surveyor, the same quality of data is produced.”
Disadvantages? “Once you move beyond 5 Hz you start to exceed people’s hand-eye coordination ability, and the benefits diminish,” said Burnell. “Additionally, the data collector has a lot of communication to process, data to unpack, calculations to do, and screen refreshes to accomplish. Faster than 5 Hz leads to stresses in these aspects of the user experience, and ultimately can consume the data collector’s batteries at a faster rate.”
There have been instances of high rate being marketed as enabling users to save a lot of time, but as Burnell noted, this might actually be a potential problem. “There could be a false sense of having no latency, which could lead to rushing through a job, increasing the chances of making a mistake. A surveyor’s observations and measurements are the currency of their trade, and they should be made with care and attention to the work being done. Most surveyors take pride in a job well done.”
Regarding the other scenario, broadcasting at a high-rate and solving on the rover at the same high rate, “This mode of RTK operation has little or no benefit and a host of drawbacks,” Burnell said. “The biggest issue is the volume of data. For a multi-frequency multi-GNSS solution, there is an immense amount of data to be transmitted from the base to the rover. Running a link at 5 Hz requires huge data bandwidth generally only possible using an internet link as compared to a 450-MHz or 900-MHz radio link. Drawbacks for internet links are data volume costs. For dedicated radio links, the issue is most likely to impact radio range. To send five times as much data, the over-the-air baud rate needs to be five times greater. This means that the energy per bit of data is five times less when at high speed. The signal will lack the ability to punch through obstacles. While some may suggest that having five times as many corrections reach the rover compensates for this, some radio protocols can be configured to transmit multiple retries with 1-Hz data.”
However, there are advantages to running at higher rates for specific applications, Burnell said. “If data is being collected in a kinematic fashion as compared to shooting individual points, there will be more detail when collecting at 5 Hz. For example, driving along a road with a receiver mounted to the roof, in 1 minute of driving there will either be 60 measurements at 1 Hz or 300 measurements at 5 Hz. For many non-survey applications, this is critical. For example, at highway speed, 1-Hz data means 1 point every 30 meters (100 feet) or so. In machine control, the systems are not relying on hand-eye coordination and reaction time, and 20 Hz or 50 Hz are common speeds. Autonomous applications also typically use between 10 Hz and 50Hz for GNSS, and often combine this with 100-Hz or 200-Hz IMU data. Aerospace and defense applications have demanding conditions and use 100-Hz to 200-Hz IMU data to navigate, often combined with 1-Hz, 10-Hz or 20-Hz GNSS data.
There are even some applications for which it is warranted to broadcast corrections at rates slower than 1 Hz. “One example was a user in Japan, where radio links are often throttled to 4800 baud,” said Burnell. “They were looking to see how to slow down corrections to less than 1 Hz so that they could take advantage of multifrequency multi-GNSS RTK. Another example: I recently asked for some 10-Hz rover data for analysis. With very large files, analysis took much longer — I wished I had asked for 1-Hz data!”
Hexagon | NovAtel
Hexagon | NovAtel is a prominent tech firm providing positioning, navigation and timing (PNT) solutions for multiple industry segments, including defense, surveying, construction, agriculture, autonomy and more. While GNSS is a core technology, NovAtel develops multi-sensor systems (including inertial) and has a broad reach with its OEM products. Surveyors, for instance, might not be familiar with NovAtel first-hand, but have likely used its technology via NovAtel’s many OEM customers.
Iain Webster
Iain Webster, senior director of Geomatics and Software Engineering for NovAtel, said that not only does NovAtel support high-rate RTK, but the customer can choose the position output rate desired — 1 Hz, 5 hz, 10 Hz, 20 Hz, etc. — and the receiver will output RTK positions at that rate.
“We distinguish between a matched solution (where a correction is matched with a rover observation at the same time tag), and a low-latency solution, where base observations are extrapolated for position computation at the rover,” Webster said. He provided a description from a company manual:
“The RTK system in the receiver provides two kinds of position solutions. The Matched RTK position is computed with buffered observations, so there is no error due to the extrapolation of base station measurements. This provides the highest accuracy solution possible at the expense of some latency, which is affected primarily by the speed of the differential data link. The MATCHEDPOS log contains the matched RTK solution and can be generated for each processed set of base station observations.
The Low-Latency RTK position is computed from the latest local observations and extrapolated base station observations. This supplies a valid RTK position with the lowest latency possible at the expense of some accuracy. The degradation in accuracy is reflected in the standard deviation. The amount of time that the base station observations are extrapolated is in the “differential age” field of the position log. The Low-Latency RTK system extrapolates for 60 seconds. The RTKPOS log contains the Low-Latency RTK position when valid, and an “invalid” status when a Low-Latency RTK solution could not be computed. The BESTPOS log contains either the low-latency RTK, PPP or pseudo range-based position, whichever has the smallest standard deviation.”
NovAtel does not brand this as a specific feature — it is just a standard part of its RTK solutions, but the company refers to it in their documentation as a “low-latency” solution.
The main benefit of this solution, Webster explained, is for kinematic users to allow better representation of their actual trajectory (such as in applications on moving vehicles). “The higher the dynamics, the more impact the latency of the matched solution will have to the point that we recommend the low-latency solution to all but specialist customers with known static positioning needs. For surveyors, there may be improved workflow with the low-latency solution as they will be able to move from point to point more quickly.”
NovAtel produces GNSS and inertial hardware and software, including OEM boards, for multiple applications. (Photo: NovAtel)
Webster noted that for applications where the rover is static for observations, 1 Hz can be fine, but for moving rover applications — kinematic — running at 1 Hz is probably unacceptable, so low latency is quite standard.
Additionally, he pointed out, there are applications where longer periods between corrections may not necessarily be detrimental. “Note that some manufacturers, including NovAtel and Leica, offer the possibility of using PPP corrections to extend RTK solutions beyond, for example, a 60-second timeout,” Webster said. “There are various proprietary methods to achieve this, but ultimately the RTK solution could be extended without limit in this way.”
Are there tradeoffs to using extrapolation or other high-rate approaches? “With corrections coming in at 1 Hz,” Webster said, “there is very little error over that period, so for most users, there is little disadvantage and perhaps some productivity advantage with a higher rate. If there is any trade-off, it is between getting the highest accuracy possible versus the lowest latency solution.”
As for the other scenario — the base broadcasting at greater than 1 Hz and the rover solving at greater than 1 Hz — “There is little advantage,” Webster said, “except in some specialized applications such as when the base is moving (called moving baseline) to provide a cm-level baseline between the base and the rover for relative positioning. For typical surveying applications with a static base, the rover would have to wait until the corrections arrived before outputting a solution. Other downsides include increased bandwidth on the communication link and more loading on the rover CPU, meaning lower battery life.”
What are the non-surveying applications where a high rate (in either scenario) can yield a specific benefit? Webster noted that, in fact, they deal mostly with non-surveying applications. “Most use cases need 10 Hz or 20 Hz for machine control or precision ag. We do have some very specialist applications that have required up to or beyond 100 Hz — but it is often best in those cases to do a GNSS/inertial navigation system (INS) solution and use the IMU to output at that a high rate. As previously mentioned, there are other specialist applications where the base is moving. In this case, we run a matched solution at a high rate between the base and the rover.”
Leica GeoSystems
With Xiaoguang Luo, Senior Product Engineer, GNSS Product Management Group
Rover with calibration-free tilt compensation and camera-based offset point capabilities. (Photo: Schrock)
Leica Geosystems (part of Hexagon) has been a major global developer and manufacturer of GNSS systems for multiple disciplines for several decades, introducing its first GPS receiver, WM101, in 1985. Since then, Leica has been among the leaders in GNSS receiver innovation, including integrated systems such as a rover that incorporates calibration-free tilt compensation and an image-point capture feature (GS18 I). Therefore, it is no surprise that for Leica Geosystems equipment features high-rate RTK as standard.
Xiaoguang Luo is a senior product engineer in the GNSS Product Management group at Leica Geosystems. He confirms that this option is supported in all Leica Geosystems RTK rovers of the current product portfolio, and this option is enabled by default in the Leica Captivate (surveying field) software. A term Leica Geosystems uses is prediction for its high-rate RTK approach.
Xiaoguang Luo
The standard positioning rate is 5 Hz on the rover. “As far as GNSS processing is concerned, there is no fundamental need to go to higher positioning rates,” Luo said. “The need for high rates is mainly driven by applications. For example, we are using the 5-Hz position update rate at the rover by default for an improved staking workflow and user experience. The 10-Hz rate is also supported in Captivate, for example, when streaming NMEA messages.” He added that 10 Hz is supported for other applications, such as structural monitoring, and 20 Hz for machine control.
As for the advantages of a rate higher than 1 Hz, Luo said that working at high observation and solution rates enables the possibility of modeling fast-changing error effects with a period below 1 second, and allows for high-rate non-surveying applications such as bridge monitoring. Does a high rate have any significant effect on the final results? He said that it strongly depends on the use case where high-rate observations and positions are involved. In addition, the quality of prediction also affects the final results.
Bernhard Richter
By this he means that while the standard approach for applications where the base is stationary, such as surveying, can work so well with a base data rate at 1 Hz and rover at 5 Hz, the key conditions do not change much over a single second.
Luo’s colleague Bernhard Richter, vice president of geomatics, explained it. “To understand this, you need to separate the elements of corrections into those that are fast changing and range dependent (see the graphic below). If the errors change slowly, then they can be estimated and predicted very well. Or, if the range dependency is low, errors could come from a different source than the base station. If the range dependency is medium or high, then the corrections are more difficult to estimate on the rover side, but if such errors change very slowly, they can still be predicted very well with the precondition that corrections have been received at least once.”
The rate of change and dependencies for the elements of corrections. (Source: Leica GeoSystems)
You’ll notice that multipath is high in both regards. This brings up another misconception about high-rate RTK — some users have an expectation that it will improve their performance in limited sky-view situations (like thick tree canopy) or high multipath environments. This is not so. Any improvements in such environments come from having more satellites, more observations, and more modernized signals. With regard to high-rate and multipath, Richter said, “It is anyway futile, since multipath decorrelates so quickly that the advanced mitigation has to happen both in an analog and a digital way on the rover.”
While there are benefits to running at high rate, such as for staking, a balance has to be struck — for instance, in not running it at too high a rate. Luo outlined disadvantages that must be considered when performing high-rate RTK.
High processing load and battery drain, particularly with multi-constellation and multi-frequency RTK.
High temporal correlations between observations, which may not be considered in a sophisticated manner in the RTK algorithms.
High base rates provide challenges for the RTK data link devices, such as radios.
In addition, he noted that while any kind of predictive solution will introduce some amount of error, that would be so small in, for instance, a base data rate at 1 Hz and rover at 5 Hz solution, as to not even be noticeable in the positioning results.
Septentrio
With Bruno Bougard, Research and Development Director
Bruno Bougard
“Our rover solution computes RTK up to 100 Hz,” said Bruno Bougard, R&D director at Septentrio. “Update rate requirements for industrial machine control applications are typically 20 Hz. This is necessary to capture the motion dynamics. Also, it is not only the update rate that matters in those applications, but also the latency, which should be low (<20 ms typically) and constant.”
Septentrio NV is a designer and manufacturer of high-end multi-frequency GNSS receivers and integrated solutions. Markets they serve include surveying, mapping, construction, science, timing, agriculture, marine, autonomy, and more — all with specific applications where high-rate RTK may be employed They also provide OEM boards and modules for further integration by others.
Surveying users for instance may be familiar with their Altus line of rovers, such as the NR3, where high rate is a standard option. “There are new applications where a higher update rate is required,” said Bougard. “Surveying with UAV, using photogrammetry or lidar scanning requires at least 10Hz. In mobile mapping in general, RTK-INS solutions such as SPAN, Applanix or Septentrio SBi, require update rates up to 200Hz.”
Bougard acknowledged that manufacturers use many terms for their high-rate solutions. “Some may be used to masquerading a low-rate solution as a high-rate one. This is not what we do. The rover observables are captured at high rate and can be up to 100 Hz. The rover RTK filter is also run on high rate. Fixed base-station data does not have to be high rate. 1 Hz is typically enough. For moving base applications — for example, when the base station is on another vehicle, and we want to compute the baseline between the moving base and the rover — 10 Hz is required.”
Bougard said that the benefit is to track the motion of the rover. This is critical in machine control, but also relevant for new survey flows (such as UAV-based and mobile mapping). The disadvantage, he explained, is that it requires higher CPU loads. “Suppliers, who focus on cost, tend to compromise on this, notably running higher rate only for a subset of the constellation or signals. We use them all.”
Is running the base station at a higher rate advantageous? “It is possible to increase the output rate of our base station correction stream but, as explained, this is not needed if the base is static,” Bougard said. “This is applicable to moving base scenarios as explained above. Indeed, if you increase the base-station correction rate, the bottleneck becomes the datalink.”
Tersus GNSS
With Xiaohua Wen, Founder and CEO, Tersus GNSS
Xiaohua Wen with a Tersus GNSS receiver.
Xiaohua Wen, based in Melbourne Australia, is the founder and CEO of Tersus GNSS, another new entrant in the centimeter-grade GNSS market. One distinction about Tersus is that the company has developed and produces its own GNSS boards, instead of using OEM boards from other companies. Tersus implements its own tech, including GNSS receivers and IMUs in its own survey rovers, such as the Oscar, and for other high-precision applications. Additionally, it produces OEM boards for integration by others. Tersus entered the market with full multi-constellation support and, of course, high-rate RTK options, and has recently announced a PPP (precise point positioning) service.
“Our RTK boards support up to 20 Hz,” said Wen. “Often, surveyor will choose 5 Hz. We do a 5-Hz solution in this manner: the baseband takes raw measurements at a wanted moment, say at 1.2 s or 1.4 s, and RTK calculates solutions with the raw measurements. We understand that some older solutions might simply extrapolate or interpolate based on a position and velocity sequence, which is sometimes called predicted RTK or extrapolated RTK (though those terms get used in different ways by different developers). That is not how we approach our RTK solution updates. All Tersus RTK boards also support a maximum 20 Hz raw measurements outputs.”
Multi-constellation rover with calibration-free tilt compensation. (Photo: Schrock)
We asked about some of the advantages users may envision of high-rate RTK in general. Wen said there may be little or no gain with regard to faster initializations. Likewise, there is no significant gain with precision and accuracy. However, Wen said that higher rates can sometimes improve staking workflows. “For example, in the case of our Oscar rover with tilt compensation, the RTK outputs solutions at 10 Hz, while the IMU samples at 100 Hz. Oscar calculates the pole tip’s position at 10 Hz, aligned with the RTK solutions, and the data controller or tablet displays the point of the pole tip on the screen. We find that the point better refreshes at 2 Hz or higher to respond to the pole tip movements without noticeable lagging.”
That movement is an example of a key value of high rate,“Speed or movement,” Wen said. “For surveying applications, I would say that 1 Hz could suffice, considering the characteristic very low speed. Usually, applications like machine control and precision agriculture require an RTK update rate at 5 Hz or higher. Some UAV applications may use a 100-Hz position update. Most of these applications use an INS+RTK solution. With INS, it’s easy to get a 100-Hz position update, while for an RTK solution, a rate of 20 Hz is probably enough.”
Wen said that broadcasting corrections at a higher rate is pointless for most applications, “because the base data is highly correlated in the short term. If it’s a moving base, the high-rate base data would make some sense. Otherwise, it just imposes a greater load on communications and computation, with almost no gain.”
Topcon Positioning Systems
With Alok Srivastava, Director of Product Management
Alok Srivastava
“It is a standard option in our rovers,” said Alok Srivastava, senior director of Product Management (PM) at Topcon. “Around the time I joined the PM team, in 2010, the decision was made to make 10 Hz the standard, though this is user configurable and can be 5 Hz, 20 Hz, up to 100 Hz.” He explained that faster rates have been available through several generations of their receivers.
Typical applications consist of a static base and a moving rover. Fast-moving applications can benefit from higher rover position update rates since the RTK engine is computing real positions at a faster rate. Higher rates on the rover side provide accurate changes in position that can be missed by interpolating between positions computed at a slower rate.
A Topcon multi-constellation rover with tilt compensation. (Photo: Schrock)
High update rates on a base station do not provide advantages except in rare cases where the base is moving. While rovers are computing movements of the rover antenna, base stations are providing GNSS satellite corrections. A rate of more than 1 Hz for a static base station does not benefit rover accuracy; it only creates a burden on the communication between base and rover. Base and rover communication needs to be optimized to reduce bandwidth requirements. This is especially true as we continue to add constellations and signals to GNSS solutions.
Sufficiently high rates have been standard on Topcon rovers for a long time. Srivastava would rather see more focus put on other aspects of GNSS — such as interference, spoofing, the impacts of 5G, precise point positioning (which Topcon provides through its Topnet Live service) and sensor integration. “In many of our construction applications, we have IMUs,” Srivastava said. “When an application has an IMU for tilt compensation or for machine control, the IMU and GNSS complement each other. In kinematic mode, the IMU can help reject outliers.”
“High rate can be considered a common default mode of operation,” said Stuart Riley, vice president, Technology – GNSS, Trimble. “Typical rover position solution rates are 5 Hz, 10 Hz and 20 Hz.”
Trimble is one of the pioneering companies in GPS and GNSS, and Riley has been directly involved in the evolution of the company’s GNSS solutions for more than two decades. He has seen a lot of change, and in noting the nature of key technological advances, offered this intriguing observation about high rate: in many ways it has become less relevant.
“There have been considerable advances in RTK technology in recent years that make many of the earlier concepts related to how base and rover data should be combined for baseline processing largely irrelevant,” said Riley. “Most recently, survey receivers have included INS support for tilt compensation applications, and these receivers have available high-rate IMU data — at a much higher rate than GNSS observables — which drive the final GNSS/INS integrated solution. Thus, the rover GNSS data rate is not so important.”
Riley noted another relevant technology that Trimble has implemented: the use of precise satellite clock and orbit corrections — such as from the Trimble RTX precise point positioning (PPP) service — to augment RTK when there is a loss of the base correction stream. The implementation of PPP is broadening across the industry, and the company was an early implementer of a global service. It has the RTX-based xFIll feature that runs on and high-end survey receivers. One of the misconceptions about PPP services such as xFill is that it is just there to “take over” should the RTK or NRTK corrections be interrupted. Yes, it does that as well, but to be able to do that, it is running all the time, simultaneously with the RTK, so the rover is getting these enhanced PPP service clock, orbit and other data. This improves what the rover can do. “The emphasis in modern survey receivers,” Riley said, “is based more on the availability of rover data, and a fundamental base data rate of, say, 1 Hz, is all that is required.”
Along with various advances in the rover RTK engine, the GNSS constellations have expanded considerably, requiring increased bandwidth for the corrections from base to rover. “Our products can use various communication technologies to transmit corrections, such as Wi-Fi, cellular, and UHF (450 MHz or 900 MHz) radios,” Riley said. “Maintaining a 1-Hz correction rate enables all the GNSS observables to be broadcast from the base, providing a suitable highly compressed data format such as when Trimble’s proprietary CMRx format is selected.”
Many terms are used in the industry, and they typically refer to some proprietary aspect of an RTK engine. Riley said that a generic term would simply be high update rate. “Providing the position is based on the most current phase observables at the rover, a low latency solution is possible,” he said. “Thus low-latency solution goes hand-in-hand with a high update rate. Predicted RTK may refer to an old method where the static base corrections are propagated forwarded to account for radio latency and thus synchronize base/rover data. This is not used in modern PVT (position, velocity, time) RTK engines.”
High rate on the rover is standard, but what benefits should the user expect from it? “A fast update rate provides the best user interface experience in the field, in particular for stakeout,” Riley said. “Quite simply, nobody wants to be working with a laggy display. For survey field work, 5 Hz is typical. Other applications, such as machine control, benefit from higher update rates where a default of 10 Hz would be used, with options for higher rates.”
If the user chooses 1 Hz on the rover, what would be the downside? “Running at a 1-Hz rate is not really suitable for stake out,” Riley said. “For occupying static points, 1-Hz updates would suffice, as a typical occupation has a minimum time of 1 or 2 seconds. Very high rates for survey applications do not really buy anything in terms of field look and feel or performance.” I asked him about any points of diminishing returns, and he responded, “The higher the rate, the wider the measurement bandwidth (that is, the noise increases — you cannot get something for nothing), so in fact going for an unnecessarily high rate would start to be a disadvantage. For example, there would be no advantage to using a 50-Hz or 100-Hz rate for a land survey application. There is a relationship between measurement bandwidth and position noise.”
When is a high base rate a good idea? High rates are supported for some machine control and “moving base” applications where the reference frame has to move with the moving base, Riley said. In this case, the base and rover observables must be synchronized and the final solution has a fundamental latency depending on the base rate. For this reason, moving base rates are more typically 10 Hz or 20 Hz. For a static base, it is possible to use a higher rate. However, as Riley noted, “It’s more likely that a lower rate such as 0.5 Hz might be desirable to accommodate the radio when using repeaters (time multiplexing the data) or low data rates. There are disadvantages to high base rates, mostly related to radio bandwidth. Other factors, such as ‘high rate = more radio transmit power’, may need to be considered (affecting battery life).”
Are there other cases for even higher rover rates? “As mentioned, machine control applications use higher rates — necessary to reduce position latency in control loops,” Riley said. “Other applications such as UAVs and autonomous driving clearly benefit simply because of the speed of the platforms (higher dynamics). Precision agriculture is an excellent example of machine control, where auto guidance is used. Although high rates are possible, nearly all applications manage perfectly fine at rates up to 20 Hz. A more important consideration is system performance in terms of positioning accuracy and convergence times, which is dependent on the technology used in the PVT engine, such as Trimble ProPoint technology, rather than the correction stream data rate. ProPoint also includes xFill, as mentioned earlier, which provides centimeter-level backup for continuous operation when RTK or VRS correction streams are interrupted.”
Other Manufacturers
This was only a sampling of the developers and manufacturers, but it should be noted that several of the above firms produce OEM boards featured in dozens of other brands and models, such as Carlson and GeoMax. To try to list them all would be a challenge and might be missing a key point: high rate is quite standard, is not big news anymore, and you probably have it by default (or optional) no matter what system you are using.
Hypeful
As the insights the from industry experts above show: high rate can be essential for many applications, but unnecessary for others. It seems more about user experience (staking workflows or moving rover) than some way to seek higher precision.
Additionally, to borrow the gaming term hypeful, some users believe (or have been led to believe) that running at high rate will yield higher precision or work some kind of magic in dense tree cover or high multipath environments. Some may argue that it could get a result faster, but in practical terms even that might not be the case.
High rate has been around for a long time. And like any tech, has gone through different development and adoption phases. Think about automatic transmissions for motor vehicles; they have been around in one form or another for more than a century. There was a period in the mid-20th century where the development of different approaches was promoted in marketing campaigns with fanciful product names, like Durashift, Presto-Matic, Geartronic and Torque-Flite. But rarely do you see auto transmissions highlighted with such marketing flourish since then.
High-rate RTK was never singled out like that; it is common, and any differences are mostly in how it has been adapted for different applications. I suppose a firm could choose to emphasize it for marketing purposes and give it a buzz name like “Turbo Thrusted RTK”, which his fine for marketing purposes (albeit a bit “cheugy”). Every developer and manufacturer will have slightly different approaches, but if you believe, or are led to believe, that any represent high-rate fundamentals exclusively, that would be inadvertently misleading, if not subtle gaslighting.
As one of the experts said, “It does not really matter what manufacturers claim or don’t claim. You cannot beat physics. You can only understand and manage the physics.”
Coolness Ahead
While high-rate might seem a bit old hat, where GNSS development is going is not. The developers we interviewed are more interested in highlighting their complete high-precision solutions. For example, adding inertial measurement units (IMUs) for no-calibration tilt compensation, additional sensors for imaging (and likely soon, lidar), and multiple real-time GNSS solutions complimenting RTK, such as L-band precise point positioning (PPP).
The “high-rate” that is truly exciting is that of R&D, multi-sensor integration, automation of certain elements of workflows, artificial intelligence and multi-constellation/multi-signals.
Another year has come and gone. The global pandemic of COVID-19 is still upon us, and while we have experienced peaks and valleys of controlling the virus, it has radically changed our lives in many ways.
The surveying and geospatial professions have not been immune to the effects of the pandemic. It has forced many practitioners to modernize the means and methods to their workflows and products.
In this edition of Survey Scene, I consider the changes and accomplishments of 2021, and take a look ahead at events and technological advances to come.
2021: The Road We Traveled
Despite the pandemic, technology within the geospatial professions grew at a rapid pace, with new equipment and features. From the air to the seas, geospatial data-collection capability increased in varying ways across the differing environments.
Unmanned Aerial Systems (UAS)
The technological explosion of unmanned aerial vehicles (UAV) shows no signs of slowing down and manufacturers remain hard at work developing new designs for longer flights and increased capabilities. Lidar has emerged as the “hot” remote-sensing method for many users of UAS as an additional tool for photogrammetric capabilities, yet camera specs continue to grow well beyond the 20-megapixel expectation of recent years. These increased capabilities were not possible simply because of the amount of data generated by the methods, but previous issues and limitations with computing power and data storage have turned a significant corner in software performance and affordability.
In addition to the implementation of lidar, further developments in multirotor and fixed-wing UAV design continue to improve the performance and capabilities of the data-collection task. Many companies are growing their fleets to include both types of UAVs for varying conditions and applications.
Unmanned Ground Vehicles (UGV)
The sector with the most surprising developments has to be the unmanned ground vehicle (UGV) — but not for the reasons most would have predicted. We have been introduced to several products based upon remote-control vehicles utilizing GNSS positioning over the past few years, so it was expected for that trend to continue and grow.
To say the industry was taken aback when Leica partnered their BLK scanning technology with the Boston Dynamics new robot “Spot” would be an understatement. Trial projects and testing is ongoing, but the concept of autonomous data collection by a robotic “dog” is an intriguing concept, especially in environments where human presence is dangerous.
Unmanned Surface Vehicles (USV) and Unmanned Underwater Vehicles (UUV)
The last two autonomous vehicles used by geospatial professionals saw significant advancements as well, and are seeing increased use for many water-based remote-sensing projects. For many bathymetric surveyors, the small-footprint unmanned boat using GNSS positioning and conventional fathometer has been a game changer.
In addition to not investing large sums in a conventional boat, a USV is able to navigate many places and shallower depths than its larger counterparts. Like its airborne and ground cousins, battery life and advancing designs are creating more capability for data collection and remote sensing. The old saying “the sky is the limit” for emerging technologies does not apply to unmanned vehicles, as their use is being seen in almost every environment.
Weichao Liu, a member of CHC Navigation’s technical support staff, prepares to launch an Apache 6 USV. (Photo: CHC Navigation)
Professional Societies/Events/Education
As the calendar pages turned from 2020 to 2021, our world had begun a slow ride back to normalcy with the introduction of several variations of a vaccine for COVID. Some communities chose to return to face-to-face meetings, while others remained cautious and continued with remote communications. Here is a recap of how various organizations remained active within the professional community:
National Society of Professional Surveyors (NSPS) and its state affiliates: In-person resumption for some, while most continued with hybrid and/or remote communication methods.
International Federation of Surveyors (FIG). Annual working week was held remotely.
Council of European Geodetic Surveyors (CLGE). Various meetings held in-person and remotely.
Global Surveyors Week. Hosted by CLGE and held remotely.
NGS Seminars. A variety of seminars throughout the year held online.
Survey & GIS Summit. Joint conference hosted by NSPS and URISA held online.
Intergeo. Return to in-person with hybrid option.
Educational institutions worldwide struggled with returning to in-person classes, yet technology has allowed for remote communication and continued teaching. While many may still see remote learning as a hindrance, improved technology and communication methods have allowed us to continue to learn, work and simply converse with others. Without these tools, life as we know it would be impossible.
Legislation and Government
While much of the attention within legislative arenas was on social and economic issues, the geospatial community continues to monitor several items that potentially have a large impact on the profession.
The continuing saga of Ligado (formerly known as LightSquared) is still playing out, despite the outcry by many industry users of GPS technology. The Federal Communications Commission (FCC) authorized Ligado to begin construction of its new 5G communications technology and denied any stays to this order. Many groups, including coalitions of geospatial data users, continue to protest the authorization by the FCC.
In December 2021, the airline industry, along with Boeing and Airbus, expressed its concerns over the implementation of the new communication technology and the potential interruption of GPS and radio guidance for aircraft. Only time will tell if efforts to derail the installation and use of the new 5G communication band will be successful
Elimination of the professional license requirement for surveyors is quite dangerous and foolish.
Another large issue on the horizon for surveying and geospatial professionals is licensure deregulation. Currently, each state in the U.S. is responsible for licensing and oversight of professionals as established within their statutes. Several consumer groups have begun to petition a number of states to eliminate licensing as a barrier to entry into a given profession, including surveying. They also cite the cost of regulating the professions as an unnecessary expense to the residents of their states.
Unfortunately, these groups are shortsighted about the education and training required to become licensed within each profession to protect the public they serve. While the costs associated with purchasing the technology needed for the profession continues to decline, the expertise and training needed is on the rise. Elimination of the professional license requirement for surveyors is quite dangerous and foolish.
2022: The Road Ahead
As we look ahead, we are still facing many challenges left over from the past few years. Obviously, the COVID-19 pandemic will continue to twist and turn with new variants, enhanced vaccines and adjustments to many aspects of our lives. Because of technology and much different lifestyles from earlier pandemics, we are continuing to adapt to environmental changes: much of business goes about as close to “normal” as possible.
One could say that creativity and innovation has increased because of the pandemic and probably not get much of an argument. So where do we see technology and the geospatial profession heading during 2022?
Technology Evolution
More people are using technology and computing power than ever before and in ways probably not considered even 10 years ago. Until recently, data — especially personal information —has been considered off-limits for public consumption. Only governments were allowed to obtain scores of data to help keep track of literally everything.
Once geospatial technology came along, the game changed to include a location or positional component to a dataset. Now data can be saved to include a place and time for a particular piece of information if necessary.
Databases continue to grow with computing and software enhancements, storage increases and expanded network capability. So where are all of these cutting edge technologies taking the surveying and geospatial professions? Here are ways that continuing technological improvements are advancing our capabilities.
Open-Source Data
While in the past data was typically considered proprietary, many of the datasets used by geospatial professionals do not contain personal information. This information is simply physical location data for improvements and infrastructure that can be shared openly with no risk of compromising personal security.
Examples of open-source data cover many subjects, including shape files of physical objects, lidar and contour data of existing topography, and aerial imagery of the world we live in. It can also include data such as traffic counts, air-quality reporting and general population data.
Much of this data is secured using public funding, but it is not able to be readily shared because of database size limitations. Increases in technology have allowed this information to be shared more freely, and that has given professionals more information in which to better design infrastructure.
Artificial Intelligence (AI) and Machine Learning
Trainable technology is nothing new, but the computing power behind it has rapidly increased to make it a formidable challenge to our future workforce. Besides robotic machinery, sophisticated software is being developed to analyze various datasets and electronic mediums to “learn” about the information it contains.
For example, AI is being used to analyze photographic imagery and lidar datasets to determine characteristics of various elements within the work product. The software can now establish a painted parking line and draw a vectorized line in all places where it finds the same pixelated areas.
This same process is used to determine curbs, buildings and other improvements with an efficiency of which the human surveyor on the same site isn’t capable. While not foolproof, the technology has great potential and can shrink production time drastically. As programming continues to become more robust in determining the computer’s abilities, we should not bet against this market sector achieving anything but rapid growth. Couple these advancements with the shrinking workforce, and we will continue to see much more from this technology.
High-Performance Computing via Cloud Networks and Storage
Before the personal computer (circa 1980), most data processing was completed on a mainframe using terminals and primitive networks. No true computing brainpower was sitting on the user’s desk; the keyboard and monitor were simply conduits to the main processing computer typically housed in a large room somewhere in the building.
Fast forward to today’s environment, in which everything can be considered a computer. As many have noted, your current smartphone has more computing power than we used to reach the Moon. (The Apollo guidance computer had 4 KB of RAM and a 32-KB hard disk; it measured 24 x 12 x 6 inches and weighed 30 kg). Computing power at your fingertips has never been greater, but our improving technology is making today’s current data analysis seem like child’s play.
Enter the world of cloud computing and storage. If you live in a major metropolitan area, you have likely been witness to nondescript buildings being constructed with lots of transformers and electrical grid units surrounding them. These facilities are data centers and are being built at breakneck speed by Google, Microsoft, Facebook, Amazon and others to provide cloud computing and storage for the masses.
The cloud computers offer unmatched processor speed, nearly unlimited storage and reduced IT management costs. Large datasets being analyzed for specific algorithms can utilize cloud computing at a fraction of the cost of maintaining a personal computing system and network. It also allows the flexibility to work from literally anywhere in the world, yet have a consistent computing presence where you are. The big downside is that one is dependent on a reliable (and fast!) connection, as well as needing a comfort level with someone else having access to your data.
Other major areas of technology that will see improvement this year include 3D visualization (AR & VR), remote sensing, massively online open courses (MOOC) for higher learning, blockchain utilization, and an increase in the number of devices using internet of things (IOT) programming. The key to staying in front of these technologies is to remain curious and never stop learning!
A Personal Note for 2022 and Beyond
Like many jobs in this age of advancing technology and automation, surveying is quickly becoming an endangered profession. There are many facets in our everyday lives that are the responsibility of a surveyor, but the number of practitioners is dwindling. The pandemic may have turned our world upside down for many reasons but for surveyors and geospatial professionals, it increased our visibility and workload. Attrition will claim many within our ranks over the next several years, so we must find a way to prolong our profession through all avenues.
Tim Burch
With this in mind, I am proud to announce my appointment as the new executive director of the National Society of Professional Surveyors (NSPS). My years in the private sector have provided me with a broad view of where we face professional challenges, so transferring into an advocacy role will allow me to help solve those challenges.
It will be my honor to work with our organization to recognize the threats lying ahead, not just for surveyors but for many other geospatial professions and occupations. We also recognize that inclusion is a key component to creating diversity, as technology does not see a difference in nationalities, races and genders. The future of surveying is very bright, and NSPS is continuing to lead the way in creating a positive career path for our future surveying and geospatial professionals.
For navigation and control of any robotic or autonomous outdoor system, GNSS and inertial navigation systems (INS) are key components. Inevitably, the question arises: Should you build your own custom solution or integrate an available GNSS/INS combined solution? What would give you the best performance, while keeping the total cost of ownership (TCO) to a minimum? The TCO is also known as the “long-term price” and is defined as the purchase price plus the costs of operation over time.
Xenomatix is a company offering automotive solutions based on lidar technology. With eight years of innovative experience, Xenomatix has installed a pre-integrated GNSS/INS receiver on its latest lidar product, achieving high GNSS/INS performance with minimal TCO.
In an integrated INS/GNSS receiver, the GNSS receiver provides positioning with centimeter-level accuracy. The other component is a micro-electromechanical inertial measurement unit (MEMS IMU), which measures 3D orientation in terms of heading, pitch and roll angles with sub-degree precision. For its latest product XenoTrack, Xenomatix chose an INS called XenoAsterx based on the AsteRx SBi3 from Septentrio, which it integrated alongside its lidar to collect road-quality data to the smallest detail.
From an in-house solution to a pre-integrated system
Three years ago, when Xenomatix started developing its new lidar road-inspection system, the company had a GPS receiver, an IMU and an odometer as accompanying sensors. The company wanted to expand into new markets of road inspection in accordance with international standards, and so it needed to improve its components to take the overall performance of its system to the next level with RTK high-accuracy positioning.
To achieve this, while saving time and costs, Xenomatix acquired an AsteRx SBi3 INS/GNSS receiver, which allowed it to focus on its core lidar technology and sensor-fusion algorithms.
This off-the-shelf INS/GNSS solution provided all the high-accuracy positioning and orientation information Xenomatix needed, while eliminating most costs of development, maintenance and support. The new receiver allowed them to drive for miles, without any offset in positioning, something impossible with the previous GPS receiver.
The unique technology from Xenomatix stitches images by using lidar point-cloud overlays. However, when the car is moving fast, this overlay is smaller. The pre-calibrated GNSS/INS extends system performance by allowing stitching even when driving at higher speeds.
“If we start driving and we stitch the road for tens of kilometers and we come back to the same starting point, then we see an offset of only a few millimeters,” said Filip Geuens, CEO, Xenomatix. “This is for us the strongest proof of accuracy and reliability of the GNSS sensor.“
Why pre-integrated GNSS/INS offers better value
The pre-integrated GNSS/INS allows XenoTrack to collect road data even at higher speeds. (Credit: Septentrio)
A pre-integrated GNSS/INS solution — versatile enough to fit into virtually any autonomous or mapping system — offers the best value in the long run for the following reasons.
Better performance. The manufacturer of a GNSS/INS solution specializes in fusing the GNSS receiver and the INS in an optimal way. To accomplish this, the sensors are synchronized and their output run through a sophisticated Kalman filter algorithm. The fused device is then fine-tuned for optimal operation under various conditions. Finally, it is extensively tested and validated.
While being used by numerous customers and in varying applications, the GNSS/INS solution proves itself on various levels such as accuracy and robustness. This results in superior performance, even in the most demanding environments.
After installing the AsteRx SBi3 GNSS/INS system, XenoTrack was able to extend its functionality to inspect longer distances of roads at higher speeds. The AsteRx SBi3 operates reliably, even in challenging environments, such as when driving near high cliffs or under bridges.
Less development time and lower costs. When building a system, the development time is usually about one year employing two full-time GNSS/INS specialists. Hardware components need to be integrated and synchronized, while various interfaces and the Kalman filter need to be implemented. Additional features may be developed, such as velocity input as well as tools for validation, before the intricate step of performance fine-tuning. Finally, additional testing efforts are needed for verification and validation of the device.
On the other hand, a pre-integrated GNSS/INS system with easily accessible interfaces and flexible configuration ensures quick installation, meaning the product is ready within weeks.
Lower maintenance costs and support. Certain high quality pre-integrated GNSS/INS receivers are future-proof — ready to use new GNSS satellite signals and services as soon as they become available. An example of such upcoming service is the Galileo OSNMA anti-spoofing authentication.
Some receiver manufacturers such as Septentrio also offer continuous product improvement in the form of free firmware updates. A system developed in-house, on the other hand, needs continuous investment to maintain its competitive edge.
When issues occur, Septentrio also offers local worldwide support, with experienced application engineers ready to solve GNSS, INS or coupling issues that could halt the production process. For example, when Xenomatix discovered that its GNSS/INS was not working optimally in a certain environment, the company called Septentrio. Within days application engineering experts who analyzed the logged data found the source of the issue and proposed a solution.
Focus on core technology. When the budget is limited, choices need to be made about where to focus the efforts. When a company saves on GNSS/INS development, more can be invested in core technology. This means avoiding any lost-opportunity costs and optimizing margins.
Building your own is not always the best option
Acquiring a pre-integrated GNSS/INS receiver allowed Xenomatix to have a superior and affordable product with a competitive edge. AsteRx SBi3 increased the performance of the XenoTrack mapping system, while a short integration period allowed a faster time-to-market.
Xenomatix also benefited from low maintenance costs, keeping overall TCO to a minimum. Since the company was not spending time developing a custom GNSS/INS system, it could focus fully on its core technology. This allowed Xenomatix to take its business to the next level at a high pace.
Award-winning technology
In November 2021, the XenoTrack road scanner, with AsteRx SBi3 inside, was announced a winner of the IRF Global Road Achievement Award for its innovative road scanning and surveying solutions.
Developments in the autonomous space this month include an cargo aircraft with unmanned passengers, another way drones can deliver really heavy cargo, and a fanciful recreation of a beloved vintage car.
How do you catch a gremlin? Wait, what’s a gremlin?
Gremlins are supposed to be unmanned aircraft which are launched and recovered in flight from a cargo or bomb-carrying aircraft. Flying in small collaborating swarms, gremlins are equipped with sensors for communications, jamming, reconnaissance or other needs.
As envisioned by the U.S. Army’s Defense Advanced Research Projects Agency (DARPA), gremlins are reusable, may be autonomous, can operate in GNSS-denied environments, and can be flown on high-risk missions into high-risk areas — places that high-value manned aircraft would avoid.
DARPA has contracted Dynetics to come up with a system that meets those criteria — a pretty demanding list of capabilities. So far, prototype X-61A UAVs have been built and flown through four flight test campaigns.
Many military technologists have dreamed of unmanned flying aircraft carriers, which could be put to a variety of uses. If the gremlin system works, the commercial world might well find its own applications.
Carried under the wings of a C-130A cargo transport, gremlins have been launched and flown through three flight tests. Capture and recovery has been attempted but was unsuccessful because of unanticipated turbulence. One test vehicle was lost when its parachute recovery system failed — altogether, three vehicles have been lost.
Finally, on Oct. 25 over the Dugway Proving Ground in Utah, one Gremlin X-61A was flown onto the C-130A capture system and successfully recovered.
The gremlin X-61A test vehicle is recovered into C-130 transport on its fourth test flight. (Photo: DARPA)
The DARPA program requires a number of Gremlin UAVs to be captured, recovered and stowed in the mother aircraft within 30 minutes. The current recovery system is somewhat complex, so it remains to be seen if subsequent tests can achieve this substantial goal. Recovery might become easier and more reliable with an increase in the degree of autonomous operation for both the UAV and the recovery system.
A Guided Box for Disaster Relief
We turn now from a complex system to a direct and simple one that fulfills a key logistical requirement for disaster relief. It’s a fully autonomous UAV that lacks any integrated power source. Essentially, it’s a guided box.
The AVIUS Air Delivery Mercy-2000 by Yates Electrospace Corp. is basically an air-dropped cargo container that can glide from an altitude of 25,000 feet to a fixed location. From up to 35 miles away, this precision-guided drone can land safely within 110 yards of the desired site and deliver more than 1,600 pounds of material for critical medical and humanitarian needs.
Initially developed for military air-drop purposes (the U.S. Air Force just ordered 15), the cargo container is an 8-foot-long box with two sets of folded wings, fitted with a small nose-cone and a larger tail-cone before launch that help stabilize flight. The wings are carried inside the box and are installed by simply turning over the top cover.
Photo: Yates Electrospace Corp.
The assembly includes the essential guidance system. A COTS (commercial-off-the shelf) GPS receiver, lidar, magnetic heading sensor, barometric altimeter, inertial measurement unit and pitot speed sensor are integrated into proprietary software running on a COTS computer.
Anyone who has ever tried to land a glider from 25,000 feet knows that actually landing safely in the right place is tough to do. It’s quite an achievement to create a reliable, precision, autonomous solution that works when pushed out the back of an aircraft.
New Model of Old Renault Takes Flight
Now to a more fanciful story about an old friend – the Renault 4L. Many of us remember driving or riding in one, with its gear-change on the dash, uncomfortable seats, suspension and “sewing machine” engine.
The Renault 4L was manufactured from 1974 to 1978. (Photo: ribeiroantonio/iStock Editorial/Getty Images Plus/Getty Images)
In celebration of its 60th anniversary, Renault (now part of the Renault–Nissan–Mitsubishi Alliance) and TheArsenale have teamed up in France to make a flying 4L known as the AIR4.
The body shell has been re-engineered in carbon fiber with the same shape of the original 4L. The frame has been built for vertical and horizontal flight, with propellers at each corner of the vehicle. The body shell lifts at the front for pilot access. The Air4 carries lithium polymer batteries, providing up to 90,000 mAh. It can achieve 58 mph when tilted forward at 45°.
The Air4 will go on public display until the end of the year in the center of Paris at the Renault Center on the Champs Elysées, along with other antique models of the Renault 4. Miami will be the next stop for the AIR4, followed by New York and then Macau, China.
To sum up, we have gremlins making progress and being recaptured, a 1-ton flying box for important deliveries, and a celebration of 60 years of the Renault 4L — quite a wide range of ingenious unmanned vehicle applications.
Years ago, a trucker driving down the western slope of the Rocky Mountains lost his brakes. As his truck accelerated, he hoped to make it to the next runaway truck ramp before losing control. However, when he reached it, he saw a car parked at its base with a group of teenagers drinking beers. In a split-second decision, he veered to the left instead and went off the cliff. In the coming years, faced with the same moral dilemma, what would a self-driving truck do?
Matteo Luccio
Many similar scenarios have been discussed in the technical literature on self-driving vehicles. Most of them are variations on the “trolley problem” presented to generations of college philosophy students since it was first formulated by philosopher Philippa Foot in 1967 and adapted by Judith Jarvis Thomson in 1985. In the trolley problem, a person can choose to divert a trolley from the main track, saving five people who are working on it but killing a person on the other track who otherwise would not have been involved.
When faced with an inevitable crash, should a self-driving car slam into a wall to save the lives of three children crossing the street or, in effect, target them to save its two occupants? Most people, when polled, choose the former. When shopping for a new car, however, those same people are more likely to buy one that will make their own safety its highest priority.
Human drivers react to emergencies instinctively — motivated by neither forethought nor malice — and in real time. By contrast, the choices made by autonomous vehicles are predetermined by programmers; their control systems can potentially estimate the outcome of various options within milliseconds and take actions that factor in an extensive body of research, debate and legislation. Therefore, our judgment is harsh if those vehicles make what we deem to be the “wrong” choice.
However, there is no universal agreement as to what constitutes the “right” choice, other than the fact that people generally prefer self-driving cars to minimize the number of lost lives and to privilege people over animals and younger people over older ones. General principles such as “to minimize harm” are of little help in complex and dynamic real-life situations.
Self-driving cars, in addition to their many other benefits, will dramatically reduce traffic accidents and fatalities, because they will never be distracted, drowsy, drunk or drugged. Yet accidents will still happen, and their outcomes will be largely determined far in advance.
The mass introduction of self-driving cars onto public roads will require overcoming technical, legal and ethical challenges. As a society, we will have to agree on a uniform set of ethical codes that will guide these vehicles’ decision-making processes in emergencies. This will force us to explicitly quantify the value of human life and property, and encode it in software. These are hard and uncomfortable choices.
Autonomous systems, fusing data from multiple sensors, will guide these vehicles. It is up to us to decide whom they will target and whom they will spare.
On Nov. 9, the National Geodetic Survey (NGS) announced the release of a new Beta NGS Map. This web application allows users to view multiple datasets that are useful to anyone planning or performing a survey project, or anyone that’s just looking for NGS marks.
The map enables users to access NGS datasheets, OPUS Shared Solutions, and the NOAA CORS Network. It also provides a measuring tool, multiple basemaps, and the ability to export data.
I recently used this tool on my iPhone to locate marks when I was traveling. It’s an amazing tool that is easy to navigate, and a useful tool for identifying marks to be included in a project.
The NGS homepage provides a link to the Beta NGS Map (see below).
Image: NGS Website
When you first click on the NGS Map link a short narrative appears that provides a brief set of instructions on how to use the map (see below). There’s a box that you can check so that the narrative will not appear every time you access the site. It’s important to note that the data for the CORS and OPUS Shared results are updated monthly. This could be an issue in some instances, therefore users should always check the NGS website for the latest information for the NOAA CORS Network or OPUS Shared map.
Beta NGS Map. (Image: NGS website)
After you click OK at the bottom right of the page, a sample map will appear.
Sample map of Denver region. (Image: NGS website)
The map allows the user to type in a location (geographic location, CORS Site ID, OPUS PID, Datasheet PID or Datasheet Name) to start a search. See the “Waxhaw, North Carolina, Region” map as an example of entering a geographic location.
Waxhaw, North Carolina, Region. (Image: NGS Website)
The bottom navigation bar has eight buttons.
List of buttons at the bottom of the map. (Image: Dave Zilkoski)
When clicked, a window pops up providing information about that particular button. (For example, see “Map with Legend Information” below.) The legend will include all layers that have been selected. In my example, the datasheet layer was the only layer I had selected (see “Map with Layer Information”.)
Map with legend information. (Image: NGS Website highlighted by Dave Zilkoski)Map with layer information. (Image: NGS website highlighted by Dave Zilkoski)
When the user clicks on a symbol, a box will appear with information about the mark. See “Information for Station UNN 12” below.
Information for Station UNN 12. (Image: NGS Website)
The box contains information from the NGS datasheet as well as a link to the actual NGS database. A nice feature of this webtool is that it provides a link to NGS’s Beta Passive Mark webtool. My October 2020 Survey Scene column highlighted the features of the NGS’s Passive Mark tool. The box captioned “Passive Mark Page for Station UNN 12” is an example of the tool. I’ve highlighted several items important to individuals planning surveys, such as the mark’s coordinates, datums and source, and the Orthometric Height residual (the difference between the estimated geoid height and the modeled hybrid geoid height).
Passive Mark Page for Station UNN 12. (Image: NGS website)
Another great feature is that the user can click on the Mark Recovery link to provide the latest recovery information for a mark (see the box titled “Mark Recovery Link for Station UNN 12 “).
Mark Recovery Link for Station UNN 12. (Image: NGS website)
When a user clicks on the More info link for the Recovery Mark option, a Mark Recovery Form is provided for the user to enter the recovery information for the mark. The routine fills in the fields based on the current data in NGS’s database (see the box titled “Mark Recovery Form for Station UNN 12”). The user can enter changes or new information about the mark. This information is very important to users planning surveys. Just because a mark has been occupied by GNSS in the past doesn’t mean that it’s still a good station for occupation by GNSS. The environmental conditions around the mark could have changed since the last time it was occupied; for example, new buildings and/or growth of trees may now obstruct the GNSS signals.
As previously stated, the NOAA CORS Network is one of the layers available. The box titled “Map of NOAA CORS Network in the North Carolina Region” depicts the locations of the NOAA CORS in North Carolina. The layer list provides some of the attributes of the CORS, such as the sampling rate and which GNSS signal are collected at the site.
Map of NOAA CORS Network in the North Carolina Region. (Image: NGS website)
When a user clicks on a specific CORS, a box appears with information for that particular CORS. I’ve highlighted several items in the box titled “Information on CORS Site ID NC77.” In my example, CORS NC77 collects GPS, Galileo,and GLONASS data. Also, users can obtain long-term and short-term plots of the CORS.
Once again, this feature is important to users planning and performing GNSS survey projects. As in the other features, clicking on the More Info link will bring up the plots. The plots for CORS NC77 are provided in the boxes titled “Long-Term Plot Information on CORS Site ID NC77” and “Short-Term Plot Information on CORS Site ID NC77” below.
Information on CORS Site ID NC77. (Image: NGS website)Long-Term Plot Information on CORS Site ID NC77. (Image: NGS website)
In the short-term plot, the red line is the published position, and the green hashed area is the tolerance of the NGS position, that is +/- 2 cm horizontal and +/–4 cm vertical. All the error bars are 1 sigma values. This information is useful when selecting NOAA CORS to be included in a survey project.
The short-term plot contains the mean, standard deviation and RMS values for the north, east and up components of the site. When planning a GNSS project, users typically identify several NOAA CORS to be included in the project. However, not all CORS are equal.
I evaluate CORS using the following criteria:
Designated as “operational”
Computed (i.e., measured) velocities rather than modeled (i.e., predicted) velocities.
“Consistent” data depicted in short-term time-series plots.
Network accuracies ~1 to 1.5 cm horizontally and less than ~2 to 3 cm in ellipsoid height.
Clicking on the More Info button for Site Info of NC77 provides a webpage where most of this information can be obtained.
Before conducting any post-processing, the analyst should ensure that all CORS included in the project have data for all of the occupations and that the station’s short-term plots indicate stability.
Short-Term Plot Information on CORS Site ID NC77. (Image: NGS website)
Tool buttons are situated in the top right section of the map. Included are a measurement tool to measure distances between marks and areas, a bookmarks tool to zoom to areas, and a basemaps tool to change the basemap. See the box titled “Useful Tools.”
Useful tools. (Image: NGS website)
Some users may find the measurement tool helpful when planning a survey. The box titled “Using the Measurement Tool” is an example of measuring the distance between two stations.
Using the measurement tool. (Image: NGS website)
The last item that I’d like to highlight is that on Nov. 18, NGS has officially extended the GPS on Bench Marks campaign’s cut-off date for one year until December 31, 2022. See the box titled “NGS GPS on Bench Marks Notice.”
NGS GPS on Bench Marks Notice. (Image: NGS website)
NGS is anticipating that this extra time will allow users to provide additional GPS on Bench Marks data using the recently released beta version of OPUS Projects 5.0.
As stated in the NGS news release, this extension reflects NGS’ commitment to include as much data as possible in determining the Reference Epoch Coordinates (REC) that will be used to create the Transformation Tools to be released with the Modernized NSRS.
I encourage everyone to try the new Beta NGS Map. As in all of NGS beta products, NGS would like users to try the tools and provide feedback on what they liked and what they didn’t like. They are trying to develop tools useful to everyone, but that won’t be possible unless they hear from users.
“The tasks of paleontologists and classical historians and archaeologists are remarkably similar — to excavate, decipher and bring to life the tantalizing remnants of a time we will never see.” — Adrienne Mayor
Heatwaves rose up from the dusty, dry, cracked ground. Tiny black flies buzzed around the team’s eyes and faces. The only shade was under a canopy erected across the shallow open trench where half a dozen people gently brushed away the layers. Dirt is time; the deeper one digs, the further back in time one goes.
A layer 23,000 years old is exposed at nearly two feet down, revealing footprints of a female and a toddler. It tells a story of her mile-long journey through the soft clay mud. Roaming nearby was a giant sloth and a herd of mammoths. This discovery forces science to re-adjust the timeline of humans living on the North American continent, pushing it further back into the Pleistocene era at least 10,000 years.
Discoveries like this are the treasures archeologists seek. Archaeologists are scientists — part treasure hunters and part storytellers. They add context to history.
A trench dug into the brown gypsum soil on a lake playa in White Sands National Park reveals more human footprints below the surface. (Photo: National Park Service)
Ground-Penetrating Radar
Advanced technologies are aiding new discoveries of the past. Even though the footprints were buried beneath two feet of dirt, they were discovered without physically seeing them. Ground-penetrating radar (GPR) made the discovery possible. GPR has made significant advancements in recent years, along with improvements in other types of remote sensing applications.
The resolution of GPR has improved along with the depths that GPR can detect objects. Computers can process the GPR data into 3D images providing a depth profile of the scanned area. This is how the footprints were detected.
White Sands has the largest collection of fossilized human footprints. (Photo: National Park Service)
In addition to GPR, the researchers used magnetometers that verify disturbances in the sediment, which can also be imaged in 3D, albeit with a much lower resolution.
“The sediment itself has a memory that records the effects of the animal’s weight and momentum in a beautiful way. It gives us a way to understand the biomechanics of extinct fauna that we never had before,” said Thomas Urban, the Cornell University research scientist who led the team making the discovery.
Usually, archeological findings are of bones and artifacts. Fossilized “ghost” footprints of humans and other creatures brings them to life, providing glimpses of the living past.
Under ideal conditions, GPR can reach depths of 30 meters (98 feet). The accuracy and range of GPR depend on sediment type, moisture content and other geologic morphologies. Underlying GPR technology and magnetometry are robust geospatial information systems (GIS) that preserve a digital record of the discovery, allowing for further geospatial analyses. Advances in machine learning will improve future detection.
Elsewhere in the Americas, a project has been ongoing in Mexico since the 1990s using GPR to map the cenotes and underground aquifers used by the Mayans. A 215-mile-long underground water cave system — the longest in the world — has been mapped in the Yucatan peninsula. Divers exploring these cenotes found remains of Ice Age animals, including a sabertooth tigers and mammoths.
Map: William Tewelow
Lidar and ALS
Lidar (light detection and ranging) is making even more discoveries possible with the help of artificial intelligence and machine learning. For instance, in the jungles of Guatemala, lidar revealed the unknown ancient Mayan city of Tikal.
Lidar is an active sensor that measures ground height. Using an airborne laser scanning (ALS) system mounted to a plane, helicopter or UAV, the lidar device’s laser beams scan the landscape. The system calculates the time it takes for the beam to reach an object on the ground and bounce back.
The result generates one point for each ground object the laser touches, calculating the distance the beam traveled. Billions of points are collected during a scan. Geospatial archeologists then process the collected points into a point cloud (Figure 1). Selecting only points classified as ground and water, the points are converted to a raster image, and archeologists are provided a perspective of the bare earth under tree canopy and vegetation (Figure 2).
In this way, lidar serves as a non-destructive way to identify earthwork formations, even in dense jungle.
Figure 2. Lidar points are converted to a raster providing a bare-earth representation of the landscape. (Image: Stephanie Clark)
Figure 3. Pixel-derived object-based classification, developed using machine learning, identifies unmarked headstones from UAV-collected imagery. (Image: Stephanie Clark)
Object-Based Imagery Analysis
The challenge with lidar and imagery is the sheer volume of data, beyond the scope of what a human can manually review. Because of how faint archaeological features can be, the search often requires manipulating imagery datasets by combining multispectral bands, and then merging them with topographical data. To assist this huge endeavor, artificial intelligence is applied to pixel-based classification and object-based imagery analysis (OBIA) to highlight areas of interest for further study.
Dylan Davis, a Ph.D. candidate at Pennsylvania State University, spearheaded the use of OBIA for finding earthworks such as circular mounds, stone walls,and roadways in Beaufort, South Carolina. He took advantage of high-resolution NOAA imagery taken of the coast before the hurricane season of 2008. Using artificial intelligence for object-based imagery analysis, 160 previously undetected mound features were found.
Raster comparison: Sea Pines Shell Ring, Hilton Head Island, South Carolina. Credit: Dylan S. Davis, Matthew C. Sanger & Carl P. Lipo (2018): “Automated mound detection using lidar and object-based image analysis in Beaufort County, South Carolina,” Southeastern Archaeology [https://doi.org/10.1080/0734578X.2018.1482186]On the local level, archeologists apply the same approach to finding headstones in unmarked cemeteries. A pixel-defined object-based classification system helped one researcher automatically identify potential headstones in a densely vegetated cemetery.
The technology used for OBIA is also used for visual-inertial odometry (VIO). NASA is experimenting with VIO techniques to help astronauts navigate the lunar surface (see NASA’s Artemis program will need lunar spatial reference system). For Artemis, VIO will use the Moon’s craters as a reference system to derive an accurate position.
Virtual 3D Worlds
Perhaps one of the most significant uses of technology for archaeological research and exploration is the use of virtual 3D immersive worlds. Exploring ancient worlds as they might have looked gives archaeologists additional insights and the public a chance to experience their discoveries, connecting us with history.
The mile-long journey of a young female carrying a toddler across an Ice Age landscape 23,000 years ago seems so distant, yet so familiar to any parent. The image breathes life into our common ancestry. Through the power of GIS and modern technologies, she walked right into the 21st century.
“The man who knows and dwells in history adds a new dimension to his existence…He lives in all time; the ages are his, all live alike to him.” — William Flinders Petrie
Special thanks to Stephanie Clark, a geospatial archeologist with Integrated Environmental Solutions, LLC, of Phenix City, Alabama. Stephanie provided technical advice and collaboration, and the lidar studies for Figures 1, 2 and 3.
William Tewelow is a senior aeronautical information specialist for the Federal Aviation Administration. He is a 2016 graduate of the FAA’s management fellowship Program for Emerging Leaders and a mentor with the FAA’s National Mentor Program. He served on special assignment to the U.S. Department of Transportation and led a national strategic geospatial initiative under the authority of the White House Open Data Partnership.
Tewelow is a designated Geographic Information Systems Professionals (GISP), with degrees in geographic information technology and Intelligence Studies. he is currently earning his master’s degree in organizational leadership with a focus on performance management.
Tewelow retired from the U.S. Navy after serving 23 years as a geospatial and imagery intelligence specialist, a naval aviator, a meteorologist and a tactical oceanographer earning three achievement medals. He was among the first in the nation to earn a Geospatial Specialist Certification from the U.S. Department of Labor while working at NASA Stennis Space Center. He is married, enjoys traveling, connecting people, and solving problems, and is interested in new technology. His favorite quote is, “A man’s mind changed by a new idea can never go back to its original dimension.” ~ Oliver Wendell Holmes
When I saw that there was a plan for a whole bunch of unmanned, semi-autonomous racecars to compete at the Indianapolis Motor Speedway (Indy, or IMS) racetrack, I initially thought we might be headed to one significant mess of broken-up machines and potentially a lot of damage. I tracked the various announcements of the competition as things progressed, especially when a prize of $1 million dollars was put up by the Lilly Endowment in Indianapolis, and the majority of the field appeared to be potentially staffed by undergrad university teams.
Photo: Indy Autonomous Challenge
However, this isn’t the first time we’ve had unmanned, autonomous road vehicles in competition — we’ve seen highly instrumented SUVs in desert settings in Nevada and California, initially with pretty poor results, which began to improve significantly for the second time round, then vehicles in some simulated street settings with some mixed and also some pretty good results.
So, as the competition date grew closer for the Indy Autonomous Challenge (IAC), the number of published progress reports began to increase, and we began to better understand how the initial 40 teams might take on this seemingly impossible task — how on Earth will they replicate a regular Indy (also a class of racecar) race? Surely many unmanned racecars on the same track at the same time doing more than 150 mph would be catastrophic!
When you take a look, however, at the advances we’ve seen, which have enabled unmanned cars, trucks, taxis and such – surely this tech could stretch to meet these major objectives? But Dallara AV-21 Indy Light racecars avoiding hurtling walls passing by, cornering, getting in and out of the pits, coping with vehicles behind, ahead and overtaking — even a superior-equipped unmanned racecar at >150 mph — well that’s something we would really need to see.
Then you have to take a look at the outfits involved, providing support to the IAC teams – companies including Cisco, and motor sport units such as ADLINK, Ansys, Aptiv, Bridgestone, Luminar, Microsoft and Valvoline and the non-profit Energy Systems Network. The University teams from around the world themselves appeared to also have significant heritage and skill-levels.
As the 40 University teams started the long trek to get over the hurdles that this challenge presented, members from 21 of those institutions were actually able to make it to Indy, grouped into nine “national” teams. By October 23 the nine teams, with only one car each, were ready to test their autonomous vehicles on the actual track.
Clemson University established the baseline Dallara AV-21 vehicle and technology to be used by each team for the race, with sensors monitoring chassis motion, suspension, tires and powertrain. Each team would install its own guidance and avoidance system, with each vehicle equipped with six cameras, four lidars, RTK GNSS, associated radios and bags of computing running each team’s customized control system software. The object being for cars to exit pit-lane, accelerate, brake, establish an optimum line for each corner and flat, avoid obstacles, evaluate the track conditions and establish tolerable limits.
The teams were required to complete several stages of selection, from submission of initial proposals through demonstration of existing vehicle automation capability, simulated race performance, qualification testing at the Indy track — all leading to an anticipated head-to head race against the other qualifiers.
Then 20 days of planned testing stretched to 50, and three months of preparation passed with students working intensely throughout, curing the glitches, experimenting with how to increase lap speed, and pushing the limits while still keeping the cars intact.
Energy Systems Network managed the rules of the final competition in a way that reflected Indy qualification days prior the main race — they judged that the technology was not yet at a stage where multiple cars on the track at the same time would have been such a good idea. So, each car was to individually run a number of practice/qualification laps and the quickest car would be the winner.
During the first stage of live competition, cars were required to exit the pits and run a warmup lap, followed by two laps that were timed and a slow-down lap that required navigating around inflatable barriers on the front-stretch, and then return successfully back around the track into their pit-stop locations. There were several spins in the corners and several crashes, but the four surviving cars/teams were able to optimistically post speeds of more than 130 mph.
Photo: Indy Autonomous Challenge
The final phase involved the four teams taking their cars around a number of warm-up/practice laps, followed by four timed laps. Only the car from Germany’s Technical University of Munich was able to complete all laps with an average speed of ~136 mph, so that team ultimately won the $1 million prize. Even so, all teams were able to successfully mature their systems’ performance through the many months leading up to the IAC and their progress through the various qualification stages. Even the other three final qualifiers had much to celebrate as a result of the competition.
The sponsors supporting the various teams as they progressed through the Challenge may have spent more than $120 million, so that high-pressure development work will be invested back into many vehicle automation opportunities. After all, that was the main objective for the whole undertaking. We should hopefully begin to see safer, more capable self-driving vehicles emerge in the months to come as the technology is applied to more production vehicle automation.
“What’s new with GPS?” people often ask me when I tell them my job. Recently, I have been responding by telling them about the other three GNSS constellations now fully available. However, as reflected every month in these pages, that is but one of many developments that combine to make satellite navigation ever more accurate, reliable and ubiquitous.
While the GPS program is old by the standards of the digital age, it has never been static. In the 1970s, when GPS was developed, the expected accuracy for civilians was tens of meters, though pioneering commercial users began right away to chip away at the system’s limitations by developing differential GPS (DGPS), carrier-phase positioning, and other techniques. By the end of the next decade, better signal processing and the implementation of DGPS had brought civilian accuracy to about one meter. In the 1990s, phase-ambiguity resolution made real-time centimeter accuracy standard for surveyors.
As the adoption of cell phones exploded, it became imperative to locate them to preserve the 911 system. Initially, this was done using the time-of-arrival of signals to handsets from towers, because it was assumed that GPS receivers could not be made sufficiently small, cheap, fast, power-efficient and accurate to work in cell phones. The implementation of assisted GPS, now standard in all smartphones, largely solved those problems.
Precision for civil GPS users increased by an order of magnitude in May 2000, when President Clinton ordered the removal of Selective Availability, and substantially once enough satellites began to broadcast the L2 civil (L2C) code, enabling ionospheric corrections. Later, the modernized signals in the L5 band enabled sub-meter accuracy without augmentations and very long-range operations with augmentations. There are now more than 80 signals in that band, on GPS, Galileo and BeiDou satellites. On the military side, the effort to deploy M-code signals, cards and receivers continues.
Over the years, in addition to modernized satellites and signals, improvements have included the development of PPP, RTK and hybrid techniques; the proliferation of local, regional and global correction services; improved jamming and spoofing detection; and the increasing integration of GNSS receivers with other RF receivers as well as with inertial, optical, radar, lidar and other sensors.
Future improvements may include:
signal authentication
commercial systems in low Earth orbit that would have a signal strength on the surface three orders of magnitude greater than current GNSS, greatly boosting indoor reception and protection from jamming
inertially aided extended coherent integration, a.k.a. “supercorrelation,” which makes moving GNSS receivers more sensitive to signals they receive directly than to reflected ones
3D-mapping-aided GNSS, which enhances the positioning algorithms by identifying non-line-of-sight signals; this is being pioneered by Google in nearly 4,000 cities, relying on its 3D city models and machine learning.
The moment I send this month’s issue to the printer, I will think of more past and future improvements. As soon as you receive it, many of you will think of yet more. What’s new with GPS? A lot.
If we introduce children who have an interest in visualization of puzzles, art and mathematics to the appropriate training methods, we can help train future STEM students that could turn into our next generation of surveyors and geospatial professionals.
Many of us who were children before computers, the internet, and lots of electronic gadgets used our imagination to create fantasy worlds and environments. Many of these visions were drawn on paper using pencils, crayons and paints to recreate those images so we could share them with others. While the world in which we live, work and play exists in three dimensions, our minds were kept to a two-dimensional level because of how ideas and visions were made possible only on flat surfaces or media.
Photo: Tim Burch
Surveying has been no different through the centuries. Surveyors have generally divided their work into two categories: land boundaries and topography. Typically, the surveying process of parcel establishment and retracement has been a two-dimensional task, while topographic surveys utilize elevations to determine relief and drainage patterns. This survey information was drawn as graphic depictions on paper to provide the pertinent data to users. It has been generally impossible to express survey data, including boundaries and topography, in a three-dimensional form as the human eye sees it. Many different professions have tried to present information beyond the second dimension but with little success.
The beginning of the imagery revolution
In the 1800s, the invention of photography brought a new medium into our world by capturing images of still life onto a two-dimensional format. Photographs, when taken at a proper angle and lighting, helped establish depth to an image, but only if taken in the right context and for the correct purpose. The 1830s brought us the stereoscope, utilizing two slightly different versions of the same photograph to be viewed through a binocular device and “tricking the brain” into establishing depth within the image. This is one of the first examples of using a visual technique to teach our brain to gather 3D information based upon a 2D image or dataset.
The 1800s also brought us the “motion picture” or movie as we traditionally know it. Ranging from 16 to 24 frames per second and using varying methods to “flash” through a sequence of progressing images, the movie brought another new medium into our world. While silent films were the predominant movie type, several inventors conceived varying ways to produce movies in three dimensions. The most popular type was the stereoscope movie, but moviegoers found it too cumbersome to sit behind a stationary set of stereoscope glasses for the length of the film.
Another innovation from the 1890s was the creation of the anaglyph. This viewing style required glasses with a red lens for the left eye and a blue lens for the right eye to view two negative images that form a stereoscopic subject. These images remained popular well into the 20th century, with the concept crossing over into films.
It is one thing to see an object in real life and make a mental note of what it looks like from varying angles. It is another thing to accurate depict the same object on a two-dimensional medium that gives the viewer the same perspective of the real object. Artists who can simulate depth on an otherwise flat media with drawings and paintings are rare; one of the most famous is M.C. Escher (1898–1972), a Dutch artist known worldwide for his “impossible” drawings and sketches based upon mathematical figures. He had a gift of seeing his art in three dimensions and translating it to various mediums.
But not every drawing is an artistic interpretation. Ideas that come to fruition in an inventor’s mind often get drawn to scale on paper for sharing with others. Mechanical engineers often used a system known as isometric drafting, a method of drawing a three-dimensional item to join an isometric view, giving the shape within the drawing a sense of depth.
Toys and games as training tools
Little did we realize as children and young adults that many of the inventions for imagery led to many popular toys in our history. For instance, the View Master was invented in 1938 and widely introduced at the 1939 New York World’s Fair. This toy turned the stereoscope concept into a sightseeing treasure. In the 1960s, the photographic reels viewed within the View Master began featuring television, movie and cartoon characters in various storylines. It is estimated that more than 1.5 billion reels have been produced covering sites and subjects from every corner of Earth.
There have also been many variations on the optical illusions designed to make one see a certain image, then suddenly see something completely different. One significant entry in the illusion category is Magic Eye, a series of images based upon single-image random-dot stereograms, or autostereograms. These images utilize computer graphics to “hide” a 3D image within patterns of other shapes and trick your brain into focusing on the hidden subject. After more than 25 years and hundreds of millions of copies of its books, Magic Eye is still challenging people to “see” objects in three dimensions.
However, the biggest training device for seeing 3D objects in a 2D medium happened within the same timeframe and has no plans for slowing down any time soon: video games. The video game platform has reinvented itself several times in its short life, but the premise behind the visualization remains the same. Some of the systems allow for virtual reality glasses or goggles to enhance the user’s experience.
“Yes, in fact, my child is gifted…”
The scientific term for this visual ability is called spatial intelligence. Spatial intelligence has and attracted attention in recent years for helping determine a person’s strengths and capabilities. Spatial intelligence, also known as spatial reasoning, is one of the nine intelligences in the Theory of Multiple Intelligences proposed by psychologist Howard Gardner. In his theory, Gardner challenged the narrow definition of general intelligence with his proposal of nine types of intelligences:
spatial
linguistic
logical-mathematical
musical
kinesthetic
interpersonal
intrapersonal
naturalistic
emotional
Often, we know people who display various traits as defined within this list of intelligences. Someone with linguistical intelligence is well-spoken, enjoys reading and writing, and can explain a situation or story well. A person with logical-mathematical intelligence solves difficult computations and is a tremendous problem solver. Musical intelligence is found in one who is a “natural” at playing a musical instrument or singing. The pattern continues with the rest of the list and helps to establish strengths within one’s abilities. Most of the intelligences are born within a person, while a few can be somewhat taught. Finding the people with the strongest abilities in a given trait leads us to the highest performers.
Spatial intelligence is observed in those who like to draw, design or build things, and are quick to mentally manipulate objects to solve puzzles. David Lohman, a researcher who has spent most of his career studying the subject, defines spatial intelligence as “the ability to generate, retain, retrieve and transform well-structured visual images.” Individuals with highly developed spatial intelligence have a unique ability to view objects and imagine them in rotated positions or different angles, and how a group of items can fit together.
How important is spatial intelligence as a teachable subject?
In the past, having spatial intelligence was a naturally occurring trait. Important figures in history, including Picasso and da Vinci, are a few examples of individuals with high spatial intelligence. Clinical research, however, has determined this ability to be a skill that is actually trainable in many instances. If we introduce children who have an interest in visualization of puzzles, art and mathematics to the appropriate training methods, we can help train future STEM students that could turn into our next generation of surveyors and geospatial professionals. By employing a spatial component into lessons and challenging students through visual tasks, they begin to identify objects and other matter into geometrical patterns and spatial relationships. Students who display these spatial characteristics are better at critical thinking and problem solving, which in turn gives them more self-confidence.
Another important characteristic of spatial intelligence is that gender does not play a large role. Studies have shown that with training and a challenging curriculum, both boys and girls are prone to excel at gaining more spatial awareness and ability to solve problems. The key to maintaining this equality in spatial intelligence is to provide equal education and training for both genders in the formative years. Often, only boys are steered toward sports, math and science while girls are directed to the arts and humanities. By providing all children with the opportunity to experience spatial learning, they will begin to build skills that will help them for a lifetime.
What does spatial intelligence have to do with GNSS and surveyors?
It has everything to do with geospatial data! Literally all survey data collected these days is geospatial in nature and contains three-dimensional coordinate values. Why is the evolution of seeing 3D objects in 2D spaces so important? Not everyone can visualize these shapes immediately in two dimensions. If we are able to identify those with strong spatial intelligence levels, we can steer them into the many variations of geospatial fields and surveying.
Previously, our surveying profession dealt with data collection in small doses. A good day of topographic surveying might see a crew collect 1,000- to 2,000 points. (Not to mention the days before data collectors!) Because the area covered within the day’s work was significant, the surveyor did not have to look at a “big picture” of terrain and improvements. These smaller chunks, even though they were collected with elevations, were plotted in 2D. The contours drawn using the points were simply grade proportions between points and did not produce a 3D effect.
Lidar data collected in May 2021 for a study of the San Andreas Fault system. (Image: Stephanie Dudash, USGS)
Fast forward to the surveying instruments and CAD software in today’s work environment. Remote sensing through UAV-mounted, vehicle-mounted and terrestrial-based instruments collect thousands to millions of points (per second in most cases), and we get the resulting point clouds produced by these instruments. It is equally important to see the spatial relationship of the terrain, improvements and overall site conditions for both the surveyor and the CAD technician. We now have data that literally blankets the surface of the subject site, and it is up to both field staff and office staff to correctly interpret that data for the prospective client. Having surveyors and technicians with a reasonable sense of spatial intelligence gives the data a better chance of correct interpretation and depiction.
Many STEM industry experts are beginning to work with researchers on creating more educational curriculum based upon the various intelligence categories previously discussed. Spatial intelligence will continue to increase as an influencing factor in helping students decide on their career choices. Having our educational system also increase the amount of spatial relationship curriculum within their core teachings, we can help grow our potential STEM professionals and technicians for generations to come.
While many professions and occupations continue to struggle in anticipation of their future need for employees, the surveying and geospatial professions can help do something about it now. Encourage your kids to play video games, fly their drones, play sports, and solve complex problems. Playing and learning today may help them with their future profession. If not, they can enjoy themselves while they can. Don’t we all wish we were kids again some days?

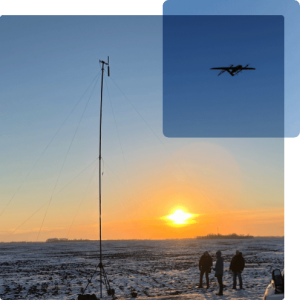
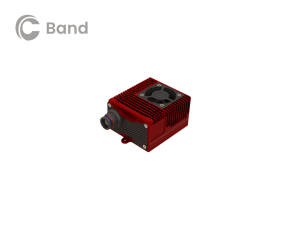


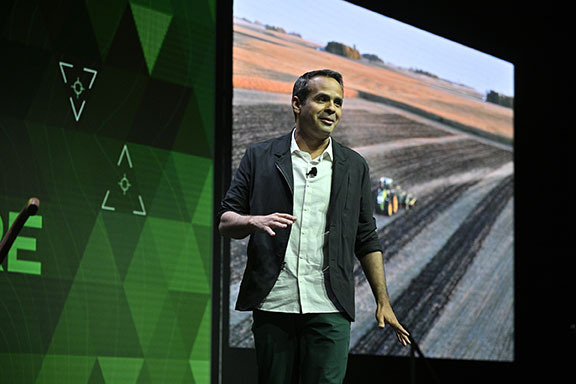
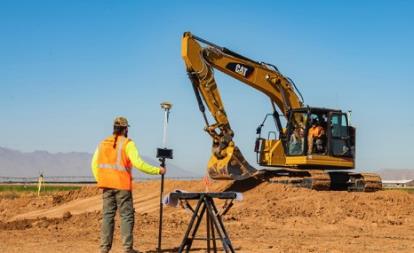
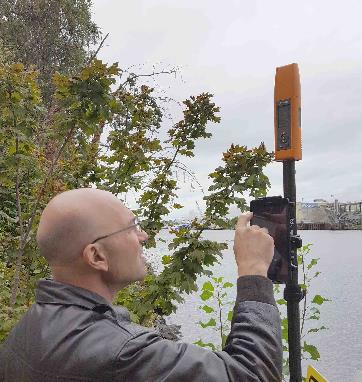
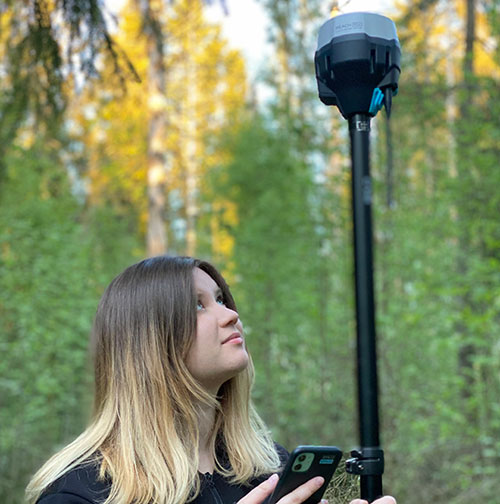
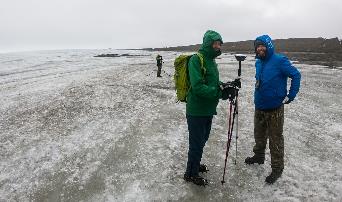
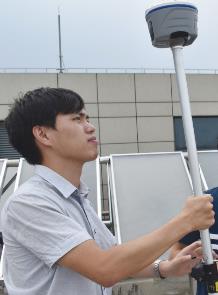


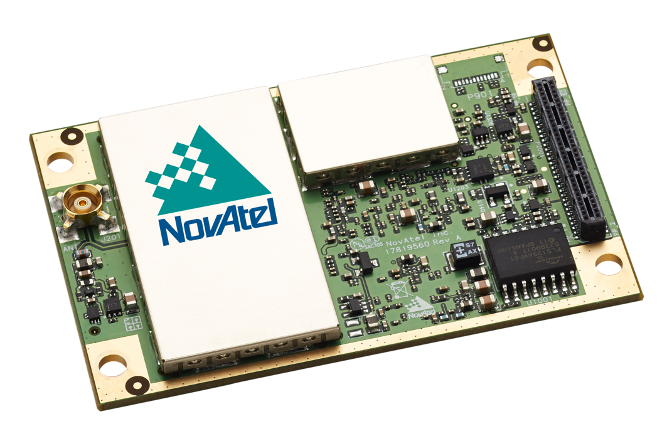
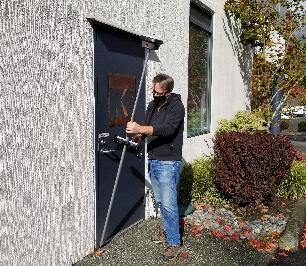


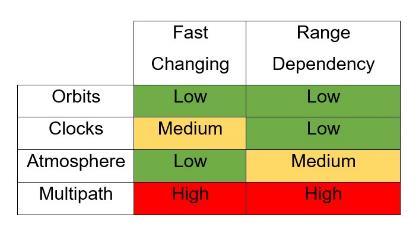

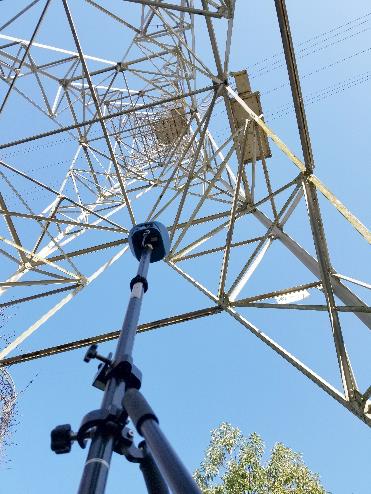

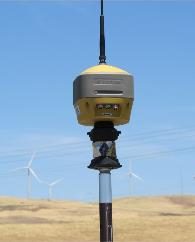
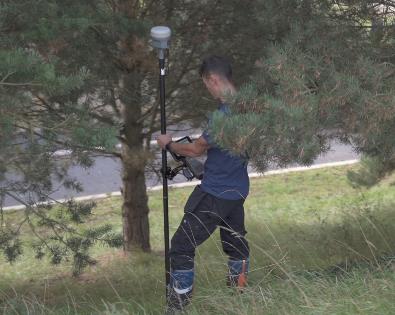

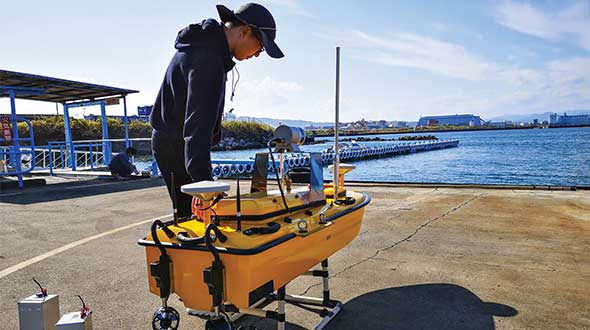
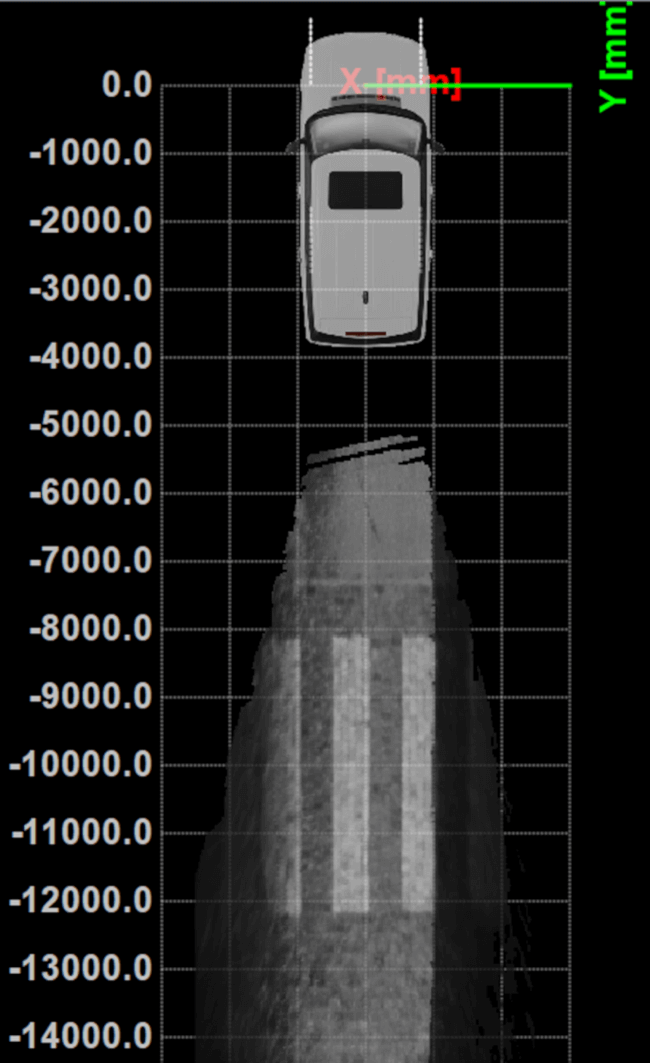
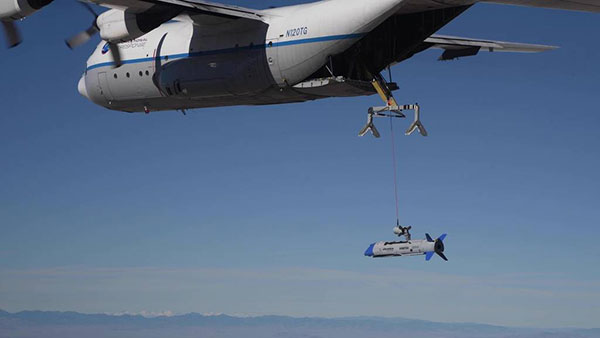
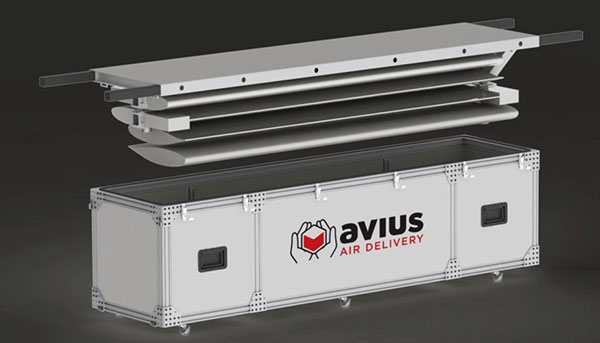


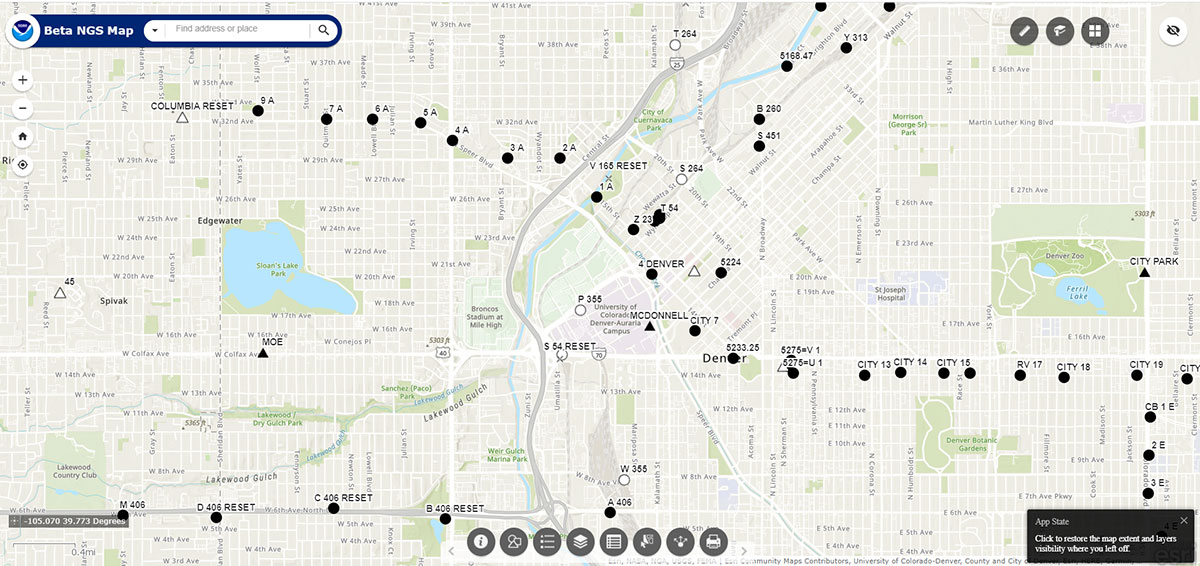

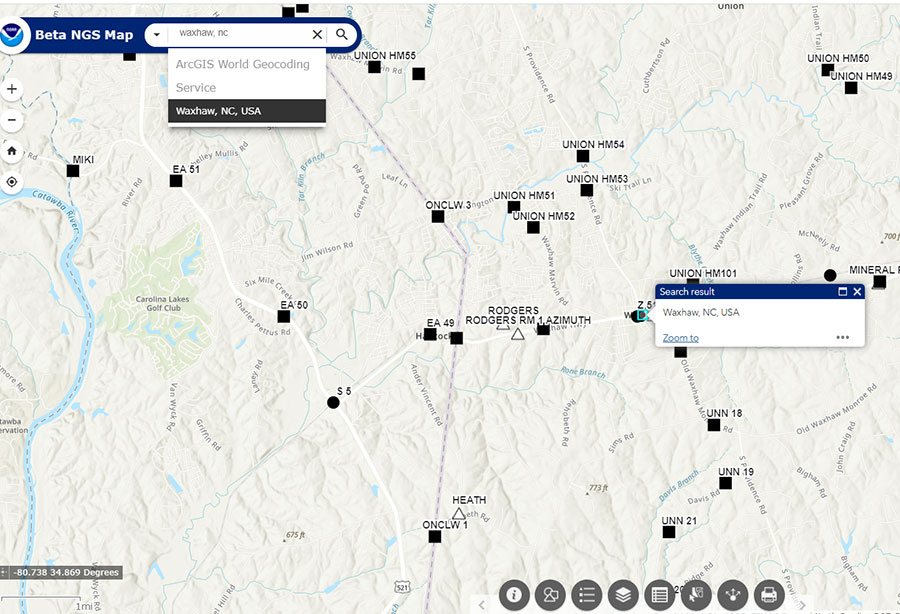
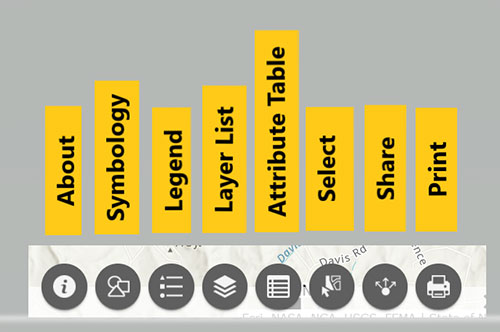
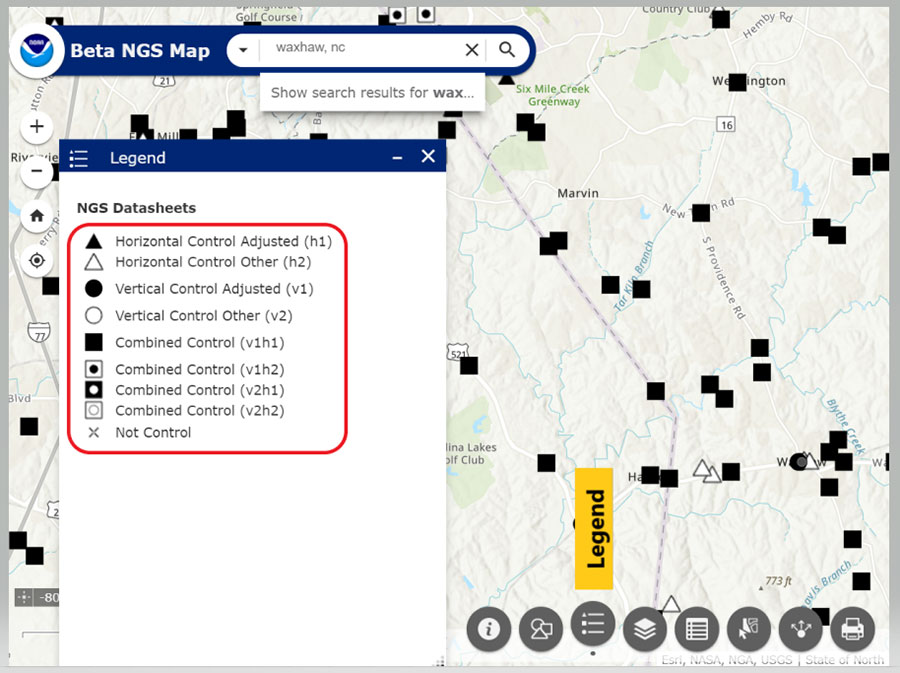
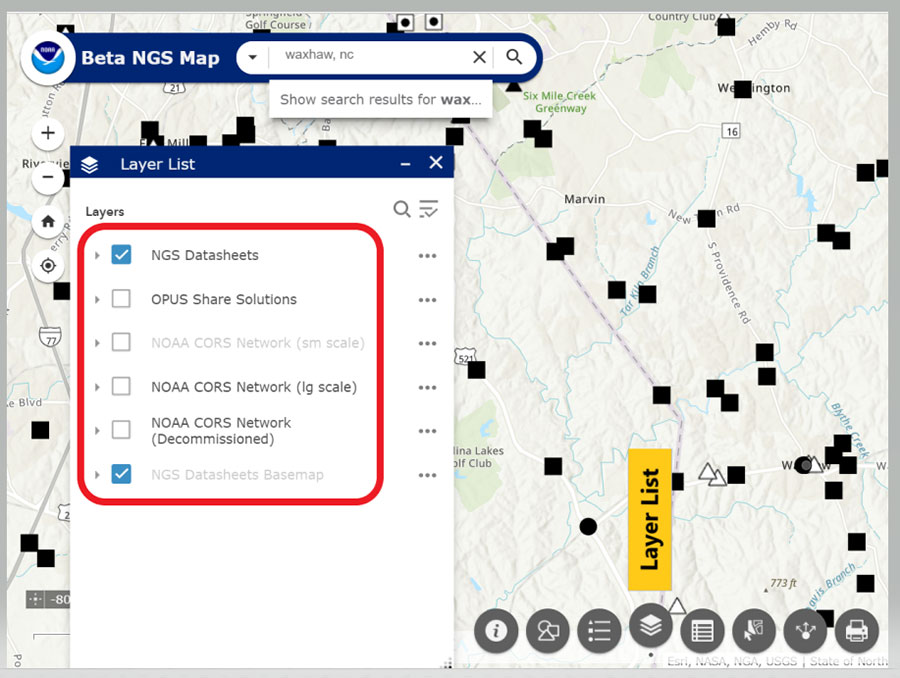
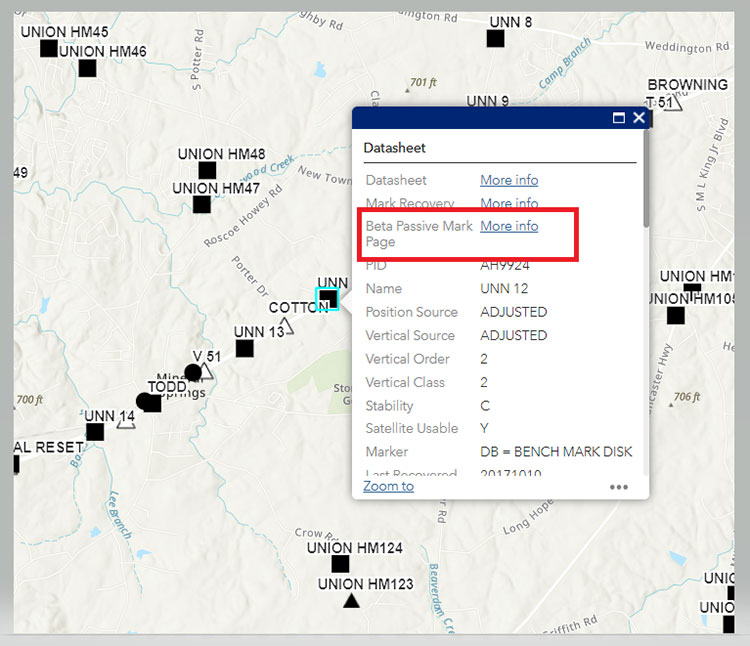
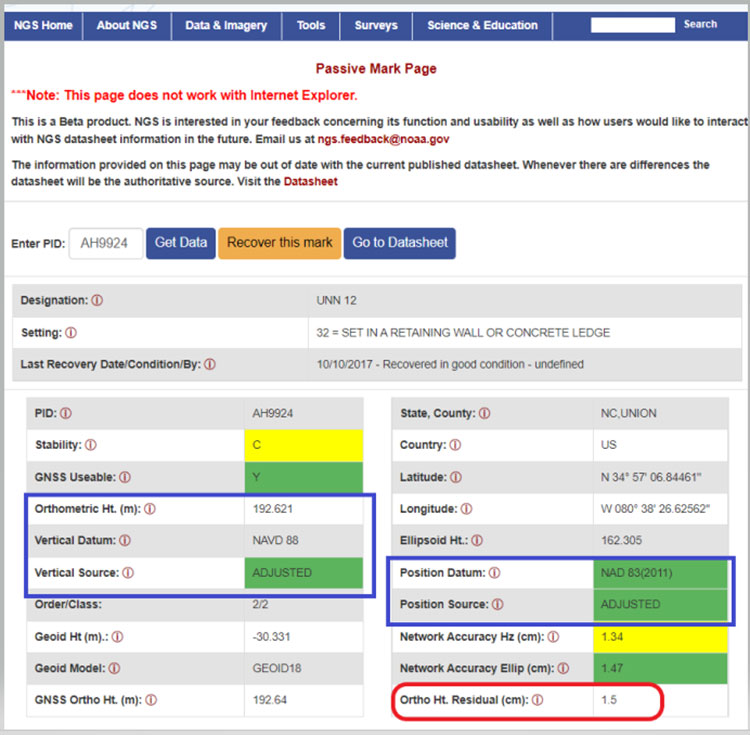
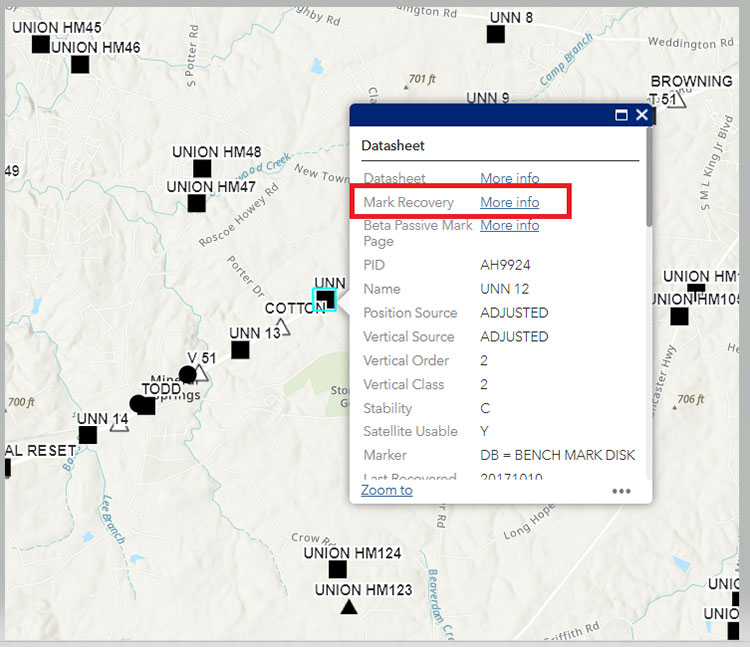
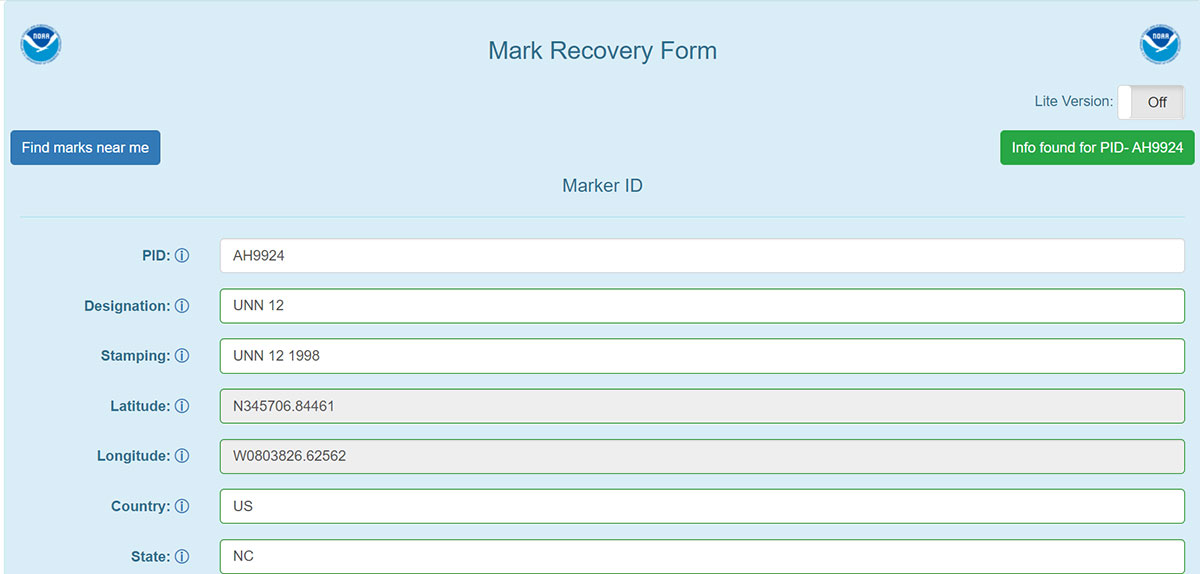
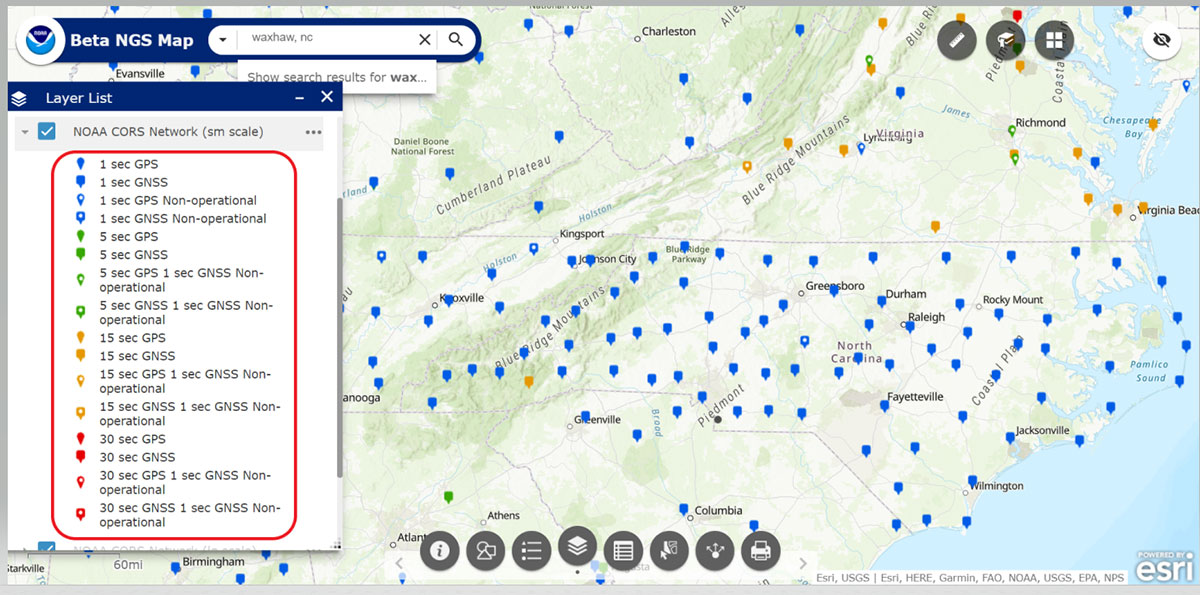
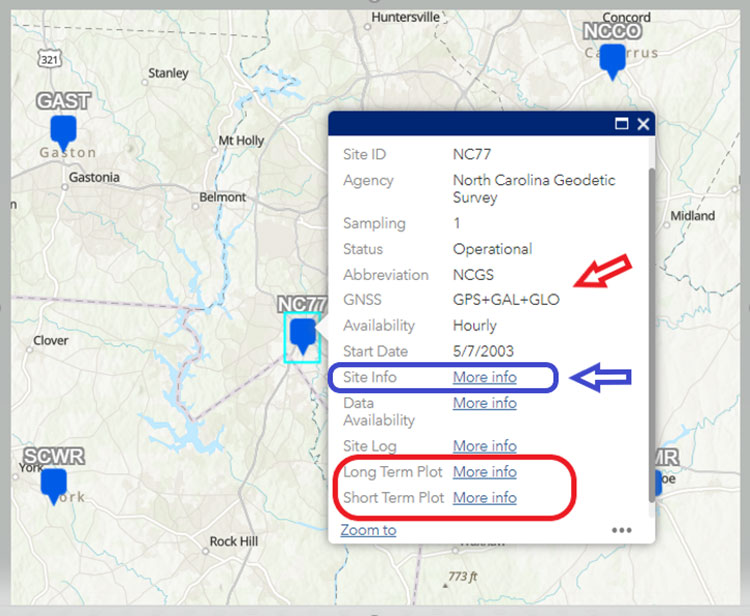
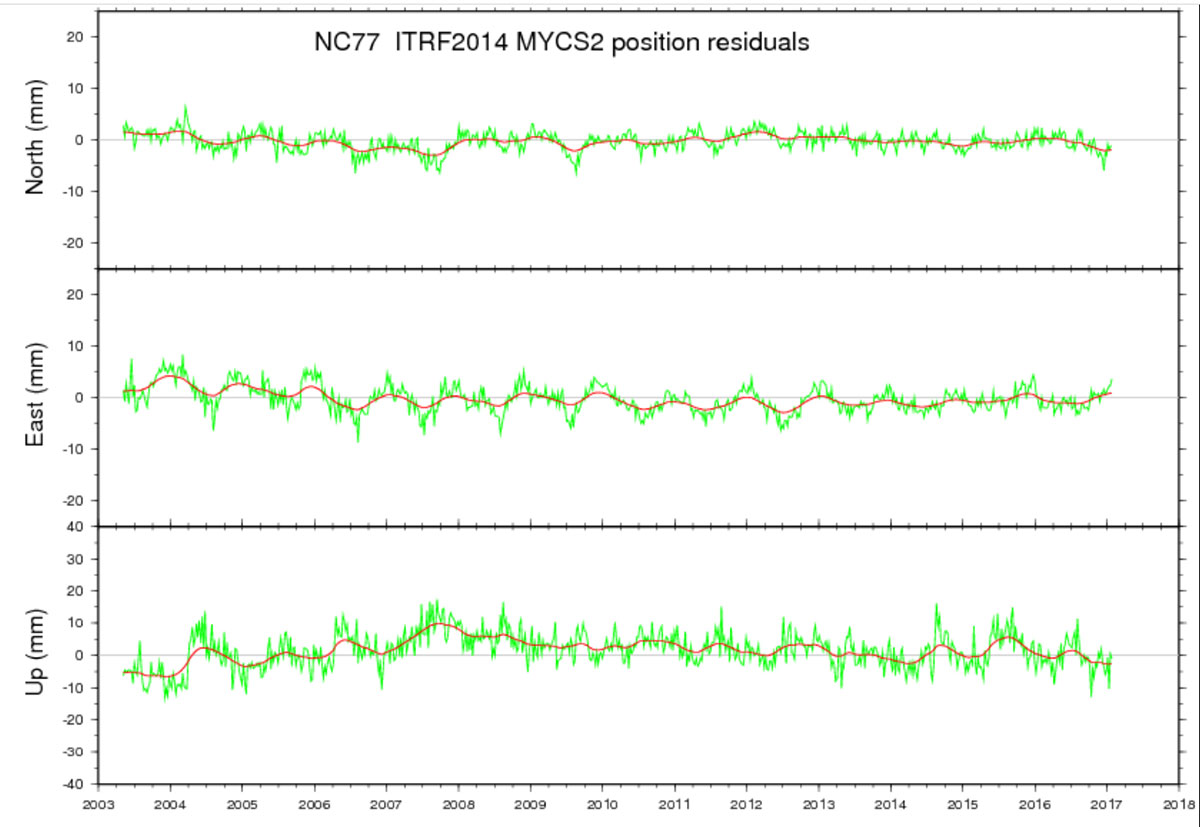
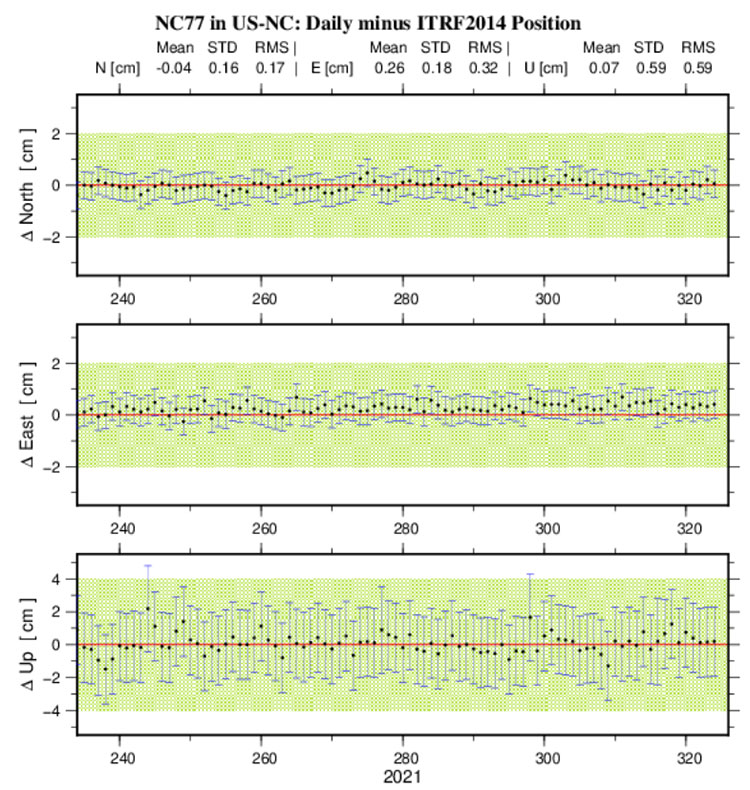
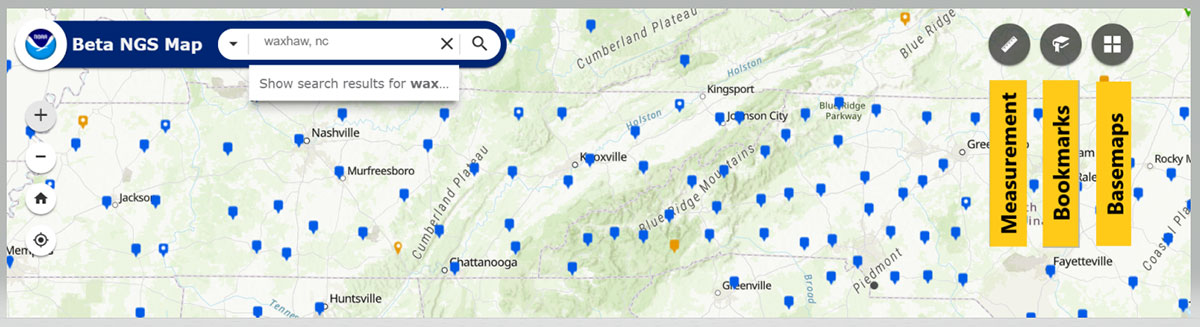

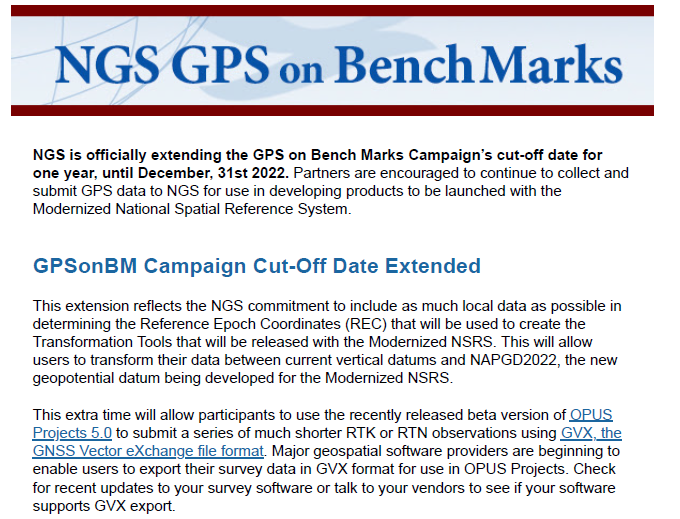


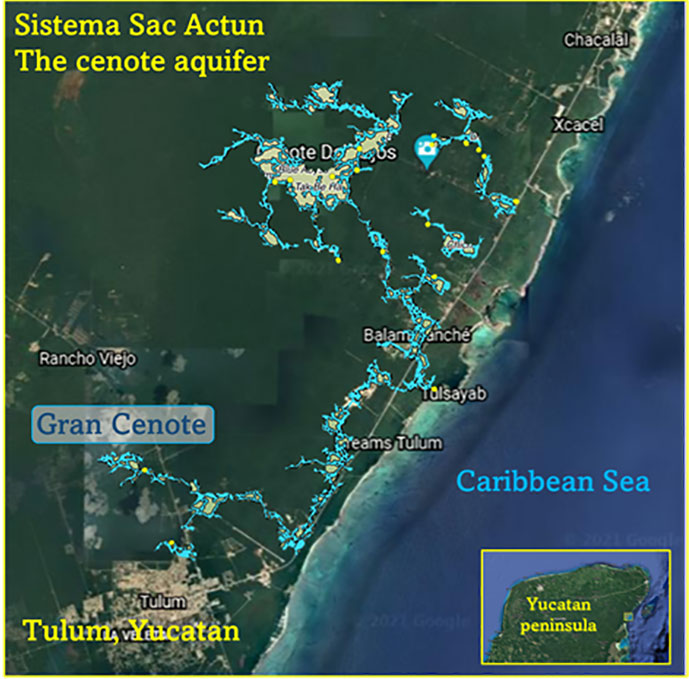
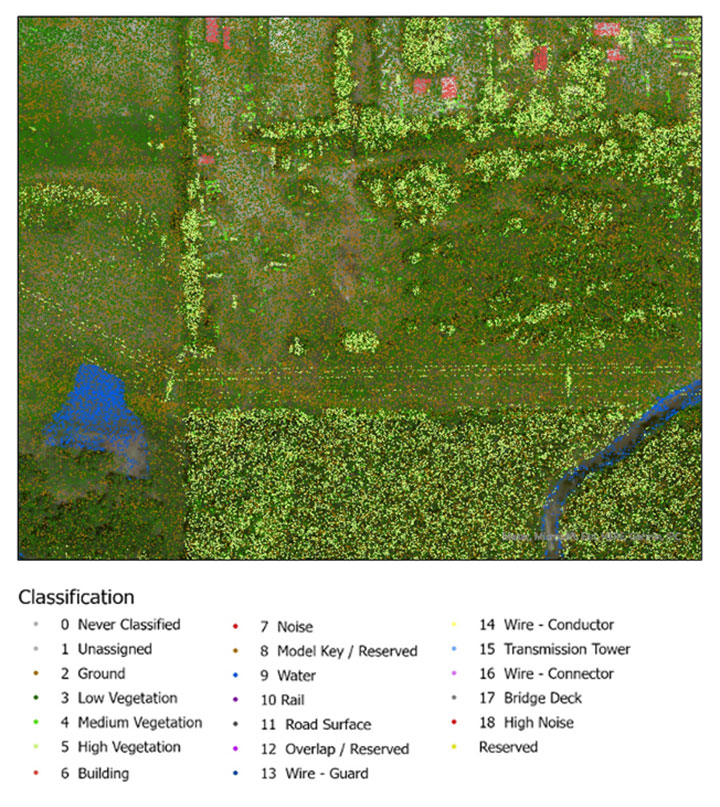
![<b>Raster comparison: Sea Pines Shell Ring, Hilton Head Island, South Carolina. </b>Credit: Dylan S. Davis, Matthew C. Sanger & Carl P. Lipo (2018): Automated mound detection using lidar and object-based image analysis in Beaufort County, South Carolina, Southeastern Archaeology [https://doi.org/10.1080/0734578X.2018.1482186]](https://stage.globalpositioningnews.com/wp-content/uploads/2021/11/Davis-SC-mounds-HiltonHead.jpg)