Currently, 37 Global Positioning System satellites are on-orbit, with 29 of them set healthy. The system continues to provide an average 48-centimeter position accuracy. Despite this achievement, the U.S. government — specifically, the Space Force — continues to modernize GPS’s space, control and military user equipment segments.
Modernization of the space segment is centered on the GPS III satellites, which provide up to eight times better anti-jam capability and a new L1C signal to improve user connectivity. GPS IIIF satellites, scheduled for delivery starting in early 2026, will add a search-and-rescue payload, a fully digital navigation payload, and greatly enhanced anti-jam capability for military operations.
Modernization of the control segment is focused on the next-generation Operational Control System (OCX), scheduled to become operational early next year. OCX will sport an updated architecture to provide enhanced command-and-control capabilities and enhanced cybersecurity. Despite the pandemic, all 17 global OCX monitoring station installations were completed last summer, and most of the remaining equipment was fielded by the end of 2021.
Twenty-four GPS satellites are broadcasting the military code (M-code). The Modernized GPS User Equipment (MGUE) program is developing military GPS receivers able to take advantage of these signals to improve defenses against spoofing and jamming while allowing navigation warfare operations.
On the civil side, GPS modernization will play a key role in the development of the Next Generation Air Transportation System and intelligent transportation systems. The Department of Defense coordinates its GPS activities with the Department of Transportation (DOT), the Federal Aviation Administration (FAA) and many other federal departments and agencies via the National Executive Committee for Space-Based PNT. The term “space-based PNT” refers to GPS, GPS augmentations and other GNSS.
However, this government-wide coordination and cooperation is contradicted by the stand of the Federal Communications Commission (FCC) on the matter of Ligado Networks’ applications to modify its license for terrestrial service, which it approved in 2020. The FCC’s decision is opposed by the executive branch, represented by the National Telecommunications and Information Administration (NTIA), and by 14 federal agencies and departments individually (including the departments of Defense, Transportation, State, Treasury, Justice, Interior, Agriculture, Commerce, Energy and Homeland Security), as well as by the National PNT Advisory Board and by most GNSS receiver manufacturers and aviation organizations. NTIA took the unprecedented step of filing a still-pending petition for reconsideration with the FCC. The concern is that Ligado’s proposed transmission power exceeds the thresholds established by the DOT’s April 2018 GPS Adjacent Band Compatibility study to protect GPS users from harmful interference.
So, the list of threats to GPS now includes solar flares, spoofing, jamming, “legal jamming” by Ligado, and the Russian government’s recent threat to destroy GPS satellites. Modernizing GPS must proceed hand-in-hand with protecting it.
Innovation is the watchword in Washington this year. Amidst an ongoing supply-chain crisis and rising global trade tensions, policymakers have put renewed emphasis on U.S. leadership in such industries as semiconductors, wireless broadband and artificial intelligence — areas rightly seen as the “enabling technologies” of the 21st century.
Alongside chips and supercomputers is another innovation underpinning everything from our communications networks to financial transactions and air transportation: GPS technology. 2022 will see a flurry of activity to accelerate U.S. competitiveness for the modern economy and accelerating the modernization of our GPS constellation must place high on this list.
It’s no surprise that allies and adversaries alike have taken notice of GPS. While for decades U.S.-led GPS was the “only game in town” for global navigation satellite systems (GNSS) services, the current global picture is much changed. Russia, China, the European Union, Japan, India and other nations have explored, tested and deployed satellites to build out their own global or regional positioning, navigation and timing (PNT) networks and capabilities. The more recently deployed GNSS — including China’s BeiDou, which was completed in 2020 — represent a competitive threat by our international adversaries in spite of U.S. GPS technology advancements in performance and resilience. The potential loss of global leadership poses a dramatic challenge for U.S. interests.
Although our current GPS constellation continues to enable critical services that touch nearly every aspect of daily life, the oldest satellites were launched in the late 1990s. As new, more advanced GPS satellites go up in the sky, we can take several policy steps here on the ground to ensure that GPS remains the global standard — undermining attempts to create an information ecosystem independent of the United States and reliant on our international competitors.
Enter the United States’ GPS modernization program. Allocating the resources necessary to accelerate the launch of new GPS satellites will pave the way to keeping GPS globally competitive — both in defense and civil applications. Take accuracy, for starters. New GPS satellites will bring three times better accuracy than existing systems and up to eight times improved anti-jamming capabilities, both of which will keep us competitive and add critical security against domestic spoofers and foreign adversaries.
While U.S. firms should continue to create multi-constellation receivers that are interoperable with global PNT signals, U.S. policy should promote American technological leadership by accelerating modernization of the GPS space and control segments. Importantly, a necessary element of this technological leadership is development of a systematic roadmap to spur adoption of these new modernized features in civil applications. Establishing this clear pathway for civilian applications of a modernized GPS constellation is critical to ensuring that the potentially more than $1 billion of economic benefits added every day by the U.S. civil GPS sector are fully realized.
As Congress continues to focus on innovation and global competition, the GPS Innovation Alliance is committed to working with policymakers to promote the critical security, economic and diplomatic benefits to the United States of investing in next-generation GPS infrastructure.
Originally a product of the Sputnik era, GPS has demonstrated the very best features of competitive U.S. government investment. As the United States prepares for a renewed era of global competition, the promise today of invigorated support for GPS remains the same.
The United States must continue to lead by modernizing GPS and establishing a clear pathway for civilian applications of the improved constellation. (Image: matejmo/iStock/Getty Images Plus/Getty Images)
Given that space is increasingly a congested and contested arena, should the U.S. government establish a new office to manage both space-based and terrestrial-based PNT systems?
John Fischer
“The U.S. government already has the National Executive Committee for Space-Based PNT (see gps.gov), which coordinates policy among all the branches of government. There is also a PNT Advisory Board, which includes some international members to inform the committee, and a National Coordination Office to execute the policies. This is in addition to the new U.S. military’s Space Command under which GPS operates. So, space-based issues are being addressed, but maybe more could be done to coordinate terrestrial-based PNT systems with space-based ones.” — John Fischer
Ellen Hall
“As new technology advances, government, along with its policies and laws, struggles to keep pace. This was certainly true of the internet and cybercrime. This is also true of terrestrial-based PNT, where new technology emerges in areas not currently covered. Policy gaps and overlapping technologies need to be addressed and coordinated. It certainly seems that this would be one of those areas that could benefit from oversight. Space-based PNT is currently addressed by the National Executive Committee for Space-Based PNT, among others.” — Ellen Hall
Bernard Gruber
“The threat to U.S. space-borne assets and the signals they generate is very real. Both commercial and military users of GPS continue to seek independent alternatives to current PNT systems that are diverse and robust. The National Coordination Office supports the National Executive Committee (NEC) for Space-Based PNT. I believe the role of the NEC should be broadened to include terrestrial and alternative PNT as a first step to charter/secure a new or expanded program office.” — Bernard Gruber
Editorial Advisory Board
Tony Agresta, Nearmap
Miguel Amor, Hexagon Positioning Intelligence
Thibault Bonnevie, SBG Systems
Alison Brown, NAVSYS Corporation
Ismael Colomina, GeoNumerics
Clem Driscoll, C.J. Driscoll & Associates
John Fischer, Orolia
Bernard Gruber, Northrop Grumman
Ellen Hall, Spirent Federal Systems
Jules McNeff, Overlook Systems Technologies
Terry Moore, University of Nottingham
Mitch Narins, Consultant
Bradford W. Parkinson, Stanford Center for Position, Navigation and Time
The appropriation for fiscal year 2022 enacted this month included $15M for “Position navigation and timing [PNT] technologies and global positioning system [GPS] backup” in the Department of Transportation (DOT) budget. At first glance, this might seem like a small but important step toward establishment of the system or systems President Bush mandated in 2004, the Obama administration promised in 2015, and called for by law in 2018.
Make no mistake, having the issue mentioned in the act is a very positive step. Unfortunately, a careful read of the report that came with the appropriations act shows the funds are not for solving, but for continuing to admire, the problem.
Here’s what the appropriation report says (in italics) and what it means. This is based on our reading of the text and conversations with hill insiders who said they had a tough battle with the administration to get any funding or mention of PNT or “GPS backup” in the budget at all.
“The agreement provides $15,000,000 to establish a program…” – This is not really a lot of funding for any federal effort. It is enough to hire several people, set up an office, and maybe do a few studies.
Notice that the appropriation language talks about “[leading] to wide adoption of multiple technologies.” It makes no mention of establishing any systems or signals.
Theoretically, this might be done by following the path in the Trump administration’s 2020 Executive Order on responsible use of PNT. The order addresses critical infrastructure and encourages such users to protect themselves with alternate PNT services they find on their own.
DOT might try this with all users to achieve “wide adoption,” though there are many obstacles. Principal among these is that GPS is free while commercial services are not. Providers of alternative PNT services have long recognized that it is impossible for them to compete with free GPS and argued that the government needs to be the customer.
“…Funding will enable, among other things…” An interesting turn of phrase that seems to say, ‘you must do all of this, but if you have any money left over you can do other things.’ This is pretty much a throw-away phrase since, with this worklist, they won’t have money left over for anything else. In fact, they will probably come up short.
“…the development of safety-critical PNT requirements and standards…” In other words, study the problem some more. Developing requirements and standards is important, but it doesn’t provide anything for the United States to use when Putin jams GPS or there is a huge solar storm.
“…vulnerability and performance testing…” Again, more study and little to no progress implementing solutions.
“…certification protocols for safety-critical functions”… Still more study.
“…the procurement of services as deemed appropriate by the Department…” Some might see this as a ray of hope. It could, conceivably, allow DOT to contract for PNT signals from space, fiber, or terrestrial broadcast and move toward establishing one or more systems. Unfortunately, $15M isn’t much for such an effort, even if DOT didn’t have to also create an office and do all the required studies and standards. In this context “services” almost certainly means contracted staff to help with administration and hiring think tanks.
“…and user adoption models in order to facilitate the responsible use of resilient PNT services to meet Federal requirements for widespread adoption.”
Since there are no “federal requirements for widespread adoption” to meet, this seems like another throwaway phrase that someone thought sounded actiony and proactive.
Additionally, we are not sure what a “user adoption model” is.
The best translation we can come up with is “DOT must figure out how to get Americans to adopt alternate PNT services that are either expensive or haven’t been invented yet. All in the absence of a government mandate for them to do so.”
Most in the PNT community have long recognized the need to “get the bullseye off of GPS” by making it a less attractive target, while at the same time protecting the nation against a wide variety of threats to satellites and signals. For them, the language in this year’s appropriation bill can be discouraging.
Yet there is some reason for hope. At least the problem was discussed in the bill, and some money was put toward it, regardless of how flawed the underlying assumptions and mandated actions might be.
Maybe we should all take comfort in the old Hollywood maxim – “It doesn’t matter what they say as long as they are still talking about you.” Let’s all keep the conversation going.
In January’s issue, he listed 10 questions from a PNT expert perhaps unfamiliar with eLoran.
These are important questions that must be asked of any technology, especially one under consideration to augment and back up our essential, but very weak and vulnerable, GNSS signals.
Yet the expert’s concerns pale in comparison to the essential questions about GNSS and PNT facing the United States and the West.
While I look forward to answers to the “10 questions” as a part of our ongoing professional dialogue, there are two important points of context we all need to keep in mind.
A Broad Consensus
First, Mr. Luccio’s assertion about eLoran being a part of the solution is more than reasonable. It also has a lot of impressive support from a wide variety of authoritative sources.
In 2008 and 2015, after much study each time, the U.S. government decided on and committed to building eLoran systems. Also, the U.S. government-sponsored National Space-based Positioning, Navigation and Timing (PNT) Advisory Board recommended eLoran in 2010 and 2018 as a part of securing the nation’s critical PNT capability.
In 2021, the U.S. Department of Transportation told Congress that wide-area terrestrial broadcast was a necessary part of a national PNT architecture. They later commented that infrastructure required per coverage area would be a key selection criterion for that broadcast technology. In other words, a system like eLoran.
Overseas, support for Mr. Luccio’s statement on eLoran is even stronger.
The United Kingdom has long endorsed eLoran and operates an eLoran transmitter as a timing reference.
Russia operates Chayka, a version of Loran.
Available information points to Iran’s terrestrial PNT system being a form of Loran or eLoran.
China and South Korea have long had Loran-C systems, and both are in the process of upgrading to the eLoran standard.
Each of these countries has publicly announced that it operates Loran/eLoran as a matter of national security in case space-based systems are jammed or destroyed, and to generally avoid overdependence on space-based PNT signals.
So, Mr. Luccio’s assertion was not at all revolutionary. Given all the studies, recommendations and existing uses, it would be surprising if he did not consider eLoran a part of the solution.
The Important Questions
Second, modern keying, encryption, authentication and other tech advances will help make all PNT technologies much safer and more resilient than they would have been decades ago, Loran and eLoran included.
Yet all will still have their strengths and weaknesses.
The most important questions we must ask are about how to establish the right level of national PNT security. These include:
What is the right combination of technologies and systems with different delivery and failure modes that complement and reinforce GNSS and each other?
How can the systems be efficiently and effectively implemented?
How can the services they provide be easily accessed and widely adopted to ensure all parts of society are protected?
Countries such as China have answered these questions and are well down the path to implementation and wide adoption. Their robust national PNT architectures support easier rollout of 5G, rural broadband and other systems. They also serve as solid tech infrastructure upon which to build myriads of technologies and applications yet to be conceived.
Those nations not so advanced must accelerate their efforts. Otherwise, they must resign themselves to perpetually coping with GNSS vulnerabilities, including the possibility of attacks, and an eventual second or third place in the world because of their shortsightedness.
The surveying profession is intrinsically involved with many functions of today’s communities and environment. When we take a closer look at the roles we play, the surveyor is usually found in the middle. Here are a few examples.
For new developments and infrastructure, surveying takes place after a client decides to begin a project. Site data must be collected, drafted and presented to the client, engineers and architects for design.
Upon completion of the engineering design, the surveyor provides layout services for the construction company to build the structure.
Once the improvements are completed, the surveyor provides surveys as well as record drawings for confirmation of construction to satisfy government agencies and financial backers.
In a property dispute, the surveyor becomes the center of attention — our professional opinion determines the correct location of the subject boundary.
This responsibility also extends to the geospatial sectors within the surveying profession. Data collection is a critical step to creating and maintaining efficient geographic information system (GIS) databases that correctly depict existing infrastructure and parcel boundary layers. With the surveyor at the center of many of these duties and tasks, no wonder that we sometimes feel we have a bullseye on our backs.
Knowing how to compute the center is an important aspect of the surveyor’s duty.
However, the word center takes on a different connotation when it comes to data and objects. Properly identifying the center of specific sets of data or objects is important when working with construction information and geospatial data. Properly measuring and marking the center of an installation has its challenges, so knowing how to compute the center is an important aspect of the surveyor’s duty.
Why is the center of an object important?
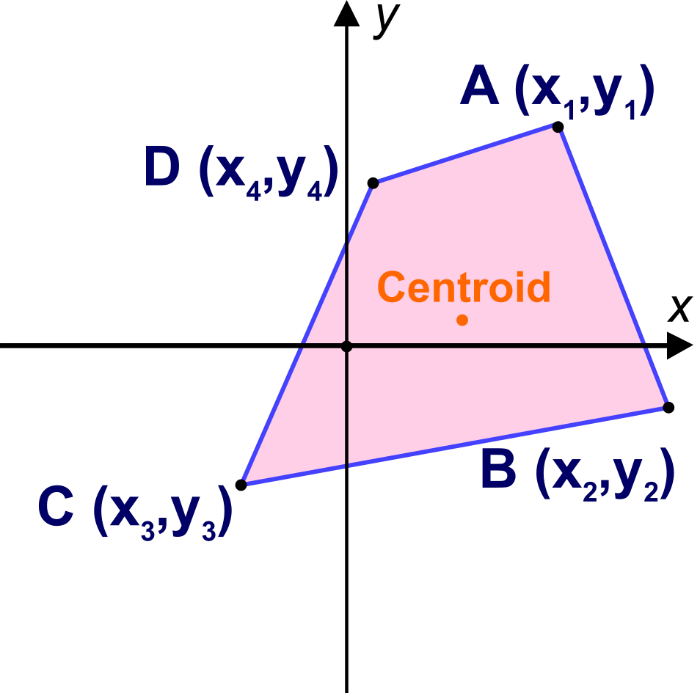
Every object that is definable in a two-dimensional space has a physical center. Whether the object is a regular or irregular polygon in plane geometry, there are various methods for determining its center.
Figure: Tim Burch
These figures are easy to understand and simple to solve. More complex figures require more calculations, including coordinate geometry.
Figure: Tim Burch
These examples of regular and irregular polygons have something in common: all are based upon two-dimensional space, which is flat. But what happens if we need to determine the center of a shape that does not fall on a 2D surface? What if the data being reviewed for a center resides on a spherical surface and contains diverging axes?
As surveyors, we break our work down to smaller coordinate systems to work around the fact that our data resides on a spherical surface, but some datasets require the information to remain as latitude and longitude. One dataset is population counts, otherwise known as the census.
The U.S. Census and the ‘center of population’
The U.S. Census Bureau has been at work since early colonial times. This excerpt from the bureau website explains its purpose and foundation.
The U.S. Constitution requires only that the decennial census be a population count. Since the first census in 1790, however, the need for useful information about the United States’ population and economy became increasingly evident.
The decennial census steadily expanded throughout the nineteenth century. By the turn of the century, the demographic, agricultural, and economic segments of the decennial census collected information on hundreds of topics. The work of processing these data kept the temporary Census Office open for almost all the decades following the 1880 and 1890 censuses.
Recognizing the growing complexity of the decennial census, Congress enacted legislation creating a permanent Census Office within the Department of the Interior on March 6, 1902. On July 1, 1902, the U.S. Census Bureau officially “opened its doors” under the leadership of William Rush Merriam.
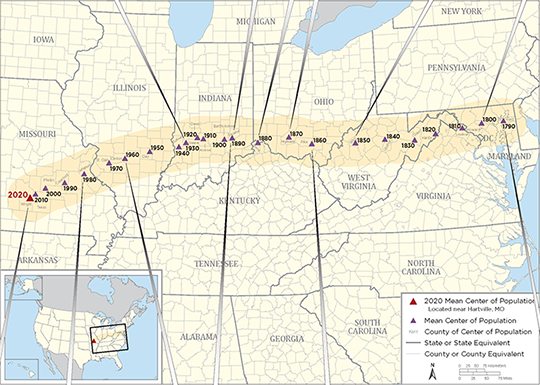
Counting the citizens of the United States was one thing, but mapping them was another. Once the final count was completed and mapped, the information was used to determine a unique location: the center of population. Here is more from the Census Bureau on the calculation basis:
The concept of the center of population as used by the U.S. Census Bureau is that of a balance point. The center of population is the point at which an imaginary, weightless, rigid, and flat (no elevation effects) surface representation of the 50 states (or 48 conterminous states for calculations made prior to 1960) and the District of Columbia would balance if weights of identical size were placed on it so that each weight represented the location of one person.
More specifically, this calculation is called the mean center of population.
This sounds like an easy exercise for a room of mathematicians and mappers, right? On the contrary, my fellow geospatialists!
How do they determine the center of population?
Computing the center of population for the United States would be much easier if we existed on a two-dimensional plane, as previously discussed. Since we don’t, however, it requires a much more difficult method of calculation to get us closer to a real-world solution:
To avoid unduly complex factors in the computations, the mathematical formulae used were those that would be precise for a true sphere. On such a sphere, the north-south distances between parallels of latitude are identical and distances in degrees may be used as units of distance. On the other hand, distances between meridians on longitude lines are not constant but decrease from the equator toward the poles. However, if the length of one degree along the equator is used as the unit of measurement, then the length in degrees of an east-west line at any other latitude can be adjusted to the measurement standard by multiplying by the cosine of the latitude.
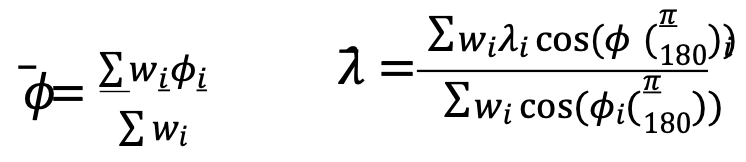
The center of population computed by the Census Bureau is the point whose latitude (𝜙) and longitude (λ) satisfy the equations:
where 𝜙𝑖, 𝜆𝑖 and 𝑤𝑖 are the latitude, longitude and population attached to the basic small units of area used in the computation.
Stated in less mathematical form, the latitude of the center of population was determined by multiplying the population of each unit of area by the latitude of its population center, then adding all these products and dividing this total by the total population of the United States. The result is the latitude of the population center.
East-west distances were measured, or computed, in substantially the same manner, but with the inclusion of a correction for latitude. For these distances, a degree of longitude at the equator was the unit of measurement. East-west distances along the equator could be measured in degrees, but any east-west degree distance north of the equator — where all the United States is located — had to be adjusted to recognize the convergence of meridians toward the poles. This adjustment required that each east-west distance, stated in degrees of longitude, be multiplied by the cosine of the latitude. This mathematical relationship is precise for a sphere and a very close approximation for the earth.
The computation required that the longitude of each of the thousands of selected points be multiplied by the cosine of the latitude of the point and by the population associated with the point. These products were added and divided by the sum of the products for the same thousands of points, each of which was obtained by multiplying the cosine of the latitude of a point by the appropriate population figure. The result was the longitude of the center of population.
(Courtesy of the Geography Division, U.S. Census Bureau, published November 2021)
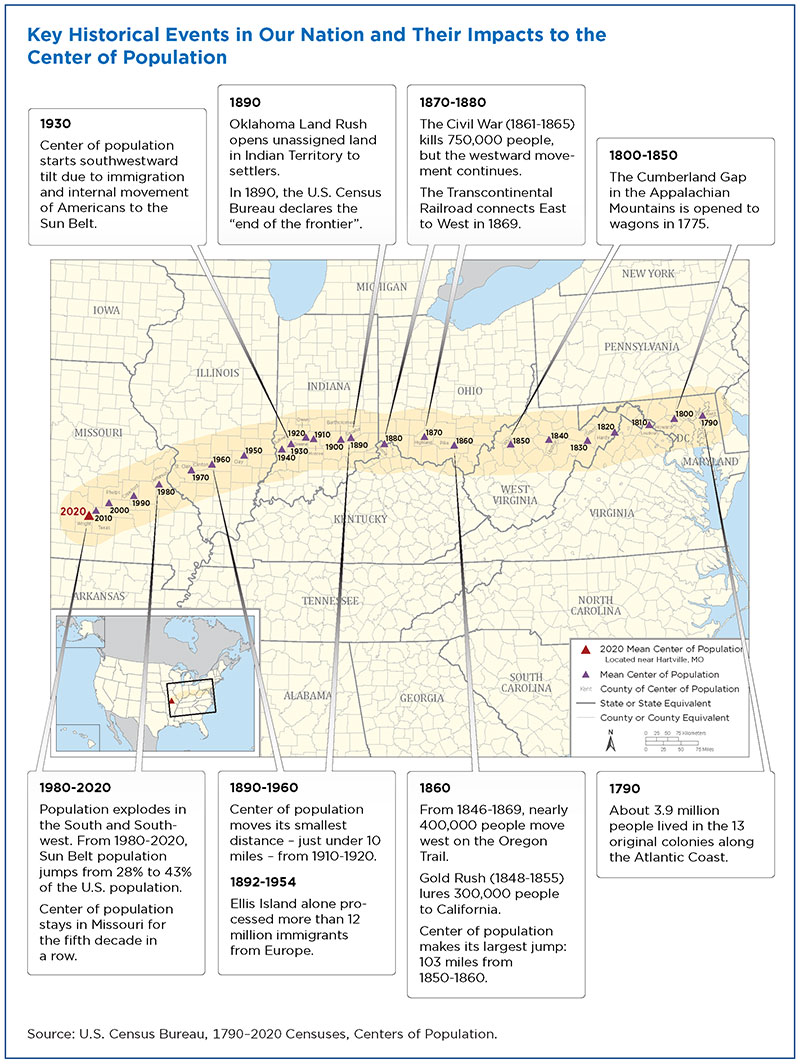
Here is a graphic from the U.S. Census identifying significant historical events along with the westward movement of the center of population:
Image: U.S. Census Bureau
Here are the locations with corresponding latitude/longitude for the centers from 1790 to 2020:
Mean Center of Population of the United States, 1790–2020
Census year
North latitude
West longitude
Approximate location
United States
2020
37.415725
92.346525
Wright County, MO, 14.6 miles northeast of Hartville.
2010
37.517534
92.173096
Texas County, MO, 2.7 miles northeast of Plato.
2000
37.69699
91.80957
Phelps County, MO, 2.8 miles east of Edgar Springs.
1990
37.87222
91.21528
Crawford County, MO, 9.7 miles southeast of Steelville.
1980
38.13694
90.57389
Jefferson County, MO, 1/4 mile west of DeSoto.
1970
38.46306
89.70611
St. Clair County, IL, 5 miles east-southeast of Mascoutah.
1960
38.59944
89.20972
Clinton County, IL, 6-1/2 miles northwest of Centralia.
1950
38.80417
88.36889
Clay County, IL, 3 miles northeast of Louisville.
Conterminous United States
1950
38.83917
88.15917
Richland County, IL, 8 miles north-northwest of Olney.
1940
38.94833
87.37639
Sullivan County, IN, 2 miles southeast by east of Carlisle.
1930
39.06250
87.13500
Greene County, IN, 3 miles northeast of Linton.
1920
39.17250
86.72083
Owen County, IN, 8 miles south-southeast of Spencer.
1910
39.17000
86.53889
Monroe County, IN, in the city of Bloomington.
1900
39.16000
85.81500
Bartholomew County, IN, 6 miles southeast of Columbus.
1890
39.19889
85.54806
Decatur County, IN, 20 miles east of Columbus.
1880
39.06889
84.66111
Boone County, KY, 8 miles west by south of Cincinnati, OH.
1870
39.20000
83.59500
Highland County, OH, 48 miles east by north of Cincinnati.
1860
39.00667
82.81333
Pike County, OH, 20 miles south by east of Chillicothe.
1850
38.98333
81.31667
Wirt County, WV, 23 miles southeast of Parkersburg.
1840
39.03333
80.30000
Upshur County, WV, 16 miles south of Clarksburg. Upshur County was formed from parts of Barbour, Lewis, and Randolph Counties in 1851.
1830
38.96500
79.28167
Grant County, WV, 19 miles west-southwest of Morefield. Grant County was formed from part of Hardy County in 1866.
1820
39.09500
78.55000
Hardy County, WV, 16 miles east of Moorefield.
1810
39.19167
77.62000
Loudoun County, VA, 40 miles northwest by west of Washington, DC.
1800
39.26833
76.94167
Howard County, MD, 18 miles west of Baltimore. Howard County was formed from part of Anne Arundel County in 1851.
1790
39.27500
76.18667
Kent County, MD, 23 miles east of Baltimore.
Data: U.S. Census Bureau
Not to be confused with the geographic center…
The geographic center of area is the point at which the surface of the United States would balance if it were a plane of uniform weight per unit of area. That point, approximately 44.967° north latitude and 103.767° west longitude, is located west of Castle Rock in Butte County, South Dakota, as it has been since Alaska and Hawaii became states.
The geographic center of the conterminous United States (48 states and the District of Columbia) is located near Lebanon in Smith County, Kansas, at approximately 39.833º north latitude and 98.583º west longitude.
The center of population as geospatial data
The plotting of the center of population makes for an interesting study of westward expansion in early U.S. history. Once the contiguous 48 states were founded, plotting the center shifts to regional changes . The truly interesting part of these calculations and plotting for the past several centuries falls into an area of expertise called geospatial data.
While some liberties were taken early on using large, populated areas as one data point, we now can count literally every person and their geospatial location. However, it needs to be recognized that early efforts to count our population and track its center every 10 years meets the criteria for being called geospatial data. They just didn’t yet know what that meant.
Speaking of surveyors…
Here are several events and initiatives happening this month, an important month for surveyors.
2022 National Surveyors Week
National Surveyors Week was established by the National Society of Professional Surveyors as an annual event to bring public recognition to the surveying profession and the vital services surveyors provide to the advancement and betterment of human welfare.
During this week, thousands of professional surveyors throughout the country will take part in local activities designed to introduce a new generation to the profession and highlight the use of technology in their day-to-day work.
Global Surveyors’ Day 2022 will be held Monday, March 21. This annual event is a way to globally recognize groundbreakers, pioneers, individuals and the industry that has shaped our history and continues to be of great value to our communities.
2022 Global Surveyor of the Year
Image: NSPS
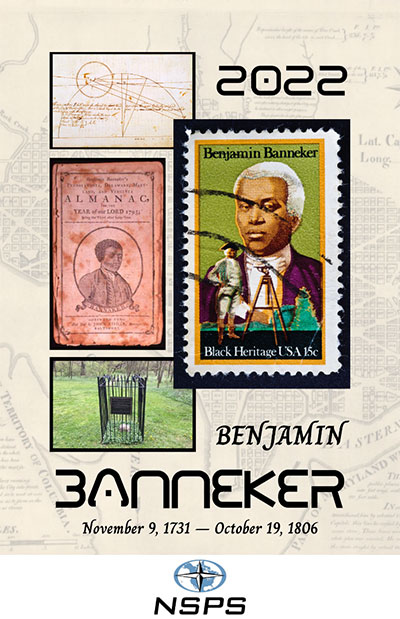
As part of the Global Survey Day and National Surveyors Week, every year on March 21 a professional surveying association is tasked with choosing a Global Surveyor of the Year. For 2022, the National Society of Professional Surveyors has been selected to choose a person with a historical surveying background for this prestigious honor. After thorough consideration, NSPS has chosen Benjamin Banneker (1731–1806) for 2022 Global Surveyor of the Year.
The selection was brought before the NSPS Board of Directors during our Spring 2021 meeting and passed by a majority vote. While Banneker’s career as a surveyor was limited in time and experience, his additional contributions to math, science, astronomy and publication of a groundbreaking almanac have earned him a significant place in American history.
We also selected Banneker because of his ability to overcome the adversity of being a free Black man in early colonial America. Through much self-teaching, he was able to excel at the contributions previously listed in a period when Blacks were not accepted for their educational abilities.
The selection committee chose Banneker over the three presidents who are famously chiseled on Mount Rushmore and Henry David Thoreau, an author who also surveyed to fund his writing career. The committee felt that Banneker’s contributions not just to the surveying profession made him deserving of this honor, but considered his total body of work created when Black men were not generally accepted as capable human beings. Our world needs more people like Benjamin Banneker and would be a better place because of them.
No time like the present to promote our geospatial professions
Surveying and geospatial careers are more important than ever, so examples like the center of population help depict applications that us these skills. Please consider promoting our wonderful professions during these events and throughout the year. The profession you promote may provide an opportunity to bring new faces and ideas to our ranks very soon.
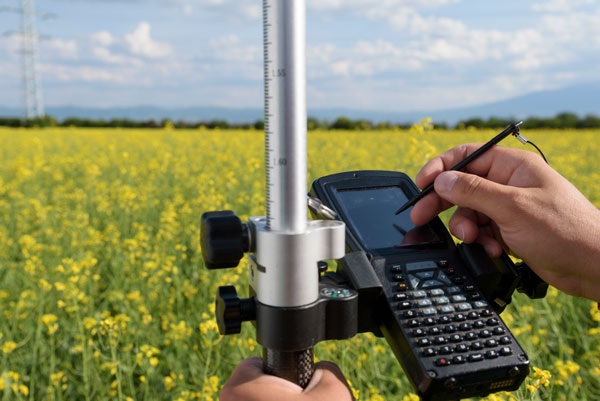
In this issue’s cover, a man with a backpack lidar unit, a GNSS receiver and a tablet computer is surveying in a complex and challenging urban setting. That same lidar unit also can be mounted on a UAV. One of the contributors to this month’s cover story describes the role of aerial photogrammetry in the architecture, engineering and construction (AEC) industry. Satellite navigation, remote sensing, mapping software, a great variety of platforms, and ever more powerful handheld computers — those are the key ingredients in today’s ecosystem of geospatial technologies. The current generation of surveying equipment has more than halved fieldwork in the past two decades while greatly improving the quality of the data collected.
The AEC industry relies on surveyors to be “a bridge between the existing landscape and the design landscape,” said another contributor to our cover story. Unlike traditional boundary surveying, he explained, surveying for AEC requires consideration of a detailed 3D world. It also involves many more stakeholders and much greater liability.
The tight integration of GNSS, inertial systems, lidar sensors and 360° spherical imagery into mobile mapping systems makes 3D modeling possible and traditional GNSS or optical measurement instruments obsolete. However, while inertial systems are invaluable to bridge brief gaps in the availability and reliability of GNSS signals, they are far from the panacea they are sometimes claimed to be, as Brad Parkinson reminds us in an interview with Dana Goward, also in this issue.
Surveying for AEC requires at least centimeter accuracy. The challenges of surveying in urban settings include urban canyons that occult signals and create multipath, traffic and multiple layers of underground, ground-level and above-ground infrastructure.
Beyond the construction phase, 3D survey data is increasingly used to create digital twins of buildings, which facilitate their operation and maintenance throughout their life cycle and help lower their carbon footprint. Once they have completed an initial survey, surveyors often set control to be used for machine control — the theme of our cover story in next month’s issue.
In this issue we also:
• Inaugurate a “letters to the editor” section to make more room for debate in the GNSS/PNT community on the critical issues it faces.
• Report on a Jet Propulsion Laboratory study of the impact on the ionosphere of the enormous volcanic eruption in Tonga and the beginnings of a GNSS-based early warning system for natural hazards.
• Continue our series of articles on GNSS constellations, with an update from Japan’s QZSS constellation.
• Feature three studies: one on real-time simulator testing using an NMEA data stream, one on the first transmission of L1C/B signals by QZSS, and one on self-driving cars in major metropolitan areas.
All these advances, however, are threatened when GPS is threatened. Earlier in the month, three members of our editorial advisory board comment on the recent threat to GPS satellites by the Russian government.
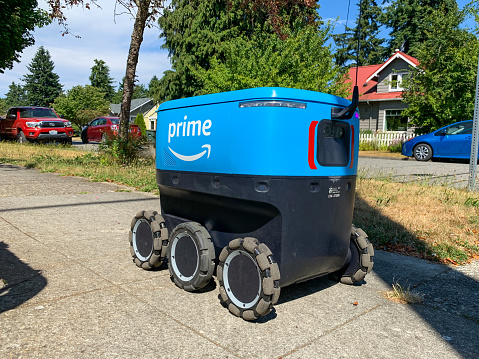
On university and business campuses, getting lunch and dinner is becoming a lot easier as robot delivery units hit the pathways.
If you were a student or faculty member at the University of Wisconsin – Madison campus (UW) during the 2020 COVID lockdown, you might have experienced a novel way to reduce contact with others when ordering a meal. People on campus could avoid a trip to the store and interaction with a delivery person. They could place an order on a special app, and a Starship Technologies robot would pick up and deliver their food.
Of course, for a student, technology that saves a trip to the store, especially anytime of the day or night, would be popular.
From demo to full production
At first, the meal-delivery robots at UW and other campuses were a demonstration to showcase how useful the small bots could be.
But after I soaked up robot-tech news from all over, I learned these little guys have found their way into towns, cities and campuses around the world: specifically, the United States, United Kingdom, Estonia, Germany and Denmark.
With 1,500 bots working every day, the demonstration phase is long over, and Starship robots are full production. Starship, based in San Francisco, has been in operation since 2014. Its robots now make more than 1,000 deliveries each day. They have made more than 2.5 million deliveries to date, and make 100,000 road-crossings each day.
In the United States alone, 16 states have approved delivery robots, including Virginia, Idaho, Wisconsin, Florida, Ohio, Utah, Arizona, Washington and Texas. At UW, three Starship employees manage maintenance and recover units if they get stuck (while autonomous, the bots need help every now and then).
To have a robot come to visit, UW users download the Starship Food Delivery app, select from a local store menu, pay and then indicate on a map exactly where the bot should deliver the order. The robot collects a minimal $2 delivery charge, which goes toward the $2,000 to $3,000 cost of the vehicle and its operation. (According to Starship, each unit costs the equivalent of a high-end laptop.)
The unit uses GNSS and computer vision to navigate detailed, stored maps. The on-site employees take the robots out on particular routes for their first test runs, and the bot learns each route. The on-board system also uses 12 cameras, ultrasonic sensors, radars and neural networks to form a collision-avoidance net around the vehicle. In this way, pedestrians, dogs and road vehicles (when the robots cross a road) can all be avoided.
When waiting to cross a road, the robot’s safety systems might prevent it from moving. In this case, the device will “phone home” for a support person come out and fix the issue.
What could go wrong?
So far, the robots have been welcomed on the university and industry campuses where they operate. People walk round them as they go about their business. Even better, students and other users have pulled the units out of snow mounds and other hang-ups, returning them to the sidewalk or making other small adjustments to send the bots on their way.
And no one has stolen a unit. That could be because a loud siren erupts if they are picked up. Presumably the units are programmed to remain within the bounds of their rigorously mapped environments. In any event, the food compartment remains locked until the order is removed by the customer.
Disrupting Doordash
Will robots disrupt today’s car-based delivery services, such as UberEats, Grubhub or DoorDash? Only for the last-mile section of a delivery. In a pinch, Starship robots can travel as far as three miles from their base. As the bots take on more territory, the auto-based delivery companies may be pushed toward the longer routes.
Deliveries such as time-sensitive medical materials could benefit from robotic short-distance, small-package carriers. Other robot delivery services, including Amazon Scout and Roxo, the FedEX SameDay Bot, are also making waves as testing progresses toward last-mile delivery automation from warehouse hubs to customer homes.
Federal, state and local laws may need to be enhanced to allow these autonomous delivery robots to progress toward widespread deployment.
One selling point: Fast robot deliveries lead to fewer delivery trucks, reducing traffic congestion and lowering exhaust pollution. We might have to wait awhile to realize these benefits.
Photo: Stanislav Ostranitsa/iStock/Getty Images Plus/Getty Images
Is Russia’s recent threat to destroy GPS satellites technically realistic? Specifically, how many satellites would it have to destroy to essentially incapacitate GPS-dependent U.S. weapons systems? Would the 1,100-km separation between the orbits of GPS and GLONASS satellites spare the latter from the debris field?
Ellen Hall
“It appears technically possible because they destroyed one of their own retired Soviet satellites on Nov. 15 with anti-satellite technology. Russia threatened to destroy up to 32 satellites, which would incapacitate GPS-dependent weapons and create a virtual mine field of debris with little ability to project trajectories of debris fallout. It is imperative that LEO and ground-based sensor alternatives be developed that will make an enemy attack less likely to be incapacitating.” — Ellen Hall, Spirent Federal Systems
“Some still appear to believe that the number of satellites and their orbital height offer some level of protection. They refuse to look to the ground for resilient solutions using proven and highly reliable technology — which, coincidently, both Russia and China continue to operate as their resilient PNT solutions. The United States and its allies cannot continue to be dictated to by financial analysts who resist these solutions for fear of exposing the poor decisions they supported in the past and continue to support regarding a solution with a higher power and low frequency.” — Mitch Narins, consultant
Bernard Gruber
“Yes, it is technically realistic, but this act of war against a truly worldwide utility would be politically and economically disastrous. GPS IOC was based upon 24 MEO satellites that offered full, but not overlapping, worldwide coverage with spares — there are now 31 satellites that can be utilized through the control segment. The GPS constellation is ~1,100-km deeper than GLONASS. As made evident by the now-destroyed Kosmos 1408 debris cloud simulations, and the actual debris cloud spread by the Chinese 2007 ASAT test that now encompasses most of the LEO regime, the debris field will expand, thus increasing risk to GPS satellite placement and possibly risking physical damage to currently orbited satellites.” — Bernie Gruber, Northrop Grumman
It’s the beginning of 2022 and the new, modernized NSRS is only about three years away. Hopefully, everyone has been reading NGS’s blueprint documents updated during 2021, and participating in NGS’s webinar series. Together, they provide the latest information about the changes from the existing NSRS to the new NSRS.
My previous columns highlighted many aspects of the new geometric reference frame and geopotential datum. In this month’s column, I will highlight the time-dependent aspect of the modernized NSRS and why it is necessary for the new system.
As I stated before, NOAA’s National Geodetic Survey (NGS) is developing models and tools for users to be able to transform coordinates between the four national terrestrial reference frames and the International Terrestrial Reference Frame, the Geopotential Datum and the North American Vertical Datum of 1988 (NAVD 88), as well as estimate coordinates at epochs different from the survey observation epoch by accounting for movement.
What does NGS mean by estimate coordinates at epochs different from the survey epoch, and why is it necessary to account for movement for the new, modernized NSRS? This column will address these issues.
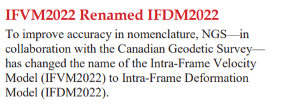
NGS’s January 2022 (Issue 27) edition of NSRS Modernization News announced a paper about the modernized NSRS and a change in name to the Intra-Frame Velocity Model (IFVM). See the box below. Users can sign up for these newsletters here, and can obtain access to previous newsletters here.
The Latest Issue of
NSRS Modernization News
Image from GovDelivery Communications Cloud on behalf of NOAA’s National Ocean Service.
The new paper was published in October 2021 and is titled “The Mathematical Relation between IFVM2022 as Expressed in ITRF2020 with IFVM2022 as Expressed in the Four Terrestrial Reference Frames of the Modernized NSRS with Dependence on EPP2022.” It can be downloaded here.
The paper describes the mathematical relationship between the Intra-Frame Velocity Model (IFVM2022) and the Euler Pole Parameters (EPP2022).
The NSRS Modernization News announcement states that the IFVM2022 name has been changed to the Intra-Frame Deformation Model (IFDM2022). The latest version of blueprint 1 and the October 2021 (NOS NGS 90) report were published before the name changes, so they refer to IFVM2022 instead of IFDM2022.
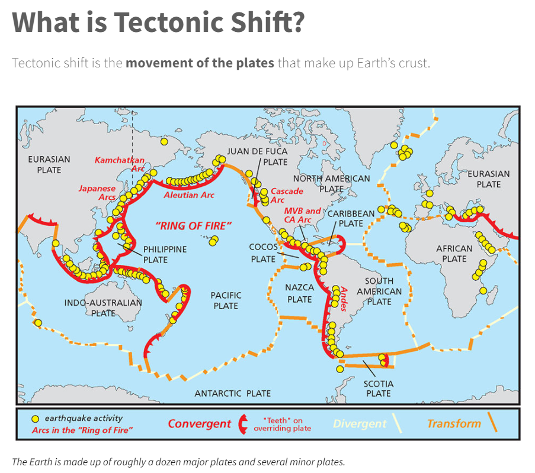
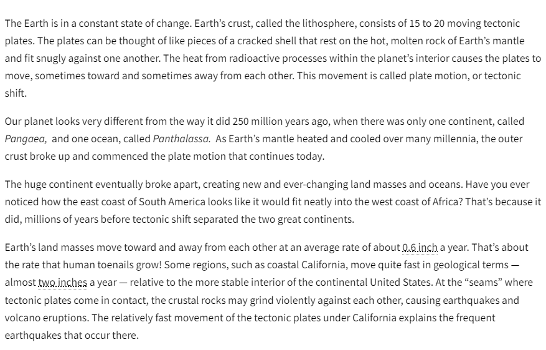
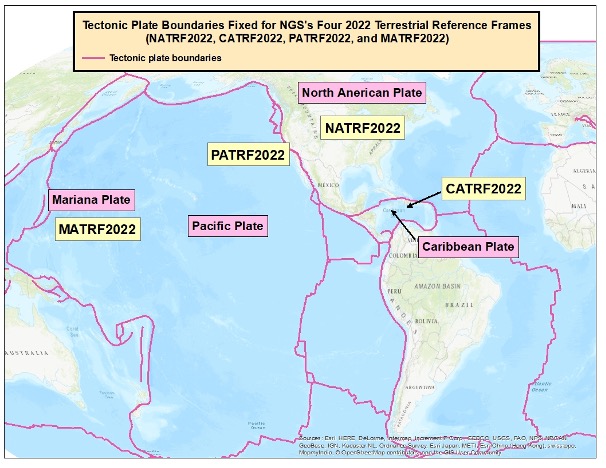
Why is it necessary to account for movement? Coordinates basically change because the Earth’s surface is moving due to the movement of major tectonic plates. See the box below for information about why it is called plate movement or tectonic shift. NGS understands this and is attempting to manage the changing coordinates by providing a time-dependent component.
Image: National Ocean Service websiteScreenshot: NOAA Website
NGS will be defining the following four geometric terrestrial reference frames that are based on the tectonic plates (see map below):
North American Terrestrial Reference Frame of 2022 (NATRF2022)
Pacific Terrestrial Reference Frame of 2022 (PATRF2022)
Caribbean Terrestrial Reference Frame of 2022 (CATRF2022)
Mariana Terrestrial Reference Frame of 2022 (MATRF2022)
Four Tectonic Plates Part of NGS’s New NSRS
Image: Dave Zilkoski
As previously stated, NGS is developing models and tools for users to be able to transform coordinates between the four national frames and the International Terrestrial Reference Frame, as well as estimate coordinates at epochs different from the survey observation epoch by accounting for movement. These models are denoted as EPP2022 and IFDM2022.
So, what are EPP2022 and IFDM2022? And what does this mean to surveyors and mappers?
EPP stands for Euler pole parameters (a way of describing a plate’s rotation) and IFDM2022 is a way of computing the drift in coordinates.
Why Euler Pole? See the box titled “Who was Euler?”
Who was Euler?
Leonhard Euler was a Swiss who lived in the 1700s. He was one of the greatest mathematicians that ever lived and has been called the greatest mathematician of the 18th century. He founded the studies of graph theory and topology, and made pioneering and influential discoveries in many other branches of mathematics such as infinitesimal calculus. He introduced a lot of modern mathematical terminology and notation, including the notion of a mathematical function. He is also known for his work in mechanics, fluid dynamics, optics, astronomy and music theory.
The definition of Euler’s fixed point theorem states that any motion of a rigid body on the surface of a sphere may be represented as a rotation about an appropriately chosen rotation pole, called a Euler pole. This theorem has been used by geologists to understand and describe the motions of tectonic plates.
NGS’s 2021 revised Blueprint 1, NOAA Technical Report NOS NGS 62, Blueprint for the Modernized NSRS, Part 1: Geometric Coordinates and Terrestrial Reference Frames provides an explanation of Euler poles and “plate-fixed” frames. As stated in the “Who was Euler?” box, the definition of Euler’s fixed-point theorem states that any motion of a rigid body on the surface of a sphere may be represented as a rotation about an appropriately chosen rotation pole, called a Euler pole. The following is stated in the NOS NGS 62 report under “Plate-Fixed Frames and Euler Poles,” section 4:
When considering only the rigid (not deforming) part of a tectonic plate, the horizontal motion of the plate (relative to a global plate-independent reference frame, like the ITRF) can be modeled as a rotation about a geocentric axis passing through a fixed point on Earth’s surface. Although such models must make certain assumptions (such as the rigidity of the plate), the dominant motion of the majority of points on most tectonic plates is the rotation about a fixed point. That point is known as an “Euler pole.”
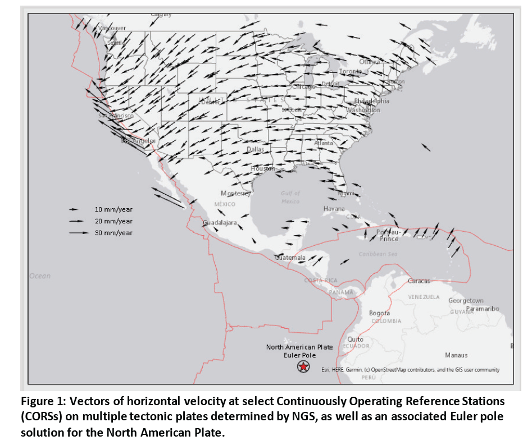
What is important to know is that the determination of a plate’s Euler pole location and the angular velocity with which the plate rotates can be empirically determined using GNSS observations from a CORS network distributed throughout the plate. Figure 1 from the NOS NGS 62 report provides a plot of the North American plate Euler pole and the vectors of the horizontal velocities at select CORS (see the box titled “Figure 1 from NOS NGS 62”).
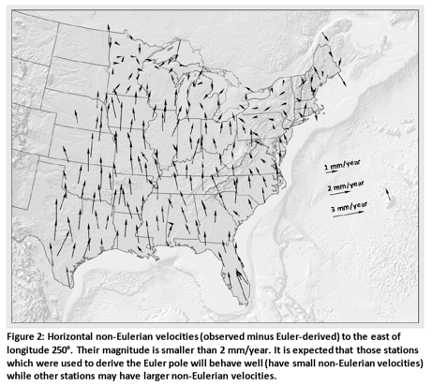
Every place on Earth is moving. That includes neighboring marks on the same tectonic plate. What this means is that after the Eulerian motions are removed, the remaining motions left over change the relative differences in coordinates of neighboring marks located on the same tectonic plate. Figures 2 and 3 from the NOS NGS 62 report provide plots of estimates of these remaining velocities (see the boxes titled “Figure 2 from NOS NGS 62” and “Figure 3 from NOS NGS 62.”)
Figure 2 is a plot of the non-Eulerian motions east of 110° west longitudes. As stated in the report, most of the velocities are less than 2 mm/year. The concept is that the EPP2022 and IVDM2022 models will remove the Eulerian and non-Eulerian movement of the marks.
Figure 2 from NOS NGS 62
Image: NGS website
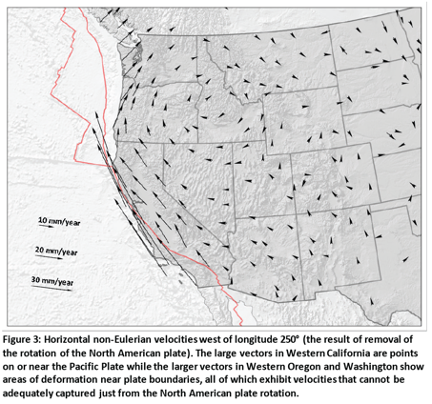
Figure 3 is a plot of non-Eulerian vectors west of 110° west longitude. As indicated in the plot, the large vectors in Western California, Western Oregon and Western Washington show areas of deformation near plate boundaries that don’t appear to be adequately captured just from the North American plate rotation.
Figure 3 from NOS NGS 62
Image: NGS website
It should be noted that the size of the vectors on Figures 2 and 3 depict a different magnitude of movement. Figure 2 depicts vectors at 1-3 mm/year and Figure 3 depicts movement at 10-30 mm/year.
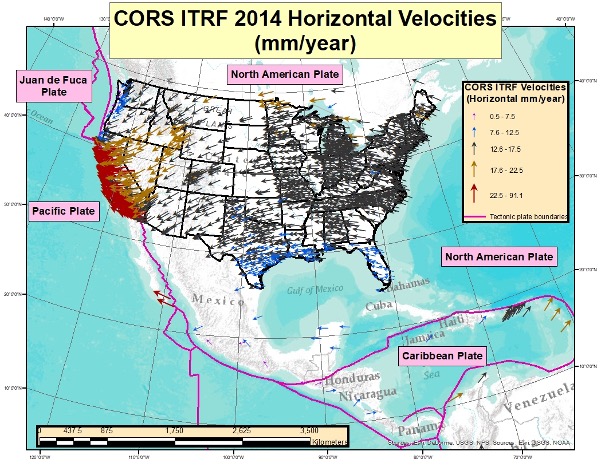
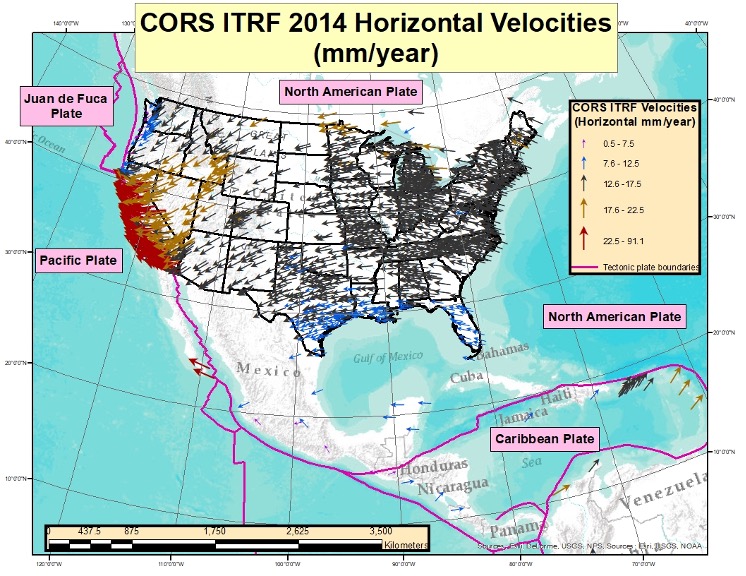
To better visualize the potential size of the movement, I downloaded the CORS ITRF2014 coordinates and velocities from NGS’s website and compiled the results. See the boxes titled “CORS ITRF 2014 Horizontal Velocities” and “Table of ITRF 2014 Horizontal and Upward Velocities of U.S. CORSs.”
Computed Velocities Only (Downloaded Jan. 13, 2022)
Image: Dave Zilkoski
The box titled “CORS ITRF 2014 Horizontal Velocities” provides the horizontal vectors based on NGS’s file downloaded on Jan.13. Only CORSs designated as operational and computed velocities were included in the plot.
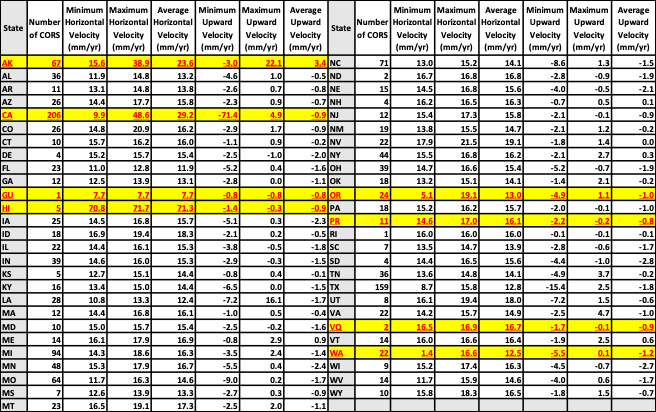
I have also created a table that includes a summary of the ITRF rates for CORS labeled as part of the United States. The table includes the following information for each State and Territory of the United States:
Number of CORS
Minimum Horizontal Velocity (mm/year)
Maximum Horizontal Velocity (mm/year)
Average Horizontal Velocity (mm/year)
Minimum Upward Velocity (mm/year
Maximum Upward Velocity (mm/year),
Average Upward Velocity (mm/year).
See the table below.
Table of ITRF 2014 Horizontal and Upward Velocities of U.S. CORSs
Computed Velocities Only (Downloaded Jan. 13, 2022)
Highlighted territories are not on the North American plate (GU, HI, PR, and VQ), and highlighted states are partly inside or close to the boundary of the North American plate and another tectonic plate (AK, CA, OR, WA).
The highlighted territories in the table are not on the North American plate (GU, HI, PR and VQ), and the highlighted states are partly inside or close to the boundary of the North American plate (CA, OR, WA). This is one of the reasons why their minimum and maximum horizontal velocity values are different from most of the other states’ values.
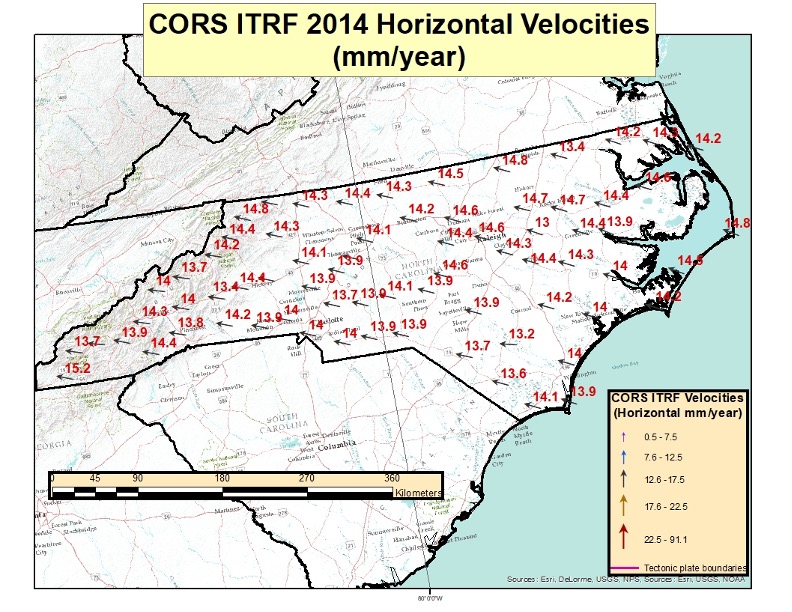
To visualize the relative differences in horizontal velocities between neighboring CORSs, I plotted the ITRF 2014 Horizontal Velocities for CORSs located in North Carolina (see the box titled “CORS ITRF 2014 Horizontal Velocities in North Carolina”). Looking at the figure, it’s obvious that all of the velocities are around 14 mm/year and moving in the same direction.
CORS ITRF 2014 Horizontal Velocities in North Carolina
Computed Velocities Only (Downloaded Jan. 13, 2022)
Screenshot: Dave Zilkoski
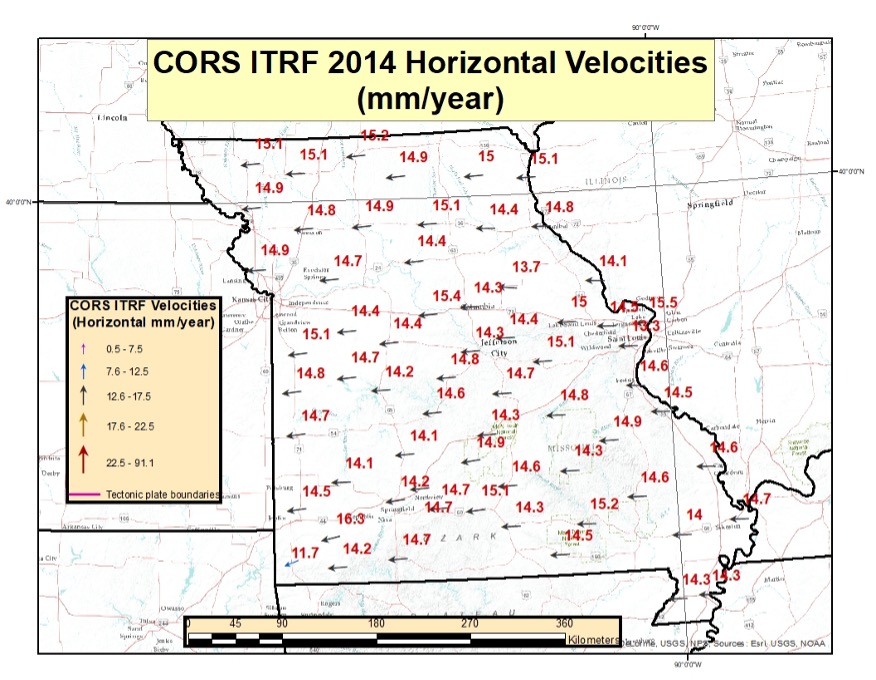
I plotted the horizontal velocities for Missouri to provide an example of the velocities in the central region of the conterminous United States. The magnitude of the velocities is similar to that for North Carolina, but the direction of the vector is slightly different. North Carolina’s average horizontal velocity is 14.1 mm/year and Missouri’s average horizontal velocity is 14.6 mm/year.
CORS ITRF 2014 Horizontal Velocities in Missouri
Computed Velocities Only (Downloaded Jan. 13, 2022)
Image: Dave Zilkoski
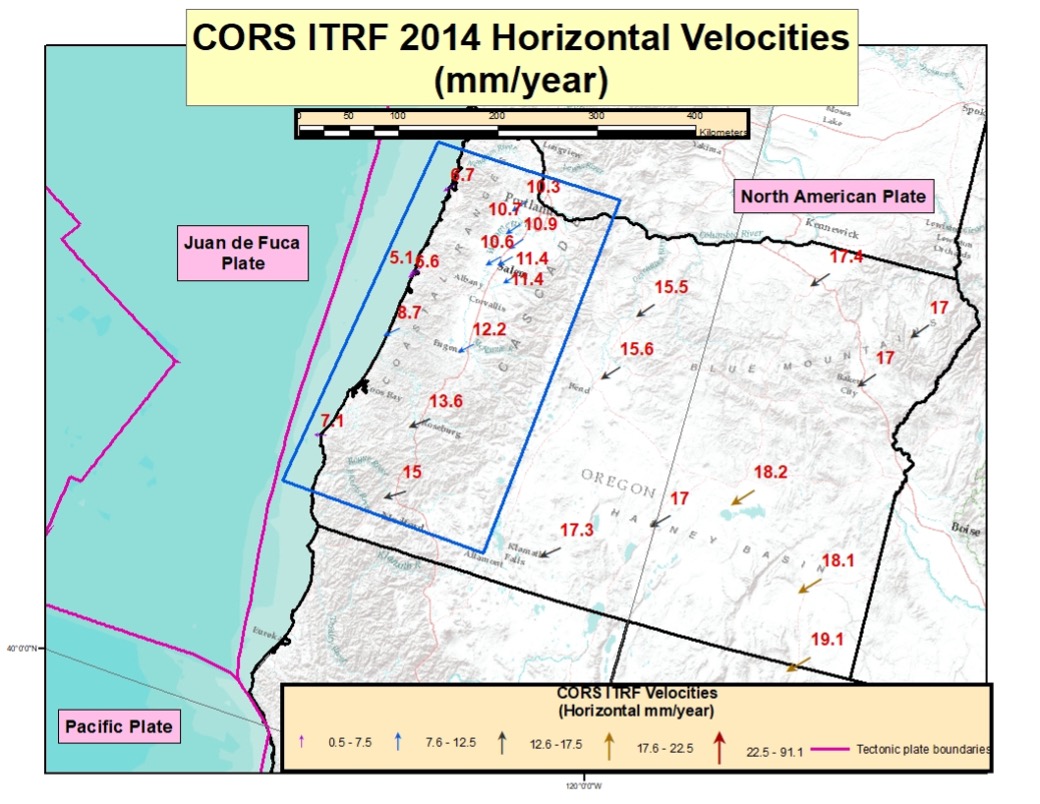
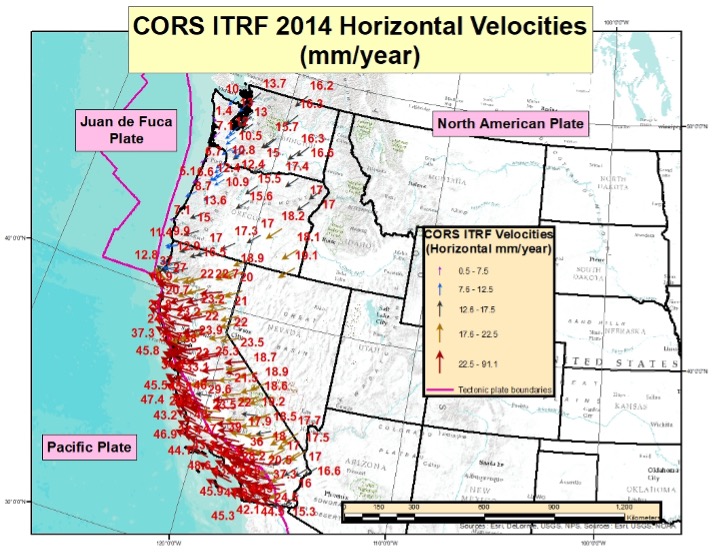
To emphasize the differences along the boundaries of the tectonic plates, I’ve included a plot of the CORS ITRF 2014 horizontal velocities for the State of Oregon and a plot of the states along the West Coast of the United States. See the boxes titled “CORS ITRF 2014 Horizontal Velocities in Oregon” and “CORS ITRF 2014 Horizontal Velocities Along West Coast of CONUS.” As indicated in the plot, there are significant changes in horizontal velocities near the Oregon coast. The values decreased by about 10 mm/year from the inland CORS to the CORS along the coast.
CORS ITRF 2014 Horizontal Velocities in Oregon
Computed Velocities Only (Downloaded Jan. 13, 2022)
Image: Dave Zilkoski
The plot of the CORS ITRF 2014 Horizontal Velocities Along West Coast of CONUS clearly indicates the change in magnitude the closer the CORS are to the Pacific and Juan de Fuca plates.
CORS ITRF 2014 Horizontal Velocities Along West Coast of CONUS
Computed Velocities Only (Downloaded Jan. 13, 2022)
Image: Dave Zilkoski
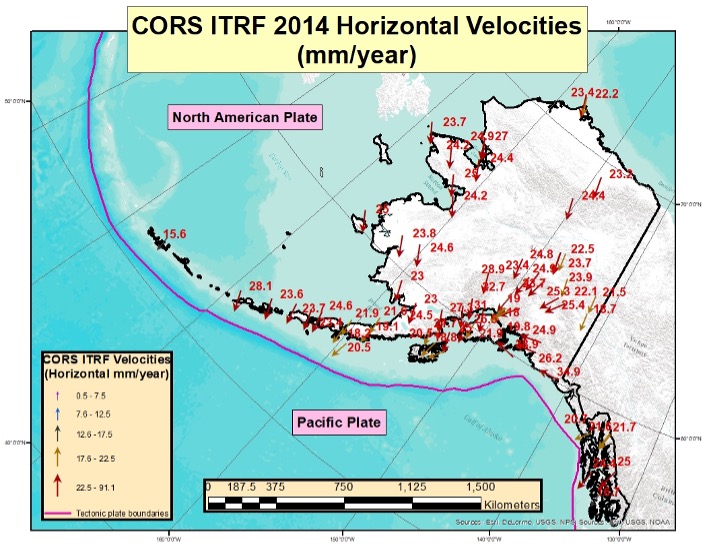
For completeness, I’ve also included a plot of the horizontal velocities for Alaska.
CORS ITRF 2014 Horizontal Velocities in Alaska
Computed Velocities Only (Downloaded Jan. 13, 2022)
Image: Dave Zilkoski
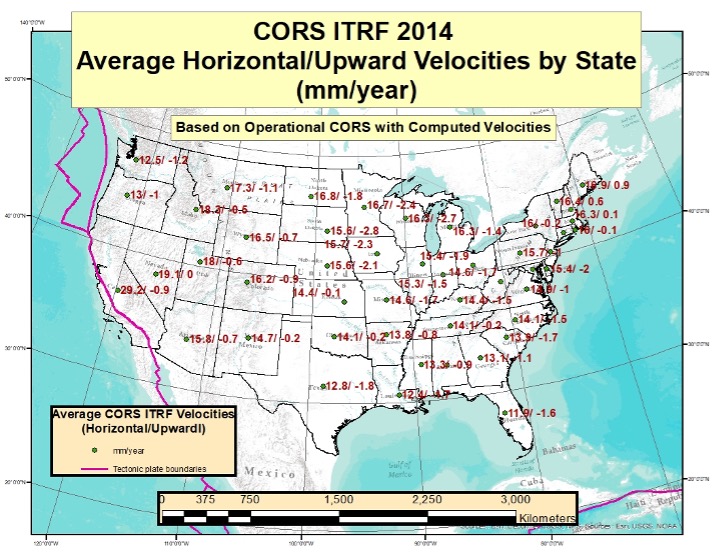
To better visualize the horizontal and upward velocities of CORS among states, I plotted the average horizontal and upward velocity value for each state based on that states’ CORS. See the box titled “Average Velocities by State.”
Average Velocities by State
Image: Dave Zilkoski
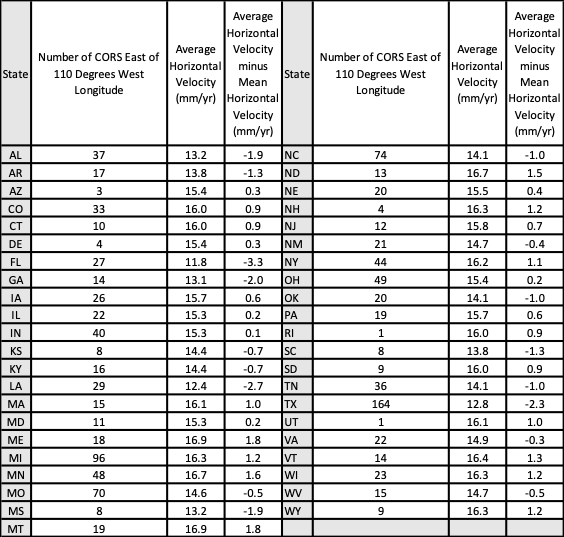
I also computed an average horizontal velocity value based on CONUS CORS east of 110° west longitude (denoted here as a regional horizontal velocity value). [I used the CORSs east of 110° west longitude to be consistent with NGS’s Figure 2 in NOS NGS 62.]
The box below summarizes the average horizontal motion for each state. The table provides:
The Number of CORS East of 110° West Longitude
Average Horizontal Velocity (mm/year)
Average Horizontal Velocity minus Regional Horizontal Velocity (mm/year).
This provides an estimate of the variation of the relative horizontal motion between States.
Table of ITRF 2014 Horizontal Velocities minus Regional Velocity of U.S. CORS East of 110° West Longitude
Table only includes CORS East of 110° West Longitude (Image: Dave Zilkoski)
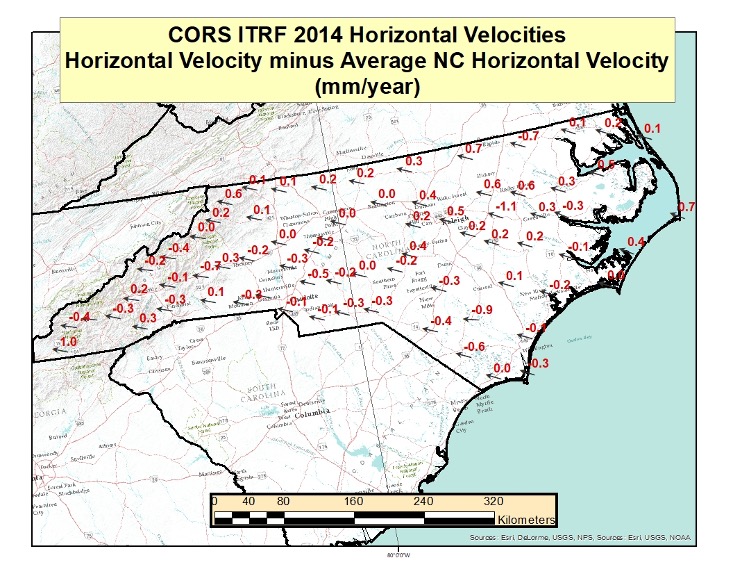
The box titled “Horizontal Velocities in NC Minus Average Velocity” depicts the resulting horizontal velocities with an average velocity removed (the average velocity was based on NC CORS only) for all CORS in North Carolina. As one can see from the plot, most of the resulting horizontal velocities are less than 1 mm/year, but they are still not zero. Once again, this is only meant to provide an idea of the size of the relative vectors between CORS in North Carolina.
As indicated in the NOS NGS 62 report, these horizontal velocities will be small, but they will not be zero. Hence the reason that NGS needs to provide models and tools for users to be able to transform coordinates between the four national frames (NATRF, PATRF, CATRF and MATRF) and the International Terrestrial Reference Frame (ITRF), as well as to estimate coordinates at epochs different from the survey observation epoch by accounting for movement within the reference frame. Surveyors in California have been dealing with these types of movements for many years now.
Horizontal Velocities in NC Minus Average Velocity
(Downloaded Jan. 13, 2022)
Image: Dave Zilkoski
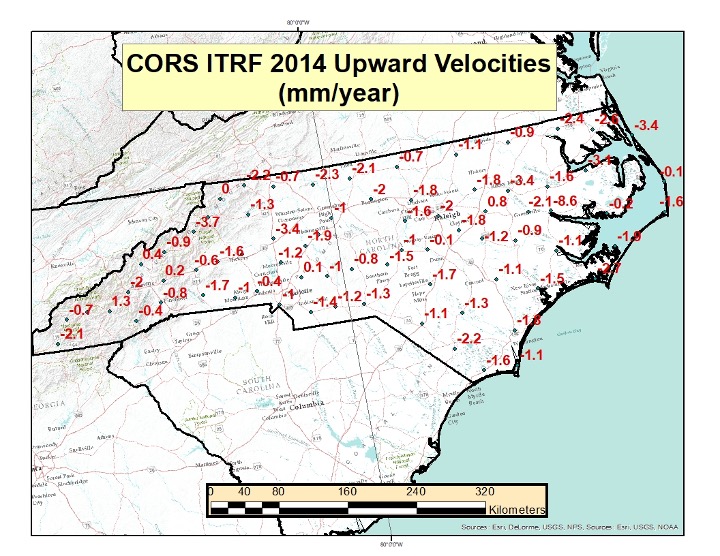
I plotted the ITRF 2014 upward velocity values of the CORS in North Carolina to depict an estimate of the vertical movement of the CORS in North Carolina. See the box below. The vertical velocities values are much less than the horizontal velocities, but they still are not zero. A future column will address the upward velocities based on the ITRF 2014 rates and crustal movement models.
CORS ITRF 2014 Upward Velocities in North Carolina
(Downloaded Jan. 13, 2022)
Image: Dave Zilkoski
This column explained why it is important to account for movement of marks everywhere and not just in areas influenced by active crustal movement due to earthquakes such as in Southern California. It provided information about the CORS rates of movement based on NGS’s ITRF2014 coordinates and velocity information. It highlighted NGS’s reports that describe models that will facilitate users transferring coordinates between reference frames and dealing with intra-frame movement between marks based on survey performed at different epochs. This is not just a horizontal positioning issue.
A future column will address estimates of vertical velocities in the new, modernized NSRS.
View from a weather balloon at 100,000 feet. (Photo: NOAA)
“We’re at 103,000 feet. As you look up the sky looks beautiful but hostile. …Can see for over 400 miles. The sky [above me] is absolutely black. …I can see the beautiful …deep, dark, indescribable blue [sky below], which no artist can ever duplicate. It’s fantastic.”
— Capt. Joseph W Kittinger, USAF, Operation Excelsior III, August 16, 1960
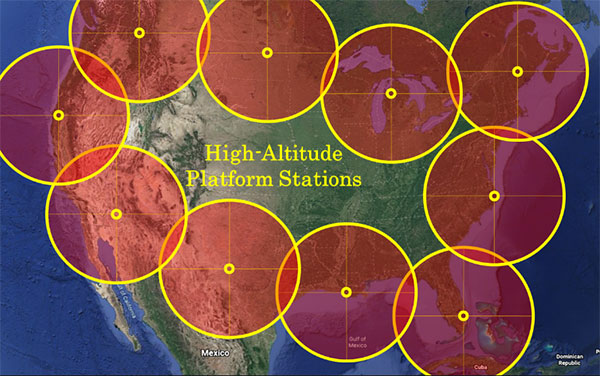
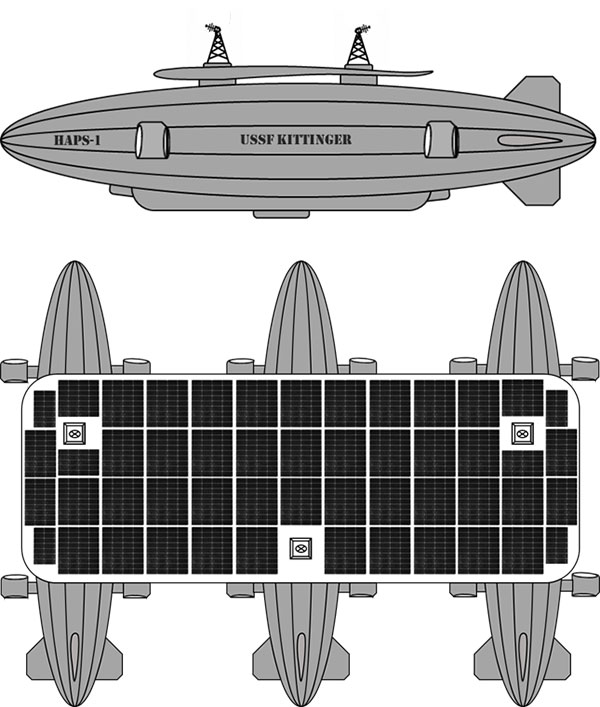
This month, our journey begins in the future. Imagine you are in Alamogordo, New Mexico, a town with a rich history in America’s space program. You are here for a proof-of-concept, real-world exercise. After two years spent training, you are on a team that will test the viability of a stratospheric airframe, or high-altitude platform station (HAPS).
The exercise is a joint venture between several large corporations and U.S. government agencies. The HAPS began as a telecommunications support platform, but now includes many different industries. It will test backup systems for GPS and other sensing technologies.
Remote sensing is an obvious use case, and sensors are onboard to collect hyperspectral and thermal images, synthetic aperture radar, lidar, magnetometry, weather and other types of data. Some equipment is mounted on top of the platform to point toward space to monitor satellites and orbital debris. Also aboard are are satellite relays and space-based communications systems. Additionally, a Hubble-like observatory will support NASA research.
On the ground at the command center, other teams are working on the project. A mapping and survey team is in the field to ground truth the precision, accuracy and resolution of the HAPS data.
Autonomous vehicle manufacturers are testing telemetry data from the HAPS for improved precision navigation. Teams of imagery analysts and geospatial analysts are assessing the quality and value of the products, including full-motion video live-streamed from the HAPS.
Aerospace engineers are studying the performance of the airframe and monitoring its structural integrity. Meteorologists are providing upper air wind and weather forecasts. Several teams of engineers are managing various robotics systems onboard, and more scientists and engineers from multiple companies and agencies are testing their equipment.
The solar-powered Helios in flight. (Photo: NASA/Aerovironment)
Your Mission as a Stratonaut
Most tests and modifications are being handled remotely, but some require replacing the systems. This can only be accomplished by physically going to the sub-orbital station. Imagine this is your job.
You are a remote sensing technician specially designated as a stratonaut. Your training familiarized you with the various systems onboard. You trained how to use your pressure suit — its dangers, risks and capabilities — and how to interface with the suit’s augmented reality system. You know how the HAPS operates, its schematics, and the interiors of the three connected dirigibles. You can navigate your way around the HAPS and access the various decks and compartments as well as the sensors, equipment, charging ports, fuel cells and motors. You can fly the drones, dock with the station, and enter its hangar bays. You can do maintenance on the autonomous robots and the remote-controlled robots onboard the station. You know the security and safety protocols. All this you know and more; and, if things go wrong, you know what to do.
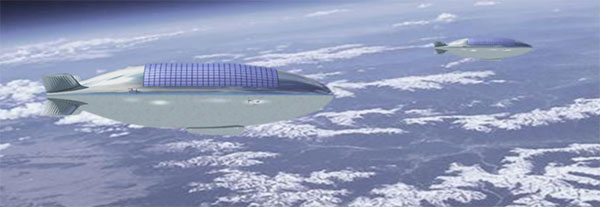
Vision of the Alpha, Bravo and Charlie HAPS stations. (Image: William Tewelow)
On this mission day, it’s early morning. Sunlight is beginning to pierce the sky above the Alamogordo base station. Two technicians are helping you into your pressure suit. Another technician at a desk has your helmet hooked up to the computer. The LED lights encircling the facemask blink slowly, indicating data is being uploaded. The augmented reality face shield glows a soft blue as the data flashes across it.
Overnight at the command center, operators controlled descent of the HAPS from 100,000 feet. It takes 10 hours to reach 65,000 feet, the altitude for your rendezvous with the station. You will fly up to the HAPS in a cargo delivery drone and dock at the forward hangar bay of Station Bravo (the second dirigible). You’ll be installing an enhanced high-resolution hyperspectral sensor array in the station’s lower observation deck.
While you are busy with the installation, the autonomous robot onboard will be in the hangar bay, swapping out the station’s spent fuel cells with fresh ones carried up by the cargo drone. Each weighs 250-pounds. After this task, the cargo drone will fly to Stations Alpha and Charlie and swap out their spent fuel cells.
Once all three are completed, the cargo drone will return to Station Bravo and take you to the top of Station Charlie to install a satellite laser relay (SLR) communications system. A remote-controlled robot operated by the engineering team at base command will meet you and carry the SLR up to the tower. While you are installing the SLR, the cargo drone will dock and recharge for your return trip. The entire mission will take seven-hours and 45 minutes.
“Many functions currently done with satellites could be performed for tactical and operational commanders using near-space assets, much more cheaply and with much greater operational utility. By operationally grouping near-space with space, the functional expertise synergies would allow much more efficient delivery of space effects to the joint commander.”
— Lt. Col. Edward B. Tomme, Ph.D., USAF, Air Power Research Institute
Two Types of Pseudolites
High-altitude, long-endurance (HALE) airframes — also referred to as pseudo-satellites, pseudolites and stratolites — are of two types.
Heavier than air. The heavier-than-air (HTA) type is a lightweight, fixed-wing aircraft with extremely long wingspans. It can stay aloft for a month or more.
HTAs are limited to carrying small payloads. They typically rise to 100,000 feet during the day powered by their solar cells, and at night descend to 60,000 feet, repeating this cycle until the batteries need replacing. The HTA platform is good for short-term missions over a broad area of interest because it normally flies in large circular patterns.
Lighter than air. The other type of pseudo-satellite is a lighter-than-air (LTA) airframe. The typical example is a dirigible, but these platforms can take on many shapes and sizes. LTAs can be enormous, with lifting capacities upward of 100,000 pounds. They operate as geostationary platforms loitering indefinitely over an area of interest and remain at the same altitude day and night. An LTA can last for 10 years or more.
The best solution is a combination of the two. A large LTA can serve as a base station to support several small HTA platforms.
“Together, NASA and the Space Force seek to advance, protect and sustain activities in, from and to space. This is truly a new era of strategic collaboration that will benefit commercial, civil and national security in space.”
— John W. Raymond, General, Chief of Space Operations, United States Space Force
A stratosphere-based telecommunications platform proposed by the Elefante Group. (Image: FCC)
HAPS Alliance
Furthering the development of the pseudo-satellite industry is a consortium of 49 companies and universities called the HAPS Alliance, which advocates for investment in this area.
The stratosphere has become increasingly important for commercial interests and national security. HAPS can provide the best of what manned aircraft operating at lower altitudes can offer, combined with the benefits of satellites, minus much of the downside of each.
Limits of aircraft. Aircraft operating at lower altitudes offer high resolutions and targeted collection. They can be easily retasked and rerouted, and equipment can be easily repaired or replaced. Aircraft are limited by constraints of time, fuel, weight, distance and weather.
Limits of satellites. Satellites, on the other hand, provide broad area coverage and long-term, operational endurance, but they are 240 miles or more above the Earth traveling at 17,500 miles per hour, or they are 18,000 miles above the Earth to maintain a geostationary orbit. It is a trade-off between resolution and dwell time.
Other drawbacks of satellites are their expense. Launching is costly and recovery is nearly impossible to make repairs. Doing so is impractical.
HAPS do not have those limitations. They can provide long-term, persistent operations over an area of interest at very high resolutions. They also can carry a complete package of sensors and equipment with the additional benefit that most everything can be repaired or replaced with minimal cost.
Locations of HAPS to cover the borders of the Continental United States. (Image: William Tewelow)
How HAPS Will Improve Geospatial Data
These systems are going to improve geospatial information. HAPS will improve spectral resolutions by a factor of 10x or better. The improved location accuracy data will impact navigation, surveying, construction, emergency services, logistics, transportation, aviation, agriculture and most other industries.
The HAPS will act in tandem with cellular networks on the ground to improve internet connectivity and telecommunications. They will improve national security while monitoring the effects of climate change, deforestation, urban sprawl, ozone, pollution and natural disasters such as floods, forest fires, tornadoes, hurricanes and more.
Provided testing proves HAPS a success, the pseudosatellite era is going to greatly impact most everyone’s life. If you are lucky, you might actually become a stratonaut. If you are interested, now is the time to prepare.
“This point of observation commands an area nearly 50 miles in diameter. The city, with its girdle of encampments, presents a superb scene. I have pleasure in sending you this first dispatch ever telegraphed from an aerial station.”
— Thaddeus S. C. Lowe, First Chief Aeronaut, Union Army Balloon Corps, Civil War, 1861
William Tewelow
William Tewelow is a Senior Aeronautical Information Specialist for the Federal Aviation Administration. He is a designated Geographic Information Systems Professionals (GISP). He served on special assignment to the U.S. Department of Transportation and led a national strategic geospatial initiative under the authority of the White House Open Data Partnership. He was among the first in the nation to earn a Geospatial Specialist Certification from the U.S. Department of Labor while working at NASA Stennis Space Center.
He is a 2016 graduate of the FAA’s management fellowship Program for Emerging Leaders. He has degrees in Geographic Information Technology and Intelligence Studies and is earning a master’s degree in Organizational Leadership with a focus on Performance Management. He is a mentor with the FAA’s National Mentor Program.
Tewelow retired from the U.S. Navy after serving 23 years as a Geospatial and Imagery Intelligence Specialist, a Naval Aviator, a Meteorologist, and a Tactical Oceanographer earning three achievement medals. He is married, enjoys traveling, connecting people, solving problems, and interested in new technology. His favorite quote is, “A man’s mind changed by a new idea can never go back to its original dimension.” ~ Oliver Wendell Holmes
A PNT expert suggested that my piece titled “Opposite and Complementary: eLoran is part of the solution to GNSS vulnerability” in our November 2021 issue could be augmented with information not currently available on the proposed eLoran capability. This expert also questioned my statement that eLoran “does not have any common failure modes with GNSS” and pointed to potential common threats such as from cyberattacks, physical attacks, and space weather.
Matteo Luccio
I welcome such feedback on the contents of these pages — and agree that in this case some hard questions are warranted. So, in the interest of further exploring the use of eLoran, I pose some questions, hoping that its advocates will provide answers. I know that at least some of them will not shy away from this challenge.
Please note that I wish to keep the discussion on positioning, not the easier question of timing, because that was the primary focus of my article. I also wish to address long-term outages (weeks or months), which would have a greater impact on the United States.
Some of these questions have been addressed, at least in part, in various studies and proposals, most of them now more than a decade old. So, it would be helpful to update those answers and consolidate them in the pages of this magazine.
1. Accuracy specifics. While my November article stated that eLoran would have a two-dimensional accuracy of “better than 20 meters, and in many cases, better than 10 meters,” is that RMS, 95%, or some other statistic?
2. Performance standard. GPS provides a commitment to users in a published performance standard. What specific measures of positioning accuracy, integrity and continuity would you recommend the proposed eLoran system be committed to provide (using the architecture described in the answer to Question 6)?
3. Coverage. Would you recommend this eLoran positioning performance hold for the entire United States (including Alaska, Hawaii, Puerto Rico and other territories), only for the “lower 48” states, or only parts of these 48 states?
4. Current users. By number of users, the predominant common current civil uses of GNSS for positioning are consumer devices (mostly cellphones). By contribution to the U.S. economy, the predominant uses are high-precision applications. For what fraction of these uses would eLoran positioning be adequate? Could an eLoran receiver and antenna fit in today’s consumer devices?
5. Future uses. Emerging civil uses of GPS for positioning include autonomous ground and air vehicles, navigation to space and in space, and lane-accurate car navigation. Which of these could be served by eLoran?
6. Architecture. To maintain accuracy during a prolonged GPS outage, eLoran would require reference stations to calibrate time-varying propagation errors, as well as a certain number of transmitters for good nationwide geometry and for redundancy, ensuring service even if a transmitter is attacked or is taken off-line for maintenance. What architecture would you recommend to achieve this?
7. Infrastructure cost. What would be the cost of installing the required transmitters, power supplies, reference stations, communication links and control system for the architecture described in the answer to Question 6? Can you reference a recent and independent estimate? To a ballpark figure, what cost fixed-price contract would you accept to implement it? Similarly, what would be the annual costs for operating and maintaining this infrastructure?
8. Impact. eLoran transmitters are large and high-power. Providing positioning across the United States could require building some of them from scratch or significantly reconstructing old Loran sites. What issues — such as environmental, aviation safety and security — would this raise, and how would you recommend they be addressed?
9. Receivers. Assuming all the above were achieved, it would accomplish nothing unless eLoran receivers were widely purchased, installed and used. How much would that cost? Who would pay? Should we assume that “if we build it, they will come”?
10. Alternatives. Given the widespread development of other positioning technologies over the past decade, much has changed since the earlier recommendations for eLoran. How do we know that eLoran is the right investment — or even a needed part of the solution or needed system in a system of systems — for the future of U.S. PNT?
Common threats to GNSS and eLoran could include the following:
1. Cyber attacks. Given that GPS’s OCX is said to be the most cybersecure system built by the U.S. Department of Defense, how would eLoran’s control system be even more cybersecure than OCX, to avoid a common cyber-vulnerability?
2. Physical attacks. Given concerns about possible physical attacks on GPS satellites, which move at multiple km/sec 20,000 km from Earth, would it not be easier to physically attack eLoran transmitters, which are stationary, terrestrial, in remote locations, and hundreds of feet tall and require massive power sources?
3. Space weather. GPS is potentially vulnerable to severe space weather that could damage satellites or temporarily hinder signal propagation from space to Earth. However, severe space weather could also damage the power grid upon which megawatt eLoran transmitters rely. How would eLoran service be protected from the effects of severe space weather, such as a Carrington Event?
Send me your thoughts at the e-mail address below, with “eLoran” in the subject line.