Category: Opinions

  • Coronavirus: How mapping can stop a pandemic

    Coronavirus: How mapping can stop a pandemic

    Birth of an epidemic

    Image: William Tewelow. Map data © Google
    Image: William Tewelow. Map data © Google

    Men wearing white bio-suits entered the market from the main entrance. A panic ensued at the sight, and a commotion quickly spread through the crowd.

    Shop keepers, sensing the worst, hurriedly gathered their belongings. People rushed towards the exits. More armed soldiers in white bio-suits pressed in, sealing off escape. Screams and weeping filled the market with the din of anxiety and fear. The Huanan Seafood Market was under lock down. The order was not to hurt anyone, but no one was to leave. The quarantine had begun.

    Empty semi-trucks lined the main road. The trucks entered the parking lot one by one, and masked soldiers guided people into the backs of the empty trucks. Once filled, the trucks drove away until the market was empty. The people were transported to “isolation centers” several hundred kilometers outside the city.

    Image: Duncan A Smith, CASA UCL. Data from Global Human Settlement Layer, https://ghsl.jrc.ec.europa.eu/index.php
    Image: Duncan A Smith, CASA UCL. Data from Global Human Settlement Layer, https://ghsl.jrc.ec.europa.eu/index.php

    In Wuhan, the situation had deteriorated rapidly. A month earlier videos went viral about a mysterious flu with pneumonia-like symptoms. Most of the information was coming from citizen journalists. People speculated the Huanan Seafood Market was the source of the illness, but no official statements had been made.

    Anxiety spread. People began fleeing Wuhan ahead of the Chinese New Year, which is the world’s largest annual human migration. Making matters worse, Wuhan is a major transportation hub in Central China, servicing 400,000 commuters per day through the Hankou Railway Station, a short, 15-minute walk to the Huanan Seafood Market.

    Alerting the world

    On Dec. 31, 2019, China notified the World Health Organization (WHO) of the infection. The cause was a new strain of coronavirus along the same viral spectrum as the severe acute respiratory syndrome (SARS) and the Middle East respiratory syndrome (MERS). The next morning, on Wednesday, Jan. 1, 2020, the WHO declared the novel coronavirus 2019 (COVID-19) a public health emergency. It was also that morning that the seafood market was shutdown.

    Above: One of the first and only videos coming out of China that covers the outbreak. Copyright: DW News, posted 23-JAN-2020

    Twenty-three days after China notified the WHO, the city of Wuhan and the entire province of Hubei were quarantined and cut off from the rest of the world — an area comprising 57 million people, unprecedented in the history of public health.

    Still, even with such extraordinary measures, it was already too late. The people moved faster than the system could adjust. Five million people, almost half the residents of Wuhan, had already evacuated. Many traveled to other parts of China to stay with family while others left China altogether, some finding themselves in countries they were banned from entering.

    Containment and quarantine

    China is now dealing with a containment issue at some level in every one of its provinces. In total, 174 million people in China are under some level of travel restriction. By comparison, that is equal to more than half the population of the United States.

    China immediately began leaning on its massive surveillance network and facial recognition technologies to control the outbreak. Using these technologies, Chinese authorities could narrow the search for those most likely to carry the virus. The situation transitioned from a medical emergency to a national security emergency on Tuesday, Feb. 11, when China fired its two highest ranking medical officials in Hubei province, replacing them with a senior Chinese government party official.

    Additionally, China continues working with the three cellular phone carriers in the country to gain access to users’ location data. This information will enable China to conduct geospatial analysis at an individual scale to identify those who have come into contact with infected areas. This practice is very controversial, placing privacy and human rights in conflict with public health security.

    Roots of GIS in epidemiology

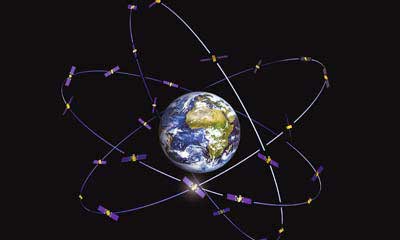
    Epidemiology is the study of people, place and disease, perfectly suited for geospatial technologies. Not surprisingly then, the true origins of geographic information systems (GIS) are founded in epidemiology, harkening back to John Snow’s Cholera map in 1854. The location of infected people clearly pointed to the Broad Street water pump as the cause. That changed the scientific understanding of the time from believing cholera was transmitted in the air to realizing it was a waterborne disease.

    John Snow's 1854 map of the London Broad Street Cholera outbreak. (Image: public domain)
    John Snow’s 1854 map of the London Broad Street Cholera outbreak. (Image: public domain)

    Similarly, the scientific consensus of COVID-19 has also changed since it first emerged. When the outbreak began, it was believed to be zoonotic, meaning the virus originated from animals and transmitted to humans. It was then believed the virus could only be transmitted directly from person to person. Now, it is known to be carried through the air or by touching infected surfaces.

    Each of these modes changes the transmission rate of the disease. This is known as the reproduction number, written as R0 and referred to as the R-naught number. The larger the R-naught, the more infectious the disease. COVID-19 is estimated to have an R-naught between 1.4 and 6.6, which is similar to its cousin the SARS virus; however, SARS only infected 8,096 people and this virus is already more than 10 times that amount.

    In terms of GIS, the higher the R0, the greater the geographic area potentially infected. Narrowing the area to concentrate resources more efficiently requires improved modeling and collecting more data, both of which increase the time required before effective measures can be taken. This creates a dilemma between acting swiftly and acting accurately. This explains some of the images coming out of China showing people forcibly removed from their homes and placed in quarantine.

    Image: John Hopkins CSSE, https://systems.jhu.edu/research/public-health/ncov/
    Image: John Hopkins CSSE, https://systems.jhu.edu/research/public-health/ncov/

    Controlling the spread of the virus also requires knowing the source of each outbreak. The originating source, called the reservoir, once discovered can be cordoned off. Afterwards, through a process called “contact tracing,” all potentially infected people are tracked down and monitored or quarantined if necessary.

    Probability models based on geospatial analysis use factors such as age, sex, pre-existing health conditions and distance from the reservoir overlaid with data such as population density to create an intensity map showing the areas most favorable to the spread of infection. People in the defined areas can be isolated and monitored, preempting further spread.

    Maps: Centers for Disease Control and Prevention
    Click to enlarge. (Maps: Centers for Disease Control and Prevention)

    In the United States, the Health Insurance Portability and Accountability Act (HIPPA) requires data be aggregated at the zip code or county level, which is useful in defining regional trends, such as the CDC maps above of heart disease (red) and the areas of least physical activity (teal). Comparing the two visualizes the premise that exercise and good health go together. However, at this scale the information is not useful in fighting a dynamic and evolving situation like an infectious outbreak.

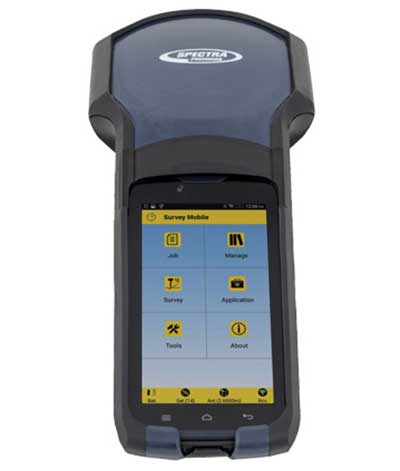
    Ultimately, the goal is real-time feedback at a high-scale resolution. Smartphones and other mobile devices offer unique opportunities to combat epidemics. South Korea is using location information to help contain the outbreak. People use a special number to text where they have traveled. This is to assist in contact tracing if necessary.

    Mobile devices can also report location data along with vital signs to monitor overall health and instantly identify individuals who may be a risk. The mobile device can also alert individuals if they are nearing an infected area and show the infected zones on their phones.

    COVID-19 reporting via GIS

    Systems can be established to report live events like Waze does for reporting traffic hazards, which have proven to report accidents faster than 911 calls. Also, the use of social media live feeds can help identify evolving situations and monitor existing ones.

    Perhaps the government, working with mobile application mapping companies, should create a layer specifically for the epidemic that provides critical information, such as healthcare centers, some of which might be established specifically for the care of the disease outbreak.

    Also, included in that public health layer would be high-risk areas, prohibited entry locations, areas under quarantine, and more, in order to provide an integrated interface to communicate with the general public. This is similar to how the departments of transportation, public works, and emergency response units provide information to the public to reroute traffic around congestion, accidents or closed-off areas.

    Image: Coronavirus story map by Maria Laturnas, University of Potomac
    Image: Coronavirus story map by Maria Laturnas, University of Potomac

    A former U.S. Navy healthcare executive, Ben Boccuzzi, Ph.D., shared his thoughts on the matter with me. “The actual mortality rate of COVID-19 (in the U.S.) is hard to determine until mass testing can be done,” Boccuzzi said. “As of now, the true denominator (all people that would test positive for the virus) we only know of symptomatically and those that died from the disease. So, with these small numbers, the real mortality rate is not fully known. When testing begins on a grander scale, and more people are known to have the virus and do well, the actual rate of mortality will become much smaller.”

    It is now more than two full months since the WHO declared a public health emergency. The number of known cases worldwide stands at 105,941 with 3,569 deaths affecting 100 countries.

    If you’d like to track the virus, the John Hopkins GIS webmap interface updates in real time as new information becomes available.

    Story Maps

    Working with the University of Potomac, several students contributed story maps for this article. You can see their full projects at the links below:

    Image: Coronavirus story map by Gangesh Khadka, University of Potomac
    Image: Coronavirus story map by Gangesh Khadka, University of Potomac

    If you have read this far, thank you. I would like to leave you with the most important information in this article.

    When I began covering this story it was early January, the virus was just beginning to make the news. Fear was in the air. I began to worry. As I immersed myself deeper into the topic, I became even more concerned; so much so, I bought two months of supplies preparing for a long-term self-quarantine situation.

    If you’ve been watching the news, you may be nearing the same state of mind I found myself in. If so, I’ve got good news for you.

    Paradoxically, people are attracted to fear. Fear is a potent biochemical rush. The horror movie industry rakes in $11.7 billion per year. Most media’s primary business is not information. It is using information to increase its readers and viewers, and fear captures people and holds their attention. The media is a profit-driven business. Facts tell. Fear sells.

    The following is what is reported by the WHO based on 55,924 laboratory-confirmed cases since the coronavirus began. The study was published on Feb. 28. At that time, there were 86,992 confirmed cases of COVID-19 and 2,979 deaths, equating to a mortality rate of 3.4%, but those numbers were mostly in China, specifically Hubei province. Outside of China, the number of cases were only 7,166 with 109 deaths having a fatality rate of 1.5%.

    Image: Coronavirus story map by Zaid Alshaboul & Kush Shah, University of Potomac
    Image: Coronavirus story map by Zaid Alshaboul & Kush Shah, University of Potomac

    These numbers do not reflect the whole story. If you are below age 50 and in good health, recovery is 99.1%, so there is almost no reason to be concerned. For those older than age 50 the mortality rate is 1.3%, and over age 60 it increases to 3.6%. For those over age 70 it doubles to 8.0%. The most vulnerable populations are those over age 80 with a mortality rate of 14.8%.

    Additionally, those with pre-existing conditions, such as cardiovascular disease, diabetes, or respiratory disease are also at high risk. If you fall into either of those categories, take great care with your hygiene and personal protection. However, if you are below 60 and in moderately good health, there is less than a 1.3% reason to be concerned and more than 98.7% reason not to be concerned.

    Unless something significant changes, the virus is a reason for caution, but should not be a cause for panic. The fearmongering has gotten out of control. We may or may not get COVID-19, but for those of us who do, most of us will only experience muscle aches, fever and a dry cough, about the same as catching a bad cold.

    Ironically, be grateful in times like these. They give us reasons to take pause, love our family, appreciate what we have, realize life is worth living, and get our house in order. The truth is not the story we are being sold.

    Image: wildpixel/iStock / Getty Images Plus/Getty Images
    Image: wildpixel/iStock/Getty Images Plus/Getty Images
  • Parkinson talks to Google about ‘GPS for Humanity’

    Parkinson talks to Google about ‘GPS for Humanity’

    Steve Malkos, Android Context Group, Google
    Steve Malkos, Android Context Group, Google

    We’ve come a long way since the inception of GPS. Today, location often is taken for granted, but that’s true of every mainstream technology.

    It’s absolutely remarkable how far the technology has evolved. From receivers that were as big as backpacks to tiny chipsets supporting multi-constellation dual-band GNSS receivers in smartphones with antennas that are etched into the body of cell phones, it’s really an amazing technology.

    I’ve had the privilege to work on GPS in phones since before “smart” appeared in front of them. And it’s truly amazing to see how “GPS has revolutionized our day-to-day lives.” But this is not my quote.

    In January at the Google campus in Mountain View, California, we hosted Dr. Brad Parkinson (widely known as the Father of GPS) who gave a talk on this subject. He was the one who called this a revolutionary technology, and that had been a stealthy revolution. Frank van Diggelen secured Brad to come to Google to give this talk.

    His talk was titled “GPS for Humanity.” In the talk, available on YouTube (see below), Brad goes over first hand how, over the past 30 years, this new utility came into being. It came into the fabric of our worldwide society, creating dependencies that did not exist before.

    He detailed how GPS was created, what technologies were essential to its success, all the various ways that GPS keeps crucial processes intact, and how it supports a $1.4 trillion economic impact that this system brings us today.

    It was a privilege and honor to have Brad give a candid and timely talk, and I hope you enjoy it as much as we did!

    To watch his talk, search for “Brad Parkinson Talks at Google” on Google or YouTube. Or follow the link


    Steve Malkos is the lead technical program manager in the Android Context Group at Google.

  • On the cusp of 2020: From Y2K to today’s technology

    On the cusp of 2020: From Y2K to today’s technology

    Image: GPS.gov
    Image: GPS.gov

    As we close the book on 2019 and head into the next decade, much has changed during the 2010s and the 21st century. This article will focus on the technological changes that made a significant impact on the surveying world, with the biggest advances being specifically GNSS-based improvements.

    No, we will not debate the true beginning of a century (Jan. 1, 2000, versus Jan. 1, 2001), but instead look at the predicted issues with computers and the Y2K hysteria leading up to the end of 1999 as part of our nostalgic tour.

    For the millennials and Gen-Z readers, bear with us old-timers for a few paragraphs while we take a trip down memory lane.

    The tale of two centuries…

    “It was the best of times, it was the worst of times, it was the age of wisdom, it was the age of foolishness, it was the epoch of belief, it was the epoch of incredulity, it was the season of Light, it was the season of Darkness, it was the spring of hope, it was the winter of despair, we had everything before us, we had nothing before us, we were all going direct to Heaven, we were all going direct the other way — in short, the period was so far like the present period, that some of its noisiest authorities insisted on its being received, for good or for evil, in the superlative degree of comparison only.”

    In 1859, Charles Dickens wrote this opening paragraph for his well-known novel, “Tale of Two Cities,” to describe two environments (in this case being London versus Paris) at a significant transitional time. Such was the case for surveying and technology in the late 1990s with the rapid utilization of GNSS technology, expanded capability of robotic equipment and data collection. Some practitioners were excited about the new century while others yearned for bygone eras of less complicated procedures.

    “Gonna party like it’s 1999…”

    A 1999 Gateway PC refurbished by LRG. (Screenshot: LRG video, click to view)
    A 1999 Gateway PC refurbished by LRG. (Screenshot: LRG video, click to view)

    With apologies to the late singer Prince and his 1982 hit song, the news surrounding the year 2000 was bleak when it came to computers and technology. For many of our readers, the technology available in 1999 might seem like the Stone Age. Most homes still used telephone land lines, “state of the art” cellphones were being produced by Nokia, personal computers (manufactured by Dell, Gateway, HP and IBM) were utilizing Pentium III processors (at a whopping 450 MHz!) with 5-10 GB storage. Internet Explorer was the web browser of choice, and Napster was gaining users exponentially sharing music downloads. Google was only one year old but rapidly replacing AltaVista and WebCrawler for our internet search engines. Life seemed good, but a storm was brewing…

    The Y2K bug was front and center in all media outlets as many computerized systems were not programmed with the year 2000 in mind. This issue was unique in that it was a software and hardware problem to address. Replacement or patching of software, while taking a significant amount of time and money, can be much easier than computers and hardware loaded with chipsets that cannot be reprogrammed.

    The Napster logo
    The Napster logo

    Most system programming utilized a two-digit year designation instead of a four-digit version (99 versus 1999) and thus a date entry for January 1, 2000, normally composed as 1/1/00 in older systems would be recognized as January 1, 1900, instead. Because of this situation, many experts were predicting a global meltdown with government, utility company and banking disruptions that would render most computer systems unusable.

    In the United States alone, over $100 billion was spent on computer upgrades and troubleshooting of the potential crisis. Thankfully, most of these systems had already been taken offline and replaced, but a few still lingered in critical systems. Because of pre-Y2K upgrade planning, many systems were tested and proven to be immune from the potential crash.

    Specific Y2K issues that took place within the U.S. satellite system were isolated mostly to the units dedicated to surveillance, and not the navigation section used by surveyors. There was a small issue with the U.S. Naval Observatory, in which the date was deemed to be “Jan. 1, 19100” but that was rectified quickly.

    The U.S. spy satellites, however, were knocked out by a faulty software patch rather than the original programming. These units were producing unusable information for three days before programmers were able to fix the problem. Imagine if that situation had happened to the navigational satellites and was impacting surveyors; we can only hope the GNSS system would have simply provided obvious bogus information.

    Embracing RTK

    By 1999, surveying had begun to embrace RTK systems for everyday measurement needs. Because of the constant focus of GPS technology moving forward, the operating systems for RTK were ahead of the curve for the Y2K issue. Fortunately, the navigational satellites as mentioned above did not fail with the date and time issues that were being predicted.

    Logo of the now-defunct U.S. government Y2K website.
    Logo of the now-defunct U.S. government Y2K website.

    The Y2K bug did, however, affect a few users of older technology and software. Older data collectors, including ones based upon handheld calculators, were susceptible to date issues. Systems that were designed in the 1970s and ’80s should have been replaced with newer technology before 2000, but old surveyors stick to the adage: “If it isn’t broke, don’t fix it!”

    For many, it wasn’t simply an upgrade in technology, but more of a radical change in known processes and procedures. New instruments and data collectors required new computers, which required new software, which required learning a completely new system.

    Handheld GPS technology, introduced in the mid-1990s, was beginning to grow as the general public was embracing the new ability to determine geographical positions. While their use is quite simplified by today’s standards, nonetheless these devices captured the tech lover’s need for more accurate location determination.

    In the end, Y2K wasn’t nearly the technological apocalypse many educated minds feared. While there were a few isolated incidents worldwide, everyday life went on without much of a blip on the radar. Planes didn’t fall out of the sky; financial systems didn’t come crashing down and life went on. Thankfully, surveyors everywhere went about their business on Monday, Jan. 3, 2000 as if nothing happened.

    Then 20 years go by…

    The new millennium has brought the surveying community many new exciting technologies and vast enhancements to age-old procedures. Field book notes has been mostly replaced with electronic data collectors, cellphone cameras and point clouds. Data is efficiently transferred between field and office with a remote connection and a blink of an eye. These past 20 years has seen a landslide of technological improvements, yet the future looks incredibly bright with more to come.

    With the new year and decade, let’s look at where we are today and what advances we are anticipating:

    GNSS CAPABILITY

    • GPS (Global Positioning System)  began working in the U.S. in 1978 and as a true global system in 1994. This system was originally designed to work strictly for the United State military, but was discovered to have consumer applications shortly after implementation. There are currently 30 operational satellites in the GPS constellation with two (2) Block III versions being evaluated at press time. A total of ten (10) Block III satellites are planned to be operational by late 2023 or early 2024. These Block III versions will have an enhanced signal capability (L5 band) and will provide more accuracy and increased protection from jamming and spoofing.
    • GLONASS (GLObal NAvigation Satellite System) is the navigation system designed and implemented by Russia. This system was deemed operational in 1993 and currently has 28 operational satellites. Most surveying equipment in the United States has GLONASS tracking capability to greatly increase the accuracy and precision of most GNSS receivers.

      China launched two more BeiDou satellites on Aug. 25, 2018. (Photo: CCTV)
      China launched two more BeiDou satellites on Aug. 25, 2018. (Photo: CCTV)
    • Galileo is the satellite constellation system created by the European Union. It reached limited capability in 2016 with full expanded reach targeted for 2020. However, the reliability of the system is now in question as a total system outage occurred for seven days in July 2019. The satellites themselves were operational; it was the main control center that experienced the shutdown during a system maintenance upgrade. The overall integrity of the system has been restored and the planned rollout of full operational capability is still scheduled for 2020.
    • BeiDou, the national navigation system of China, has achieved 35 operational satellites with 13 additional vehicles currently being evaluated for implementation. With the increased number of satellites, many GNSS receiver manufacturers are including BeiDou as standard channel reception to greatly increase accuracy and precision for navigational purposes.
    • Two additional regional systems, QZSS (Quasi-Zenith Satellite System) from Japan and IRNSS (Indian Regional Navigation Satellite System) from India are currently working to install more satellites and provide navigation signals soon. Because these are regional systems, access to these signals for U.S.-based surveyors will not be available.

    In 20 short years, we went from having two good systems to four very robust systems and two regional organizations.

    While it is still unclear how political relationships will affect the ability to use a system from another country, the simple fact is that more vehicles in space will only increase the coverage, reliability and effectiveness of GNSS navigational data. Increased signal type and strength will also provide many benefits, so surveyors should look forward to even better GNSS days ahead.

    ADDITIONAL CELLPHONE CAPABILITY

    Several increases in cellphone technology will greatly enhance not only the consumer’s use of GNSS but the surveyor’s. This involves a two-step increase in value with the rollout of 5G signal technology and dual-frequency GNSS receiver hardware within the cellphone.

    5G is being introduced in various markets around the country, but won’t see full potential until 2021 and beyond. Those who can use it in the short term will see greater bandwidth for data connectivity, but surveyors will start utilizing navigational enhancements because of the signal and transmitter technology.

    Photo: Broadcom
    Broadcom’s latest dual-frequency chip. (Photo: Broadcom)

    Add to this mix the future implementation of dual-frequency GNSS chipsets to provide much more accurate location, and the surveyor will have more data-collection power in their pocket. Dual frequency was a gamechanger for GPS receivers in their infancy, so one can only imagine how much it will enhance the navigation accuracy when included in the cellphone.

    REAL-TIME NETWORKS (GNSS)

    Most urban and suburban surveyors already enjoy the benefit of a real-time network, either from a private or public system. With 5G and expanded use of more satellites and L5 signal, the RTN will become a better tool for surveyors everywhere. A reduction of setting up a base station increased productivity, less theft and less equipment costs. The RTN will become a standard operational tool just like having a total station in your survey rig.

    DATA COLLECTORS

    Photo: Spectra Geospatial
    Photo: Spectra Geospatial

    The technology hasn’t stopped with the unveiling of new data collectors and platforms. Small handheld devices used to rule the field surveyor’s world; now those devices have become bigger and more advanced than ever.

    While most collectors already had touchscreens, the actual screen is increasing in size and functionality. Some are adopting the tablet-style format (8- and 10-inch screens), others are incorporating larger screens (7 inches) within the body of the traditional collector. All of them are including better cameras and enhanced connection capability through Wi-Fi, Bluetooth and cellular methods.

    Also catching on is the use of bring-your-own-device (BYOD) with specialized apps for connecting to newer GNSS receivers. This allows surveyors to keep down costs of equipment by not having to purchase a dedicated data collector. As mentioned previously, once the cellphone becomes equipped with 5G and/or dual-frequency GNSS, it will become an excellent system for surveying that will produce extraordinary value for the surveyor.

    SPATIAL DATA

    The biggest revolution for surveyors in the coming years will be the ability to collect spatial data through a variety of equipment and sensors. Besides the obvious explosion of UAV capability, the small-format laser scanner is becoming user- and drafter-friendly as well as much more affordable. Now a surveyor can perform dozens (if not more) of small area scans with simplified orientation and scan formatting to create a great looking point cloud for data extraction and/or Building Information Modeling (BIM). Surveyors are beginning to understand how to utilize this technology and data to reach inaccessible areas and densified regions quickly. In addition to scanning technology, SLAM (simultaneous localization and mapping) will also become more mainstream as more surveyors are adopting the method for data collection.

    What we’ve learned

    “The days are long, but the years are short.” – Gretchen Rubin, author

    Gretchen hit the nail on the head, as these past two decades have rolled on. When the end of 1999 was upon us, it seemed to be a big deal because of the potential of Y2K issues. There we were, surveyors with exciting technology in our hands, and now the forefathers of computers were going to erase it all due to not looking ahead to the next century.

    We easily got past it, yet the memories of Y2K still linger on for some of us. The jump to 2010 didn’t foreshadow any drama (other than climbing out of a recession) and I personally didn’t think any different while moving the calendar to January 2020. But somehow in the last few months of 2019, there were many stories about the Y2K predicament, and it rekindled old memories of those weeks leading up to January 1, 2000.

    Long story short, we survived and lived to survey many more days. Having time to look back and compare where we were 20 years ago to where we are now, I find it simply amazing. No, Rick Deckard isn’t flying by in his car catching bad guys (Blade Runner was set in 2019!), but surveying continues to amaze me with continued technological changes.

    I wonder what the next 20 years will bring.

  • PNT Executive Order helpful, but delays market solutions

    PNT Executive Order helpful, but delays market solutions

    Headshot: Dana Goward
    Dana Goward, President, Resilient PNT Foundation

    On Feb. 12, the White House released an “Executive Order on Strengthening National Resilience through Responsible Use of Positioning, Navigation, and Timing Services.”

    It is gratifying to see White House attention to this issue. The increase in public awareness it brings will benefit individual users and the nation as a whole.

    The order also hints at market driven solutions that could quickly improve America’s PNT resilience.

    Needless delays

    Unfortunately, the order fails to direct immediate action on this critical national and economic security issue. Instead it needlessly pushes most action and responsibility off for a year or more to do “more study.”

    This is hard to understand as most of the “more study” has already been completed. For example, the order tells the Department of Commerce to take up to a year to examine PNT use in various sectors, and identify vulnerabilities and user needs. The Department of Homeland Security has already completed a National Risk Assessment and, according to congressional staff, has recently completed a report on user requirements mandated in 2017’s National Defense Authorization Act.

    The Office of Science and Technology Policy is given a year to develop a plan to test robust and resilient non-GNSS PNT services (but is not required to actually do any testing). Congress mandated such a test program in 2017 and funded it with $10 million in 2018. After much delay, the Department of Transportation will complete the testing in May of this year.

    The order gives the Department of Commerce six months to make available a time source to support critical infrastructure. For more than 60 years, the nation’s master clock has been available to users at the department’s NIST Laboratory in Boulder, Colorado.

    Note the challenge has not been the clock, but that the nation has no way — other than vulnerable GPS signals — to distribute time at the needed level of accuracy to millions of critical infrastructure nodes. Government studies in 2007 and 2014 determined that the best way to do this was with a ground-based system. The Department of Transportation’s ongoing testing program is examining this issue again.

    Market-driven solutions

    Aside from increasing public awareness, the best thing the Executive Order does is to point a way forward for market-driven resilient PNT solutions.

    The order calls for federal contracts to (in 21 months, if everyone does their jobs on time) require that vendors use existing and new resilient PNT sources.

    If this eventually happens, the government could leverage its enormous influence in the market and stimulate creation of one or more commercial distribution systems for resilient, non-GNSS PNT. This is a great concept, and very much in keeping with America’s tradition of letting market forces solve some of its biggest problems.

    But this solution will not spring into life on its own.

    No commercial entity will invest tens of millions of dollars, or more, in a PNT system without assurance in advance of an income stream. Especially since federal contracting officers can and will waive the requirement if offerors cannot reasonably meet it.

    If stimulating a market solution is the administration’s intent, it must stay actively involved and encourage the process for some time to come.

    This includes complying with the 2018 law that requires establishment of at least one wireless, terrestrial, difficult-to-disrupt source to back up the timing signals provided by GPS.

    Fortunately, this can be done by leveraging the free market at minimal cost and with little administrative effort.

    By contracting to subscribe to a commercial service that will provide resilient PNT signals, the government need only invest a relatively small yearly sum using a fairly simple contract vehicle. Such a contracting technique has been used before with great success.

    In 2007 the Federal Aviation Administration (FAA) did this as a way to establish its ADS-B aviation tracking and safety network. Once the subscription contract was let, the commercial provider was able to get financing and quickly build out the system.

    Today, the FAA gets the information it needs, doesn’t have the headache of owning and maintaining a large network, and even shares in the revenue the system owner earns from selling data to other companies.

    Additional leadership needed

    It is important to remember that, regardless of the issue, presidential pronouncements are not enough.

    In 2004, President G.W. Bush directed a number of actions to protect the nation’s critical PNT, including establishment of a GPS backup capability. While 16 years later his directive is still official executive branch policy, that mandate and many others from his order are still unexecuted.

    Real improvements to PNT resilience and our nation’s security depend not on one-time pronouncements, but continued leadership focus and engagement.

    This is always a challenge for initiatives driven by the White House. It will be doubly so in this case as there is no clear department leader for civil PNT issues the administration can rely on while it attends to the next issue of the day.

  • Coronavirus, organ transport top medical drone uses

    Coronavirus, organ transport top medical drone uses

    With Coronavirus all over the news, it’s actually encouraging to hear that China is making high-level efforts to contain the infection: two isolation hospitals built in just one week in Wuhan where the outbreak began, travel restrictions inside China, very few people being allowed to leave the country, enforced mask-wearing, and local communities in neighboring provinces blocking visits by outsiders.

    Two drone-related stories caught my attention, both in China and connected to the virus outbreak — one where drones were being used to enforce “wear-a-mask (see video), and another where disinfectant was being dispensed by drones.

    Photo: Xag
    Photo: Xag

    It’s not exactly clear who was behind recent drone flights that broadcast live warnings to people without protective masks on the streets — some villages in rural China were apparently overflown and people were advised to wear a mask while outdoors.

    Around Beijing, similar activities were maybe down to well-intentioned social media people and traffic police.

    XAG, which has fielded 42,000 agricultural spraying drones in China, is urging authorities to use its drones for widespread disinfectant spraying, and has set up a significant fund to support these activities. The company claims its drones can disinfect a local community in less than four hours, and may already have done so.

    Medical transport drones. Staying with the medical theme, Aquiline Drones (AD) in Cincinnati is a drone company operating under a Federal Aviation Administration (FAA) Part 135 Air Carrier Certificate, and is working on a system to transport human organs for transplants.

    VyrtX is an organ transport company in Ohio that has teamed with AD, with the object of creating a highway-in-the-sky across the state to overcome ground delivery delays. Apparently around 25% of precious transplant organs don’t make it in time to be used; they are lost to the patients on lengthy wait lists — and many people are dying as a consequence. There are supposedly enough donors, but organs deteriorate during ground transport and desperate transplant candidates are losing out badly.

    So the next step for VyrtX and AD are custom-designed drones for life-saving rapid transport between donor and transplant hospitals. VyrtX is working with the U.S. Air Force Research Laboratory in Dayton, the Ohio UAS Centers and four Ohio organ procurement organizations to develop the air corridor and begin rapid organ transport by drone across the state.

    The University of California, San Diego, Health (UC San Diego Health) is joining an increasing number of health organizations in developing a drone system for blood and documentation transport between its facilities. Collaborating with the UPS Flight Forward drone delivery program and with Matternet, medical payloads will travel between Moores Cancer Center and Jacobs Medical Center. The Center for Advanced Laboratory Medicine, about 1.5 miles north, will be added provided initial test flights work out well.

    Trained professionals will load and operate the drones, which will follow predetermined, low-risk flight paths and will carry no cameras. (Photo: UC San Diego Health)
    Trained professionals will load and operate the drones, which will follow predetermined, low-risk flight paths and will carry no cameras. (Photo: UC San Diego Health)

    UPS Flight Forward is another company that was granted (FAA) Part 135 Air Carrier authorization and is already operating a UAS delivery program at WakeMed Hospital in Raleigh, N.C.. UPS Flight Forward is also planning with CVS to deliver prescriptions and other products to CVS pharmacy customers.

    Another drone medical supplies delivery system in Tanzania ran an operational trial in the fall of 2018. Wingcopter (a German drone manufacturer), Deutsche Gesellschaft für Internationale Zusammenarbeit (GIZ) GmbH and DHL flew medicines from the mainland to an island. The DHL Parcelcopter completed a 60-km route autonomously in around 40 minutes, for a total of 2,200 km flown during the pilot project.

    Building on these earlier trials, Wingcopter is now working with Merck and the Frankfurt University of Applied Science to demonstrate a drone delivery system between two Merck facilities in Germany. The object is to show the benefits of direct drone airborne transport over trucks for moving small packages between a Merck lab in Gernsheim to its headquarters in Darmstadt.

    The first flight was recently accomplished over roughly 15.5 miles between the facilities, carrying a sample of pigments.

    Photo: Wingcopter
    Photo: Wingcopter

    The BVLOS (beyond visual line of sight) flight passed over a dense metropolitan area, power lines, railways, and roadways. Benefits include time savings of around an hour, provided much greater savings at some times, and avoided significant ground vehicle emissions.

    To sum up, drones being used to help combat coronavirus, to reduce time and costs for the transport of medical samples and supplies over medium distances, and there’s a spin-off with potential commercial promise, too. It’s a good month for the drone industry…

    Tony Murfin
    GNSS Aerospace

  • Report: DoD drone spoofed GPS on small aircraft

    Report: DoD drone spoofed GPS on small aircraft

    The MQ-9 Reaper drone. (Photo: U.S. Air Force/Paul Ridgeway)
    The MQ-9 Reaper drone. (Photo: U.S. Air Force/Paul Ridgeway)

    A small aircraft’s encounter with a likely military drone near Edwards Air Force Base resulted in navigation failure, according to a report filed with NASA’s Aviation Safety Reporting System.

    In October 2019, a single engine Piper P-46 Malibu was flying at 24,000 feet 36 miles north of Los Angeles en route San Diego.

    Defense drone overhead

    The pilot reported, “I saw a DOD drone (inverted V tail) pass overhead approximately 1,000 [feet] above. At the same time, my PFD [primary flight display] indicated that I had a large magnetic variation error, and in turn … indicated that I was now flying to a new way point (TCH VOR) located in Utah, well off my flight plan.”

    Later, the navigation system indicated that the aircraft was on its way to a spot in Montana.

    Interestingly, the flight plan displayed by another cockpit instrument, the Multi-Function Display, was not affected.

    The aircraft had been operating under an Instrument Flight Plan. Federal Aviation Administration rules for light aircraft allow such operation with GPS as the sole navigation sensor.

    With the primary flight display not operating properly, the aircraft was no longer able to fly a safe instrument approach to landing. Fortunately, the weather was such that it could proceed and land using Visual Flight Rules.

    In the pilot’s words, “Had it not been a VMC [visual meteorological conditions] day allowing me to fly a visual approach, I would have had to [advise Air Traffic Control] – and find a way to land without any reliable approach capability.”

    A combination of factors

    The general consensus among experts is that this incident was inadvertent and likely arose from a combination of factors. Most significant were that the drone flew above the light aircraft, temporarily blocking some GPS signals, and emitting electromagnetic radiation from one or more of its on-board systems.

    It is not possible to say what those systems and radiation may have been. It is unlikely they were intended to interfere with GPS reception, as that would pose serious safety-of-flight concerns in the nearby congested Los Angeles airspace.

    GPS signals are infamously easy to disrupt, though. It is probable that the close proximity of the drone resulted in some radiation from its systems “spilling over” into GPS frequencies and causing the problem.

    Of greater concern is that the light aircraft’s systems did not quickly reset and recover once the drone had moved off and the interference ceased. Had the aircraft been flying in the clouds or bad weather, the loss of its only radionavigation source could have been quite serious.

    While not clear from the report, it is likely that the navigation system only recovered after a complete shutdown and restart. From the report in the NASA database:
    “The system has since been checked and is operating correctly, but it seems pretty clear this was some type of interference / jamming arising from the DOD drone. Clearly, this is a significant risk to all aircraft, and because if [sic] occurred within the LA airspace it is a serious threat to safe flights.”

    The need to address interference

    Shortly before this incident, the International Civil Aviation Organization identified addressing interference with satellite navigation system signals an “urgent priority.” This was in response to concerns from several member countries and organizations citing safety of flight issues. One example cited was the near loss of a passenger aircraft flying in the mountains during a period of GPS disruption.

    The October 2019 report of interference from the drone is number ACN 1696794 in the NASA Aviation Safety Reporting System. It can be accessed by searching here.

  • The differences between Geoid18 values and NAD 83, NAVD 88 values

    The differences between Geoid18 values and NAD 83, NAVD 88 values

    My last column, December 2019, highlighted the National Geodetic Survey’s (NGS) new Geoid Monitoring Service (GeMS); and, that NGS’ will be publishing a gridded geoid model GEOID2022 that will contain two components: (1) Static Geoid model of 2022 (SGEOID2022) and (2) Dynamic Geoid model of 2022 (DGEOID2022). That’s what going to happen in 2022, but what about today? Since GEOID18 has been officially released for public use, it’s time to look at differences between the Geoid18 published value and estimated geoid values computed using information from NGS’ datasheet. This column will provide an analysis of the differences between the latest published hybrid Geoid18 values provided on NGS’ Datasheet and the computed geoid height value using the published NAD 83 (2011) ellipsoid height and NAVD 88 orthometric height. This is what a user will see if they computed differences using NGS’ datasheets published values. The question will always be asked, why is there a difference between the published Geoid18 value and the computed geoid value. This column will explain some reasons for the differences.

    It’s mostly good news but there are some issues that should be highlighted. This column will highlight issues on differences due to published heights that have changed since the database pull for Geoid18.

    First, it should be noted that NGS’ hybrid geoid models are different than NGS’ experimental gravimetric geoid models. My December 2018 column explains these differences.

    I would like to emphasize that, in my opinion, hybrid geoid models should be denoted as transformation models. Saying that, hybrid geoid models are related to “real” geoid models. Hybrid geoid model GEOID18 was computed based on NGS’ gravimetric geoid model xGeoid19b; therefore, GEOID18 is related to a gravimetric geoid model but its function is to estimate GNSS-derived orthometric heights consistent with NAVD 88 heights. As described in my previous columns, the GPS on Bench Marks (GPSBMs) data provide an estimate of the geoid height ‘N’ by differencing the ellipsoidal height ‘h’ from the orthometric height ‘H’: (N = h – H). These differences are then compared to the gravimetrically-derived geoid model. The box titled “Excerpt from Geoid18 Website Technical Details” provides a summary of the process from NGS Geoid18 web page technical details document.

    The figure in the box titled “GEOID18 Conversion Surface in cm” is the surface that represents the difference between NAVD 88 as a datum and the geopotential (geoid) surface used in the gravimetric geoid. This is the difference between the hybrid geoid and the gravimetric geoid with respect to NAD83 (GEOID18 – xGEOID19B). This surface has three essential components: a bias, a continental tilt, and local warping from the bench marks.

    Excerpt from Geoid18 Website Technical Details

    (https://www.ngs.noaa.gov/GEOID/GEOID18/geoid18_tech_details.shtml)

    Data: National Geodetic Survey
    Data: National Geodetic Survey

    Hybrid Geoid Model Construction
    The residuals obtained in equation 1 are contaminated with a continential tilt and bias that is estimated and removed with a simple two-dimensional planar surface. The bias-free and tilt-free residuals are ultimately used to determine a mathematical model using least squares collocation (LSC) and multiple Gaussian functions to describe the behavior seen at the bench marks. Once the relationship between the points is modeled, the model is used to generate a 1 arcminute regular grid for interpolation purposes. Figure 2 shows the final conversion surface. This surface represents the difference between NAVD 88 as a datum and the geopotential (geoid) surface used in the gravimetric geoid. This is the difference between the hybrid geoid and the gravimetric geoid with respect to NAD83 (GEOID18 – xGEOID19B). This surface has three essential components: a bias, a continental tilt, and local warping from the bench marks.

    GEOID18 Conversion Surface in cm

    Image: National Geodetic Survey
    Image: National Geodetic Survey

    Looking at the figure in the box, the bias and tilt between the hybrid geoid model (Geoid18) and the experimental gravimetric geoid model (xGeoid19b) are fairly obvious. It’s the local warping from the bench mark data that may cause some issues to surveyors or, at least at a minimum, raise some concerned by surveyors. The box titled “Plot of the GPS on Bench Marks Involved in Geoid18” provides a plot of the GPS on Bench Marks (GPSBMs) used in the generation of Geoid18. Users can download the list of GPSBMs stations from the NGS Geoid18 website. There were 32,357 stations used to generate the model. This was an increase of approximately 6,800 stations (26%) over the hybrid geoid model Geoid12B.

    Plot of the GPS on Bench Marks Involved in Geoid18

    Image: National Geodetic Survey
    Image: National Geodetic Survey

    The boxes titled “Number of GPS on Bench Mark Stations by State” and “Number of GPS on Bench Mark Stations by State in Northeast U.S.” provide the number of data points per state.

    Number of GPS on Bench Mark Stations by State

    Image: National Geodetic Survey
    Image: National Geodetic Survey

    Number of GPS on Bench Mark Stations by State in Northeast U.S.

    Image: National Geodetic Survey
    Image: National Geodetic Survey

    The box titled “Table of Number of Data Points per State” provides the number of stations per State in tabular form.

    Table of Number of Data Points per State

    Data: National Geodetic Survey
    Data: National Geodetic Survey

    The box titled “Summary of Overall fit of Geoid18” provides a summary of the fit of residuals of Geoid18 from the NGS GEOID18 technical details document. Looking at the CONUS overall values, the standard deviation is very low 1.27 cm which is a little better than Geoid12B (1.7 cm). It should be noted that there are some large outliers (minimum value of -10.12 cm and maximum value of 8.17 cm).

    Summary of Overall fit of Geoid18

    (https://geodesy.noaa.gov/GEOID/GEOID18/geoid18_tech_details.shtml)

    Data: National Geodetic Survey
    Data: National Geodetic Survey

    For this column, the file of bench marks provided on the NGS Geoid18 web page were combined with the published ellipsoid, orthometric, and Geoid18 heights from NGS’ datasheet. The difference between the published geoid height (Geoid18) and the estimated geoid height [published NAD 83 (2011) ellipsoid height minus NAVD 88 orthometric height] was computed using the following formula:

    Data: National Geodetic Survey
    Data: National Geodetic Survey

    The box titled “Plot of Differences Based on GPS on Bench Marks Used in Geoid18” depicts these differences based on the stations used to generate Geoid18.

    Plot of Differences Based on GPS on Bench Marks Used in Geoid18

    Image: National Geodetic Survey
    Image: National Geodetic Survey

    Most of the values depicted on the plot are within the +/- 2 cm which is what you’d expect because the standard deviation of the overall fit is 1.4 cm. One to two centimeters is a very reasonable difference between the modeled and computed values. The question someone may ask is, I thought the model should be good to 1.4 cm so why are there large residual values on the map? There are several reasons why some of these differences are large but each case needs to be investigated to determine why they are large. This column will address one region as an example and provide a method for others to investigate differences in their area of interest.

    The box titled “Plot of GPS on Bench Mark Differences at the ND/MN Border” depicts a very large difference between the modeled geoid model and the estimated geoid height along the ND/MN border. As indicated in the box, the difference exceeds 6 cm.

    Plot of GPS on Bench Mark Differences at the ND/MN Border

    Image: National Geodetic Survey
    Image: National Geodetic Survey

    The box titled “Plot of GPS on Bench Mark Stations in the ND/MN Border Region” depict the bench marks involved in the development of Geoid18. The green circles represent the GPSBMs stations used in the creation of Geoid18 and the red “x” denote the stations that were not used in the creation of the model. As indicated in the plot, there were a lot of GPSBMs stations in the State of Minnesota (11,011).

    Plot of GPS on Bench Mark Stations in the ND/MN Border Region

    Image: National Geodetic Survey
    Image: National Geodetic Survey

    The box titled “Differences on GPS on Bench Marks in ND/MN Border — NOT Used in Model” depict the values of the rejected GPS on BMs stations. These stations were not used to create the hybrid geoid model Geoid18. As the plot indicates there are several large differences. This is not really surprising since these stations were not used in the model.

    Differences on GPS on Bench Marks in ND/MN Border — NOT Used in Model

    Image: National Geodetic Survey
    Image: National Geodetic Survey

    The box titled “Differences on GPS on Bench Marks in ND/MN Border — USED in Model” depict the values of the GPS on BMs stations used to create the Geoid18 model. Some of these differences exceed 8 cm. You would expect these differences to be small since these stations were used to create the model. So, why are there large post-modeled residuals in the Fargo, ND, region of the United States?

    Differences on GPS on Bench Marks in ND/MN Border – USED in Model

    Image: National Geodetic Survey
    Image: National Geodetic Survey

    In August 2019, NGS performed a large leveling network adjustment in the Minnesota. The adjustment was performed after the Geoid18 database pull. The adjustment resulted in a 7- to 9-cm bias between the published height values and the superseded values. The August 2019 Minnesota leveling network adjustment heights were not used in the creation of Geoid18. The post-modeled differences presented in this column were generated using the published NAD 83 (2011) ellipsoid heights and current NAVD 88 orthometric heights from the NGSIDB. It was determined by NGS that the differences in the Fargo region were mostly due to crustal movement. Therefore, since the differences were due to movement, secondary adjustments will need to be performed to feather the 7- to 9-cm differences to maintain consistency between published NAVD 88 heights in the region. The secondary adjustments have not been completed as of the publication of this column so the residuals west of Fargo in North Dakota are small. These values will change after the secondary adjustment is completed and loaded into NGS’ database.

    As an example, I’ve highlighted the station Fargo 0009 (PID DF7623) in the area of Fargo, North Dakota (see box titled “Differences on GPS on Bench Marks Near Fargo, ND”). The difference (-8.3 cm) is between the published Geoid18 value and the computed geoid value using the published ellipsoid height and orthometric height from the NGS’ datasheet. The box titled “Excerpt from Datasheet for Station Fargo 0009 (DF7623)” provides the information from NGS datasheet for station Fargo 0009; the information used in the computations are highlighted in the box. The box titled “Computation of the Difference between the Modeled Geoid Value (Geoid18) and the Computed Geoid Value for Fargo 0009” provides the process used to compute all differences for this column.

    Differences on GPS on Bench Marks Near Fargo, North Dakota

    Image: National Geodetic Survey
    Image: National Geodetic Survey

    Excerpt from Datasheet for Station Fargo 0009 (DF7623)

    Data: National Geodetic Survey
    Data: National Geodetic Survey
    Data: National Geodetic Survey
    Data: National Geodetic Survey
    Data: National Geodetic Survey
    Data: National Geodetic Survey

    Computation of the Difference between the Modeled Geoid Value (Geoid18) and the Computed Geoid Value for Fargo 0009
    (Information from NGS Published Datasheet)

    Data: National Geodetic Survey
    Data: National Geodetic Survey

    So, why is this difference so large in this region? A stated above, NGS performed a readjustment in this region and superseded the heights that were used in the creation of the Geoid18 hybrid model. The Geoid18 hybrid model used the previously published orthometric heights, now provided in the superseded section of the NGS datasheet, because that was the current published height at the time of the data pull for the Geoid18 process. Therefore, if we substitute the superseded height from the datasheet into the equation the difference is reduced to 0.1 cm (1 mm). [See the box titled “Computation of the Difference between the modeled geoid value (Geoid18) and the computed geoid value for Fargo 0009 Using the Superseded NAVD 88 Value.”]

    Computation of the Difference between the modeled geoid value (Geoid18) and the computed geoid value for Fargo 0009 Using the Superseded NAVD 88 Value
    (Information from NGS Published Datasheet)

    Data: National Geodetic Survey
    Data: National Geodetic Survey

    This means if someone uses NGS’ OPUS web tool to compute a GNSS-derived orthometric height, the NAVD 88 GNSS-derived orthometric height will be about 8 cm different than the published stations in this region. This should not be an issue if the users follow published NGS Guidelines to estimate the NAVD 88 GNSS-derived orthometric height, and/or uses NGS Beta OPUS-Projects and NGS procedures to estimate the NAVD 88 GNSS-derived orthometric height. These processes will ensure that the height will be consistent with the current published NAVD 88 orthometric heights in the NGS database.

    The technical report on Geoid18 provides a good explanation on the stations used in the United States Gulf Coast region. See box titled “GPS on Bench Marks for GEOID18 in the Gulf Coast Region.”

    GPS on Bench Marks for GEOID18 in the Gulf Coast Region

    (https://www.ngs.noaa.gov/GEOID/GEOID18/geoid18_tech_details.shtml)

    There are areas of complex vertical crustal motion in the Texas/Louisiana Gulf Coast region of the United States which render many control station elevations in the region invalid. The selection of GPS on Bench Marks in this region was limited to the small number of marks where the leveling and GPS data agreed to minimize the influence of crustal motion in the hybrid geoid model. Figure 1 depicts the selection of stations used in the hybrid geoid model along the Texas/Louisiana Gulf Coast.

    Image: National Geodetic Survey
    Figure 1: GEOID18 Gulf Coast selected marks. (Image: National Geodetic Survey)

    As indicated in the box titled “GPS on Bench Marks for GEOID18 in the Gulf Coast Region” very few stations in Southern Louisiana were used in the creation of the hybrid geoid model. The box titled “Differences on GPS on Bench Marks in the Gulf Coast Region” depict the differences between the published Geoid18 value and the computed geoid value using the latest NAD 83 (2011) ellipsoid and NAVD 88 orthometric height. The plot indicates that there are many large differences. This is to be expected because the orthometric heights used in the creation of the hybrid geoid model are all superseded heights. This is because the only published heights in Southern Louisiana are GNSS-derived orthometric heights and leveling-derived orthometric heights were used in the creation of GEOID18.

    Differences on GPS on Bench Marks
    in the Gulf Coast Region

    Image: National Geodetic Survey
    Image: National Geodetic Survey

    Saying that, NGS performed a large GNSS network project in Southern Louisiana in 2016. At the time of the writing of this column, the GNSS-derived orthometric height from the 2016 project were not yet finalized.

    This column provided an analysis of the differences between the latest published hybrid Geoid18 values provided on NGS’ Datasheet and the computed geoid height value using the published NAD 83 (2011) ellipsoid height and NAVD 88 orthometric height. The column highlighted issues on differences due to published heights that have changed since the database pull for Geoid18. Future columns will address differences in other portions of CONUS.

  • Maintaining the 1-dB standard

    Maintaining the 1-dB standard

    How do we ensure that GPS is protected from harmful interference?

    By J. David Grossman, guest columnist

    J. David Grossman
    J. David Grossman

    Debates in Washington over harmful interference and the coexistence of divergent services are raging. Nowhere are the differences more apparent than when comparing radio navigation services such as GPS to radio communications systems used in wireless communications networks.

    How do we ensure that a satellite-based radionavigation service like GPS, which by design operates below the ambient noise floor, is protected from harmful interference? The International Telecommunications Union’s (ITU) definition of harmful interference provides a starting point, by defining harmful interference as a level that “endangers the functioning of a radionavigation service.”

    With this foundational definition, the internationally established criterion of a 1-decibel (dB) increase in the noise floor, otherwise known as the 1-dB standard, provides the answer, offering a readily identifiable, objective and predictable metric.

    The 1-dB standard uses a 1-dB increase in the noise floor as the distinction between the onset of interference that can be detected by a GPS receiver and harmful interference. (This can be reliably measured by a 1-dB decrease in the carrier-to-noise ratio, C/N0, reported by the receiver). Thus, the 1-dB standard provides a definitive way to protect GPS receivers from harmful interference. Adherence to this standard helps ensure that systems operating in an adjacent spectrum band do not interfere with GPS.

    Why use the 1-dB standard instead of other metrics? The 1-dB standard is based upon well-understood GNSS engineering considerations and is associated with quantifiable changes in the overall noise to which GNSS receivers are subject, with equally well-understood effects on receiver operation. (The 1-dB standard enables system designers and spectrum regulators to carefully assess interference from various sources and analyze their net effect on GNSS receivers).

    It also has been adopted internationally and has a long and well-established proven history of protecting GPS operations from harmful interference in both international and domestic regulatory proceedings.

    So-called “alternatives” to 1 dB, which may be appropriate in the context of radio communications systems, fail to recognize that the accuracy, integrity and reception (availability) of GPS signals used by a receiver can be degraded by interfering noise in ways not immediately apparent to an end user. This means that the effects of degraded service of GPS signals can still be detrimental well before the user loses position accuracy or experiences complete loss of position.

    Additionally, C/N0 is computed at the entry point of a GPS receiver, such that a 1-dB decrease serves as an early warning of interference potentially becoming harmful. Other metrics, computed further downstream, may be indicative of harmful interference already occurring.

    GPS has become a fundamental part of our lives and is an integral engine of the U.S. economy, creating new jobs, and unlocking innovation. Maintaining the 1-dB standard ensures that the GPS success story and American innovation will continue for decades to come.


    J. David Grossman is executive director of the GPS Innovation Alliance.

  • Editorial Advisory Board PNT Q&A: Matching receivers and antennas

    Editorial Advisory Board PNT Q&A: Matching receivers and antennas

    What are the key technical criteria in matching GNSS receivers and antennas from the same or different manufacturers? For what uses does it matter most?

    Photo: Orolia
    John Fisher. (Photo: Orolia)

    “For fixed-pattern antennas, it’s fairly simple: RF + DC to power the antenna. Most vendors are compatible. The challenge is more for controlled radiation pattern antennas (CRPA). Power requirements vary greatly, and performance can be improved with a two-way data exchange between the CRPA and receiver, but there is no industry standard yet for this interface. An example: tilt angles from the receiver’s IMU can greatly aid beam pointing.”
    John Fischer
    Orolia


    Ellen Hall
    Ellen Hall

    “Antenna selection is exceptionally critical for our military and high-precision users. The platform and environment are the primary drivers of these antenna requirements. In general, SWaP (size, weight and power) is at the forefront of all criteria. As operational plans are developed, requirements for a single or multi-element array,  element gain, and noise figure must be considered.”
    Ellen Hall
    Spirent Federal Systems


    Members of the EAB

    Tony Agresta
    Nearmap

    Miguel Amor
    Hexagon Positioning Intelligence

    Thibault Bonnevie
    SBG Systems

    Alison Brown
    NAVSYS Corporation

    Ismael Colomina
    GeoNumerics

    Clem Driscoll
    C.J. Driscoll & Associates

    John Fischer
    Orolia

    Ellen Hall
    Spirent Federal Systems

    Jules McNeff
    Overlook Systems Technologies, Inc.

    Terry Moore
    University of Nottingham

    Bradford W. Parkinson
    Stanford Center for Position, Navigation and Time

    Jean-Marie Sleewaegen
    Septentrio

    Michael Swiek
    GPS Alliance

    Julian Thomas
    Racelogic Ltd.

    Greg Turetzky
    Consultant

  • Drone mystery lights up Colorado skies

    Drone mystery lights up Colorado skies

    A proposed FAA rule — open for public comment until March 2 — would require drones over 0.55 pounds to electronically transmit their location and ID.

    Northeastern Colorado was visited with a mystery in late December and January. Residents began seeing drones from 7 to 10 p.m. each night, moving in groups as large as 30, and flying in a grid pattern. The drones stayed about 200 feet to 300 feet in the air and flew steadily in squares of about 25 miles, at speeds estimated at 25–40 mph.

    Reports were so numerous that a multi-agency task force was formed to investigate, including 10–15 law enforcement agencies as well as the FBI and Federal Aviation Administration (FAA). The drones were reported to measure six feet across and sound like a small jet engine. “These are not drones that people in our county can just buy,” said Washington County Sheriff Jon Stivers.

    Numerous government agencies and companies denied the drones were theirs, including the U.S. Air Force, NOAA, NORAD, the FAA, and large drone developers Google, Amazon and Uber.

    The Colorado Division of Fire Prevention and Control (DFPC) flew the state’s Multi-Mission Aircraft in an area where drones had been reported during two January missions.

    This DFPC map, obtained by FOX31 TV, shows possible locations of drone sightings along with power plants, pipelines and missile sites. (Map: Colorado Division of Fire Prevention and Control)
    This DFPC map, obtained by FOX31 TV, shows possible locations of drone sightings along with power plants, pipelines and missile sites. (Map: Colorado Division of Fire Prevention and Control)

    Some suspect the drones were part of a secretive Air Force counter-drone program to protect nuclear missile silos. Another theory was a hunt for a missing nuclear warhead from one of the many intercontinental ballistic missile sites that dot the prairies of Wyoming, Colorado and Nebraska.

    A group of Wichita, Kansas, drone enthusiasts also came forward, saying they had flown groups of drones in the area — but not to the same scale.

    In an interview at January’s World Economic Forum in Davos, Switzerland, Transportation Secretary Elaine Chao told Yahoo Finance, “We don’t know who they belong to, we don’t know who’s operating them, to this day we do not.” Her department oversees the FAA, which issues Part 107 waivers to drone operators, allowing them to fly at night or out of line of sight of the operator. The waivers (thousands have been issued) lack enough specifics to narrow down who might be responsible for mystery drones.

    A proposed FAA rule — open for public comment until March 2 — would require drones over 0.55 pounds to electronically transmit their location and ID, giving agencies access to information on drones in flight.

    The new remote ID requirement would help with the creation of the Unmanned Aircraft System Traffic Management System, a project between the FAA, NASA and other agencies to “ultimately identify services, roles and responsibilities, information architecture, data exchange protocols, software functions, infrastructure, and performance requirements for enabling the management of low-altitude uncontrolled drone operations,” according to the FAA.

    As of press time, no one has come forward to claim ownership of the drones. The public is encouraged to submit reports. As The X-Files’ Fox Mulder might say, “Watch the skies.”

  • Automated shipping moves containers with Locata

    Automated shipping moves containers with Locata

    At ION GNSS+ in September, I met with Nunzio Gambale and Paul Benshoeff of Locata. They were excited to share their news about the timing tests conducted at White Sands Missile Range by the U.S. Air Force’s 746th Test Squadron.

    In the January issue, we share the results of the tests. The two also showed me and Matteo Luccio, our contributing editor, a YouTube video highlighting another Locata project: guiding 100-ton robots around the Ports of Auckland, New Zealand.

    The robots are straddle carriers, giant mechanisms that are usually driven by a human. The carriers move and sort the shipping containers as they arrive from ships and leave via truck or train.

    In the new setup, Locata has made possible the elimination of the human element with nanosecond-precision tracking.

    Tom Scott, a former Sky One television host and now host of a series of YouTube shows, highlighted the robotic system in April 2019 on his “Amazing Places” channel.

    Screenshot: Tom Scott video
    Screenshot: Tom Scott video

    Compared to manned straddle carriers, the automated straddle carriers (A-STRADs) are able to stack the containers closer, higher and work more steadily, increasing the capacity of the limited land space at the port. The A-STRADs can stack containers with the accuracy of a few centimeters.

    The automated system also allows stack shuffling, so that wear and tear on the asphalt is spread more evenly and requires fewer repairs.

    The Locata local positioning system uses synchronized transmitters installed around the port, with two antennas on each straddle carrier using the lightspeed delay from each transmitter to find exact position. “They don’t just look at the timing signal itself, they track the phase of each transmitter’s carrier signal,” Scott explained.

  • Editorial Advisory Board Q&A: High-precision surveying and GPS III

    Editorial Advisory Board Q&A: High-precision surveying and GPS III

    What improvements will GPS III bring to high -precision surveying? When? Will these improvements require any changes in equipment and/or processes?

    Photo: Nearmap
    Tony Agresta, Nearmap

    “The biggest impact of GPS III to high precision surveying will be a full constellation of L5 satellites. Triple frequency will bring faster convergence times and better accuracy in more difficult conditions. GPS III will better align with Galileo and BeiDou with L1C which means better availability in restricted sky conditions. Users will want to have equipment capable of supporting these new signals, in antenna and receiver HW as well as the signal processing done on board.”
    Tony Agresta
    Nearmap


    Jean-Marie Sleewaegen
    Jean-Marie Sleewaegen

    “Of all the improvements brought by GPS III, the new L1C signal will probably have the biggest impact on high-precision surveying. Compared to L1 C/A, L1C brings better reception in difficult environments, improved availability thanks to the “pilot” component, enhanced resilience to jamming attacks, and better interoperability with Galileo, BeiDou and QZSS. Many receivers do support L1C already, but the benefits will become more tangible as the GPS III constellation grows.”
    Jean-Marie Sleewaegen
    Septentrio


    Members of the EAB

    Tony Agresta
    Nearmap

    Miguel Amor
    Hexagon Positioning Intelligence

    Thibault Bonnevie
    SBG Systems

    Alison Brown
    NAVSYS Corporation

    Ismael Colomina
    GeoNumerics

    Clem Driscoll
    C.J. Driscoll & Associates

    John Fischer
    Orolia

    Ellen Hall
    Spirent Federal Systems

    Jules McNeff
    Overlook Systems Technologies, Inc.

    Terry Moore
    University of Nottingham

    Bradford W. Parkinson
    Stanford Center for Position, Navigation and Time

    Jean-Marie Sleewaegen
    Septentrio

    Michael Swiek
    GPS Alliance

    Julian Thomas
    Racelogic Ltd.

    Greg Turetzky
    Consultant