“Diverse teams bring diverse ideas to the table, and that’s the best way to progress.”
So said Professor Sheila Rowan, the UK government’s chief scientific advisor to Scotland, opening the Royal Institute of Navigation’s 2019 International Navigation Conference. Professor Rowan’s comments set the scene perfectly. Success in navigation is no longer about just getting a fix, or even an accurate fix. To succeed as a system or application provider, diversity and collaboration are key, whether it be multiple disciplines and the skills that go with them, or a mix of ages, beliefs and backgrounds. So, what were some key messages to emerge from four days of working together?
John Pottle opens the 2019 International Navigation Conference sponsored by the Royal Institute of Navigation (RIN). (Photo: RIN)
More practical help for non-experts wanting to improve resilience in positioning, navigation and timing (PNT) is needed. The top request from delegates at the pre-conference short course was for more detailed and specific information on threats to PNT. Of particular interest were how to measure the impacts and test the merits of various mitigation approaches. In other words: how to assess risk? How to decide what steps to take?
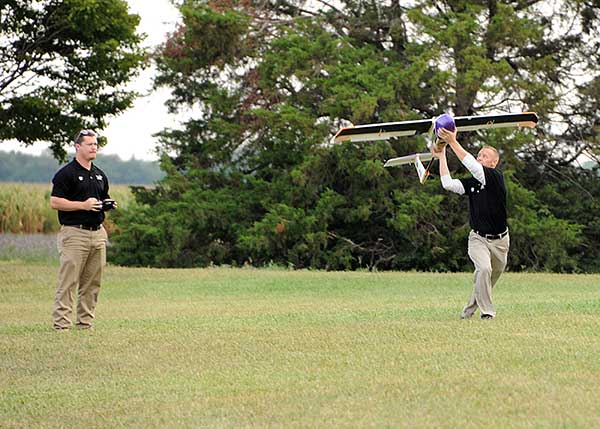
User acceptance and regulatory/legal structures for driverless vehicles are greater challenges than the positioning and communications technology. In the UK and across Europe, projects are under way to evaluate good practices for so-called “beyond line of sight” drone flights. For driverless cars, while huge strides have been taken to enable secure and resilient absolute and relative positioning, much remains to be done. Practical issues were highlighted, such as over-cautious vehicles and a tendency for driverless cars to make occupants feel more travel sick. So work needs to be done to avoid a stressfully slow and sickly experience.
Skills and knowledge are changing — and education/training needs to, too. A major developed-world problem is that the experts with experience who have seen generation after generation of technology evolution are now in their later careers or retired. Because of the wealth of knowledge vested in these individuals — we can all think of some, I’m sure — organizations have tended to over-rely on them. A key theme of the conference closing plenary was that the community wants to do more to collaborate — that word again — to define training needs and figure out how to deliver the skills that are needed today and tomorrow.
The next couple of years bring fewer, bigger navigation conferences in Europe. The European Navigation Conference (ENC) 2020 takes place in Dresden, May 11–14, organized by the German Institute of Navigation, DGON. ENC2021 will be combined with the triennial global congress of the International Association of Institutes of Navigation (IAIN), Nov. 15–18, 2021, in Edinburgh, organized by the Royal Institute of Navigation.
Please save the dates — joining these events is rewarding and stimulating as we work together toward a more navigable world.
John Pottle is director of the Royal Institute of Navigation.
At any given moment, more than 5,000 airplanes are flying over the United States. In a single year, nearly 778 million passengers will take to the skies — more than twice the population of the U.S., and the number increases each year. Aviation is the safest form of transportation. It is 100 times safer than driving. For every 100 traffic deaths, only one aviation related fatality occurs; and the Federal Aviation Administration (FAA) is working hard to make aviation even safer.
Safety is the FAA’s primary focus. The FAA Strategic Plan FY 2019– 2022 states its mission is to provide the safest, most efficient aviation system in the world. To achieve this goal, the FAA is implementing several initiatives. The technical aspects of these efforts fall under a framework called NextGen designed to modernize the nation’s air traffic control system. NextGen began in 2003 in the VISION 100 – Century of Aviation Reauthorization Act. At its core, NextGen is a geospatial framework with satellite navigation as its backbone.
The Geospatial Data Act (GDA) became law when President Trump signed the FAA Reauthorization on Oct. 5, 2018. You might have wondered how the GDA came to be included in the bill. It makes sense in the context of technology advancements towards a smart transportation network, specifically in aviation.
The smart transportation concept integrates all forms of transportation to provide economic and environmental benefits as well as increase safety and reduce wait times and congestion. A large part of smart transportation is based on geographic information technology. The aviation component of this smart transportation initiative falls within the FAA’s authority under the overarching framework named NextGen.
NextGen is an integrated concept improving the efficiency and safety of flight operations both on the ground and in the air. The use of geospatial technology enables precision time-management for controlling air traffic. The system allows each airplane to digitally coordinate with other aircraft in the area, taking into account such things as terrain and other known hazards to safely reroute air traffic as necessary. The FAA refers to this as trajectory-based operations. Those with a knowledge of GIS will recognize it as four dimensional: it calculates direction, speed, distance and time relative to position in x-y-z, and coordinates that information with other known data. Additionally, the system uses historical flight data and predictive analytics to maximize airspace for routing air traffic such as what is experienced during the holidays.
NextGen also uses a system called Optimal Profile Descents (OPD), which allows an airplane to trim its engines and descend along a glide slope from flight level into the airport. The point at which a plane begins its descent is a geospatial calculation to determine the precise point in space for the airplane based upon its altitude, weight, glide slope and distance to the airport. The benefits of OPD are reduced engine noise, fuel savings, less carbon emissions and a positive economic impact. NextGen is an across-the-board win for the airline industry, airline passengers, the economy and the environment.
According to an interview with Michael Whitaker, former deputy administrator of the FAA who was the Chief NextGen Officer, NextGen revolutionizes aviation by enabling digital data communication. It replaces radar-based navigation and tracking with satellite-based air traffic control. The cornerstone of NextGen is the Automated Dependent Surveillance Broadcast (ADS-B) system.
ADS-B is an aviator’s version of Waze, but with a lot more information. ADS-B(out) broadcasts an airplane’s Flight ID, ICAO Code, speed and location in three-dimensional space to air traffic controllers and to everyone who is equipped with ADS-B(in). The combination of ADS-B(out) and ADS-B(in) greatly increases situational awareness for aviators. On Jan. 1, 2020, all airplanes operating in controlled airspace needed to have ADS-B(out) installed. ADS-B transforms the entire National Airspace System into a satellite-based geospatial network. It integrates multiple sources of real-time data, such as weather, pilot reports, aircraft positions, 3D airspace information, and other sources of data, which can be overlaid on top of various basemaps and terrain elevation models, allowing pilots to make more informed and safer decisions.
Switching to ADS-B opens up more capacity in already crowded skies by decreasing the required vertical and horizontal separation distances between aircraft. At Hartsfield-Jackson International Airport, the busiest airport in the world, changing to performance-based operations allowed 8 to 12 more departures per hour; and in Memphis International Airport, one of the busiest airports for cargo operations, arrivals increased by 20%.
Rune Duke, senior director of government affairs, Airspace, Air Traffic and Aviation Security for the Aircraft Owners and Pilots Association (AOPA), said that ADS-B will allow much faster update rates for air traffic controllers on the order of once every second, compared to legacy radar systems that report positions every 8 to 12 seconds. For an airplane traveling at 350 knots, that is about 1 mile. A lot can change in a mile in densely packed airspace.
If you are reading this because of your love of maps and aviation, then I highly recommend the FlightAware and ForeFlight smartphone apps. FlightAware turns the phone into an ADS-B(in) receiver showing the location and flightpath of each aircraft in the immediate area on a basemap. I sit on my back deck and watch airplanes coming and going because I live under the flightpaths for Dulles International Airport, Reagan International Airport, Leesburg Executive Airport, the Montgomery County Airpark and the TERPZ waypoint. On occasion I see helicopters flying to Camp David because I am under that flight path as well.
So, I get to see a variety of aircraft. You can select the airplane icon to see information such as aircraft type, airline, Flight ID, departing and arrival airports, altitude, and groundspeed. Even more information is available by selecting the pop-up window. This is ADS-B information. ForeFlight, on the other hand, is a pilot’s flight bag on a tablet.
In the future, ADS-B will integrate Aircraft Hazardous Areas (AHA): temporary no-fly zones due to commercial space launches. Because of ADS-B, planes will automatically reroute around the AHA, and when the AHA expires, airplanes will be routed back through the area.
ADS-B supports evolving technologies such as remote towers, another significant change to air traffic control. Remote towers allow air traffic controllers to be at a location other than the actual airfield. Remote towers use a suite of sensors mounted at the airfield, including high-definition video, thermal and night vision that can be combined with the digital information provided by ADS-B, all of which is displayed on widescreen panels in a room duplicating the experience of being at the airport and directing aircraft. This allows smaller airports that cannot afford the huge expense of building and staffing an air traffic control tower to be part of a remote tower network. One remote tower center will be able to support several airfields. Leesburg Executive Airpark recently finished successful testing of one of the first remote tower operations in the United States.
“Over the next 10 years, we are going to see logistics and transportation open up, from being limited by currently rigid road infrastructure to operating on fully flexible and responsive aerial transportation networks,” said Patrick Watson, director of business development for Animal Dynamics.
The envisioned Platform Unmanned Cargo Aircraft. (Photo: PUCA)
ADS-B will also support the integration of unmanned aerial systems (UAS) into the airspace, specifically unmanned cargo aircraft (UCA). In the not too distant future, carrier air fleets without pilots or aircrew will be taking to the skies. UCAs do not require crews, so there will be no need for water, toilets, sewage containment, kitchens or a cockpit (in the traditional sense). Taking those out will allow for more space in the plane to carry cargo and fuel. Plus, without crews on board, there will be no time restrictions on crew hours — planes will be able stay aloft longer and travel further. ADS-B greatly enables the success of this technology.
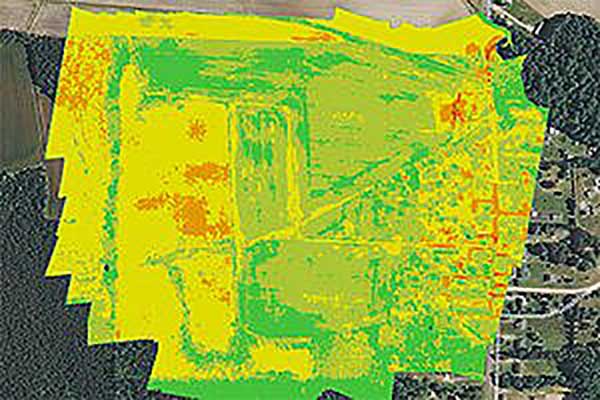
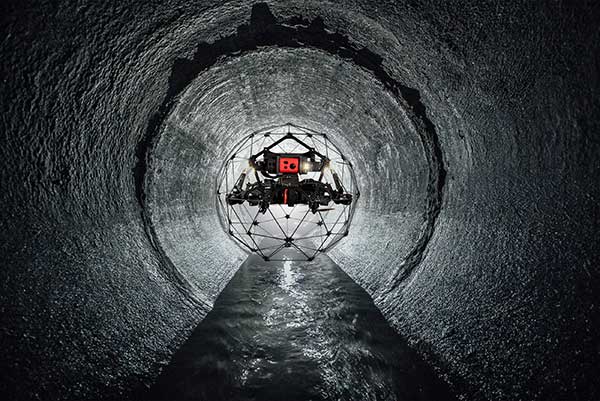
UAVs are finding places in the lives of more people than ever — farmers employing crop-spraying drones to counter a locust infestation in Pakistan, finding the way towards useful inspection tasks at an operating airport in the U.K., large airborne vehicles providing joy-rides around the U.S., and unfortunately showing up where they are not wanted so security staff have to use protection systems to deal with them.
Crop Spraying
New unmanned air vehicle (UAV) applications keep appearing. Once they do, they start to spread locally and even around the world. Crop management using UAVs has significantly progressed.
The U.S. has used crop spraying to improve crop yield for many years, defending against insect infestation and plant diseases. GNSS guidance systems for crop-spraying aircraft was an early satnav equipment application that eventually became a standard for any fliers contacted by farmers to apply pesticides to protect their crops. Then companies began offering turn-key spraying, which was highly efficient and effective.
UAVs are now entering this segment — they are capable of carrying higher capacity tanks, and autonomous/semi-autonomous navigation enables spraying with minimum supervision. This option is becoming more readily available to the farmer and costs less than using manned aircraft.
Both Japan and China have used UAVs extensively for crop spraying; other countries turning to the solution are Africa, the U.S. and India. In China, more than a hundred different types of UAV are in use in agricultural applications.
Farms around the mega-city of Karachi, Pakistan, have been infested by locusts, but the local government is short of the helicopters and ground applicators normally used for spraying pesticides. A recent graduate returning from his doctoral course in China brought with him knowledge of unmanned vehicle use in agriculture, and is urging rapid local adoption of UAV technologies to combat the locust infestation.
Pakistani agriculture expert Shahzad Nahiyoon claims that UAVs are better suited to crop protection for small farms within difficult contours of the surrounding region. They are less expensive to operate than manned fixed-wing and rotary aircraft, may be operated locally from outside spray contamination zones, and can spray in confined areas. Equipped with a 20-liter tank, spraying one or two 20-meter-wide swaths, 6 to 10 hectares per hour can be treated.
Drones at the airport
Growing a little weary of drone incidents around airports, I was pleased to see a report I had overlooked from a year ago which indicated that trials at Manchester airport in UK had demonstrated airport and drone compatibility. This basically happened because an Air Traffic Control (ATC) system for unmanned aircraft or Unmanned Traffic Management (UTM) was shown to keep drones flying around the airport under full control while integrated with regular airport and drone operations.
The trial — referred to as Operation Zenith — sponsored by the National Air Traffic Systems (NATS), made us of the GuardianUTM airspace management system, supplied by Altitude Angel, as the control system for eight trial drone missions at the airport. The drone UTM system was connected to the real-time Air Traffic Management (ATM) system which manages ground and air traffic at the airport, to ensure the control and safe separation of drones and aircraft. The UTM system also provided controllers with a real-time view of all operating drones.
The trial demonstrated the efficient regulation of drone traffic within and around the extremely sensitive airport region. Everyone engaged in the trial made use of real-time electronic map displays driven by the UTM system, showing everything flying in and around the airport; aircraft and drones. Drone pilots used this information to ensure their operations remained safe while operating so close to commercial aircraft in the air and on the ground.
NATS has now formed a strategic partnership with Altitude Angel to deliver this integrated UTM system at airports in the United Kingdom. The UTM system has successfully completed initial pilot trial and evaluation and now NATS intends to further demonstrate UAV management control at six U.K. airports later this year.
Thousands sign for ride with Lift Aircraft
Hexa in flight (Photo: Lift)
Lift Aircraft unveiled its 18-rotor Hexa unmanned/manned aircraft more than a year ago — what’s new now is that 13,000 people have signed up to take one for a ride.
The large drone weighs in at 432 pounds and can fly for 10-15 minutes with a single passenger.
The Hexa is controlled by a single joystick, and an onboard iPad provides route guidance and manages take-off and landing. Classed as a powered ultralight air vehicle, it can be flown without a pilot’s license, so Lift announced that it will offer Hexa flights to anyone wanting to fly (in 25 selected U.S. cities) provided they physically fit into it and weigh less than 250 pounds.
Lift intends to map each recreational flight area in 3D, and plug this map into the vehicle control system. The 13,000 people who signed up can expect to pay $125-250 for each joy ride. Lift has yet to announce the first location where the fun rides will take place.
Counter-UAS system downs drones in Philippines
The Southeast Asian Games were recently held in the Philippines with thousands of participants from eleven countries of Southeast Asia — the event was spread across 23 cities around the country. However, a number of uninvited drones showed up during the opening ceremonies on November 30th to take a look, but fortunately all were quickly dispatched.
The DroneShield counter-UAS system had been deployed in advance for protection of the event, and the local security forces used the system to detect and disable the invaders. According to the company, security personnel found the drones using body worn RF detection devices, and the Dronegun was then used to disable them.
Jamming the control link and GNSS L1 and L2 frequencies, UAVs are generally stopped in mid-flight when illuminated by the rifle-like device. DroneNode jammer in a suitcase was also used to provide blanket protection over a 1km circular area when the alarm was raised.
In all, seven unauthorized drones were disabled, some of which were apparently flying near the intended flight path of the helicopter bringing President Rodrigo Duterte to the opening ceremony.
Summary
It might seem a little ridiculous that we’ve had to come up with systems to counter uninvited or malicious drones (C-UAS). Making provisions for protection is probably something most sensitive facilities will have to do. Its possible that governments may already be investing in such technology to protect many facilities. More drones available for useful, productive and even recreational applications means some can end up in the wrong hands.
Nevertheless, good stuff comes out of drone applications, and the benefits seem to by far outweigh the need to protect ourselves against bad actors.
What is or would be the best policy response from Congress and/or executive branch agencies to the growing threats to GPS from jamming and interference?
Brad Parkinson
“Homeland Security has declared GPS to be an essential system to virtually all of our infrastructure. It is time to install a national system to identify and shut down interference. As part of that, all cell phones should periodically report interference to that national system and allow law enforcement to pinpoint and eliminate offenders.”
-Bradford W. Parkinson
Stanford Center for Position, Navigation and Time
Allison Brown
“On Dec. 5, 2018, the president signed into law the National GPS Timing Resilience and Security Act tasking the Secretary of Transportation with establishing a backup timing system for GPS within two years. To date, only limited technology demonstrations have been performed. Congress needs to fund the Department of Transportation to rapidly acquire and deploy a back-up timing capability, using available commercial solutions, to assure resilience within the Air Traffic Control system and other critical infrastructure to GPS jamming or spoofing.”
-Alison Brown
NAVSYS Corporation
Members of the EAB
Tony Agresta Nearmap
Miguel Amor Hexagon Positioning Intelligence
Thibault Bonnevie SBG Systems
Alison Brown NAVSYS Corporation
Ismael Colomina GeoNumerics
Clem Driscoll C.J. Driscoll & Associates
John Fischer Orolia
Ellen Hall Spirent Federal Systems
Jules McNeff Overlook Systems Technologies, Inc.
Terry Moore University of Nottingham
Bradford W. Parkinson Stanford Center for Position, Navigation and Time
Europe’s scattered monitoring of GNSS signals found almost 500,000 interference events over three years. About 59,000 were clearly intentional. European standards for resilient receivers have been published and acquisition of an interference detection network is underway.
Russia is improving its terrestrial Loran/Chayka PNT system for military use and has promised to make the upgraded service available to civilians.
China has retained its terrestrial Loran PNT system as an augmentation/backup for its BeiDou GNSS. It is also testing PNT satellites in low earth orbit (LEO) to provide more powerful and reliable signals than available from current GNSS.
In contrast to the actions of other countries, little is being done in the United States to protect civilian GPS/GNSS users.
The U.S. Department of Defense (DoD) has been very active protecting its own with GPS M-code signals and receivers. It is exploring use of LEO communications satellites and high-powered, low-frequency ground transmissions, such as Loran, to add to the GPS signals.
Yet DoD claims civilian use of GPS has limited its ability to use it as a military tool. It says it has no intention of sharing any new PNT systems with civilians.
At the same time, the 99% of GPS use in the U.S. that is non-military is arguably more important to the nation’s safety and security. GPS signals are used by every networked technology and every mode of transportation. They are so important that officials at the Department of Homeland Security have called GPS “a single point of failure for critical infrastructure.”
The U.S. military recently updated its PNT strategy, has a designated leader for its PNT efforts, and clearly defines the responsibilities of its various staffs and organizations.
Civil agency responsibilities were last updated in 2004 and are spread across more than a dozen departments, agencies, and staffs.
Most significantly, no one is in charge.
This has meant that over the past 15 years, many of the civil mandates and responsibilities to protect signals and users have gone unfulfilled. As just one example, rather than ramp up to address increases in jamming, the Federal Communications Commission has reduced its enforcement equipment and staff.
Putting someone in charge is key to reversing America’s civil PNT decline and energizing both federal and private stakeholders.
A single, empowered federal leader should be responsible, not for doing everything, but for leading and coordinating federal and other civil efforts. This would be someone to be held accountable, and to hold others accountable — an evangelist for the essentiality of these services, and their advocate at the highest levels of government.
Such a leader should be positioned outside the daily turmoil of the White House and National Security Council. They should be in the civil department with the portfolio that most depends on GPS and other PNT. The one that suffers first when GPS and other PNT are not available — the Department of Transportation (DOT).
DOT is already the federal interface with civil GPS users, and co-chairs the national PNT executive committee with DOD. A few edits to national policy and a few staff reassignments could establish a national PNT leader in DOT and make all the difference.
Regaining U.S. PNT leadership is essential to America’s future security and prosperity. We must take the first step by appointing and empowering a single federal leader to make it happen.
The National Geodetic Survey (NGS) has published a technical report that describes options for how NGS can implement a time-dependent geopotential datum and thus a time-dependent geoid model. My last column described the latest version of NGS’ VERTCON model. As mentioned in the column, NGS is developing these models and tools to support the implementation of the North American-Pacific Geopotential Datum of 2022 (NAPGD2022).
NAPGD2022 is going to be a time-dependent geopotential datum. In other words, the reference geopotential will change over time and therefore the geoid height value will change over time. NAPGD2022 was described in detail in NGS’ publication “Blueprint for 2022, Part 2: Geopotential Coordinates,” and my December 2017 column. Blueprint for 2022, Part 2 states that a gridded geoid model GEOID2022 will be created and it will contain two components:
The first component will be time independent, denoted as the Static Geoid model of 2022 (SGEOID2022).
The second component will be a time-dependent geoid undulation model, encompassing permanent geoid changes greater than or equal to 1 millimeter per year, denoted as Dynamic Geoid model of 2022 (DGEOID2022).
NGS will publish a GEOID2022 value that will be based on both SGEOID2022 and DGEOID2022. As stated in the document, GEOID2022 will be the official zero-height surface for orthometric heights within NAPGD2022, and thus within the NSRS. The box titled “Excerpt from Blueprint for 2022, Part 2, Figure 10-2” is a diagram that describes the process of creating the regional high resolution gridded GEOID2022 model. I have highlighted the GEOID2022 model and its two components, SGEOID2022 and DGEOID2022.
Excerpt from Blueprint for 2022, Part 2, Figure 10-2
Image: National Geodetic Survey
First, it’s important to note the role of the geoid in estimating GNSS-derived orthometric heights. As described in a previous column, GNSS-derived Orthometric Heights are computed using the following formula: orthometric height (H) = ellipsoid height (h) minus geoid height (N). See the box titled “NAPGD2022 GNSS-Derived Orthometric Height.”
NAPGD2022 GNSS-Derived Orthometric Height
Source: Slide 9 from Gillins and Fancher presentation titled “Leveling after 2022” presented at the 2017 Geospatial Summit
So, what does it take to compute a time-dependent geoid model and what is NGS’ plan to accomplish this project The technical report titled “ A Preliminary Investigation of the NGS’s Geoid Monitoring Service (GeMS)” describes options for how NGS can implement a time-dependent geopotential datum and thus a time-dependent geoid model (See box titled “NGS Publishes Report on GeMS”). The report contains too much information for a single column. This column will highlight some of the sections of the report. The document does contain a lot of technical information and I would encourage everyone to download the document.
The technical report describes the current state of knowledge and outlines next steps required to define a time-dependent geopotential datum for the Nation. NGS created a project called “The Geoid Monitoring Service,” or simply GeMS, to accomplish their long-term goal of establishing a time-dependent geopotential model.
The report addressed the following five topics:
A foundational introduction to the various types of geophysical phenomena that are causing both size and shape change to the geoid,
Geodetic observing techniques that are presently available to monitor geoid change,
An objective evaluation of NGS’s current ability to incorporate these techniques into a long-term monitoring service like GeMS,
Known barriers to accomplishing such a project, and
Potential observing techniques that might become available in the next 10-20 years, but are not currently mature enough for operational use.
The document presents a roadmap of options for how NGS could realize a time-dependent geopotential datum, and how NGS can support the dynamic datum into the future with independent validation surveys and datasets.
The report discusses the available geoid monitoring techniques that NGS has to support modeling the changes in the geoid. There are three existing NGS program areas and associated technical expertise that could be utilized in an operational GeMS:
NGS’s Gravity Program,
the NOAA CORS Network, and
GPS/geodetic leveling campaigns.
It is noted that individuals these techniques cannot provide 100% of what GeMS requires but combining various programs would be sufficient. The report does a great job of describing these three program areas. The box titled “Summary of Geoid Monitoring Techniques within NGS’ Current Expertise” is Table 3 from the Technical Report. The table list the affordability and accuracy attributes for each of the program areas. NGS’ Gravity Program provides high quality gravity data to internal and external stakeholders. The program provides gravity data required for NGS’s geoid modeling.
Summary of Geoid Monitoring Techniques within NGS’ Current Expertise
Source: National Geodetic Survey
The report provides a good overview of the expertise and instrumentation of NGS’ Gravity Program. The table titled “Summary of NGS’ Terrestrial Gravity Instruments” is a compilation of information on historical methods and instrumentation from the technical report.
Summary of NGS’ Terrestrial Gravity Instruments
FG5 Absolute Gravimeter. The FG5(X) absolute gravimeter is manufactured by Micro-g LaCoste Inc. in Lafayette, Colorado. It is currently the highest-accuracy, commercially-available absolute gravity meter, with an accuracy of about ±2 μGals. NGS owns and operates instrument number FG5X-102. (Source: National Geodetic Survey)
A10 Absolute Gravimeter. A field deployable version of the laboratory FG5 absolute gravimeter, was developed by Micro-g LaCoste in the early 2000’s. This instrument, now known as the A10, operates on principals nearly identical to the FG5 free fall gravimeter. However, the laser used in the A10 system is not a primary standard due to the low power and fragile nature of the Iodine based laser, and does need to be calibrated routinely. (Source: National Geodetic Survey)
Scintrex CG-6 Relative Gravimeter. The Scintrex CG-6 relative gravimeter is the newest generation of the CG line of quartz sensor relative gravity meters. The CG-6 (like its predecessors the CG-3 and CG-5) operates on the same fundamental theory as the LaCoste and Romberg G and D relative gravimeters, but uses a quartz sensor spring instead of a metal sensor. The primary advantage of a quartz sensor is its insensitivity to instrument shock or vibration that can cause offsets in the gravity measurements. (Source: National Geodetic Survey)
LaCoste and Romberg Relative Gravimeter. LaCoste and Romberg (L&R) relative land, air/sea, borehole, and tidal gravimeters have been manufactured by LaCoste and Romberg Gravity Meters, Inc. since 1959. The company later merged into Micro-g LaCoste, Inc., and the LaCoste land gravimeters were discontinued. Unlike the Scintrex gravimeters, these rely on metal zero-length-springs. (Source: National Geodetic Survey)
Superconducting Cryogenic Gravimeter. A superconducting cryogenic gravimeter is designed to be continuously monitor relative changes in the local gravity over time. It main applications include precise tidal analysis, ground water monitoring, and geodynamics. The precision of an SG is still unmatched by any other instrument at better than 0.1 μGals at short time scales. (Source: National Geodetic Survey)
gPhoneX Gravity Meter. The gPhoneX, manufactured by Micro-g LaCoste, is a low (linear) drift, metal spring-based gravimeter. Like the SG, it is designed to measure relative changes in gravity over time, at a fixed location. While not as precise as the SG at short time scales; at periods of longer than a few hours, the noise characteristics of the two instruments are quite similar. The advantages of a gPhoneX compared to a SG for long term monitoring include lower cost, lower power consumption, increased portability, and lack of a requirement for maintaining superconducting temperatures. (Source: National Geodetic Survey)
JILAg Absolute Gravimeter. The AFGL, JILA/IGPP and JILAg series of absolute gravimeters are the out-of-production predecessors to the FG5 gravity meter. These instruments were developed by James Faller and colleagues beginning in the mid-1970s, and were crucial for defining and providing the basis for the IGSN71, NGSGN, and other scientific projects. Agency (now NGA), the University of California at San Diego (IGPP), and NGS. (Source: National Geodetic Survey)
The document highlights something about the United States gravity data that most users don’t think about. That is, gravity values are referenced to a gravity network just like NGS’ published orthometric heights are referenced to the NAVD 88. In the mid-1950s, a coordinated effort was initiated by the International Association of Geodesy (IAG) to make gravimeter ties throughout collaborating parts of the world to support establishment of an International gravity datum.
It incorporated intercontinental, north-south, calibration lines and long-distance ties established by airplane. The majority of USA relative gravimeter work was done from 1965 – 1967, resulting in the network shown in the box titled “International Gravity Station Net of 1971 (IGSN71) in CONUS.” The report states that the calculations were completed by Urho A. Uotila of The Ohio State University around 1970.
The gravity network was constrained by a network of ballistic absolute gravimeters. Five of the eight absolute gravimeter sites were in CONUS. It was a world-wide, simultaneous adjustment and published as The International Gravity Standardization Net 1971 (I.G.S.N. 71). A
s of December 2019, the IGSN71 remains the official international gravity datum. Many of these stations have been destroyed over the decades, in particular those at passenger airport terminals.
International Gravity Station Net of 1971 (IGSN71) in CONUS
Figure 14: IGSN71 Gravity Stations. (Source: National Geodetic Survey)
In the mid-1970s, NGS was involved in two major readjustment projects, replacement of NAD27 with NAD 83 and the replacement of NGVD 29 with NAVD 88. At the same time, the NGS gravity group were evaluating the gravity data in NGS database and the gravity stations involved in the IGSN71. During the period 1975 and 1979, NGS and NGA (formally DMA) performed relative gravity surveys around CONUS to evaluate the stations.
A report by Robert Moose titled “The National Geodetic Survey Gravity Network” published by NGS in 1986 documents the results of the surveys. This network is denoted as the National Geodetic Survey Gravity Network (NGSGN) and depicted in the box titled “National Geodetic Survey Gravity Network (NGSGN) in CONUS.” The NGSGN was constrained by 8 absolute gravimeter stations and consisted of 232 stations. Differences between NGSGN values and IGSN71 values were computed to evaluate or detect change in gravity values.
The box titled “Gravity Differences between NGSGN and IGSN71 Common Stations” depict these differences. The report states “In summary, the gravity differences between NGSGN and IGSN are generally small and many of the larger differences may be due to vertical motion.
National Geodetic Survey Gravity Network (NGSGN) in CONUS
Figure 16: Difference between NGSGN and IGSN71 AG values [mgal] (Source: National Geodetic Survey)The basic rule of thumb for estimating land movement using gravity changes is: 1 meter of change equals 0.3086 mgals (1 cm of change equals 0.003086 mgals). It should be noted that a positive difference in gravity in the figure indicated apparent subsidence. As stated by the 1986 report by Moose, the large difference in Houston-Galveston region is most likely due to subsidence.
A report documenting the apparent movement in the Houston-Galveston region was published by NGS in 1980. The boxes titled “ Estimate of Subsidence in Houston-Galveston Area During 1963-78 Epoch” and “Estimate of Subsidence in Houston-Galveston Area During 1973-78 Epoch” provide estimates of the movement in the region that include the same epoch of the two gravity networks. These two plots agree with the summary statement in the 1986 report.
Estimate of Subsidence in Houston-Galveston Area During 1963-78 Epoch
NOTE: 30 cm approximately equals to 1 foot (Source: National Geodetic Survey)
What does all this mean to the geoid? Accurate and current gravity data are critical to the development of an accurate geoid model that includes estimating changes in the geoid model over time.
The technical report on NGS’ Geoid Monitoring Service (GeMS) describes geodetic and geophysical techniques that are currently known to NGS and show promise for GeMS (see the box titled “Summary of Known Geoid Monitoring Techniques that are currently outside of NGS’s Expertise). It should be noted that all of these techniques rely on a non-NGS entity to create a product (such as a model or dataset) that NGS can utilize in their products and services. This is nothing new; NGS leverages partnerships for other products such as the GOCO05S satellite gravity model produced by an ESA consortium led by the Technical University of Munich. This model is used by the NGS geoid team in static geoid modeling.
Summary of Known Geoid Monitoring Techniques that are currently outside of NGS’s Expertise
(Source: Table 7 from Technical Report NOS NGS 69)
Continuation of Summary of Known Geoid Monitoring Techniques that are currently outside of NGS’s Expertise
(Source: Table 7 from Technical Report NOS NGS 69)
As apparent by all of the types of data required to monitor the geoid, NGS has a challenging task to establish a Geoid Monitoring Service. Why is it important to invest resources to monitor the geoid? Analyzes of temporal satellite gravity missions provide changes in gravity values that can be use to create changes in the geoid. The GRACE (Gravity and Climate Experiment) satellite mission was designed to provide the temporal gravity field variations throughout its mission (duration 2002 – 2017). There are analysis centers that produce models using the GRACE data – University of Texas at Austin Center for Space Research (UTCSR), NASA Jet Propulsion Laboratory (JPLEM), and GFZ German Research Center for Geosciences (GFZOP). Release 6 denoted as RL06 is the most current GRACE data from these groups.
The data can be used to illustrate the magnitudes and resolutions that GRACE models provide to the seculargeoid rates for CONUS and Alaska. The boxes titled “GRACE Trend over CONUS from UTCSR RL06” and “GRACE Trend over Alaska from UTCSR RL06” are plots from Technical Report NOS NGS 69 that show these secular geoid trends from UTCSR-RL06. The plots indicate very small changes in the geoid but they are significant if the goal is to monitor the geoid model to the mm/year level.
GRACE Trend over CONUS from UTCSR RL06
Figure 27: GRACE Trend over CONUS from UTCSR RL06 Model [mm/yr] (Source: Figure 27 from Technical Report NOS NGS 69)
GRACE Trend over Alaska from UTCSR RL06
Figure 28: GRACE Trend over Alaska from UTCSR RL06 GRACE Model [mm/yr] (Source: Figure 28 from Technical Report NOS NGS 69)Another product available from various processing centers are surface mass concentrations (mascons) as observed by the GRACE satellites. Once again, these mascons can be used to generate a secular geoid rate. The boxes titled “Geoid rate over CONUS based on the GSFC mascon model” and “Geoid rate over Alaska from GSFC mascon model” are plots from Technical Report NOS NGS 69 that provide the secular geoid rate based on the NASA GSFC mascon model. Once again, the plots indicate very small changes in the geoid but there is a systematic change to the geoid based on the analysis of the data from the GRACE mission.
Geoid rate over CONUS based on the GSFC mascon model
Figure 32 From Technical Report NOS NGS 69: Geoid rate over CONUS based on the GSFC mascon model [mm/yr] (Source: Figure 32 From Technical Report NOS NGS 69)
Geoid rate over Alaska from GSFC mascon model
Figure 33 From Technical Report NOS NGS 69: Geoid rate over Alaska from GSFC mascon model [mm/yr] (Source: Figure 33 From Technical Report NOS NGS 69)The report stated that when considering monitoring the geoid, the greatest change to the geoid from glacial isostatic adjustment (GIA) processes is centered in northern Canada, but there is “still a significant geoid height trend in the Northern Plains, Great Lakes, and Northeast regions of CONUS.”
It was noted that if GIA processes are not considered, a 1 cm error in the geoid undulation would occur within 18 years. NADGPD2022 orthometric heights are going to be established using a NATRF2022 ellipsoid height and a GEOID2022 geoid height. This is why the geoid needs a time-dependent component.
This column highlighted NGS new Geoid Monitoring Service (GeMS); and, that NGS’ will be publishing a gridded geoid model GEOID2022 that will contain two components:
The first component will be time independent, denoted as the Static Geoid model of 2022 (SGEOID2022) and
The second component will be a time-dependent geoid undulation model, denoted as Dynamic Geoid model of 2022 (DGEOID2022).
NGS will publish a GEOID2022 value that will be based on both SGEOID2022 and DGEOID2022. The column provided examples of how GRACE data can be used to illustrate the magnitudes of secular geoid rates for CONUS and Alaska.
A new digital signal generator that can be reprogrammed on-orbit, enabling it to broadcast new signals
Digital signatures for detecting spoofing attacks
Steerable regional beams in multiple frequencies and signal codes
“Bounce-Back” capabilities for recovery from attack, solar and other disruptions
The NTS-3 marks the first time in 40 years the service has launched such a pioneering effort, following GPS.
The Department of Defense PNT Strategy calls for future military efforts and the results to be classified, making it unlikely that NTS-3 experiments will benefit the majority of PNT users in the civil sector.
A lot has happened in the world of unmanned aircraft over the last several weeks, and this month we’ve captured a cross-section of news that illustrates the variety of applications and goings-on across the industry. These include:
drone delivery to a nuclear submarine,
Uber Eats launching a new delivery drone,
a new heavy-lift UAV,
Chinese DJI drone use banned by the U.S. interior department,
the Grand Sky facility in North Dakota demonstrating control of a NASA Global Hawk over California,
runway inspection using drones at an airport in Canada, and
a drone-of-sorts completing 780 days in orbit.
Package delivery to USS Hawaii (Photo: U.S. Navy/Mass Communication Specialist 1st Class Michael B. Zingaro)
Submarine delivery. The University of Hawaii and the U.S. Navy recently tested out a new way to supply an operational nuclear sub with a few essential items while the Virginia-class fast-attack submarine USS Hawaii was off the West coast of Oahu. A five-pound package of circuit cards, medical supplies and food too – which someone surely must have snuck in — was delivered using a Skyfront Perimeter gas-powered hybrid drone. The UAV has five-hour endurance, easily flying just one mile out to sea and back to complete the test delivery on Oct 10.
The package was lowered on a cable from the Perimeter drone and captured by a ‘snag’ pole extended off the sail of the submarine. This timely small package delivery to an underway sub has apparently led to the creation of the submarine force’s first UAV squadron in the Pacific, according to the Navy.
Uber Eats. Uber Eats has been testing food deliveries from McDonald’s near San Diego State University, and has just announced a new 6-rotor vertical take-off delivery drone it plans to use for more test deliveries next year in San Diego.
Uber Elevate delivery drone (Photo: Uber)
The ideal delivery profile for this drone is a meal for two picked up from a restaurant six miles away from dispatch in eight minutes, another six miles to make the delivery and then six miles to return to base — maybe less than 20-30 minutes all told. However, they have an intermediate drop-off to a ground-based delivery driver who then travels to the customer’s door to actually deliver the food. This process contrasts with Amazon’s approach — they are planning to lower packages on a cable directly to the customer – but food delivery might actually need a guy in a truck knocking on your door with hot food.
Heavy-lift drone. The Heavy-Lift VoloDrone, manufactured by Volocopter in Germany, flew for the first time in October. Targeted at the logistics sector, its anticipated that the large UAV may also find applications in agriculture, and other operations where a large – up to 440 pounds – payload is required. Velocopter has so far focused on unmanned air-taxi transports, but the larger scale involved in people transport appears to have spun off into a heavy-lift derivative UAV.
Christoph Hommet, chief engineer, with the heavy-lift VoloDrone. (Photo: Volocopter)
The VoloDrone is a powerful, fully electric, heavy-lift utility drone which is anticipated to have a range of up to 25 miles carrying a 440-pound payload. The rotor area has a diameter of 30 feet and the vehicle is 7.5 feet high. It can be remotely piloted or can fly autonomously on pre-set routes.
Loads can be carried between the legs of the landing gear on standard rack mounts or slung below, or a tank and sprayer could be fitted for agricultural applications. The 18 rotor multicopter platform uses swappable lithium-ion batteries and an in-house flight control system, and benefits from existing development and test of the air-taxi Velocopter.
Anywhere ground transportation or construction operations are challenged by difficult access, the VoloDrone might assist by providing an airborne option. It is designed as a universal air-lift vehicle which may be adapted to different use cases by the addition of special-purpose accessories.
Examples of VoloDrone load configurations. (Photo: Volocopter)
DJI drones barred. The U.S .Interior Dept. (DoI) has barred the use of DJI dones, except for emergency purposes. With a combined department fleet of over 800 drones, around 15% are supplied by Chinese manufacturer DJI.
Amid the on-going trade war between China and the U.S., members of Congress have grown increasingly concerned about American use of Chinese technology – whether DJI drones, or Huawei networking equipment. Recently Congress has proposed the American Drone Security Act to limit Government agencies’ use of Chinese equipment.
In anticipation of this issue DoI has already been working with DJI for over 15 months to identify possible security gaps in drone design, and DJI has come up with a “Government Edition” software load which ensures data is only gathered and stored on-board the drone and is isolated and downloaded for only DoI use after each flight — data transmission has been eliminated as a possible source of data leakage. DJI even volunteered to partial manufacture in the US. Therefore, DoI had previously resisted Congressional pressure to discontinue use of its fleet of DJI drones.
Nevertheless, DoI Secretary Bernhardt has ordered that Chinese drone use be now discontinued until an internal review is completed. In the meantime, DJI drones may only be operated by DoI for emergency purposes, “such as fighting wildfires, search and rescue, and dealing with natural disasters that may threaten life or property.”
NASA Global Hawk UAV (Photo: NASA/Tom Miller)
Large BVLOS drones. The Grand Sky Beyond Visual Line of Sight (BVLOS) facility in North Dakota has become an operational base for large UAVs, including the General Atomics’ Predator and Northrup Grumman’s (NG) Global Hawk. The Grand Sky facility is immediately adjacent to Grand Forks Air Force Base, where the RQ-4 Global Hawk high altitude, long endurance autonomous aircraft is based.
In order to offer full operational capability to its intended customer base at Grand Sky, Northrup Grumman is building a hangar and has also established a Transportable Operations Center (TOC) in its Grand Sky Mission Control Center. It was through this TOC on October 10th that NG was able to take control of an in flight Global Hawk mission in California.
A NASA crew in California had managed the take off and flight of their Global Hawk from the NASA Armstrong Flight Research Center (AFRC) on Oct. 10, 2019. During the mission, the flight team at Grand Sky took over control of the aircraft and executed a series of flight maneuvers to demonstrate the operational capability of the TOC. This capability is key for the Grand Sky facility to become fully operational.
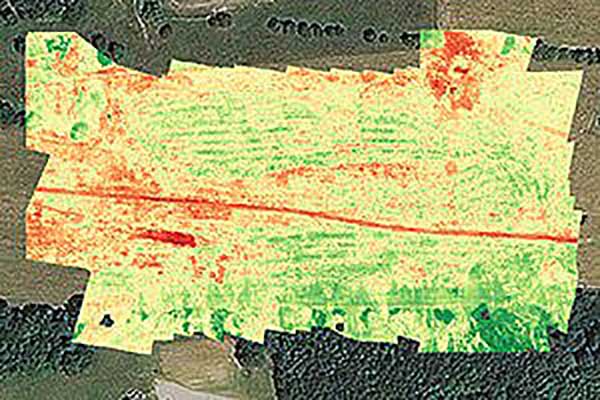
A Microdrone md4-1000 used in the surveys at EIA. (credit: EIA)
Runway inspection. Drones are never allowed to operate anywhere near an active airport, so it’s something of a switch to learn that the Edmonton International Airport (EIA) in Alberta, Canada , OK with operating a drone within the confines of the airport. Fortunately it’s a case of improving the safe operation and maintenance of the extensive runway infrastructure at the airport.
EIA has two million square feet of runways, taxiways and aircraft handling aprons which are all subject to wear by aircraft and suffer from the harsh weather extremes which are common in Canada. Therefore regular maintenance inspections are mandatory. Undertaking inspections manually in the past could take days to perform, so EIA adopted the use of drones to complete inspections much quicker and with higher accuracy.
The Microdrone md4-1000 drone is flown by Canadian company AERIUM to collect Lidar (Light Detection and Ranging) data and photographic/video imagery of EIA’s runways. The data collected is used to more accurately predict when to conduct preventative maintenance on ground infrastructure used by aircraft. Drone operations were approved by Edmonton Airport in collaboration with Nav Canada and AERIUM. EIA has previously flown a drone to minimize the number of birds on the airport during aircraft movements and in the process conducted the first-ever drone night flight at the airport.
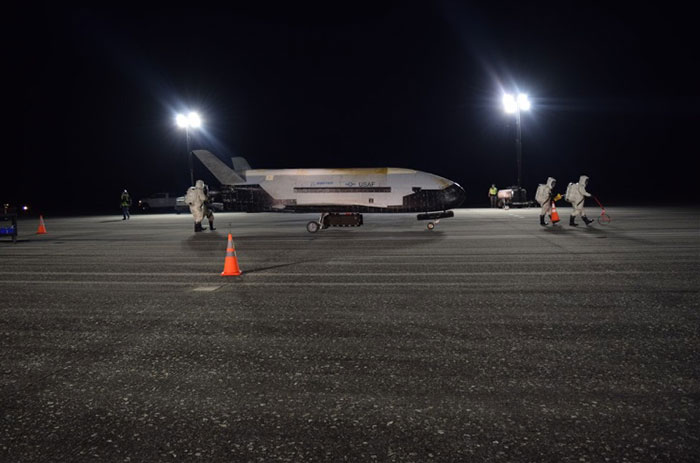
A X-37B lands at the Kennedy Space Center. (Photo: USAF)
X-37B orbital vehicle. Finally, the daddy-of-all applications for remotely piloted vehicles became more apparent on Oct. 27, at 3:51 in the morning when the U.S. Air Force’s X-37B Orbital Test Vehicle successfully landed at NASA’s Kennedy Space Center Shuttle Landing Facility after 780 days on orbit.
The fifth mission was launched on Sept. 7, 2017 from Cape Canaveral Air Force Station, Florida by a SpaceX Falcon 9 booster. Looking like a miniature version of one of the retired Space Shuttle fleet, the X-37B is managed by the Air Force Rapid Capabilities Office, and ‘performs risk reduction, experimentation and concept of operations development for reusable space vehicle technologies.’ Long endurance stuff – the previous flight lasted 718 days. “This mission successfully hosted Air Force Research Laboratory experiments, among others, as well as providing a ride for small satellites,” said an Air Force spokesman.
The X37B provides a unique capability to test new systems in space and return them to Earth and enables the U.S. to more efficiently, effectively and rapidly develop evolving space capabilities. The U.S. Air Force is preparing to launch the sixth X-37B mission in 2020.
Final thoughts. As drones chug steadily along the path towards a rapid airborne delivery system, urgent deliveries to both submarines and hungry people ordering food are making progress. Heavy-Lift capability is evolving out of air-taxi research. The effects of trade wars and security concerns are touching established drone operations. We can now control huge aircraft remotely from almost anywhere. Runway inspection is being automated just like any other drone inspection/surveillance mission, and remote space operations are now regular practice.
It’s an expanding world of applications for drones, with many more different and perhaps unanticipated ones yet to come.
Pyramids of Giza taken from the International Space Station. (Image: NASA)
The Great Pyramids still cast their long shadow upon history. It’s been said that even Time kneels before them. They are monuments to the state-of-the-art technology of the builders using their most advanced astronomy, engineering, mathematics and trigonometry as a testament to their understanding of the world.
They are monuments to the builder’s state-of-the-art technology at the time using their most advanced astronomy, engineering, mathematics, and trigonometry as a testament to their advanced understanding of the world.
The pyramids’ corners align perfectly to the four cardinal points. Shafts on the north slope point towards the circumpolar stars, the so-called “Imperishable Ones” because they never set beneath the horizon. The Great Sphinx, eternal companion of the pyramids, is perfectly aligned to face the rising Sun on the morning of the summer solstice.
These constructs defined the physical framework of their cosmogony — ancient Egypt’s center of the world — their prime meridian and equator. References of place were in terms of direction and distance from the pyramids.
The word meridian is a Latin derivative of meridiem, as in a.m. and p.m., meaning midday. The moment is marked by the sundials’ shadow being neither to the west nor to the east and is directly in the middle. It marks an imaginary line running from north to south. The Prime Meridian is synonymous with Greenwich Mean Time (GMT), Universal Time Coordinate (UTC), or the military time zone Zulu.
In Mesopotamia in 600 B.C. is a map carved into a clay tablet depicting Babylon in the center surrounded by a circular ocean marking the edge of the known world. Beyond the ocean are eight projections emanating like sunrays. Four of them point to the cardinal directions and the other four towards celestial bodies with mythological significance.
This map, called the Bitter Waters, the name of the circular ocean, is considered the oldest in the world; and thus, the first official cartographer forged together the geography of the physical world with that of the cosmos.
Early maps had few frames of reference. If you wanted to know your whereabouts, you had to already know where you were, otherwise, you’d need the expertise of a seasoned guide.
Celestial bodies were the primary means for finding one’s way, the main one being the Sun, especially at daybreak. In fact, for thousands of years the importance of the sunrise was so essential to getting oneself pointed in the right direction that to this day it remains the principle word for that action.
Consider the following. The way a map is pointed is how it is oriented. If someone is lost, physically or consciously, that person is disoriented. The skill of traversing overland is orienteering. These all stem from the Latin word for east, orientalis; hence, the civilizations beyond Byzantium were considered the Orient, and likewise, the word Asia comes from the Phoenician word for sunrise, Asu. Thus, setting out on a journey required waking up with the sunrise and marking the direction of the shadow and then dead reckon along that line due west, or opposite the line due east.
In fact, many ancient maps were oriented toward the east such as the Mappa Mundi mentioned later in this article. At night, the North Star and knowledge of the constellations were used for travel; but during the day, north was just a general direction. North was derived by drawing a right angle perpendicular to the line between the two points of sunrise and sunset. The term for North under Roman rule was pars caeli septentrionalis, which translated means, The part of the sky towards the seven stars, referring to Ursa Major and Minor. North was not of much use during the day until the invention of the magnetic compass.
The Early Superpowers and the Great Sea Race
The trade routes along the Silk Road collapsed after the fall of Byzantium in 1453, and where there is chaos there is also opportunity. Reestablishing dependable trade with the east was worth billions. Finding a sea route to become Europe’s source of spices and goods was too alluring. The “Sea Race” of nations had begun.
Cantino Planisphere. (1502) (Image: public domain)
Portugal won the first round of the Sea Race claiming islands to use for trade routes rounding the Cape of Good Hope in 1488 and reaching India in 1498. Columbus, sailing under the Spanish flag discovered the Americas in 1492. The Mappa Mundi by Spanish explorer Juan de la Cosa in 1500 is the first map to show the Americas.
Navigational maps were closely guarded national secrets; so much so, the Duke of Ferrara hired a spy, Albert Cantino, to steal a Portuguese nautical map, which is now named in his honor, the Cantino Planisphere, and it shows the emerging knowledge of the newly discovered world. It also marks the evolution of travel using celestial navigation. America, unnamed at the time, was a closely guarded secret by the Spanish and of top national interest.
Portugal and Spain dominated the oceans for most of the 15th and 16th centuries to the point that the world was divided between the two along a meridian known as the Tordesillas Line splitting the world between the two superpowers.
Technology Ignites the Golden Age of Sailing Ships
Thanks to early navigation of the Portuguese and the Spanish, the magnetic compass and the sextant came into use, allowing more precise calculations of latitude improving navigation. Cartography and surveying improved as a result. Ingenious approaches for telling time at sea were invented. One method used Jupiter’s four primary moons as a clock.
England, over 100 years late to the global expansion entered the Age of Sail in 1600 when Queen Elizabeth signed the charter establishing the East India Company (EIC). Contrary to both the Portuguese and Spanish models which were funded by their monarchies, the English created a profit-sharing corporate model, which would ultimately account for half of all the world’s trade.
The EIC remains the most profitable company in history (inflation adjusted), but the costs of running such a vast enterprise were also great. The EIC lost nearly 220 ships. Every ship lost was the loss of a captain, the crew, the cargo, and the ship itself. Shipping was a costly venture. Not counting pirates, storms and war, the primary cause of shipwrecks was incorrect location. Distances could be off by hundreds of miles, enough to end up in the shallows or the rocks.
The problem wasn’t latitude. That could be determined with a great degree of certainty using angular measurements of the sun and celestial bodies above the horizon. Longitude was the culprit. Knowing position on an east west axis proved much more difficult. Longitude was thought to be an astronomical problem, and in order to solve it King Charles II established the Royal Observatory in Greenwich, England in 1675, which happened to be at the height of Europe’s scientific revolution, the primary scientist at the time being Isaac Newton.
However, as many of the greatest minds attempted to solve the problem, none were able to do so. Thirty years’ later the Royal Society presented the challenge to the public offering a reward of £20,000, which is equivalent to approximately $3.1 million in 2019. It was known as the Longitude Act of 1714. The solution finally came in 1736.
John Harrison, a clockmaker, understood that space and time are inextricably connected. Longitude was solved by having two chronometers, which literally means an instrument to measure time. One chronometer was set to local time each day at noon. The other was set to Greenwich Mean Time. The difference in hours between the two pinpointed the time zone and the corresponding longitude. The original time zones were not the political ones represented today. There were 24 of them around the circumference of the earth and each time zone corresponded to a different letter of the alphabet.
Time zones traverse in increments of -1 hour to the west and towards the east +1 hour for 12 hours in each direction totaling 24 in all. The Greenwich Observatory lies within time zone 0 which is the military time zone Z. In the military phonetic alphabet Z is Zebra but it used to be Zulu.. The more precise time could be measured, the more accurate the position, thus, location coordinates are measured in degrees, minutes and seconds.
Today, the world’s primary chronometer is called the Master Clock and is housed at the United States Naval Observatory (USNO) in Washington, D.C. The USNO’s primary mission is position, navigation and timing (PNT). The grounds of the USNO is the home of the Vice President indicating the importance time is to commerce and the welfare of a nation.
GPS satellites set their internal clocks to the USNO Master Clock. PNT is so precise location can be determined down to the sub-millimeter level. Every smartphone’s geolocation is tied into this network. The U.S. Naval Observatory Master Clock has a phone number, (202)762-1401, and every 15 seconds the voice of Time proclaims the exact moment, translating the decay of cesium-133 into the same language of the pyramids, the Sphinx and Stonehenge.
A final thought. Heraclitus said we cannot step into the same river twice. The river changes by the flow of itself. But, Time itself is a river and with each passing moment our lives forever change. Look back. It is the past — the place of regret and glory. Look forward. It is the future where hope and fear reside. Look at the present. It is the only place we are.
Guest column by Jules McNeff Consultant and GPS World Editorial Advisory Board member
GPS World publications are evolving, as this new column confirms. And the PNT world itself is evolving, first with the emergence of GPS in the 1990s, next with its universal adoption and duplication by others, and now with its foundational role in PNT-enabled applications for technologies of the 2020s and beyond.
Millions of people have grown up in a world where GPS-enabled PNT applications pervade their daily lives, and mostly for the better. But GPS is no longer the only face of PNT around the world, though it is still the best known even as other space-based systems from international providers have joined the party.
From its infancy, GPS was married with inertial systems and clocks. For a short time, GPS emergence stymied the commercial development of both, but as the viability of the marriage was validated, development turned toward miniaturization of the combination and adding more pieces as well.
It is now clear that GPS was the spark, and a multi-faceted PNT enterprise is the new reality.
Because of its free availability, GPS has been the foundational element in most of these integrated applications, and without GPS, many will not work as well — or at all. Consequently, dependence on GPS for efficient operation of many PNT-related activities has become a de facto reality. GPS timing is at the heart of interoperable telecommunications and data networks (most notably the internet) and of modern power grids. GPS positioning was the catalyst for adoption of the U.S. National Grid as a federal spatial interoperability standard for search-and-rescue and emergency response and by the SAE as a standard for commercial land mobility as well.
However, dependencies create vulnerabilities, and over-reliance on GPS has been cited as a potential Achilles heel for both national security and economic critical infrastructure. Efforts have been under way for several years by the U.S. Air Force to strengthen all aspects of GPS and, more recently, much attention has focused on making use of complementary technologies to increase the resilience and performance of integrated PNT devices.
Smartphone and autonomous vehicle developers have used such techniques for years to augment GPS for their applications. The awareness of value from ubiquitous access to precise position and time that was awakened by GPS in 1995 has now evolved into an understanding that diverse services from a broader PNT enterprise are necessary to preserve that access with assurance into the future.
Congress and the DoD have recognized that reality, with Congress directing and DoD implementing a DoD PNT Enterprise Oversight Council to manage future acquisition of PNT capabilities for the military. In August, the Department of Defense (DoD) also released a public version of its Strategy for the DoD PNT Enterprise, highlighting the processes it has created to implement resilient PNT for the Joint Force. Congress and the White House both have also recognized that the imperative for resilient PNT must be extended to domestic critical infrastructure, and this has resulted in direction to civil federal agencies to both strengthen and back up GPS use for their constituencies. It is now clear that GPS was the spark, and a multi-faceted PNT enterprise is the new reality.
A famous quote applies to almost everything in our lives: “There is nothing permanent except change.”
This well-known saying is generally credited to the Greek philosopher Heraclitus (500 B.C.E.), although many historians and philosophy experts tend to agree the quote is a combination of many topics found in writings by Heraclitus.
However the quote came to be, it aptly describes the world we live in; especially now with lightspeed advancements in technology. Change is markedly evident in today’s surveying world, and almost no practitioner is exempt from revolutionary enhancements and necessary upgrades to stay current in our profession.
Change is on the horizon
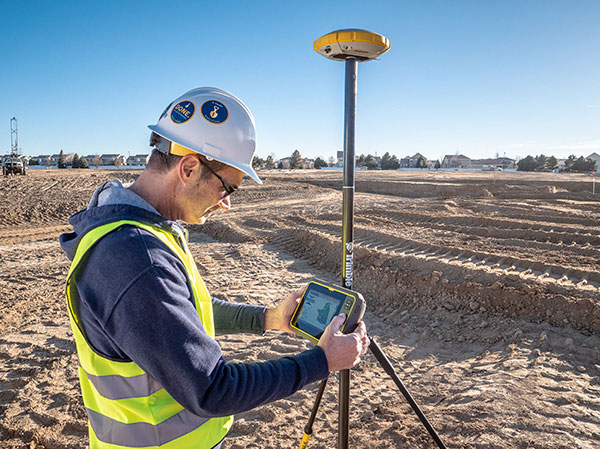
Photo: Trimble
The upcoming NGS 2022 datum change, triggered by advancements in positional accuracies and measurement techniques, has quietly created a groundswell of questions, concern and curiosity of how and why we are at these crossroads. In my September 2019 Survey Scene article, we discussed the background behind the necessity of the upgrade and moving toward a standardized measurement unit, (the “foot”). (For purposes of this article, let’s put aside any mention of using the meter/metric system; the U.S. went down that road in the late 1970s / early 1980s, yet crashed and burned upon implementation. I agree the meter is a more practical unit of measurement, but we need to leave that talk for another day.)
This article will be concentrating on the actual coordinate systems and how significant changes are coming for almost everyone performing surveying measurements. Yes, this means all those construction-based users of GNSS receivers and total stations performing pre-, in-progress and post- construction tasks. Our coordinate world will be turning upside down but, in this case, it will be changes for the good.
Origins of X/Y (otherwise known as Northing/Easting)
We have another philosopher to credit for the concept of coordinate geometry; he is the French scientist Rene Descartes (1596-1650) who was heavily influenced by Plato.
While he may be more well known for his famous quote “I think, therefore I am,” Descartes created what is believed to be the first graphical depiction of geometrical expressions and assigning coordinate values to the results; hence the background behind “Cartesian coordinates.” It is this coordinate system that was utilized by late 1800s/early 1900s surveyors who began using this system to create small networks within urban settings, including New York City, Cincinnati and Atlanta.
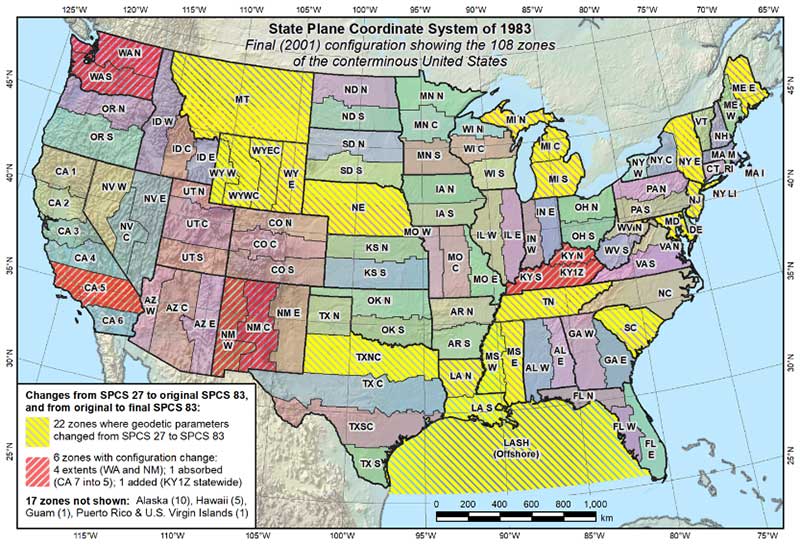
As economic expansion continued through the Great Depression and beyond, the need for larger survey networks became more evident. The first state plane coordinate system (SPCS) began in North Carolina in 1933-34 with more states quickly falling in behind them. The main force behind this effort was the U.S. Coastal & Geodetic Survey (now known as National Geodetic Survey), as they utilized many surveyors and engineers that were unemployed due to the Stock Market Crash of 1929 and Great Depression. Technology for the era was limited to theodolites and steel tapes, with most computations being based upon triangulation.
Enter the Electronic Age of surveying
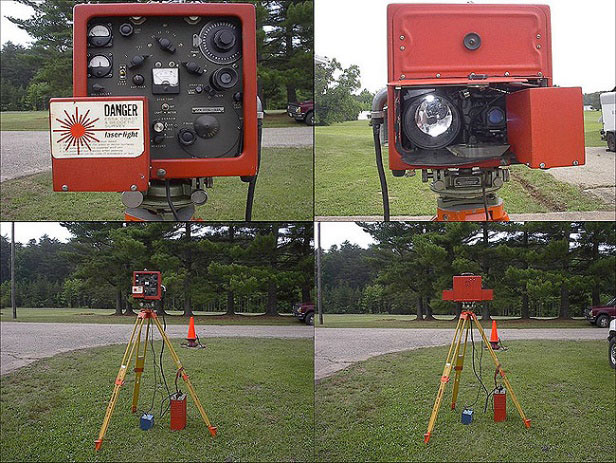
“Big Red” Geodimeter 4D (Photo: National Oceanic and Atmospheric Administration)
Positional and measurement technology remained stagnant until the 1950s and 1960s with the introduction of the electronic distance meter (EDM). Longer measurements could be made with increased accuracy and helped expand our coordinate system capabilities.
These enhancements also led to faster expansion of a nationwide highway system (championed by President Dwight Eisenhower) by simply surveying more efficiently. It is along these highway corridors that state plane coordinate systems were expanded into remote areas and used to verify fractured SPC systems created through solar and/or astronomical means. While positional values at common monuments were found to have significant differences by today’s standards, most error was distributed throughout the network.
Because of the work necessary to complete a survey using a SPCS, it was not practical for any non-governmental project to attempt tying into a known system. Fundamental use of coordinate geometry (CoGo) typically utilized a project base point with a low assumed positional value, (i.e. northing of 1,000, easting of 2,000).
Most surveyors used the same coordinate values for each project and did not have any positional relationship between their projects. While the field portion of the project took a significant amount of time to traverse and collect, the office calculations and manual drafting were also tedious and time-consuming tasks.
Prior to the introduction of the handheld calculator in the early 1970s, traverse computations were completed manually using sine/cosine/tangent tables, traverse adjustment (i.e. compass, transit and Bowditch rule) and double distance meridian (DMD) methods. Even as the programmable calculator became the computation method of choice, regularly producing survey data in SPCS was still years away.
Along with the electronic theodolite and the personal computer with computation software, the introduction of the data collector quietly revolutionized the amount of data that could be stored and efficiently plotted for surveys. But even with the increased efficiencies, there was one big drawback to utilizing this electronic data collection with SPCS; most hardware was limited to values and significant figures not acceptable to using large coordinate values. Some tried truncating SPCS values but often found the trouble not worth the effort, not to mention having projects large enough to be affected by grid-to-ground scale factors (another topic for another day).
Fast forward to the 1980s and the introduction of ultimate surveying black box, the GPS receiver. Positional accuracy through static GPS sessions was now better than ever and allowed surveyors to cover greater distances in shorter time periods. It was the implementation of the GPS receiver (and subsequent reduction in cost of entry for its use) that allowed the surveyor to embrace the state plane coordinate system more than ever. Also addressed with the new technology was the ability for the data collector to handle larger coordinate values with increased significant figures.
As RTK and subsequent RTN systems have allowed for more efficient use of GNSS technology, the surveying profession has now overwhelmed the existing monument network and exposed the deficiencies of NAD83 and our various SPCS zones nationwide. NGS has done an excellent job for many years refining and adjusting the national datums (both horizontal and vertical) by augmenting the systems with new data and “turning the screws” as deemed necessary to provide a reliable network.
If it is not broken, why fix it?
The existing SPCS zones and overall NAD83 system works well but we will need to circle back to the quote in the opening paragraph: “There is nothing permanent except change.”
Research, not just completed by NGS but many other respected agencies and laboratories worldwide, has shown that our existing datums have significant flaws due to many factors. These factors include, but are not limited to, tectonic plate shifting, previous survey data that doesn’t meet today’s positional and measurement standards, and limitations in terrestrial measurements.
We are overdue for an upgrade to the national system and design of new policies and procedures has taken time and lots of hard work. NGS has created a new framework that will adapt to the changing needs of a state and/or regional authority.
But what does this mean for the surveyor, the contractor and anyone else in the geospatial world that uses state plane coordinates for the basis of data?
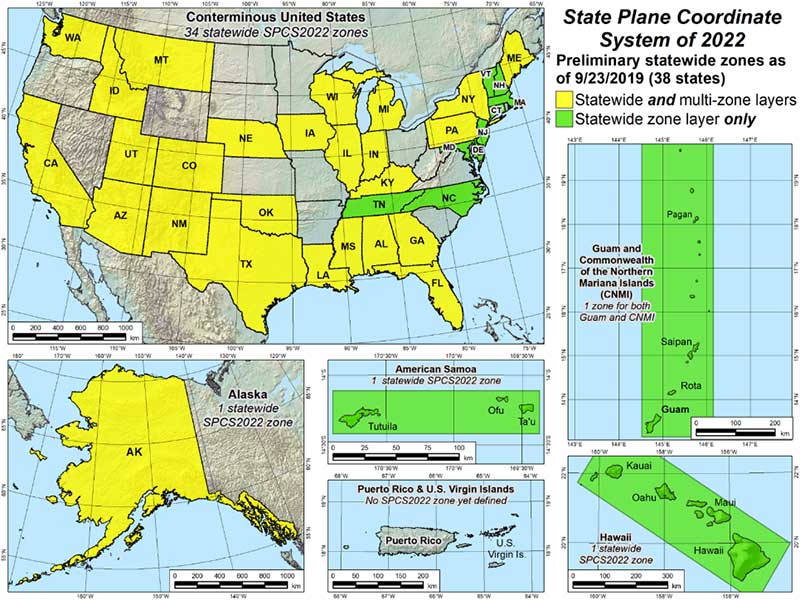
Image: National Geodetic Survey (Michael Dennis)
As discussed in the last article, NGS has been busy creating a new framework with a proposed implementation of 2022-2023. While NGS is creating the specifications, policies and procedures for the new system, it will be up to each state to decide if they want to keep their existing SPCS zones, change to a new scheme, and/or request that additional smaller zones be included for consideration. NGS, in keeping with existing policy, will work with each state to update their SPC definitions, but only if the state engages NGS during the setup period. Otherwise, NGS will apply the new datum specification to the existing zone(s).
What does this mean to the everyday surveyor?
For an example on how a state can revise their SPCS, let’s use Illinois and its plan to revise current zones. Illinois currently implements a two-zone system (East and West, lengthwise through the state) based upon a transverse Mercator projection.
For several years, GIS users and other agencies have discussed creating a single-zone system across the entire state for ease of use. Because of the size of the state and availability of RTN coverage to some remote areas, the realization of this new system has been on hold. Also, it is understood the distortion in data accuracy across a system this large would not be suitable for survey-grade applications.
Forward to 2019 and the NGS datum upgrade along with a substantial effort by several equipment manufacturers to install CORS stations across the state for broader RTN coverage (and the not-too-distant future rollout of 5G cellphone service). RTN coverage for mapping grade data collection is now readily available nearly everywhere in Illinois, so the potential of a single-zone system is now not far-fetched.
It should be noted that if Illinois decides to convert to a single-zone system, NGS will only recognize that system for future computations and documentation and the two-zone system will be scrapped. It will fall to each practitioner to convert their existing data and projects to the single-zone system if they choose to use it, but it will have some drawbacks due to the distortion of the larger system.
Image: National Geodetic Survey (Michael Dennis)
Enter the low distortion projection (LDP) system. Like other states, Illinois is discussing a potential LDP system containing 32-34 regions statewide for more accurate coordinate system development. These regions are being studied to concentrate on larger urban centers and areas where growth potential is predicted. Regions such as the Chicago, St. Louis and Peoria metropolitan areas are being highlighted for major LDP system use by not just surveyors but government and GIS analysts.
Having a coordinate system with less distortion and more accuracy can provide more reliable information for the survey but also provide more value for the residents and businesses. By concentrating the coordinate system on smaller areas through an LDP, surveyors will literally be using a communal network like their old calibrated or localized network systems of days past. The coordinates will still be large but the integrity of the data will be higher due to the reduced distortion of the system projection.
This system will also virtually eliminate the need to have a grid-to-ground scale factor because of the lack of distortion. So we will now have a large statewide system for mapping and smaller regional systems for accurate survey data going forward; sounds like a good plan, right?
Making a significant change increases our capabilities
Not to sound like a broken record, but let’s revisit the quote by Heraclitus one more time: “There is nothing permanent except change.”
Most people don’t like change, even if it is for the better. Surveyors are notoriously famous for not wanting change. Many surveyors I know would not embrace early GPS not simply due to cost, but more of not understanding how it works. They also didn’t understand how to embrace state plane coordinates and having survey data that will be compatible with their competitors. Most of those surveyors now are using it, but only because the data collectors have become more user friendly.
But why will this change be harder for most? Depending on where one is and how their state is going to adapt will affect that change. If your state is not changing any zones, they will have a -2 to +4.5-meter coordinate shift depending on where they are located. For states like Illinois and potentially changing from two zones (East and West) to a single zone and dozens of regional LDP systems, it will be a bit harder to translate all your existing survey data to the new systems if necessary.
There are several potential pitfalls in front of us if we aren’t careful. Here are a couple of scenarios to consider:
Image: National Geodetic Survey (Michael Dennis)
Understanding the general change in datum values
Converting old data to new system for reuse (additional time consideration)
For practitioners working in several LDP regions, emphasize the importance of correct zone
Software and equipment firmware updates
Older unsupported data collectors
Compatibility with current and archived GIS data
Conversions of government agency-specific data and benchmark
Major milestone dates:
Establishing a date in which all new survey data will use the new datum
Establish a date in which all design projects will utilize the new datum
Establish a date when all construction layout will utilize the new datum
These zone/LDP system changes also will be affected if your state is currently recognizing the U.S. Survey Foot and will be changing to the “foot” per my last article and ongoing NGS discussions. That change will also precipitate additional review and care for compliance of any old data to new systems.
As creatures of habit, change and adaptation moves us forward
Here’s the bottom line: We need to make this change in order to efficiently address future mapping needs and positional accuracies. Because of technology and evolution of measuring devices, we now know there are other factors that play into our coordinate systems.
As the world becomes more reliant on digital data and information, it will be critical that the right geospatial information is tied to it. There is nothing permanent except change, but change can also be for the better.
From growing crops to making movies, unmanned aerial vehicles (UAVs) are changing the way we work. UAVs — managed by unmanned aerial systems, or UAS — range from small indoor inspection units to giant Predator drones. They are streamlining how we manage mines and plants, deliver packages, and keep people safe. Read on to find out the latest in this skyrocketing market.
The unmanned aerial system (UAS) industry is in great shape! In the United States., the Federal Aviation Administration (FAA) appears to be helping commercial operations get off the ground, at least for those wishing to fly small unmanned aerial vehicles (UAVs).
Things are certainly hopping for unmanned aircraft in agriculture, mining and construction, facility inspection, newsgathering, movies and promotion. Package delivery is on the way, and, of course, defense is cooking with new innovations. Everywhere you look, a specialized drone or new application seems to appear that has good prospects for success.
One helpful aspect of today’s landscape for UAS operators in the U.S. is the FAA’s supportive approach to small UAS (sUAS) for commercial activities. After providing a regulatory framework with Part 107 rules, albeit with quite a few caveats that require a written waiver application, qualified drone operators are now able to fly their drones in many places — as long as they are below 400 feet, well away from airports, and nowhere near any restricted airspace.
Pilot qualification courses and proficiency testing are both readily available — at 676 commercial facilities across the U.S. according to the FAA website — and a successful online application process should result in a remote pilot’s certificate.
With a drone registered with the FAA, you can use the FAA’s B4UFLY mobile app to check if it’s safe to operate where you intend to. If it is, you can get approval in real time using the FAA’s Low Altitude Authorization and Notification Capability (LAANC) system. The FAA qualified LAANC to clear commercial drone operations, and the service is now provided by a large number of independent UAS service providers.
With the regulatory and approval path in place, it’s now possible for companies and individuals to earn a living with turn-key drone operations, providing services for many applications that have blossomed. There’s work to do beforehand, but it’s less arduous than for manned flight operations.
Let’s look at a few of the applications benefiting from the automation, enhancement and remote operations provided by UAVs as well as their on-board sensor suites and after-flight processing:
agriculture
mining and construction
facility inspection
newsgathering, movies and promotion
package delivery
defense
Crop health analysis: Precisionhawk’s software PrecisionAnalytics—Agriculture automatically generates georeferenced orthomosaics from data collected with drone sensors. (Map: PrecisionHawk)
Agriculture
Agriculture has readily adopted UAVs to monitor, control and improve overall crop growth rates — a part of what is known as precision agriculture. Drones carrying optical, thermal and laser scanning payloads gather stacks of information about the condition and rates of growth in fields. The information is then fed into various analysis tools. A picture emerges over time that indicates the health of crops. This enables farmers to generate a formulas for the nutrient and weed-reduction chemicals used for spraying at various times of the year. It’s a customized “prescription” for each growing area.
Continuing UAV overflights during the growing cycle monitor the effects of growing conditions and the effectiveness of treatments, providing more feedback that lead to even further improvements.
Smaller tech-savvy farms might run their own programs, supported by local agrochemical suppliers that may provide analysis services or sell analysis tools.
However, there has been a real growth in the number of companies that supply an entire turn-key package — supplying and flying drones, gathering data, running analyses and providing written and graphic output to support the farming operation.
Unmanned aircraft are truly an integral part of this approach, which might only have been possible because of semi-autonomous UAS and the evolution of compact sensors: UAV-mounted infrared, high-precision optical and lidar.
A sample prescription map. (Map: PrecisionHawk)
Mining and Construction
Any mine site is a busy — even chaotic — place to conduct a commercial business.
Drones provide a way for mining operations to:
quickly collect information to enable volume calculations;
provide relatively inexpensive site surveys; and
manage traffic and set up daily road layouts.
In effect, drones enable more rapid control of a complex and dynamic undertaking. Additionally, they improve safety. Ground surveyors no longer need to dodge huge operating machines and tumbling ore, or scramble around difficult terrain.
An autonomous drone can gather timely, georeferenced imagery that can be turned into a precise 3D model of the site. Site managers can have immediate access to details of the UAV survey. They can see the extent of existing deposits and know where to support further mineral exploration, receive estimates of stockpiles and tailing volumes, ensure that personnel and equipment are in the correct locations, and compare aerial video and photography day by day to check progress and for record-keeping. Drones can carry a wide variety of imaging and sensor packages including visual, infrared, hyperspectral, lidar, sonar and radar.
It’s also quicker. For instance, using the senseFly eBee fixed-wing drone, a full aerial survey of an 88-hectare site took four to five hours, with about half of that time spent placing control points. To achieve the same level of detail, terrestrial surveying would take a single surveyor two to three weeks.
Construction Operations. The construction sector uses the same drone data-capture techniques for site details, off-line analysis and results tabulation to manage operations of complex work sites. Compared to mining, change can be more intensive during a construction project, so drone surveys might be repeated more often.
Surveying and GIS. Using drones is an industry unto itself, with high-precision RTK GNSS in the air and on the ground, and specialized analysis tools for high-accuracy applications. The speed of data gathering is the principal benefit to an industry that continues to be essential in many sectors. Lower precision GIS for asset tracking and the like could become a subset of the applications and tools already discussed.
Facility inspection. Outdoor and indoor facility inspection is definitely benefiting from the automation that suitably equipped drones and customized analysis tools can bring to both regular and infrequent inspection tasks. The number of regular complex refinery inspections can be significantly reduced. Inspections will no longer interfere with production and will improve safety for inspection staff. For instance, flame stacks that burn off excess gases can be prone to failure, so regular inspection is essential. Using a drone for the task is clearly much safer than using personnel.
An offshore oil and gas construction platform vents gases to relieve pressure. Flame stacks such as these require regular inspection. (Photo: Oil and Gas Photographer/Shutterstock.com)
BVLOS for Pipelines and Rail
Automated pipeline and railway track inspection have both become possible as drones are used over much greater distances, thanks to beyond visual line of sight (BVLOS) operational approvals by the FAA.
For BVLOS, users first need a validated sense-and-avoid technology on the drone. Also required is proven radio telemetry with uninterrupted command-and-control of the vehicle during flight, and an independent ground-monitoring system that confirms how the drone maneuvers throughout the flight.
In the case of a BVLOS flight this summer along the Trans-Alaska oil pipeline, a Perimeter UAV manufactured by Skyfront flew about 4 miles, maintaining a constant above-ground altitude of 400 feet with multiple ascents and descents of 1,000 feet on 45-degree slopes. The long-range hybrid multicopter drone was equipped with Iris Automation’s computer vision collision-avoidance system and was monitored by
Launching a UAV for a BVLOS flight are (at left) Travis Balthazor, UAS flight operations manager, and Mike Kuni, UAS flight instructor/pilot, both of Kansas State University Polytechnic Campus. (Photo: KDOT, Division of Aviation)
Echodyne radars along the pipeline path, providing airspace situational awareness.
Another BVLOS operation built on the achievements of the Trans-Alaska pipeline trial has been authorized to fly a nine-mile linear inspection of power lines in rural Kansas.
Once again, the Iris Automation system will provide collision avoidance, but this drone also has an independent automated avoidance capability. This gives the drone the self-contained ability to fly around obstacles, so no ground radar or visual tracking is required.
Relieving the requirement for radar tracking or visual observers makes many new operations affordable. Previously, FAA Part 107 BVLOS waivers have all required visual observers or ground-based radar tracking — requirements that are not only expensive, but also restrict where flights are possible.
BVLOS operations like these demonstrate the cost-effectiveness of the technical solution, making long-duration, long-distance inspection using drones feasible.
Indoor inspection is becoming possible with specialized drones that circumvent the need to expose inspection staff to especially difficult facility environments, which in the past also required production shut-down to protect them. Thermal and visual sensors on swivel mounts enable protected inspection drones to fly into tight spaces — or even back out of tricky situations — and make visual records that may otherwise be virtually impossible.
Searching and recording inside containment vessels at the failed Fukushima nuclear facility may have been significantly advanced by using inspection drones.
Newsgathering, Movies and Promotion
All those panoramic, overhead, moving shots you see on the news, in movies and in ads used to be taken from a manned helicopter or fixed-wing aircraft. Now they are mostly taken by multi-copter drones with high-resolution cameras. This makes cinematography and newsgathering much more affordable, making these fields accessible by smaller operations. In the past, only large media groups could afford to rent a helicopter. And, of course, it’s much quicker to bring a UAV onto an incident site, operated by a crew on the ground.
You’ll need FAA approval to use a drone for commercial newsgathering purposes, or find a suitable qualified UAV and operator. After gaining FAA qualifications, news people are also taking on the job, buying and flying the equipment and managing the video-processing software themselves.
Others using drones for similar purposes are movie makers, producers of TV commercials and real estate agents, to name a few.
Delivery by Drone
The ultimate objective of many internet suppliers is to deliver goods that were just ordered within minutes of the order being placed. This is a pretty big objective. It requires a whole network of “fulfillment centers” in and around many cities, a massive purchasing and goods movement capability to keep these centers stocked, and a system that delivers to the end-customer. Currently, we mostly have manned panel trucks of various flavors handling that last step of the delivery process, with real people reading the notes we put on the porch about where to leave our package if we’re out.
Order and Receive. The next wave of delivery changes are expected to include drones carrying your package from the fulfillment center to your backyard. Amazon is looking for approval to begin trials with its larger 88-pound MK-27 Prime Air delivery drone, initially in sparsely populated areas. The MK-27 is equipped with intelligent sense-and-avoid capability, flying around any obstacles it encounters in flight and even during delivery.
UPS is also hoping to get to qualification of its own UAS delivery system by the end of this year, to the same standards that manned aircraft delivery systems are certificated.
Medical Deliveries. Many other trials are underway, especially involving medical deliveries and support. In Africa, trials are underway in Ghana, Malawi and Rwanda. UPS recently proposed a medical supplies delivery service using drones in North Carolina. Many companies that claim expertise in medical deliveries are operating drones.
Food on the Fly. Restaurant food delivery services have seen an upsurge in popularity. It seems likely that soon you’ll be able to order and receive lunch really quickly by drone food delivery services. Ground robot food deliveries at George Mason University are already a huge hit! Uber-Eats is experimenting with drone food deliveries, and 17 drone delivery routes have already been approved in an industrial park in Shanghai.
Meanwhile, Bell has flown its autonomous pod transport (APT) 70 near its base in Fort Worth, Texas, for the first time. The APT 70 can carry a 70-pound package load at over 100 mph, far faster and farther than existing drone delivery systems.
Bell is aiming for package delivery and critical medical transport for disaster relief for APT type drones. It is also participating in the NASA SOI program along with General Atomics’ SkyGuardian.
Drones are a new tool. The UAS industry will continue to change and adapt these products and this technology in as-yet-unthought-of ways. It’s an exciting time, and right now, there seems to be no end in sight.
For a look at drones in the defense industry, see Murfin’s article “Defense in front of UAV development,” published in September’s Professional OEM + UAV newsletter.
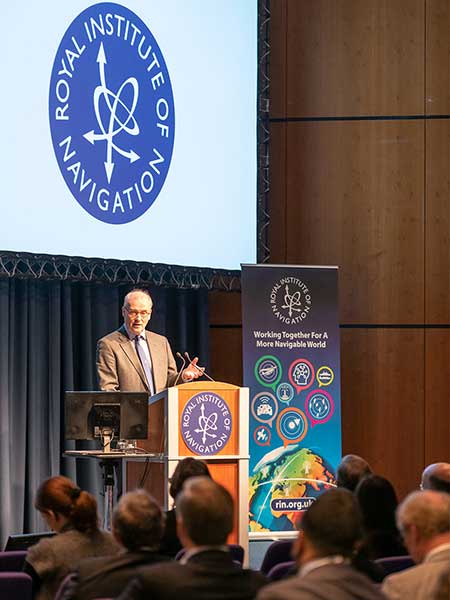


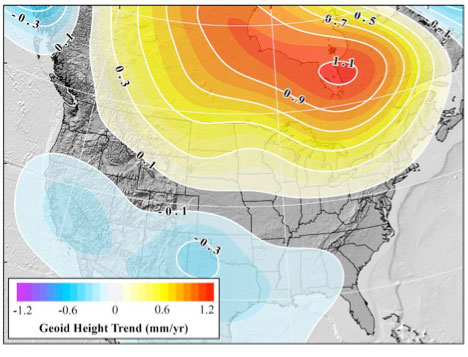
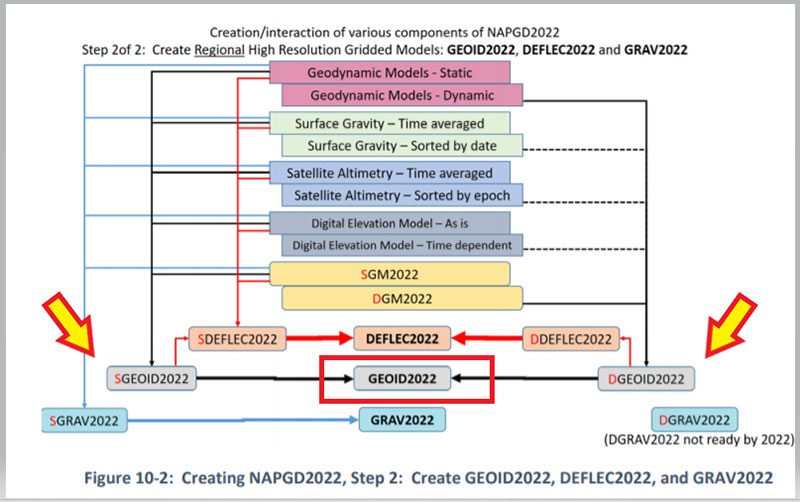
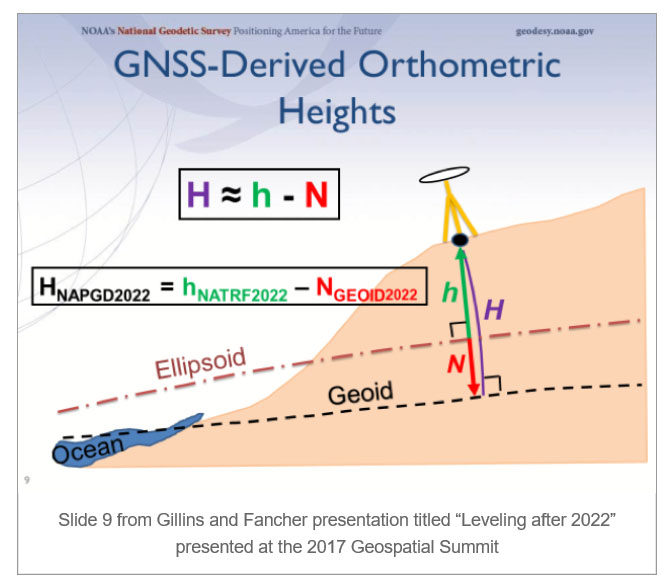
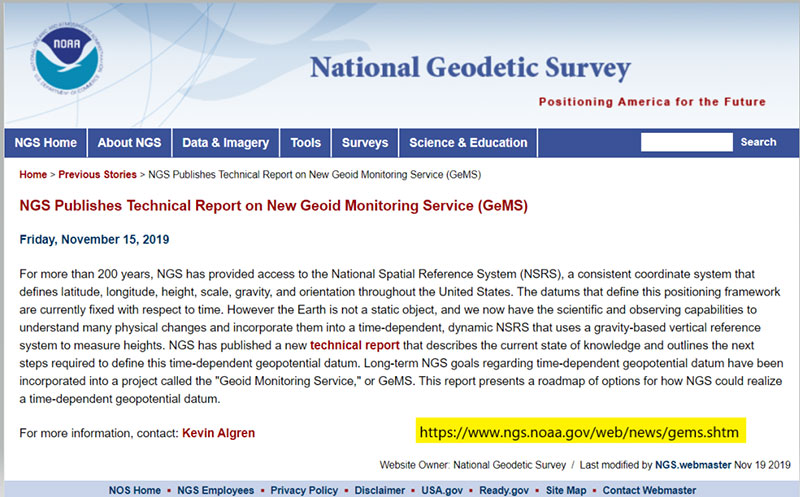
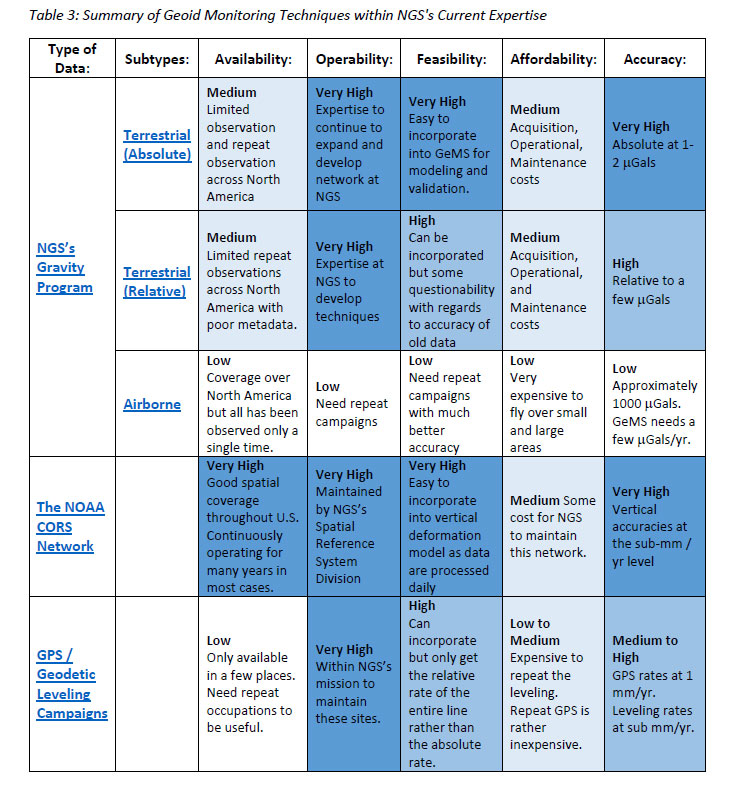
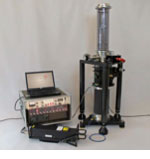
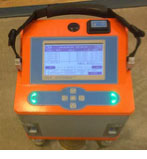
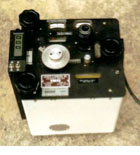
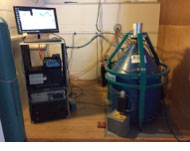

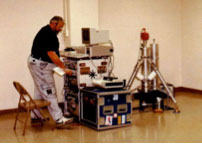
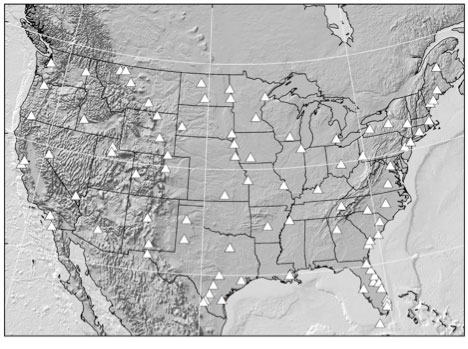
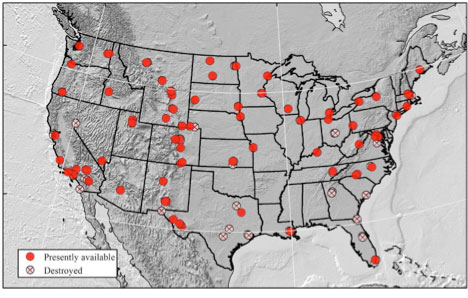
![Figure 16: Difference between NGSGN and IGSN71 AG values [mgal] (Source: National Geodetic Survey)](https://stage.globalpositioningnews.com/wp-content/uploads/zilkoski-december-2019-column-image-14.jpg)
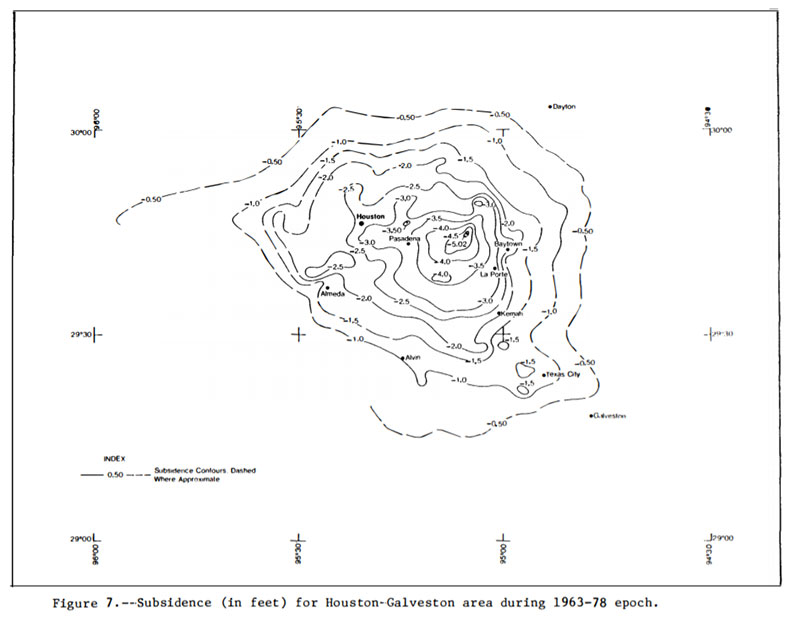
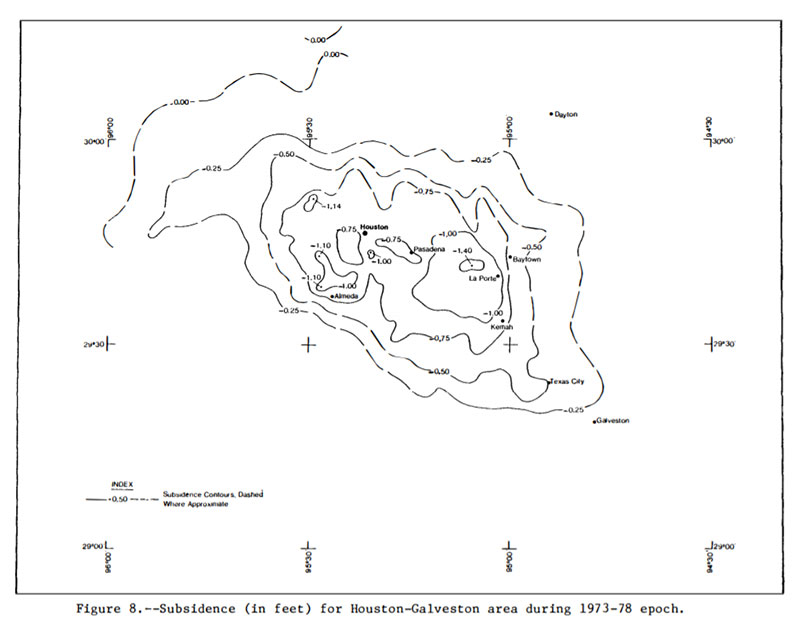
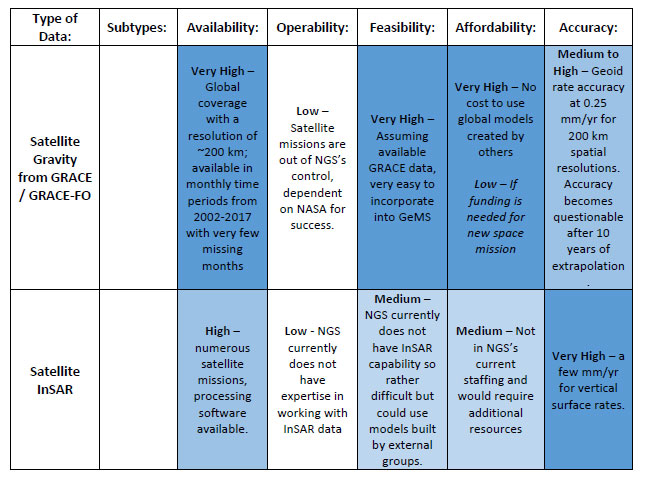
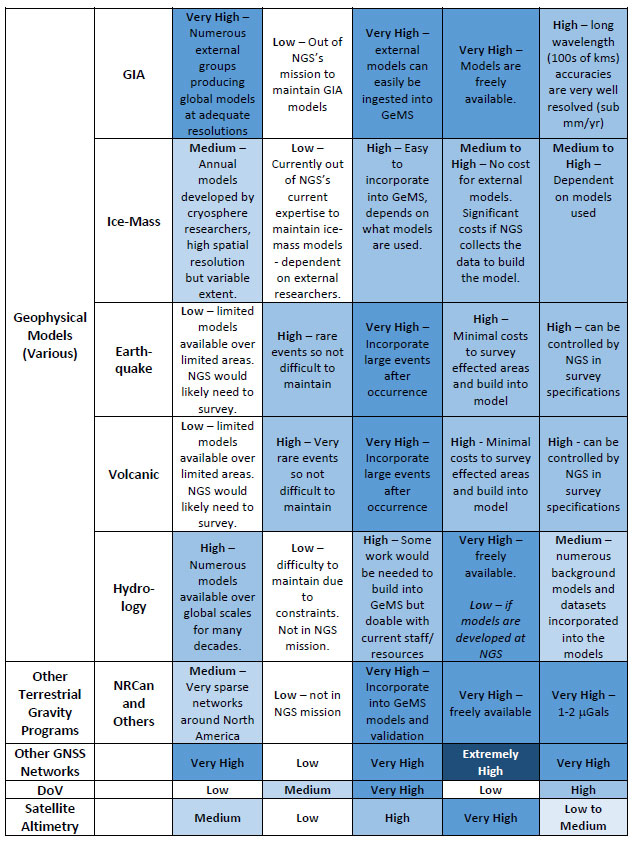
![Figure 28: GRACE Trend over Alaska from UTCSR RL06 GRACE Model [mm/yr] (Source: Figure 28 from Technical Report NOS NGS 69)](https://stage.globalpositioningnews.com/wp-content/uploads/zilkoski-december-2019-column-image-20.jpg)
![Figure 32 From Technical Report NOS NGS 69: Geoid rate over CONUS based on the GSFC mascon model [mm/yr] (Source: Figure 32 From Technical Report NOS NGS 69)](https://stage.globalpositioningnews.com/wp-content/uploads/zilkoski-december-2019-column-image-21.jpg)
![Figure 33 From Technical Report NOS NGS 69: Geoid rate over Alaska from GSFC mascon model [mm/yr] (Source: Figure 33 From Technical Report NOS NGS 69)](https://stage.globalpositioningnews.com/wp-content/uploads/zilkoski-december-2019-column-image-22.jpg)