How have improvements in mapping data-collection advanced other PNT technologies?
Tony Agresta
“Real-time positioning, navigation and timing (PNT) benefit from high-resolution aerial maps captured and published on a consistent basis. With sub 3-inch aerial photographs streamed through custom applications or instantly accessible solutions, governments and commercial use cases apply these maps for emergency 9-1-1 dispatch, routing guidance, and new information applications to inform citizens.” Tony Agresta
Nearmap
Ismael Colomina
“In principle, PNT shall be based on linear/angular motion sensors. However, since the origins of aerial triangulation down to contemporaneous hybrid multi-sensor systems, mapping and motion sensors have cooperated in PNT tasks. Current visual- and lidar-odometry are brilliant examples thereof.” Ismael Colomina
GeoNumerics
Members of the EAB
Tony Agresta Nearmap
Miguel Amor Hexagon Positioning Intelligence
Thibault Bonnevie SBG Systems
Alison Brown NAVSYS Corporation
Ismael Colomina GeoNumerics
Clem Driscoll C.J. Driscoll & Associates
John Fischer Orolia
Ellen Hall Spirent Federal Systems
Jules McNeff Overlook Systems Technologies, Inc.
Terry Moore University of Nottingham
Bradford W. Parkinson Stanford Center for Position, Navigation and Time
The National Geodetic Survey (NGS) is now developing the 2022 transformation model. Once again, NGS requests the assistance of the surveying and mapping community. This column provides examples to explain the symbology and use of the new version of the GPS on Bench Marks program for developing the 2022 transformation tool.
My last column discussed the results of the Beta hybrid Geoid18 model, and the differences between the Beta model and the official hybrid geoid model, Geoid12B. It provided examples to explain the symbology of the Beta Geoid18 Web Map. It was noted that NGS analysts rejected stations based on pre- and post-modeled residuals but many times there wasn’t enough redundant information available to ensure the station should be rejected or used in the creation of the hybrid geoid model. As I have mentioned before, users should be commended for their participation in the GPS on Bench Marks program. The Geoid18 model is still in “Beta” so, hopefully, users will continue their support by evaluating the Beta hybrid geoid model and reporting their issues to NGS. Saying that, NGS’ GPS on Bench Marks program is now in a different phase.
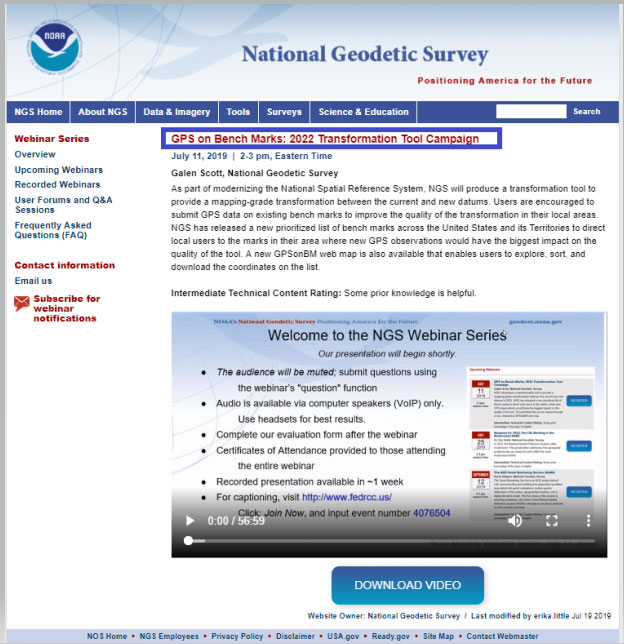
NGS held a webinar in July on the latest GPS on Bench Marks program for developing the 2022 Transformation tool. The webinar was recorded and users can find the presentation here. This was an excellent webinar and explained the functions of the web map. I would encourage readers to watch the webinar. It is an hour long but is worth while watching. See Figure 1 for information on the webinar.
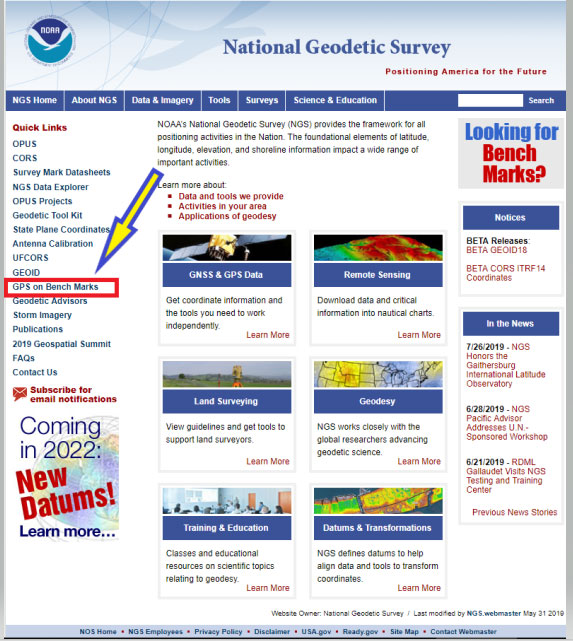
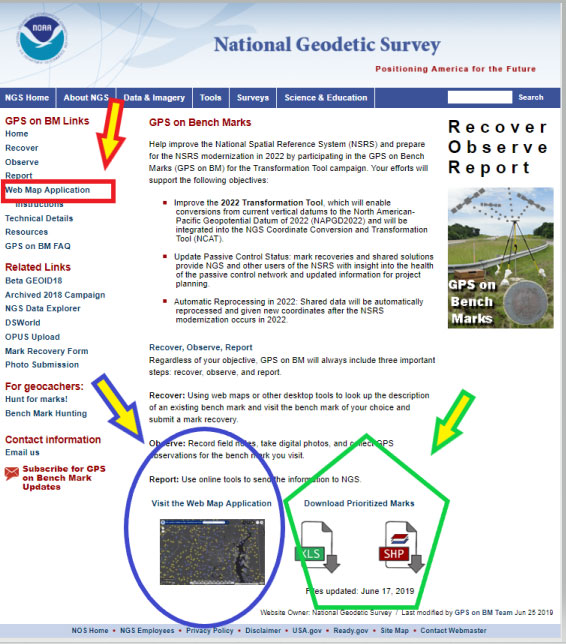
As in the past, the NGS on Bench Marks program can be accessed from NGS’ web page (see Figure 2). The user clicks on the “GPS on Bench Marks” button to access the program’s web page.
Figure 3: GPS on Bench Marks Home Web Page (Photo: National Geodetic Survey)
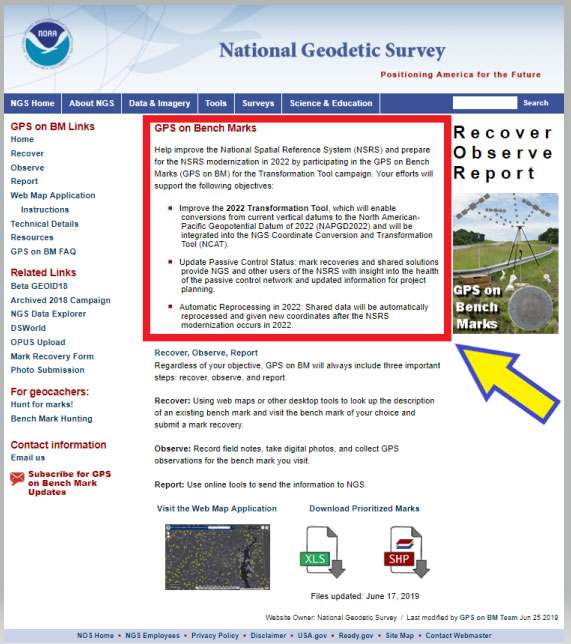
The web page provides several reasons why users should continue to participate in the GPS on Bench Marks program. Figure 4 lists three reasons for helping NGS develop the 2022 Transformation Tool.
Help improve the National Spatial Reference System (NSRS) and prepare for the NSRS modernization in 2022 by participating in the GPS on Bench Marks (GPS on BM) for the Transformation Tool campaign. Your efforts will support the following objectives:
• Improve the 2022 Transformation Tool, >which will enable conversions from current vertical datums to the North American-Pacific Geopotential Datum of 2022 (NAPGD2022) and will be integrated into the NGS Coordinate Conversion and Transformation Tool (NCAT).
• Update Passive Control Status: mark recoveries and shared solutions provide NGS and other users of the NSRS with insight into the health of the passive control network and updated information for project planning.
• Automatic Reprocessing in 2022: Shared data will be automatically reprocessed and given new coordinates after the NSRS modernization occurs in 2022.
I’d like to highlight a few of the benefits for participating in the GPS on Bench Marks program.
(1) Improve the 2022 Transformation Tool, which will enable conversions from current vertical datums to the North American-Pacific Geopotential Datum of 2022 (NAPGD2022) and will be integrated into the NGS Coordinate Conversion and Transformation Tool (NCAT).
> A goal of the transformation tool is to provide a model that will allow users to convert from the current North American Vertical Datum of 1988 (NAVD 88) to the new North American – Pacific Geopotential Datum of 2022 (NAPGD2022). The more bench marks that are occupied by GNSS and included in OPUS Shared solutions will enable NGS to generate a more detailed relationship between NAVD 88 and NAPGD2022. This will provide an accurate transformation tool in local areas which will facilitate the implementation of NAPGD2022 in surveying and mapping products and services.
(2) Update Passive Control Status: mark recoveries and shared solutions provide NGS and other users of the NSRS with insight into the health of the passive control network and updated information for project planning.
> An important part of the GPS on Bench Marks program is that it provides an indication of the status of the station. The last time a bench mark was leveled to varies greatly across the Nation. Many of stations in NGS’ Integrated Dataset haven’t been visited in over 50 years. The GPS on Bench Mark program can be useful to identify stations that have moved since the last time it was part of a leveling project. The mark recoveries will provide the latest status of a station which will help others in future project planning. More important, in my opinion, is that the OPUS shared solutions will identify stations that no longer have valid NAVD 88 published heights, and should be used with caution and flagged with a warning
(3) Automatic Reprocessing in 2022: Shared data will be automatically reprocessed and given new coordinates after the NSRS modernization occurs in 2022.
>> Any station that is part of the GPS on Bench Marks program and included in the OPUS Shared solution database will be given 2022 coordinates. This means that users will not have to resubmit their data to obtain the new coordinates in the new 2022 reference frames. This information will be useful during the implementation phase of the 2022 reference frames.
As in the past, NGS is developing web-based products and services to facilitate users incorporating their data into the National Spatial Reference System (NSRS). They have developed a GPS on Bench Marks Web Map Application to inform users which stations they would like occupied by GNSS equipment. They realize that everyone is busy so they are trying to provide information, in near real time, on stations that have been occupied to reduce users occupying a station that already has two occupations. Figure 5 depicts the buttons that will connect the user to an interactive web map application. There are several ways the user can access the application: (1) click on the link titled “Web Map Application” – the red rectangle and arrow in the box titled “GPS on Bench Marks Web Map Application Site,” (2) click on the figure of the web based application – see the blue ellipse and blue arrow in the box, and (3) download the prioritized marks in XLS or Shape file format – see the green pentagon and green arrow in the box.
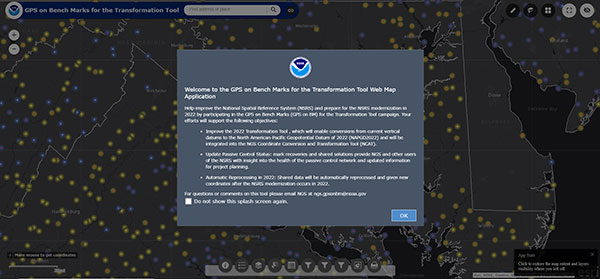
Clicking on the Web Map Application button or picture will direct the user to a new website. It informs the user that they are leaving a U.S. Government Web Site for another site. See Figure 6. The user can either click on the statement or just wait until they are redirected the website. (See Figure 7.)
Figure 6: Clicking on the Web Map Application Button or Picture (Photo: National Geodetic Survey)Figure 7: GPS on Bench Marks For the Transformation Tool Interactive Web Map (Photo: National Geodetic Survey)
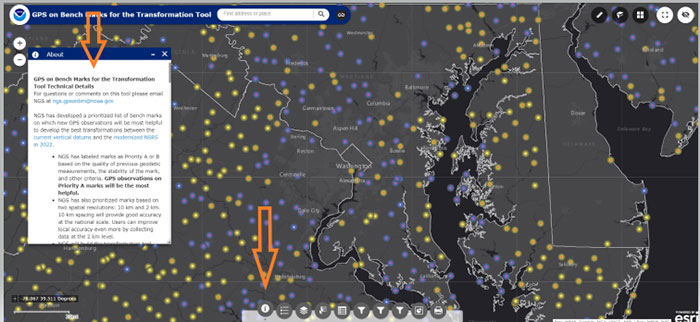
Just click on the “OK” button to remove the splash screen. You can click the button “Do not show this splash screen again” so it doesn’t show up every time you access the web page. At the bottom of the web map is a legend that provides information about the map and allows the user to select various options. Figure 8 provides an example of legend buttons. The information box appears by clicking on a particular icon in the legend bar (the arrows indicate the icon and information box for that icon).
Figure 8: Legend on GPS on Bench Marks Web Map Application Site (Photo: National Geodetic Survey)
There’s a lot of information provided in the information box. There’s a scroll bar on the right side of the box that provides the entire write up. Figure 9 provides several sections of the write up. I’ve highlighted sections in the write up to emphasis what NGS is trying to accomplish. NGS’ goal is to minimize the amount of work performed by users and maximize the amount of GNSS data provided to the development of the 2022 transformation tool.
First, NGS has prioritized marks at two spatial resolutions: 10 km and 2 km. They want to reach a 10 km density to provide good national accuracy and a 2 km level to improve local accuracy. The Interactive Web Map allows users to zoom down to a level to identify individual stations selected by NGS. A 10-kilometer hexagonal lattice was developed to define the desired data density on the ground. For each hexagon, the goal was to identify a primary mark and a list of up to 4 secondary marks. The primary mark for each hexagon was added to the priority mark list. Secondary marks are listed and should be observed in cases where the primary mark cannot be found or is unobservable.
To reduce duplication, when a single mark within a 10 km hexagon has two GPS observations that meet NGS requirements, that hexagon is marked as done and the station is removed from the prioritized list. This will help to reduce the number of surveyors occupying the same station over and over again, and increase the number of prioritized stations occupied with GNSS. After a 10-kilometer hexagon is marked as done, a group of up to thirteen 2 km hexagons is generated to define the opportunities to densify the model with additional marks.
To assist in the selection of stations to be part of the GPS on Bench Marks program, NGS has prioritized stations as Priority A and B. Priority A being more important than priority B for the development of the 2022 transformation tool.
Figure 9: Excerpts from GPS on Bench Marks for the Transformation Tool Technical Details
For questions or comments on this tool please email NGS at [email protected].
NGS has developed a prioritized list of bench marks on which new GPS observations will be most helpful to develop the best transformations between the current vertical datums and the modernized NSRS in 2022.
• NGS has labeled marks as Priority A or B based on the quality of previous geodetic measurements, the stability of the mark, and other criteria. GPS observations on Priority A marks will be the most helpful.
• NGS has also prioritized marks based on two spatial resolutions: 10 km and 2 km. 10 km spacing will provide good accuracy at the national scale. Users can improve local accuracy even more by collecting data at the 2 km level.
• NGS will build the transformation tool with data submitted by December 31, 2021. The tool will interpolate over areas without GPSonBM data, meaning that the transformations will be less accurate in those areas.
Priorities A and B
Priority A
Priority A marks meet the following specific criteria from their datasheets and are most likely to be used to create the transformation tools:
• Vertical Order: FIRST, SECOND
• Stability: A, B, C
• Satellite: USEABLE
• Last Recovery Condition: excluding “MARK NOT FOUND”
Priority B
Priority B marks are lower quality marks that will only be considered for use in the transformation tool to fill data gaps if no other data exists in the region.
Spatial Resolution NGS has also prioritized marks at two spatial resolutions: 10 km and 2 km. NGS wants to reach a 10 km density to provide good national accuracy. Additionally, users can help improve local accuracy by collecting data at the 2 km level.
To prioritize marks based on the two spatial resolutions, NGS created the following system:
• A 10-kilometer hexagonal lattice was developed to define the desired data density on the ground and help select appropriate marks within those areas throughout the U.S. and territories.
• Hexagons with appropriate bench marks were identified.
• For each hexagon, a primary mark was selected and a list of up to 4 secondary marks — if available — were identified. The primary mark for each hexagon was added to the priority mark list. Secondary marks are listed and should be observed in cases where the primary mark cannot be found or is unobservable.
To communicate when observations in a hexagon have been completed, the following process was developed:
• Once a single mark within a 10 km hexagon has two GPS observations that meet the requirements, that hexagon is marked as done and the observed mark is removed from the prioritized list.
• Once a 10 km hexagon is marked as done, a group of up to thirteen 2 km hexagons is generated to define the opportunities to densify the model with additional marks.
• In each of the 2 km hexagons, a primary mark is identified and a list of secondary marks is provided in case the primary mark cannot be found or is not observable. The new primary marks are added to the priority mark list. The number of 2 km hexagons will vary since not all areas have bench marks inside the 2 km lattice. See graphic below:
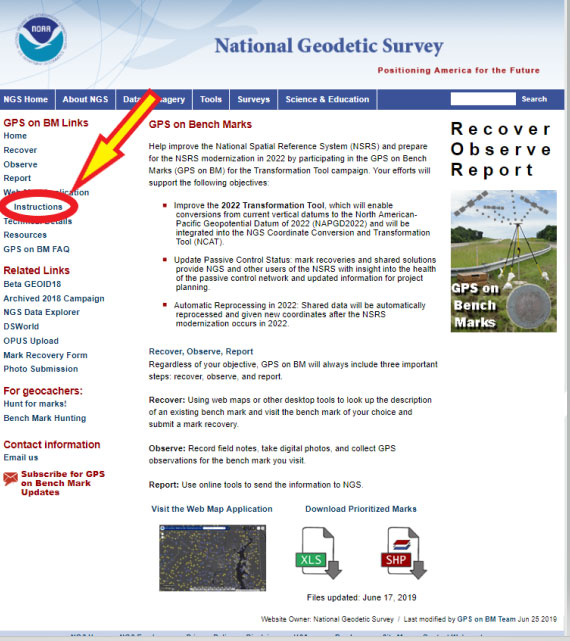
Clicking on the Web Map Applications “Instructions” button will provide a summary of all of the tools available on the Web Map. See the arrow in Figure 10. The instruction page provides a lot of information and explains the function of each tool.
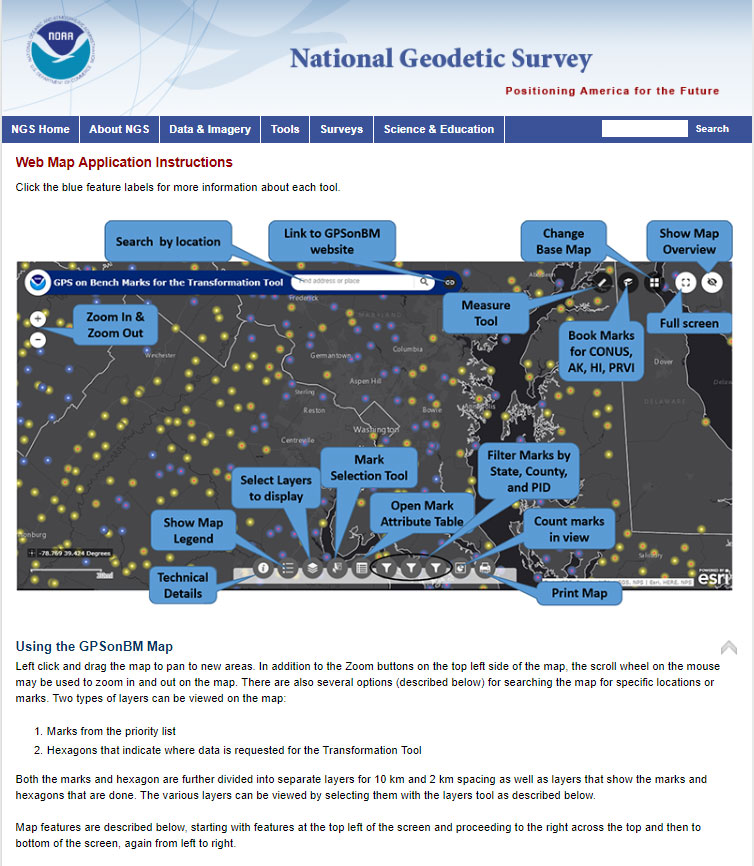
Figure 11 provides an excerpt from that web page. All of the icons on the Web Map are explained on a mock up of a sample map in the beginning of the Instruction web page.
The list of detailed descriptions of the tool is fairly long so I’ve provided some of the descriptions in Figure 12. The reader is referred to this page for the descriptions of all of the tools.
Legend
Clicking this button will display the legend for all of the active layers displayed on the map.
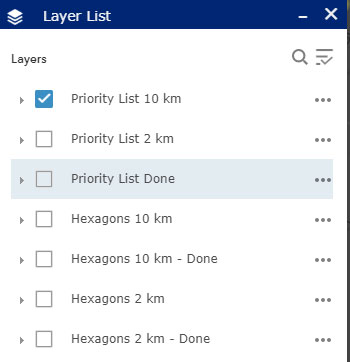
Layer List
Clicking this button will bring up the list of available layers to display on the map. By default, only the Priority List of marks at 10 km spacing appears. Users can select other layers to display on the map by clicking on the box to the left of the layer name. Once clicked, the box will show a check mark, and all layers with check marks are displayed on the map.
Layer Descriptions:
• Priority List 10 km – Marks requested for national coverage
• Priority List 2 km – Marks requested to densify local areas
• Priority List Done – All marks with enough observations to be considered for use in the Transformation Tool.
• Hexagons 10 km – Areas where GPSonBM data is still requested to complete broad national coverage
• Hexagons 10 km – Done – Areas where sufficient data exists
• Hexagons 2 km -Areas where GPSonBM data may still be submitted to increase local accuracy of the transformation tool.
• Hexagons 2 km – Done – Areas where sufficient data exists.
Image: National Geodetic Survey
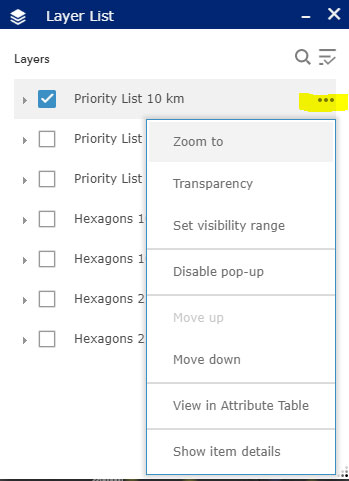
Working with the Layer List
Clicking on the ellipsis to the right of each layer opens a window with actions for that layer. Set visibility range allows the user to set the zoom level at which each layer appears. By default the visibility ranges are set to prevent too much data from being plotted at once which would slow down the application. Users with fast internet connections can change the visibility range to allow data to be displayed when zoomed out far enough to see the extents of larger states.
Image: National Geodetic Survey
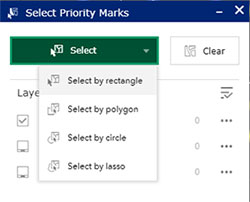
Mark Selection Tool:
This tool provides several options for selecting marks. First, change the layer to select from, click in the box to the left of the layer name. Click the green Select box and choose a selection method, then use the mouse to left-click on the map to draw the selection region. Selected marks’ icons will turn blue. Once marks are selected, click on the ellipsis to the right of the layer to open menu of actions that can be performed with selected marks. Using this menu, selected marks can be exported into csv, JSON, and GeoJSON formats.
Image: National Geodetic Survey
Attribute Table
This button opens a table at the bottom of the screen that displays all the information available on each mark.
Image: National Geodetic SurveyImage: National Geodetic Survey
Filters
By State, County, and PID: This tool allows the user to filter the marks on the map down to specific states, counties, or PIDS. After selecting the filter option, click on the switch at the top right of the filter box and the map will pan and zoom to the selected area. If the marks do not appear on the map, try zooming in until they appear.
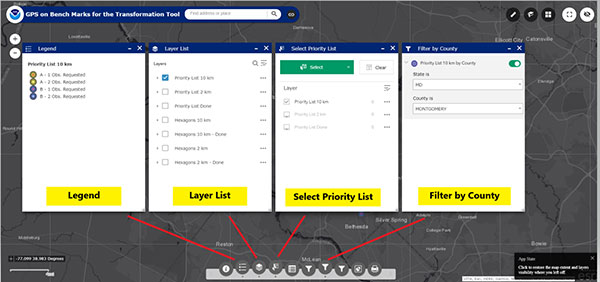
Figure 13 provides four different options of the icons on the bottom of the web map. They include the “Legend,” Layer List,” Select Priority List,” and Filter by State. These options help the user focus on a particular area of interest. I would encourage the user to familiar themselves with each of these options because they help will make it easier to navigate the map and identify priority stations.
Figure 13: Example of Several Options on the Legend on GPS on Bench Marks Web Map Application Site. Examples below are for the “Legend,” Layer List,” Select Priority List,” and Filter by County.” (Photo: National Geodetic Survey)
Another important icon located at the bottom of the Web Map opens an attribute table of the bench marks. (See Figure 14). Once you open the Attribute table tool (see the red arrow in the box), a table of attributes of the stations appears at the bottom of the screen. If you click on a station in the table, the station gets highlighted on the map (see the blue arrow in the box). NGS’ Web Map Application makes it very easy to locate potential stations in a user’s area of interest.
Figure 14: Example of the Attribute Table on the Legend on GPS on Bench Marks Web Map Application Site (Photo: National Geodetic Survey)
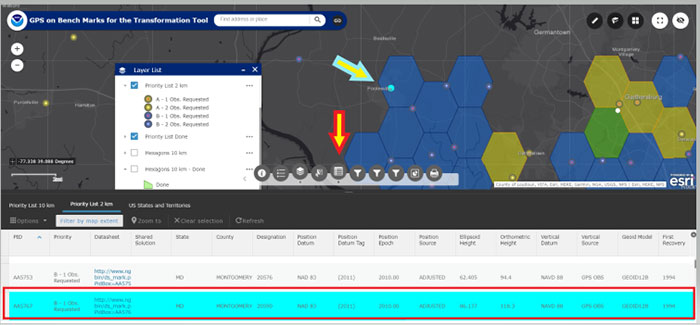
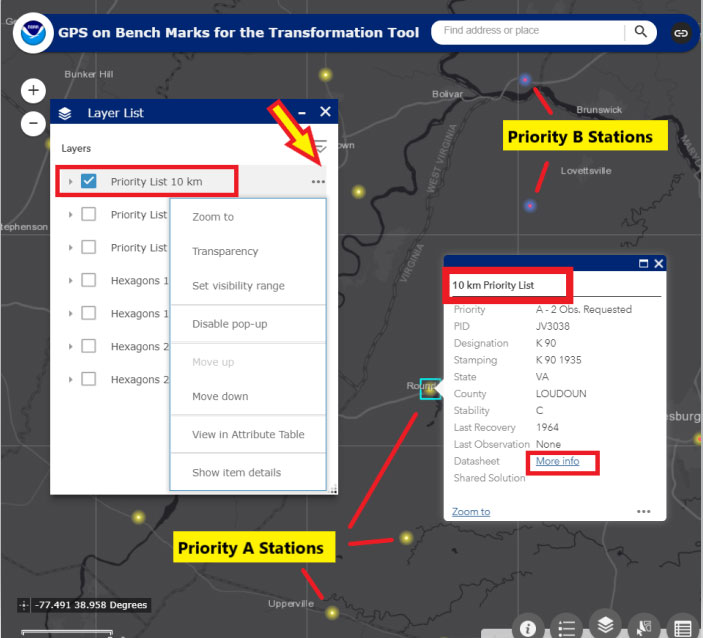
When the user clicks on the Layer List tool, they can select which priority list they would like to see plotted on the map. They can click on the “More Info” button to obtain the latest NGS Datasheet. Figure 15 provides an example of A and B stations from the 10 km priority list in the Loudoun County, Virginia, region. The map highlights priority A and B stations; the user can than find more information about a specific station by clicking on the map.
Figure 15: Excerpt from GPS on Bench Marks Web Map Layer List – Priority List 10 km (Photo: National Geodetic Survey)
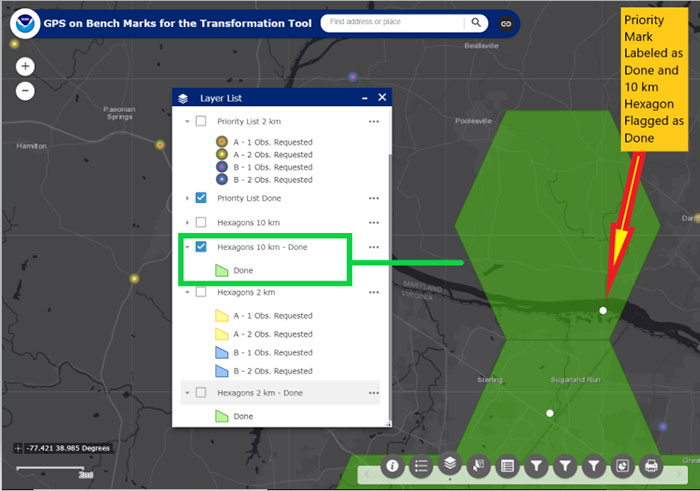
A very interesting feature is that once a station is classified as done in a 10 km hexagon, the hexagon is colored green and flagged as done. There is no longer a requirement to occupy a station in that hexagon to assist the 2022 transformation tool for the National level of accuracy. See Figure 16 to see a 10-km hexagon labeled as “Done.” Note that the station considered “Done” is labeled with a white circle.
Figure 16: An Example of a 10-km Hexagon in the Montgomery County, Maryland, and Loudoun County, Virginia, Region (Photo: National Geodetic Survey)
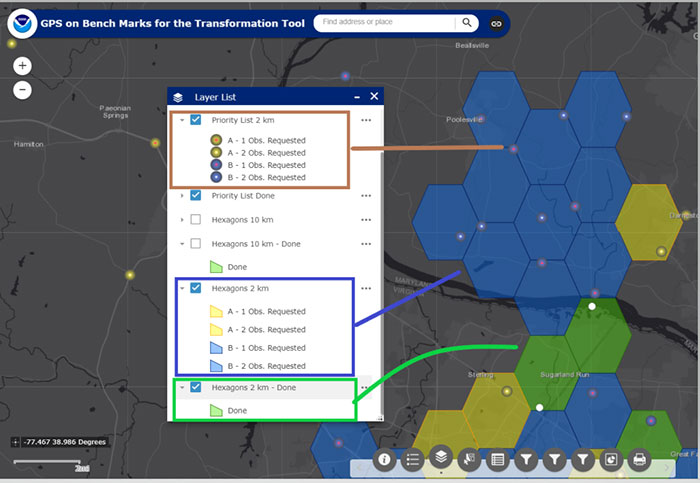
Now the user can focus on the 2-km hexagon boxes to identify stations to improve the local accuracy of the 2022 transformation tool in their area of interest. Figure 17 provides an example of the 2-km hexagons with priority marks plotted within each 2-km hexagon. Once again, the symbology indicates A and B stations, and the 2-km hexagons that need more observations and the hexagons that are labeled as “Done.”
Figure 17: An Example of 2-km Hexagons in the Montgomery County, Maryland, and Loudoun County, Virginia, Region (Photo: National Geodetic Survey)
NGS’ goal is to update the Interactive Web Map in “Near Real Time.” Of course, there’s always going to be some lag time from the time the user uploads their data into the OPUS Shared solution database to when the NGS 2022 Transformation Team reviews the data to ensure the results meet NGS’ criteria. Once again, NGS wants to minimize the amount of duplicate work performed by surveyors and maximize the number of stations contributing to the development of the 2022 transformation tool.
This newsletter highlighted the next phase of NGS’ GPS on Bench Marks program; that is, the development of the 2022 transformation model. The newsletter provided examples to explain the symbology and use of the new version of the GPS on Bench Marks program. It provided web links to material explaining the new GPS on Bench Marks program such as NGS’ July 2019 webinar on the latest GPS on Bench Marks program for developing the 2022 Transformation tool. NGS has done a tremendous job of explaining the importance, process, and results of the GPS on Bench Marks Program. Several of my previous newsletters have highlighted the NGS GPS on Bench Marks program and how users have supported the development of the hybrid Geoid18 model: Hopefully, this support will continue to develop the best possible 2022 Transformation Tool.
Ensuring the freedom to continue innovating is vital to our global economy, job creation and ultimately to empowering the next generation of GPS-enabled applications.
GPS — it’s a household name and has come to benefit so many aspects of our day-to-day lives. Today across the globe, it is estimated that there are more than 3 billion GPS receivers in the marketplace. Included in this total are GPS receivers found in mobile phones, automobiles, airplanes, tractors, boats and high-precision surveying equipment, to name just a few examples. In the past decade alone, GPS applications like these have helped generate more than $1.2 trillion for the U.S. economy and millions of jobs.
So how did GPS become so ubiquitous? Thanks to the leadership of the United States Air Force, which maintains and operates the GPS constellation, and long-standing U.S. policy, which makes GPS available as a vital public resource, any private sector company can design and build a receiver capable of listening for these GPS signals, without seeking the government’s approval or paying user fees. This freedom to innovate is at the heart of why GPS has been so successful and continues to drive innovation across our economy.
With the freedom to innovate, GPS receiver manufacturers have developed a range of advanced technologies to address market needs from the simple to the highly complex. These technologies reflect the inherent functional and technical differences between radio communications services and a navigation service like GPS.
Huge range of technologies. GPS receiver innovations enable a receiver to listen for a GPS signal that is less than a millionth of a billionth of a watt, while simultaneously resisting interference that is 10,000 times greater. Whether the GPS receiver is found in a tiny smartwatch or a 20-ton tractor, what they have in common is the ability to convert a faint radio signal into what we most commonly recognize as our current location displayed as a blue dot. They do this remarkably well.
Today’s regulatory landscape also correctly recognizes that every GPS-enabled application has unique requirements driven by intended function, environment and design factors. For example, a GPS receiver used for synchronizing financial transactions has different demands from a GPS receiver found in an autonomous vehicle. The former focuses on timing while the latter needs precise positioning to help maintain lane-level guidance.
Similarly, high-precision surveying equipment capable of delivering centimeter-level accuracy will no doubt have different receiver and antenna requirements than those found in a typical smartphone. The freedom to innovate enables GPS receiver manufacturers to support this market differentiation.
GPS resiliency. With many of our nation’s key critical infrastructure sectors dependent on GPS, there has been increasing discussion in Washington about the resiliency of GPS. Some have specifically expressed concern that a GPS jamming or spoofing attack could disrupt these key services and have advocated for new requirements on GPS receivers.
To be clear, GPS jammers and spoofers are illegal devices, designed specifically to interfere with GPS signals, either blocking the signal outright or emitting a fake signal in order to falsify one’s location. In either scenario, this interference occurs within a localized area from a detectable source. So, the reality is that mandates won’t stop a malicious actor intent on illegally interfering with GPS or another wireless technology, but vigorous enforcement of U.S. federal law can.
It is also important to remember that the GPS satellites are a multi-use U.S. military-civilian asset, supporting the mission of our armed forces, and have therefore been built with the highest levels of security and redundancy. Any attempts to attack the GPS constellation risks impacting not just civil services but the military signal as well.
Mission-critical applications. When it comes to resiliency, open innovation enables GPS receiver manufacturers to work with mission-critical application providers to develop products designed to meet their specific requirements. Different categories of users can and should define and specify performance and resiliency requirements appropriate for their applications.
For example, the requirements for a military GPS receiver are much more demanding than those for the receiver in an IoT device that reports its position hourly or daily. A military GPS receiver will, therefore, be significantly more expensive than an IoT receiver. Conversely, those who deploy internet of things (IoT) receivers will require low price points to support ubiquitous applications.
GPS manufacturers and applications developers have responded to market requirements by providing new and innovative techniques for increasing resilience, including designing receivers capable of receiving signals from multiple GNSS systems. This is the best way to ensure resilience — via application-specific requirements that are driven by customers who are most knowledgeable about their needs, not by general regulations or government fiat.
Preserving signal access. At the same time, the government does have a responsibility to investigate and take the necessary enforcement action to preserve unhindered reception of GPS signals. Vigorous enforcement of federal law by the Federal Communications Commission (FCC) and other government agencies — which already prohibits the manufacture, importation, marketing, sale and operation of GPS jammers — can keep these illegal devices out of the hands of those seeking to disrupt GPS operations. Such enforcement is critical to protecting our military operations, aviation and other safety-of-life applications.
Over the past three decades, worldwide adoption of robust, innovative GPS receivers attests to the trust users have placed in GPS as the gold standard for availability, accuracy, reliability and resiliency. Ensuring the freedom to continue innovating is vital to our global economy, job creation and ultimately to empowering the next generation of GPS-enabled applications.
About the GPS Innovation Alliance
The GPS Innovation Alliance was founded by Deere & Company, Garmin International Inc. and Trimble Inc. The Alliance recognizes the ever-increasing importance of GPS and other GNSS technologies to the global economy and infrastructure and is firmly committed to furthering GPS innovation, creativity and entrepreneurship. The GPS Innovation Alliance seeks to protect, promote and enhance the use of GPS. For more information, visit www.gpsalliance.org or follow @GPS4Life.
J. David Grossman serves as executive director of the GPS Innovation Alliance (GPSIA), an organization dedicated to protecting, promoting and enhancing the use of GPS. Prior to joining GPSIA, Grossman spent nearly a decade in public service, including as chief of staff to FCC Commissioner Mignon Clyburn; legislative director and senior advisor for technology policy to Rep. Anna Eshoo of Silicon Valley; and as technology counsel to the U.S. House Small Business Committee under the leadership of Rep. Nydia Velázquez.
Grossman holds a Master’s Degree in Public Policy from George Mason University and a B.A. in Political Communication from George Washington University’s School of Media and Public Affairs.
I was inspired by the 50th anniversary of the Moon landing on July 16 and our focus on mapping this month to look into imagery of the Moon.
Only recently have we learned that the lunar orbiters that photographed the Moon in the 1960s sent back images that were stunningly high resolution (HR), even by today’s standards. The actual resolution was presumably kept secret because the imaging technology was also used in our Cold War spy satellites.
Under the Lunar Orbiter Program, satellites took photographs of the Moon’s surface to identify suitable landing sites for the Apollo Program. Managed by the Langley Research Center, five Lunar Orbiters were successfully flown in 1966 and 1967, mapping 99% of the Moon’s surface with a resolution of 60 meters or better.
The first three missions were dedicated to imaging 20 potential landing sites, and were flown at low-inclination orbits.
The fourth and fifth missions were devoted to broader scientific objectives and were flown in high-altitude polar orbits. Lunar Orbiter 4 photographed the entire nearside and 95% of the farside, and Lunar Orbiter 5 completed the farside coverage and acquired medium (20-meter) and high (2-meter) resolution images of 36 pre-selected areas.
In that pre-digital era, the Lunar Orbiters had an ingenious imaging system, which consisted of a dual-lens camera, a film processing unit, a readout scanner and film-handling apparatus. Both lenses, a 610-mm narrow angle HR lens and an 80-mm wide-angle medium resolution (MR) lens, placed their frame exposures on a single roll of 70-mm film.
The axes of the two cameras were coincident so the area imaged in the HR frames were centered within the MR frame areas.
The film was moved during exposure to compensate for spacecraft velocity, which was estimated by an electric-optical sensor. The film was then processed, scanned, and the images transmitted back to Earth. Based on these images, the NASA Apollo Site Selection Board would name five candidate landing sites in February 1968.
Galileo’s Control Centre in Fucino is used to oversee the satellites’ navigation payloads and services. (Photo: ESA)
Global markets learned something important from the brown-out of Galileo signals over a week’s time in July: Life goes on without a hiccup in the absence of the European GNSS.
Very unfortunately for the backers and boosters of Galileo, this message will reverberate down through the years. If vital affairs proceed unaffected by Galileo’s travails, or triumphs for that matter, who needs it? The response, a shrug. I’m tempted to say a Gallic shrug, were it not that the Gauls, the French, are prime among the system’s boosters and backers.
I’m among that number as well. Galileo and I have known each other all our lives, all our professional lives. When I started on this magazine 19 years ago, the first story I edited was on Galileo’s public-private partnership.
Galileo then was just a collective gleam in several politicians’ and scientists’ eyes. Look how far it has come: 20 satellites flying in various operational or testing states.
The European GNSS Agency was very careful to point out during the crisis that Galileo is in its initial services phase. Its signals are available for use in combination with other GNSS and are not intended to provide a complete solution by themselves. This status is expressly designed to allow for “the detection of technical issues before the system becomes fully operational.”
So, it doesn’t count. Because, the game hasn’t really started yet. Right?
Not quite.
Because this episode occurred, it will be remembered. Because it lasted so long, it will be factored. Because the official announcements about it were so obscurantist, the system may find it more difficult to regain trust.
Of course a full, careful, in-depth investigation must take place before officially announcing what caused the debacle. But more than was said could surely have been said, during the crisis. A full week now, as of this writing, after the week-long outage concluded, we still have no indication as to which piece of ground equipment or software failed and why there wasn’t a smooth transition from the Italian to the German control station.
Redundancy was built into the system to preclude exactly such failures as this. Why didn’t redundancy work?
Transparency is a rhyming word that goes well with redundancy.
Trust — corporate confidence — is fundamental to installation in multi-GNSS chips, boards, modules, all manner of devices. Four systems compete for spots at a table that may comfortably fit only three. Even three could be a stretch.
GLONASS suffered a much shorter (11-hour) timing glitch in 2014, and has yet to climb back into the public-confidence ring.
Here’s a very public lesson in transparency: When the GPS satellite SVN49 failed rather spectacularly in 2009, the GPS Directorate was very forthcoming, almost embarrassingly so, about what happened and why. GPS never lost a step in the public’s and the industry’s eyes.
This just in: a Final Report on the Economic Benefits of GPS. Sponsored by National Institute of Standards and Technology, the study began a couple of years ago, conducted by RTI International, one of the nation’s oldest and largest research firms.
The report runs 306 pages and examines the benefits derived from GPS by 10 U.S. industries: agriculture, electricity, finance, location-based services, mining, maritime, oil and gas, surveying, telecommunications and telematics.
Among other issues, the research explored the potential effect of a 30-day GPS outage, assuming that other GNSS would be disrupted as well, and found the outage would have a $1 billion per-day impact. The 30-day outage scenario was specifically added at the request of the National Executive Committee for Space-Based Positioning, Navigation and Timing.
While a disruption lasting 30 days seems unlikely, as the report says, “understanding the relative magnitude of potential impacts is important for making informed decisions about investments in back-up systems and contingency plans.”
Relating a sense of the full report is beyond the scope of this small space, but I encourage all readers to download it (link at ) and examine it either in its entirety, or in its applicability to your particular industrial sector. Here
I’ll focus briefly on GPS’s precise timing capability, which supports telecommunications.
Precise timing enables service providers to more efficiently use available spectrum and deliver high-speed wireless services. Given American society’s intensive use of these two lifelines, it is not surprising that benefits related to telecommunications are substantial: $685 billion, more than twice that of the second-ranked industry in terms of economic benefits, and more than half of the total benefits.
GPS reduces/eliminates dropped calls and increases bandwidth, enabling more advanced networks such as 4G LTE, which we now have, and 5G, which is coming at breakneck speed.
Wireless network infrastructure has evolved to rely heavily on GPS. In fact, GPS has shaped the telecommunications industry: its technology has evolved around GPS. See last month’s cover story for more details.
Interestingly, to calculate the economic benefits of GPS in the telecom sector, the researchers used two indices as a baseboard: radio spectrum auction data showing telecom service providers’ willingness to pay (WTP) for spectrum to provide 4G LTE, and consumers’ WTP for the broadband speeds enabled by 4G LTE. Both these numbers are going up, up, up.
While the number of wireless subscribers in the United States increased at a respectable rate from 2009 to 2017 — about 35% — the average bandwidth used by those subscribers expanded at an astonishing 2,200%!
Experts interviewed on the prospect of an extended GPS outage agreed that, eventually, a user would have to remain stationary to maintain a wireless connection, albeit a degraded one. After some time of steady degradation of quality of service, wireless service would cease to function altogether.
It’s hard to imagine which would be worse: a world without mobile telecoms, or one without GPS. However, we don’t have to strain, because in this case we would lose both.
To avoid the unimaginable…plan, plan, plan, and backup, backup, backup.
With tariffs, trade wars and sanctions ruling the day, how is a self-respecting UAS manufacturer supposed to make a buck? And to whom are the manufacturers of defense UAS able to sell their wares?
To NATO and other friendly countries, comes the ready answer, but there may still be a problem selling drones with armaments and offensive capabilities. Another layer of governmental review could swing into action when a company wants to sell to friendly countries like Saudi Arabia or perhaps to allies within the old Russian USSR block.
Last year, General Atomics lost sales to Saudi Arabia and the United Arab Emirates (UAE) for Predators and/or Reapers, large-bodied medium-altitude, long-endurance unmanned aircraft systems (or MALES). The deal went instead to a competing Chinese outfit. General Atomics complained bitterly about the loss of this business, which it blamed on restrictive U.S. export rules. The Administration responded by apparently loosening the regulations, in fact easing the way for most international sales. In response, it is possible that UAV manufacturers have also undertaken some changes which make U.S. drones even more competitive for export.
Business matters appear to have improved significantly. In May this year, the State Department actually used emergency provisions within the Arms Control Act to bypass Congressional review of a proposed sale to Saudi Arabia, UAE and Jordan of a package of Insitu Blackjack drones and launchers, worth $80 million.
The competition for world-wide sales of U.S. UAS products is increasingly tough, especially against Chinese suppliers with equivalent or perhaps less capable mil-spec drones. Hence the export rule changes which now appear to be working in the right direction.
Chinese Drones in the U.S.
Meanwhile, in an effort to accommodate U.S. concerns about the potential for user data somehow “leaking” to DJI — the Chinese supplier of almost 75% of U.S. drone purchases — DJI has implemented a “Government Edition” which apparently addresses the risk of data loss.
When US-based 3D Robotics stopped supplying 3DR Solo drones, the Interior Department found itself in a bind, as it had already bought hundreds of these devices for its inspection/surveillance operations. As the department searched for a new source for UAVs, it came to the conclusion that U.S. supplied drones were much less capable or up to ten times more expensive than equivalent DJI units. So they began working with DJI to solve the issue with potential data loss, and went on to test the results extensively
Working with the U.S. Interior Department for over 18 months, DJI has equipped drones and their controllers with modified hardware and custom software that ensure that the drones only operate in local data mode: information collected in flight is stored on the UAV alone and must be manually downloaded after flight. The drone is actually loaded with custom software by the user prior to flight to ensure this mode of data collection.
Even with these modifications, for now the use of DJI drones is still restricted to non-sensitive applications.
USAF/Kratos XQ-58A
The XQ-58A Valkyrie demonstrator, a long-range, high subsonic UAV completed its inaugural flight March 5, 2019, at Yuma Proving Grounds, Arizona. (Photo: U.S. Defense Department)
Kratos is working with the U.S. Air Force to develop a jet-powered UAV system that can fly alongside manned fighter aircraft to multiply their effectiveness. At much lower cost than manned aircraft, the concept appears to be that more risk can be taken with the ‘loyal wingman’ UAVs to not only support the mission of the attack aircraft, but to also keep it safe.
We reported earlier on the XQ-58A after its first flight in March of this year. Now the Valkyrie is back in the flight test program with its second flight lasting 71 minutes over the Yuma test range on June 11. In the long- erm, it is hoped that both ground controllers and flight crew would operate these extensively autonomous drones.
A parallel “Skyborg” program is also underway to develop the hardware and artificial intelligence software capability to enable this type of drone to fly and fight alongside manned aircraft.
In conclusion, trade wars and tariffs aside, let’s hope that good UAV products can still make headway on their merits alone.
What is the biggest safety challenge for autonomous vehicles?
John Fisher. (Photo: Orolia)
“Sharing the road with human drivers. Optimized safe driving algorithms are compromised to mesh with the human’s natural level of risk taking. But this reduces safety, delaying acceptance — a real conundrum. Now, if we could just eliminate the humans…” John Fischer
Orolia
Julian Thomas
“When AI systems can deal with 99.9% of situations, the challenge will be keeping the passenger engaged to take over quickly when the 0.1% happens. Imagine a truck in front with a load coming loose. Which one would you trust?” Julian Thomas
Racelogic
Members of the EAB
Tony Agresta Nearmap
Miguel Amor Hexagon Positioning Intelligence
Thibault Bonnevie SBG Systems
Alison Brown NAVSYS Corporation
Ismael Colomina GeoNumerics
Clem Driscoll C.J. Driscoll & Associates
John Fischer Orolia
Ellen Hall Spirent Federal Systems
Jules McNeff Overlook Systems Technologies, Inc.
Terry Moore University of Nottingham
Bradford W. Parkinson Stanford Center for Position, Navigation and Time
Our cover story this issue is all about autonomous vehicles. Retirees — not usually considered early adopters of technology — are trusting autonomous vehicles to ferry them from point to point using the technology our industry can offer.
We have also used a lot of magazine space to discuss unmanned aerial vehicles, or drones, and shown how they are taking on a lot of tasks formerly done by manned pilots or workers, such as aerial mapping or factory inspections.
So is the idea of an autonomous plane such a stretch?
At June’s Paris Air Show, Christian Scherer, chief commercial officer for Airbus, told the Associated Press that his company already has the technology to fly passenger planes without pilots.
Scherer also said in the AP interview that Airbus hopes to be selling hybrid or electric passenger jets by around 2035.
Airbus already has “the technology for autonomous flying.”
But having the tech is one thing. Winning over regulators and potential travelers is quite another.
“When can we introduce it in large commercial aircraft? That is a matter we are discussing with regulators and customers, but technology-wise, we don’t see a hurdle,” Scherer said.
In fact, in a new study, seven out of 10 people say they would be willing to travel in an unpiloted plane at some point in their lifetime. The survey was conducted by U.S. software firm Ansys, which is working to provide digital replicas of how planes and cars react in different situations.
Passengers would be more willing to embrace automation if firms could show that a computer would react in the best and quickest way if anything unexpected happens.
But are we there yet? Michael Wiggins, the chairman of the aeronautical science department at Embry-Riddle Aeronautical University in Florida, addressed the autonomous-flight adoption question for the New York Times.
“From what I see, could it happen in the distant future? I think it probably could. Will it happen in the near future? I don’t think so,” Wiggins said. “Right now, any progress toward that area should be done very slowly, very measured and only after a bunch of research with results that suggest we should do that.”
The surveying profession has come to a crossroads, and is divided amongst itself to boot. A gap exists within the profession, and yes it is a generation gap, based on how technology has evolved and how the different generations experience it differently. In this column I explore the histories both of the generations and the technology to reach conclusions on how best to move forward — together.
Surveyors now have more tools than ever before available to them to perform their tasks. But surveyors of different ages regard these tools differently. Not to put too fine a point on it, the younger porfessionals among us feel their creativity and desire to further the profession is being stifled by the group who is supposed to be leading and mentoring them.
Why is this crucial to consider? Because these are the future users, purchasers and adopters of geospatial equipment and software, and the future setters of industry standards. All involved, from manufacturers to distributors to surveyors themselves, would do well to think deeply upon this.
As we enter the final stretch of the 21st century’s second decade, many things have changed since the Y2K scare and the proliferation of the Interweb. From deregulation of the surveying profession to changing coordinate systems and datums, the surveying profession faces many challenges in 2019. One of the biggest challenges we face has nothing — yet everything — to do with technology.
Talented people are necessary to grow our profession. We are falling well short of having enough to keep up with demand. Sounds like a simple problem; just hire more surveyors and technicians. This sounds easy, but several roadblocks confront us.
A select few still invest in their surveying future by going to college to get a degree and eventually become a licensed surveyor. These individuals find, however, that the road to success has lots of potholes along the way, just as their elder predecessors did.
Recently, I participated in a group discussion with the National Society of Professional Surveyors (NSPS) Young Surveyors Network to discuss surveying, technology and the young surveyor’s role in promoting future career opportunities. This discussion was part of Network’s series of meetings and seminars held in parallel with the main NSPS Spring Business Meetings.
It was great to see the higher proportion of women in the young surveyor group than in the typical professional society meeting. Their feedback was consistent with that of the young men in the group. All together, their perspectives led me to write this article.
While I think of myself as still “young-ish” (in my early 50s), being the oldest participant in that group was intimidating, to say the least. These young technicians and surveyors are driven and focused, yet they seek the same feedback and mentoring that I desired when I was their age.
In the weeks after that meeting, some of the items discussed continued to resonate with me and forced me to reflect on my own experiences and career path. To be fair to them and truly understand their views on today’s surveying profession, I needed to look beyond the profession, policies and procedures to which I hold fast in my ethical approach to the craft. These younger generations have been exposed to a completely different world than the one I remember fondly, and the world they grew up in has subjected them to challenges to which I cannot relate. To help explain the conundrum of trying to find a way to relate, we need to take a step back and look at not just generational values but how the many industrial revolutions have affected us as well.
TALKING ‘BOUT MY GENERATION
The first part of my research to help me find a way to step into the shoes of these young surveyors was to look at past generations and how they relate to each other. Going back to the turn of the 19th century, we get the following breakdown:
Traditionalists or Silent Generation: Born before 1945
This timeframe contains sub-groups including the “lost generation of 1914,” the “interbellum” and the “greatest generation.” Alaska and Hawaii were not included in the United States during this period. Most of the country west of the Colonial states was subject to the government Public Land Survey System started in the early 1800s. The Great Depression took its toll on much of the population, and previously rapid expansion slowed to a standstill.
Baby Boomers: Born 1946 – 1964
World War II changed the world. Soldiers returning from military duty to start or resume families accelerated population growth and a departure from traditional social attitudes. Two-income families emerged, and prosperity ruled for many years. Surveyors, teaming with civil engineers, helped fuel an unprecedented explosion of real estate expansion through planned developments across the country.
Generation X: Born 1965 – 1976
The children of the fast and free-living Baby Boomers grew up to become the Gen Xers. They were the first “latchkey” kids, more likely to be raised by divorced or remarried parents. As young adults, in their effort to enhance their lifestyle more than their parents, they did many things to the extreme with no consideration of cost. This led to massive real estate developments, “McMansions” and increased debt. Surveying continued to flourish but most growth was enjoyed by engineering firms who absorbed surveyors to expand their services.
Millennials or Gen Y: Born 1977 – 1995
This group is often labeled as the “Peter Pan” generation for its predisposition to put off typical adulthood norms like marriage, having children and buying real estate. They have a propensity to be more mobile and nomadic, as they take advantage of technology and rapidly changing environmental factors. With this generation we find the slowdown in career choices towards surveying, even though technology and spatial data acquisition have exploded with potential.
Gen Z, iGen, or Centennials: Born 1996 – Current
This generation was born into technology, and it affects everything they do. From infancy they were experienced soothing music, dancing screens, interactive toys, and dolls teaching them new skills. This generation doesn’t know of a world without computers, cellphones, GPS-based maps or high-speed internet. Surveying has also benefitted from the technology explosion but it hasn’t captured the imagination of this generation sufficiently to develop future practitioners.
YOU SAY YOU WANT A REVOLUTION. WELL, YOU KNOW…
The generational differences only tell part of the story. Each one faced its own challenges when it came to technology (or lack thereof), societal standards, and other facets of their respective eras. A succession of several Industrial Revolutions brought new tools for completing a wide array of tasks and procedures. Here is a summary of each of them in chronological order:
First Industrial Revolution (1784)
Mechanical production via water and steam power led the way during the late 1700s and began a trend of radical changes in the ability to create larger items. The Gunter chain and surveyor’s compass, both invented in the 1600s, were the mainstay of measuring tools during this time period.
Second Industrial Revolution (1870)
Mass production and increases in labor opportunities coupled with the adaptation of electricity in many areas enabled people to flourish like no other time to date. The optical theodolite with horizontal angle measurement was introduced and then mass produced in the late 1800s to help surveyors make more progress westward.
Third Industrial Revolution (1969)
A significant leap forward in technology occurred with the invention of the microprocessor in the late 1950s, followed quickly by rapid development of electronic machines designed to follow manual instructions. Programmable controllers and devices were born from the fast-paced development of sophisticated miniaturized circuitry. These developments were used to create measurement devices for sending infrared and visible light waves across long distances. In the late 1970s, technological advancements led to the development of electronic theodolites or total stations. These instruments were the first to be able to electronically determine the horizontal and vertical angles normally read manually by the operator, and to combine this data with electronic distance measurement. Further development created methods of storing this data electronically for input into computer calculation and drafting programs.
Fourth Industrial Revolution (Current)
Industry experts differ as to when the Fourth Revolution began, but all agree we have turned the corner and are now fully entrenched into a new realm. Further miniaturization of computer chips, advanced sensors and storage, and robotic mechanisms have introduced a new reality for everyone, including the surveyor. Today’s practitioner has many sophisticated tools available for work, including GNSS receivers, laser or LiDAR scanners, UAVs with a multitude of sensors, hydrographic vehicles with single and multi-beam fathometers, and many more instruments currently under development.
Surveyors now have more tools than ever available to perform their tasks. Now we must cross-reference these revolutions with the practitioners from the various generations to help us understand upon which road the profession is headed.
TECHNOLOGY MEETS GENERATIONAL DIFFERENCES; WHAT COULD GO WRONG?
One thing that stood out in my aforementioned discussion with the young surveyors’ group was how much they were embracing technology not just in their every day lives and communication, but how they understood the enhanced abilities of the latest tech and instruments for surveying. They see the value in large data, point clouds and BIM (building information modeling) needed for industry use.
The general consensus from this group was that my generation (Gen X) and earlier (Baby Boomers) are easily dismissive of their enthusiasm for incorporating these new technologies into our workflow simply as ways to shortcut old methods done by more labor-intensive means. While I initially tried, myself, to dismiss this suggestion, further research has only proven their point: their creativity and desire to further the profession is indeed being stifled by the group that should be leading and mentoring them.
Cross-correlating the generations with their various personalities and quirks with the amalgamations of industrial revolutions turns up some interesting results. Gen Xers and earlier surveyors were strictly taught by their managers and mentors that both historical data and original monuments are sacred and not to be denied. This information was derived from the most basic of survey instruments and measuring equipment, with accuracy that is not acceptable by today’s standards.
But the tradition remained: if it was good enough for our forefathers to establish the early frontier, then more accurate measuring devices are simply overkill. New sophisticated robotic total stations, GNSS receivers and robust data collectors available as a result of the Third Industrial Revolution are shiny objects that stand in the way of “good surveying,” in the opinion of the elder surveyors.
Millennial surveyors, meanwhile, look at the world with a different vision and much different solutions. Most of them were not exposed to televisions with just three channels, telephones mounted on walls, or kitchens without microwave ovens, to just to name a few “antiquities.” Their families have always owned a computer and the library is a place where you go to study. Research isn’t looking in an encyclopedia; you Google. They embracw cellphones with a multitude of apps and functions, including location services within a few feet, practically as extensions of themselves.
The equipment produced for surveyors today is well within their wheelhouse as it maps a multitude of points and features in a blink of an eye. Accuracy and detail are no longer an issue — but adapting that data to legacy deeds and maps is where us old timers can help bridge the gap.
Another problem that has proven to be a yawning void between the generations is the remnants of the economic slowdown of 2007-2012. Many Baby Boomer and Gen X surveyors learned to do more with less. Times were tough and we couldn’t afford to upgrade to the latest versions of total stations, GNSS, software, or invest in new technologies like laser scanning. There was also an exodus of technicians simply because there was no work in surveying for the time period, and they found employment in other professions. That left a void in who was doing the work (now being completed by upper level surveyors with older skill sets), and having no younger personnel to train and groom for future career growth.
There were many technological advancements during that time frame but overall the industry suffered because of the economic downturn. The Millennials, most of whom were too young to be employed during this period, now are faced with working for an older profession that couldn’t afford to stay current with technology and who have trouble relating to the motivations of the younger generation.
CAN’T WE ALL JUST GET ALONG?
I believe the surveying profession is at a crossroads, one based upon the gap caused by the generation / technology combination described above. Steps must be taken to rectify this. Here are a few of the pathways to closing the gap and becoming a solid profession for the future:
Embrace the mentor/mentee relationship, but be open to reversing the roles. The younger generations have a handle on the latest technology, so us old timers need to be more willing to close our mouths and open our ears and minds.
Create more opportunities for younger surveyors to participate in organizations so they can also be influencers. Keep in mind that they don’t typically like to “belong” to an organization, so adapt our professional groups and keep their interests in mind.
Change the way we communicate. Many Baby Boomers / Gen X members are critical of the younger generations and social media, yet this trend shows no sign, at all, of stopping. Smartphones are here to stay, so let’s learn to adapt, to remain in step with the youngsters.
Be willing to invest in new and emerging technology. Who know where the next radical survey technique will come from if you don’t have an open mind and checkbook? Invest not only in equipment but your young staff’s future.
Encourage younger staff to get involved in something. Anything. Social interaction can lead to better communication skills and expose them to more business situations. Don’t push them in over their head,s but get them to be “uncomfortable” occasionally. They will thank you for it.
Many professions and occupations will suffer in the next 3–5 years because of attrition through retirement, incapacitation and death. These workforces will lose 20–40% of their workers. Those left will have to pick up the slack and then some. We need to either
A) hire a lot more surveyors, or
B) figure out how to make it work with less bodies.
The conversation that took place in that meeting room with the young surveyors has made a deep impression on me and has changed my focus on the future of surveying. How does this apply to an article in a geospatial publication? Simple: these are the future users, purchasers and adopters of geospatial equipment and software, and the setters of industry standards.
The younger generation understands how to use today’s technology, and the surveying profession overall needs to embrace that fact. The technology won’t mean a thing if we don’t have the bright minds to use it to its full potential.
So I ask you again to embrace, encourage and listen to the young surveyors; they will thank you for it.
RNT Foundation Directors and Congressmen. From left: RADM Jeff Hathaway, USCG (ret); Rep. John Garamendi (D-CA); Rep. Peter DeFazio (D-OR); Dana A. Goward, SES, CAPT, USCG (ret); and CAPT Pauline Cook, USCG (ret). (Photo: Resilient PNT Foundation)
“It’s absolutely vital for national security that we get a terrestrial based, hard backup system [for GPS],” said Congressman Peter DeFazio (D-OR), chairman of the House Transportation and Infrastructure Committee.
His remarks came at an event organized by the RNT Foundation to recognize DeFazio and Congressman John Garamendi (D-CA) for their support of the National Timing Resilience and Security Act of 2018. Representative Garamendi is chairman of the House Armed Services Readiness subcommittee.
Garamendi first introduced legislation in 2016 to address the nation’s need for a GPS backup system. After going through several iterations, it was signed into law in December. The Act requires the Department of Transportation to establish a terrestrial timing system by 2020. Also, that the new system be expandable to one that can be used for location and navigation.
Congress funded a GPS Backup Technology Demonstration through a Department of Defense appropriation in early 2018. The demonstration was intended to be a joint project of the Departments of Defense, Homeland Security and Transportation. A delay in transferring funds from Defense to the other two departments put the demonstration almost a year behind schedule. Now that the project is underway, Transportation Department representatives have said they want to transition directly from the demonstration to deciding upon and implementing the mandated timing system.
At the event, DeFazio remarked that as a boater and hiker he is an avid user of GPS. He mentioned that it is an “ incredible utility, but I also know of its vulnerability. It’s critical to national security and the meaningful movement of everything in the United States of America from airplanes to surface transportation and others … It’s absolutely vital for national security that we get a terrestrial based, hard backup system.” He also noted that Congressman Garamendi has been the driving force for this issue in the House of Representatives.
Speaking about his current role on the Armed Services committee, Garamendi said “The reality is that the military is not prepared for the loss of the GPS signal, and they are just now becoming aware after seven years of beating them over the head saying ‘guys, what are you going to do when you don’t have GPS?’” Garamendi noted that the military would be a big users of the domestic backup system.
He also regretted that after “… years of people saying ‘single point of failure’ for the American economy and system is the loss of GPS” the nation is not farther along to having a backup system.
The RNT Foundation presented the congressmen with plaques showing images of a GPS satellite and a terrestrial transmission tower, and 0ne of America’s “first GPS devices” — a 102-year-old copy of The American Practical Navigator by Nathaniel Bowditch.
What is the best way to protect data centers and mobile devices from spoofing and jamming?
Ellen Hall
“After speaking to our head of engineering, Roger Hart, he explained this as something akin to ‘What’s the best way to achieve world peace?’ As the strengths and vulnerabilities of static and mobile devices vary considerably, the best solution will be achieved through a tailored application of algorithms, antenna siting and design, multi-constellation, multi-frequency and non-GNSS inputs.” Ellen Hall
Spirent Federal Systems
Allison Brown
“Spoofing and jamming presents a very credible threat today to users of GPS for navigation and perhaps the greatest threat is vulnerability within our national infrastructure to spoofing of GPS timing. Congress, recognizing this threat, has tasked the Department of Transportation (DOT) in the National Timing Resilience and Security Act of 2017 to provide a backup for the timing component of the GPS. Specifically this backup is to ‘ensure the availability of uncorrupted and non-degraded timing signals for military and civilian users if GPS timing signals are corrupted or otherwise unavailable.’ Although the act directed the DOT that this system should be operational in two years (2019), little progress appears to have yet been made in deploying a backup timing system. This system not only would reduce vulnerability to spoofing for timing users, but could also be used by mobile users for detection of spoofing, allowing for national alerting when jamming or spoofing is detected. These alerts, tied with a quick response mechanism for law enforcement to take action, would provide an effective method for protecting all GPS users nationwide from jamming or spoofing.” Alison Brown
NAVSYS Corporation
Jean-Marie Sleewaegen
“Take full benefit of multi-frequency multi-constellation redundancy. Perform signal monitoring and authentication using advanced receiver architectures and signal-based protection (e.g., Galileo’s Open Service Navigation Message Authentication). Foresee non-GNSS redundancy to bridge gaps, such as precise clocks for data centers or IMUs for mobile devices.” Jean-Marie Sleewaegen Septentrio
Members of the EAB
Tony Agresta Nearmap
Miguel Amor Hexagon Positioning Intelligence
Thibault Bonnevie SBG Systems
Alison Brown NAVSYS Corporation
Ismael Colomina GeoNumerics
Clem Driscoll C.J. Driscoll & Associates
John Fischer Orolia
Ellen Hall Spirent Federal Systems
Jules McNeff Overlook Systems Technologies, Inc.
Terry Moore University of Nottingham
Bradford W. Parkinson Stanford Center for Position, Navigation and Time